1. Introduction
Afromontane forests around the world have both ecological and economic importance [
1]. Many of these forests have been changed or are undergoing change into human-managed production systems [
2,
3,
4,
5,
6]. Studies indicate the conservation value of modified forests across the world [
7,
8,
9,
10,
11,
12,
13,
14]. Even where pristine forest has been modified by human management, forests retain a role in the conservation of biodiversity [
7,
15,
16].
Depending on the magnitude and extent of human influence, forest ecosystem conditions differ across forest types [
13,
17,
18,
19]. Wiersum et al. [
15] has identified three types of forest with conservation importance in a “nature-culture continuum.” These are “natural forest”, which has retained its structure and composition as old growth, “secondary forest”, which has recovered after clearance and “agroforest”, which has been heavily altered under the influence of humans but still has remnants of the original natural forest. Unsurprisingly, the woody species composition and structure differ in these three forest types [
12,
13], though some managed forests appear to have similar vegetation structures to that found in natural forests [
20].
Agroforestry is a land use approach that integrates forests with agriculture for multifunctional landscapes [
7,
13,
15,
19]. Much tropical agroforest is modified natural forest [
15,
21,
22,
23]. The structure and composition of agroforests, depending on the intensity of management, lie in between the natural forest and monoculture plantation or between the natural forest and agricultural landscape [
15]. Well-managed agroforest mostly maintains a structure that resembles the natural forest [
3,
15,
21] and is usually described as analogous to natural forest [
15]. For example, the “rustic coffee agroforest” in Mexico has multiple natural forest-like layers structure and a diverse composition [
3].
Like other tropical forests, the structure of the Afromontane forest is characterised by emergent canopy trees with middle layers and understory intertwined with lianas [
24]. Structurally, the Afromontane forest consists of multiple layers, although the boundaries are arbitrary and there is disagreement about the exact numbers [
25,
26,
27].
Regeneration of woody species is a central element of plant recruitment in the forests. Therefore, sustainable forest management can be achieved through successful regeneration [
28]. The number of seedlings, saplings and mature trees are an indicator of forest conditions [
29] and indicate the regeneration status of woody species [
25]. In an undisturbed forest, the number of seedlings are greater than the number of saplings, and the number of saplings are greater than the number of mature trees [
29], showing an inverted J-shape when plotted on a graph [
25]. Inverted J-Shape profiles indicate a good regeneration status within a forest [
24,
25]. There must be a sufficient number of regenerations for the sustainable use of woody species [
30].
For the last three to four decades, coffee production activities have progressively modified the natural forest in southwest Ethiopia [
24,
31]. Most of the remnant forests are partly or fully associated with coffee production systems [
24,
25]. Coffee management intensity has divided the forest into three management regimes: natural forest, coffee forest and coffee agroforest [
20,
25,
31]. The term “natural forest” literally refers to an area where there is little or no forest disturbance [
32], whereas “coffee forest” implies a forest area where wild coffee and other forest products are collected with medium disturbance [
25]. The term “coffee agroforest” implies a forest under coffee production with high disturbance intensity [
3,
23,
26,
33,
34]. For the purpose of this study, these three types of forest management intensities will be recognized throughout, with natural forest referring to little or no forest disturbance for coffee, coffee forest where the disturbance is of medium management intensity, and coffee agroforest, which has highest disturbance levels.
Knowledge about forest structure, composition and plant recruitment are important to assess forest conditions [
35]. Only a few studies have been undertaken to investigate the effect of coffee management intensification on forest composition and structure. Ref. [
36] showed less regeneration of canopy tree species in the coffee agroforest in southwest Ethiopia. According to [
25], coffee management intensification reduced the number of woody species by half, compared to natural forest. Nevertheless, [
24] have reported eighteen woody species recorded in coffee agroforests that are not found in fragmented natural forests. Ref. [
5] reported less deforestation, although degradation takes place with coffee production, more so in the coffee areas than non-coffee areas in southwest Ethiopia.
Woody species can be categorised by their growth pattern into three groups: forest species, pioneer and generalist species [
16,
19,
36,
37]. Forest species usually favour the shade under canopy tree species, whereas pioneer species take advantage of large gaps created by disturbance [
36,
37]. Generalist species persist and regenerate both under minimum and high disturbance intensity [
19]. Forest modification tends to favour more pioneer species than forest species [
25,
36].
Due to the strong and worldwide interest in coffee, the future of Afromontane forests is highly influenced by coffee management; as a result, there is a need for a more in depth understanding of the dynamics of forests under different pressures from coffee production. In our research, we tested the hypothesis that forest modification from natural forest to coffee agroforest changes woody species composition, forest structure and regeneration in southwest Ethiopia. Therefore, the objectives of the study were: (1) to assess and examine woody species composition, (2) to compare forest stand structure and (3) to assess and examine the regeneration status of woody species in natural forests, coffee forests and coffee agroforests.
2. Methods
2.1. Description of Study Sites
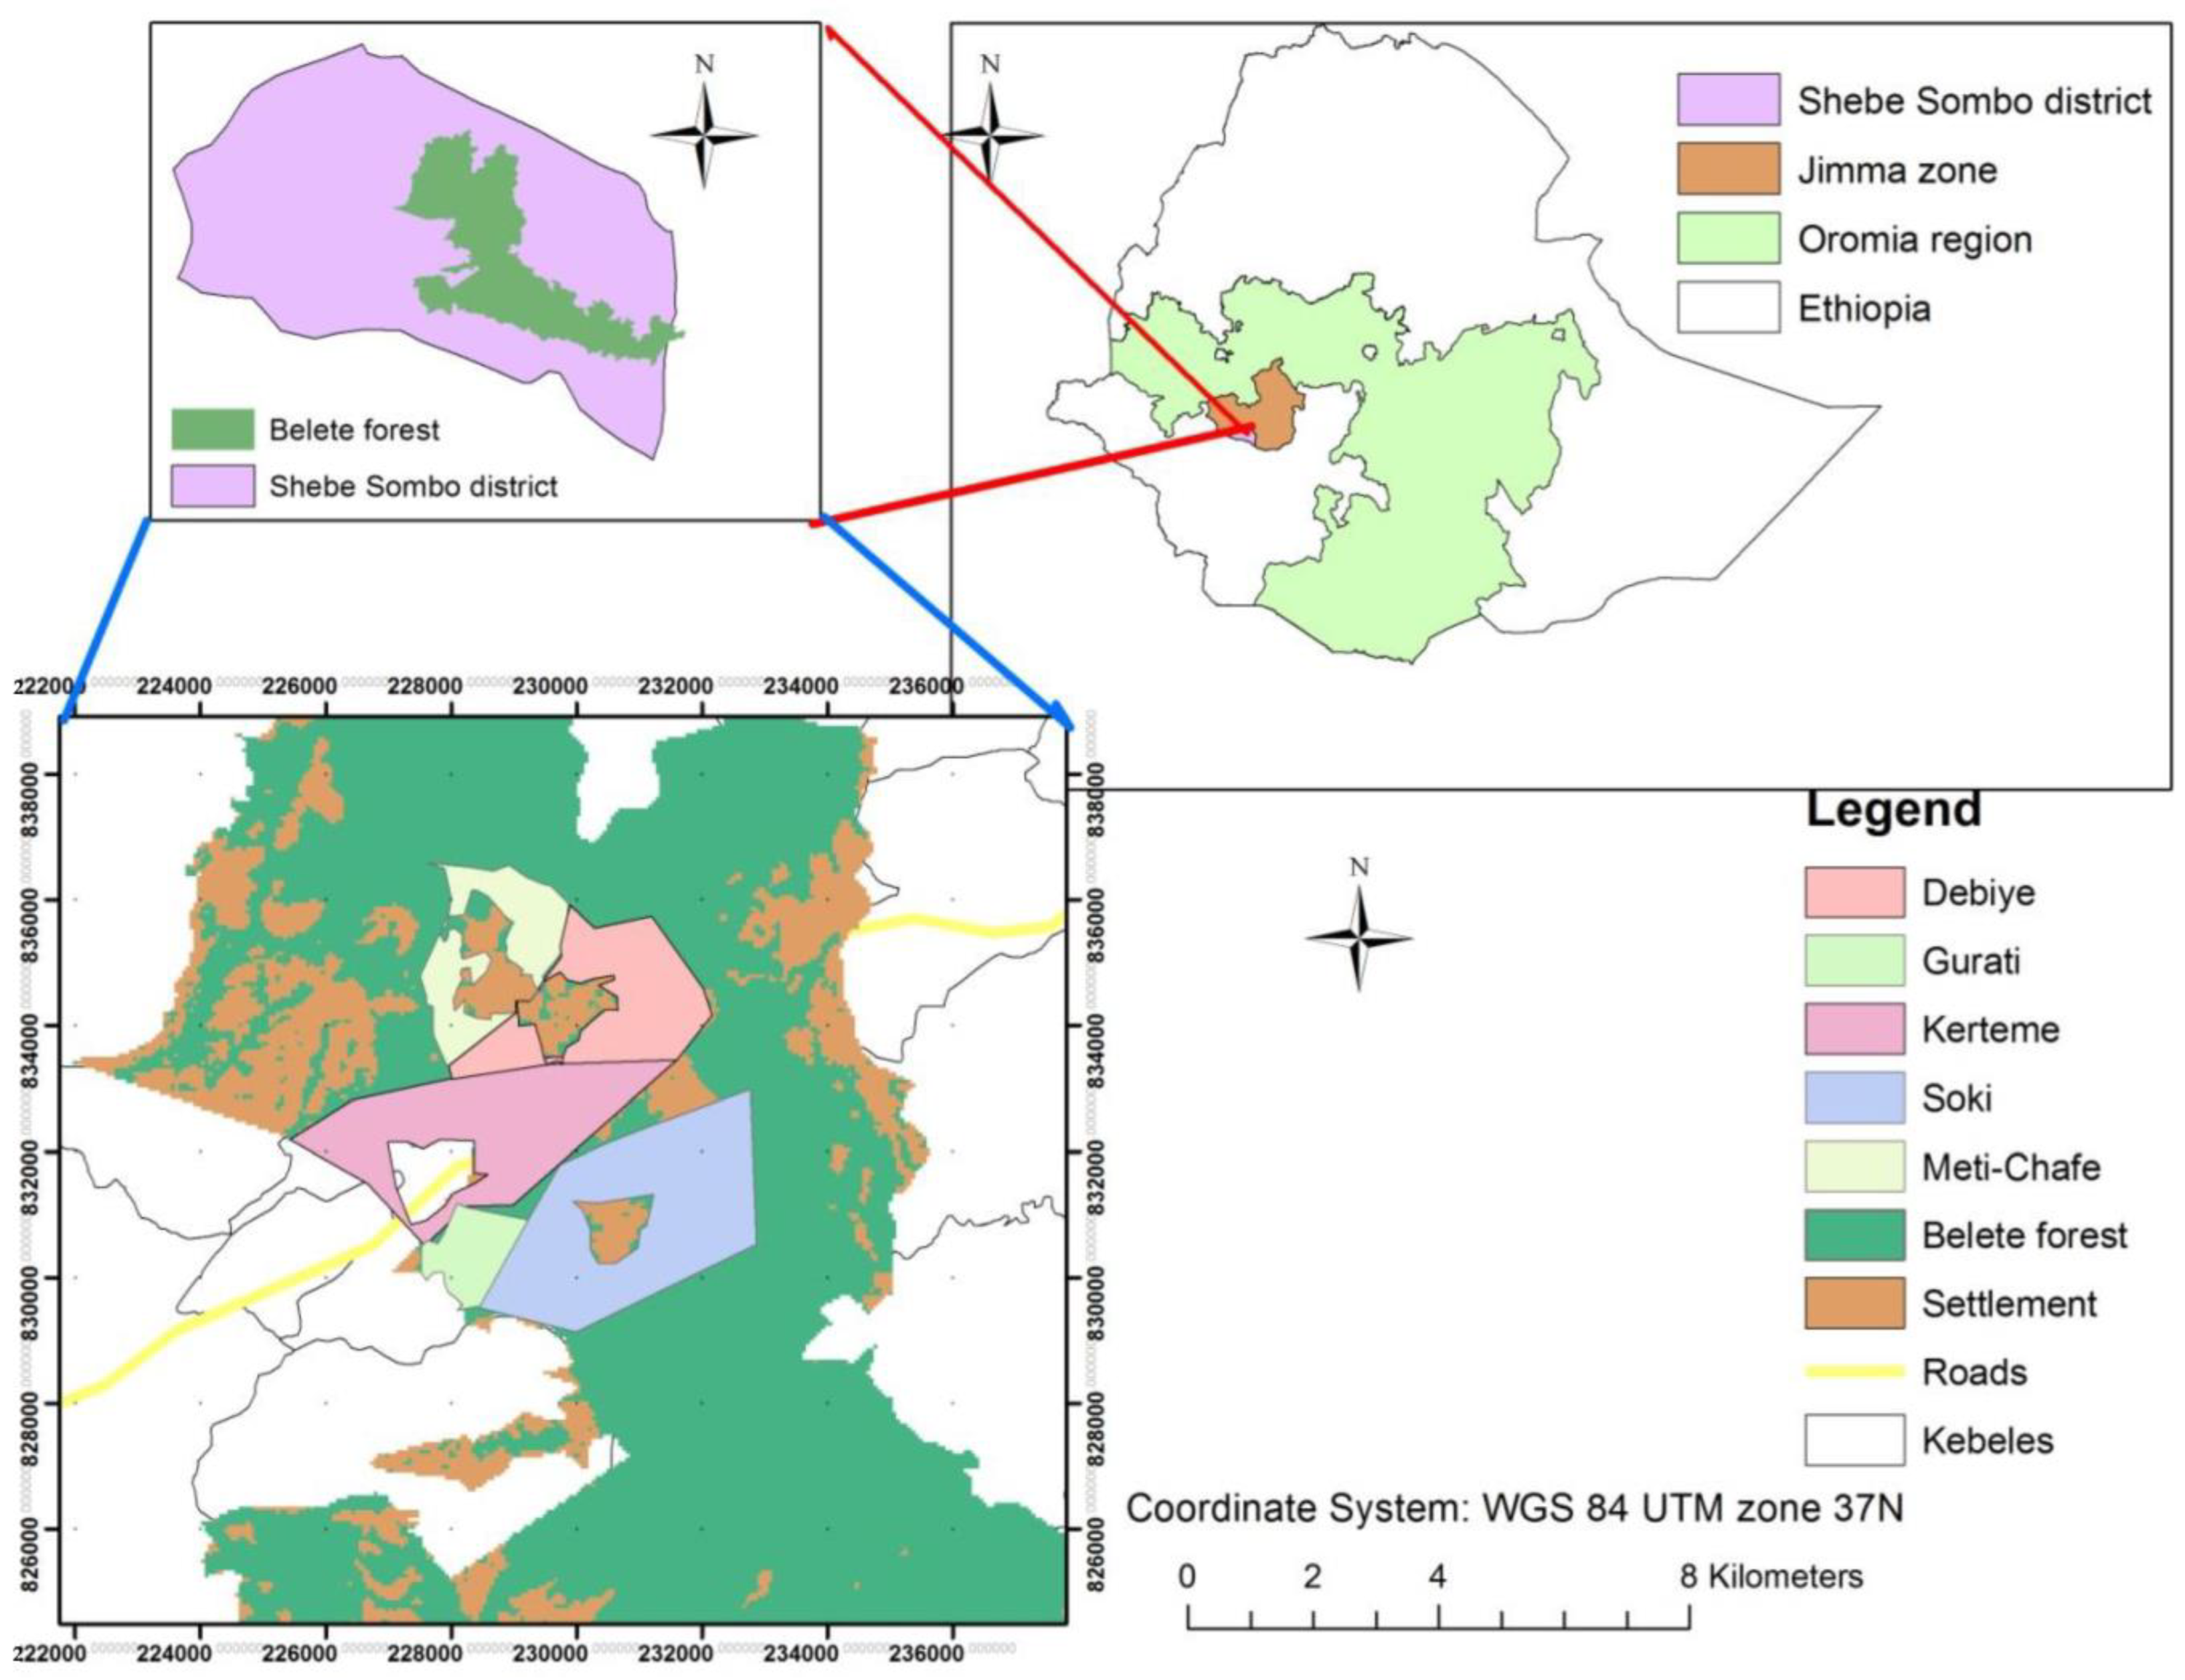
The study was conducted at the Belete forest found in the Shebe Sombo district, Jimma zone, Oromia National Regional State, Southwest Ethiopia (
Figure 1). It is located 45 km west of Jimma town. Geographically, it is found between 360 15′ E and 360 45′ E and 7030′ N and 7045′ N. The Belete forest belongs to the moist evergreen Afromontane forest of southwest Ethiopia. Undulating topography characterizes the forest, and it was difficult to access the remote parts of the forest during the wet season from June to September. The fieldwork was carried out between May 2018 and April 2020.
The Belete forest, together with Gera forest, was designated as one of 58 national forest priority areas in Ethiopia in 1989 [
38]. The forest has been under state control system through three government regimes. However, since 2003 the forest is under participatory forest management and the forest user groups have only rights of use. The government retains ownership rights. In total, there are 44 forest user groups organized to protect and use the Belete forest. The forest is divided into blocks of forest among the forest user groups. The present study focused on forest blocks under five forest user groups (Debiye, Gurati, Kerteme, Soki, Meti-Chafe). Coffee is the flagship species of forest management in the study area. Coffee certification was introduced in 2007 to monitor forest degradation and promote forest conservation [
39].
The study area is characterised by a mosaic of forest, cultivated land and settlements. Due to settlement and agricultural expansion, the Belete forest is isolated from the Gera forest and the forest is becoming a large, fragmented forest. The forest is one of a few remnant Afromontane moist evergreen forests in southwest Ethiopia. Wild coffee (
Coffea arabica) is abundant in the forest, forming an important genetic reservoir for the species. Forest use for coffee ranges from collecting coffee beans without disturbing the forest to opening the space for cultivation [
38]. The most accessible area is managed for coffee production and involves planting of wild coffee taken from the coffee forest and intensive (under growth removal and canopy reduction) management for coffee agroforests.
Deforestation and forest degradation in the area are mainly linked to agricultural activities [
24]. Large areas of plantation forest with exotic trees such as cupressus and eucalyptus buffer the natural forest from settlement and cultivation. Small patchy plantation inside the natural forest was planted to restock the forest. Growing coffee under the canopy of forest and cultivated land and settlements surrounding the forest indicate that the Belete forest has been under the influence of human activities for many decades (more than 50 years).
Land use change associated with coffee production has put the remnant forest under pressure. In the area, the once pristine natural forests have been modified to coffee agroforests [
34,
38].
Environmental factors such as temperature, rainfall and socioeconomic issues of these five forest user groups are more or less similar, implying similar communities live in the different villages. The boundary of the forest of each forest user groups was traditionally determined based on common property use. The most accessible area is modified to coffee management and known as the coffee agroforest [
38,
39]. Each group of forest users operates a similar mixed regime, with natural forest converted to coffee agroforest alongside traditional forest uses.
2.2. Data Collection
Data were collected on woody species composition, stand structure and regeneration along a gradient of increasing management intensification, natural forest, coffee forest and coffee agroforest. The woody plant species inventory involved three major activities: identification of forest blocks, getting permission from the responsible offices (coffee forest and natural forest) and from coffee agroforest individual owners and, finally, undertaking forest inventory. Five days of preliminary observation of the forest was undertaken [
25,
37], along with a member of the forest user groups in order to get an overview of the forest and select study areas that were representative of the three forest types. To ensure the forest was sufficiently covered and because the forest was highly disturbed, a strategy of selecting a small number of plots across five study sites was followed.
The forest was already under the control of five forest user groups, namely the Debiye, Meti-Chafe, Soki, Gurati and Kerteme. To gain an overall impression of the forest, these forest user groups were consulted about the forest management regime. Ethnoecological classification was the starting point for identifying three forest management regimes. Forest users categorize the forest with their local names into three categories based on how the forest is used, using the terms: bosona dhuunfaa (individualised), bosona waliin (common pool) and bosona duudaa (natural forest), which is later translated based on the literature. These local names were used to define forest management characteristics and related to the forest types in the literature, such as coffee agroforest, coffee forest and natural forest, respectively.
Coffee agroforest is transformed or modified natural forest and usually managed on an individual basis under intensive coffee management practices, whereas coffee forest is disturbed forest and usually used on a communal basis. The management practice carried out inside coffee forests is forest product extraction only. The natural forest is the forest with its original structure and composition and comparatively less disturbed and utilized. The forest user groups felt the natural forest to be under the state control system. Similar to coffee forests, there is no clear forest management intervention in the natural forest.
For the present study, the presence of the three types of the forest were identified at each selected area during preliminary assessment. The three forest types were aligned along a straight transect line as much as possible. Because of topography and irregular forest disturbance, it was difficult to arrange equidistant sampling units; hence, the distance between the plots varies across the management gradient and was decided subjectively. The distance between coffee agroforest, coffee forest and natural forest were adjusted to get a homogenous sampling unit. The assessment started with coffee agroforest and then coffee forest and finally natural forest.
We employed the quadrat (plot) method, which is commonly used in vegetation assessment [
27,
36,
37]. A large plot size of 20 m × 20 m was laid in the middle of the selected forest types. Then, two smaller plot sizes of 10 m × 10 m and 5 m × 5 m were established in the middle of the big plot. Woody plants with a diameter at breast height (DBH) greater than or equal to 10 cm and lianas were assessed within the 20 m × 20 m plot; saplings (DBH less than 10 cm, height greater than or equal to 0.5 m) were assessed within the 10 m × 10 m plot; and seedlings (DBH less than 10 cm, height less than 0.5 m) were assessed within the 5 m × 5 m plot. Kent [
40] and Mueller-Dombois and Ellenberge [
40] have stressed that the stand must be homogeneous (i.e., sampling units) for comparison of plots, so the three forest types (natural forest, coffee forest and coffee agroforest) are expected to have similar composition and structure without management intervention. Due to conflict between the individuals and government regarding the forest, it was not possible to establish permanent plots.
Woody plants within each plot were enumerated. Diameter at breast height (1.3 m) and the height of each tree was recorded. Diameter at breast height was measured using a caliper and measuring tape. The height of the tree was measured using a hypsometer. For saplings, seedlings and lianas, the number of stems were counted and recorded in data collection format. A total of 189 plots—63 plots each in coffee agroforest, coffee forest and natural forest—were assessed across the five forest user group areas (
Table 1). Woody plant identification was done while in the field with the help of the literature [
20,
41,
42,
43,
44] and later confirmed by a botanist. Photo and plant specimens were collected for some plants that need confirmation, and the specimen were deposited at Jimma University, Department of Biology.
2.3. Data Analysis
The woody plants data were summarised per plot. The summarised data were pooled together per forest type for analysis. The number of individuals were simply the total number of counted woody plants within a plot and pooled together per forest type. The number of individuals per forest types was calculated for woody species with diameter at breast height greater or equal to 10 cm. Woody species composition was described based on the presence/absence of plants. The abundance data were converted into presence/absence across the forest types. Woody species composition was also calculated based on similarity indices.
The Sorensen similarity coefficient was used to compare similarities with pairs of forests based on woody species composition (natural forest, coffee forest and coffee agroforest) [
45,
46,
47] and was calculated as:
where
S is Sorensen similarity coefficient,
a is number of species common to both forest types,
b is number of species in one of forest types to be compared and
c is number of species in other forest types.
The similarity of woody species among the three forest types were compared by a multiple site similarity index following [
47,
48] and using the formula:
where
MSSI is multiple site similarity index,
a is number of species found in natural forest,
b is number of species found in coffee forest,
c is number of species found in coffee agroforest,
ab are number of species found both in natural forest and coffee forest,
ac are number of species found both in natural forest and coffee agroforest,
bc are number of species found both in coffee forest and coffee agroforest and
abc are number of species common to natural forest, coffee forest and coffee agroforest.
Forest structure across the three forest types were compared based on phytosociological data analysis [
49]. Abundance, basal area and density were the attributes of phytosociological study.
The basal area (
BA) per plot was calculated from the diameters [
41,
49] using the formula:
where
BA = Basal area of each tree, di = diameter at breast height and
.
The summation of basal area for each individual gives the total basal area per forest types as:
where
BA = Basal area of each individual.
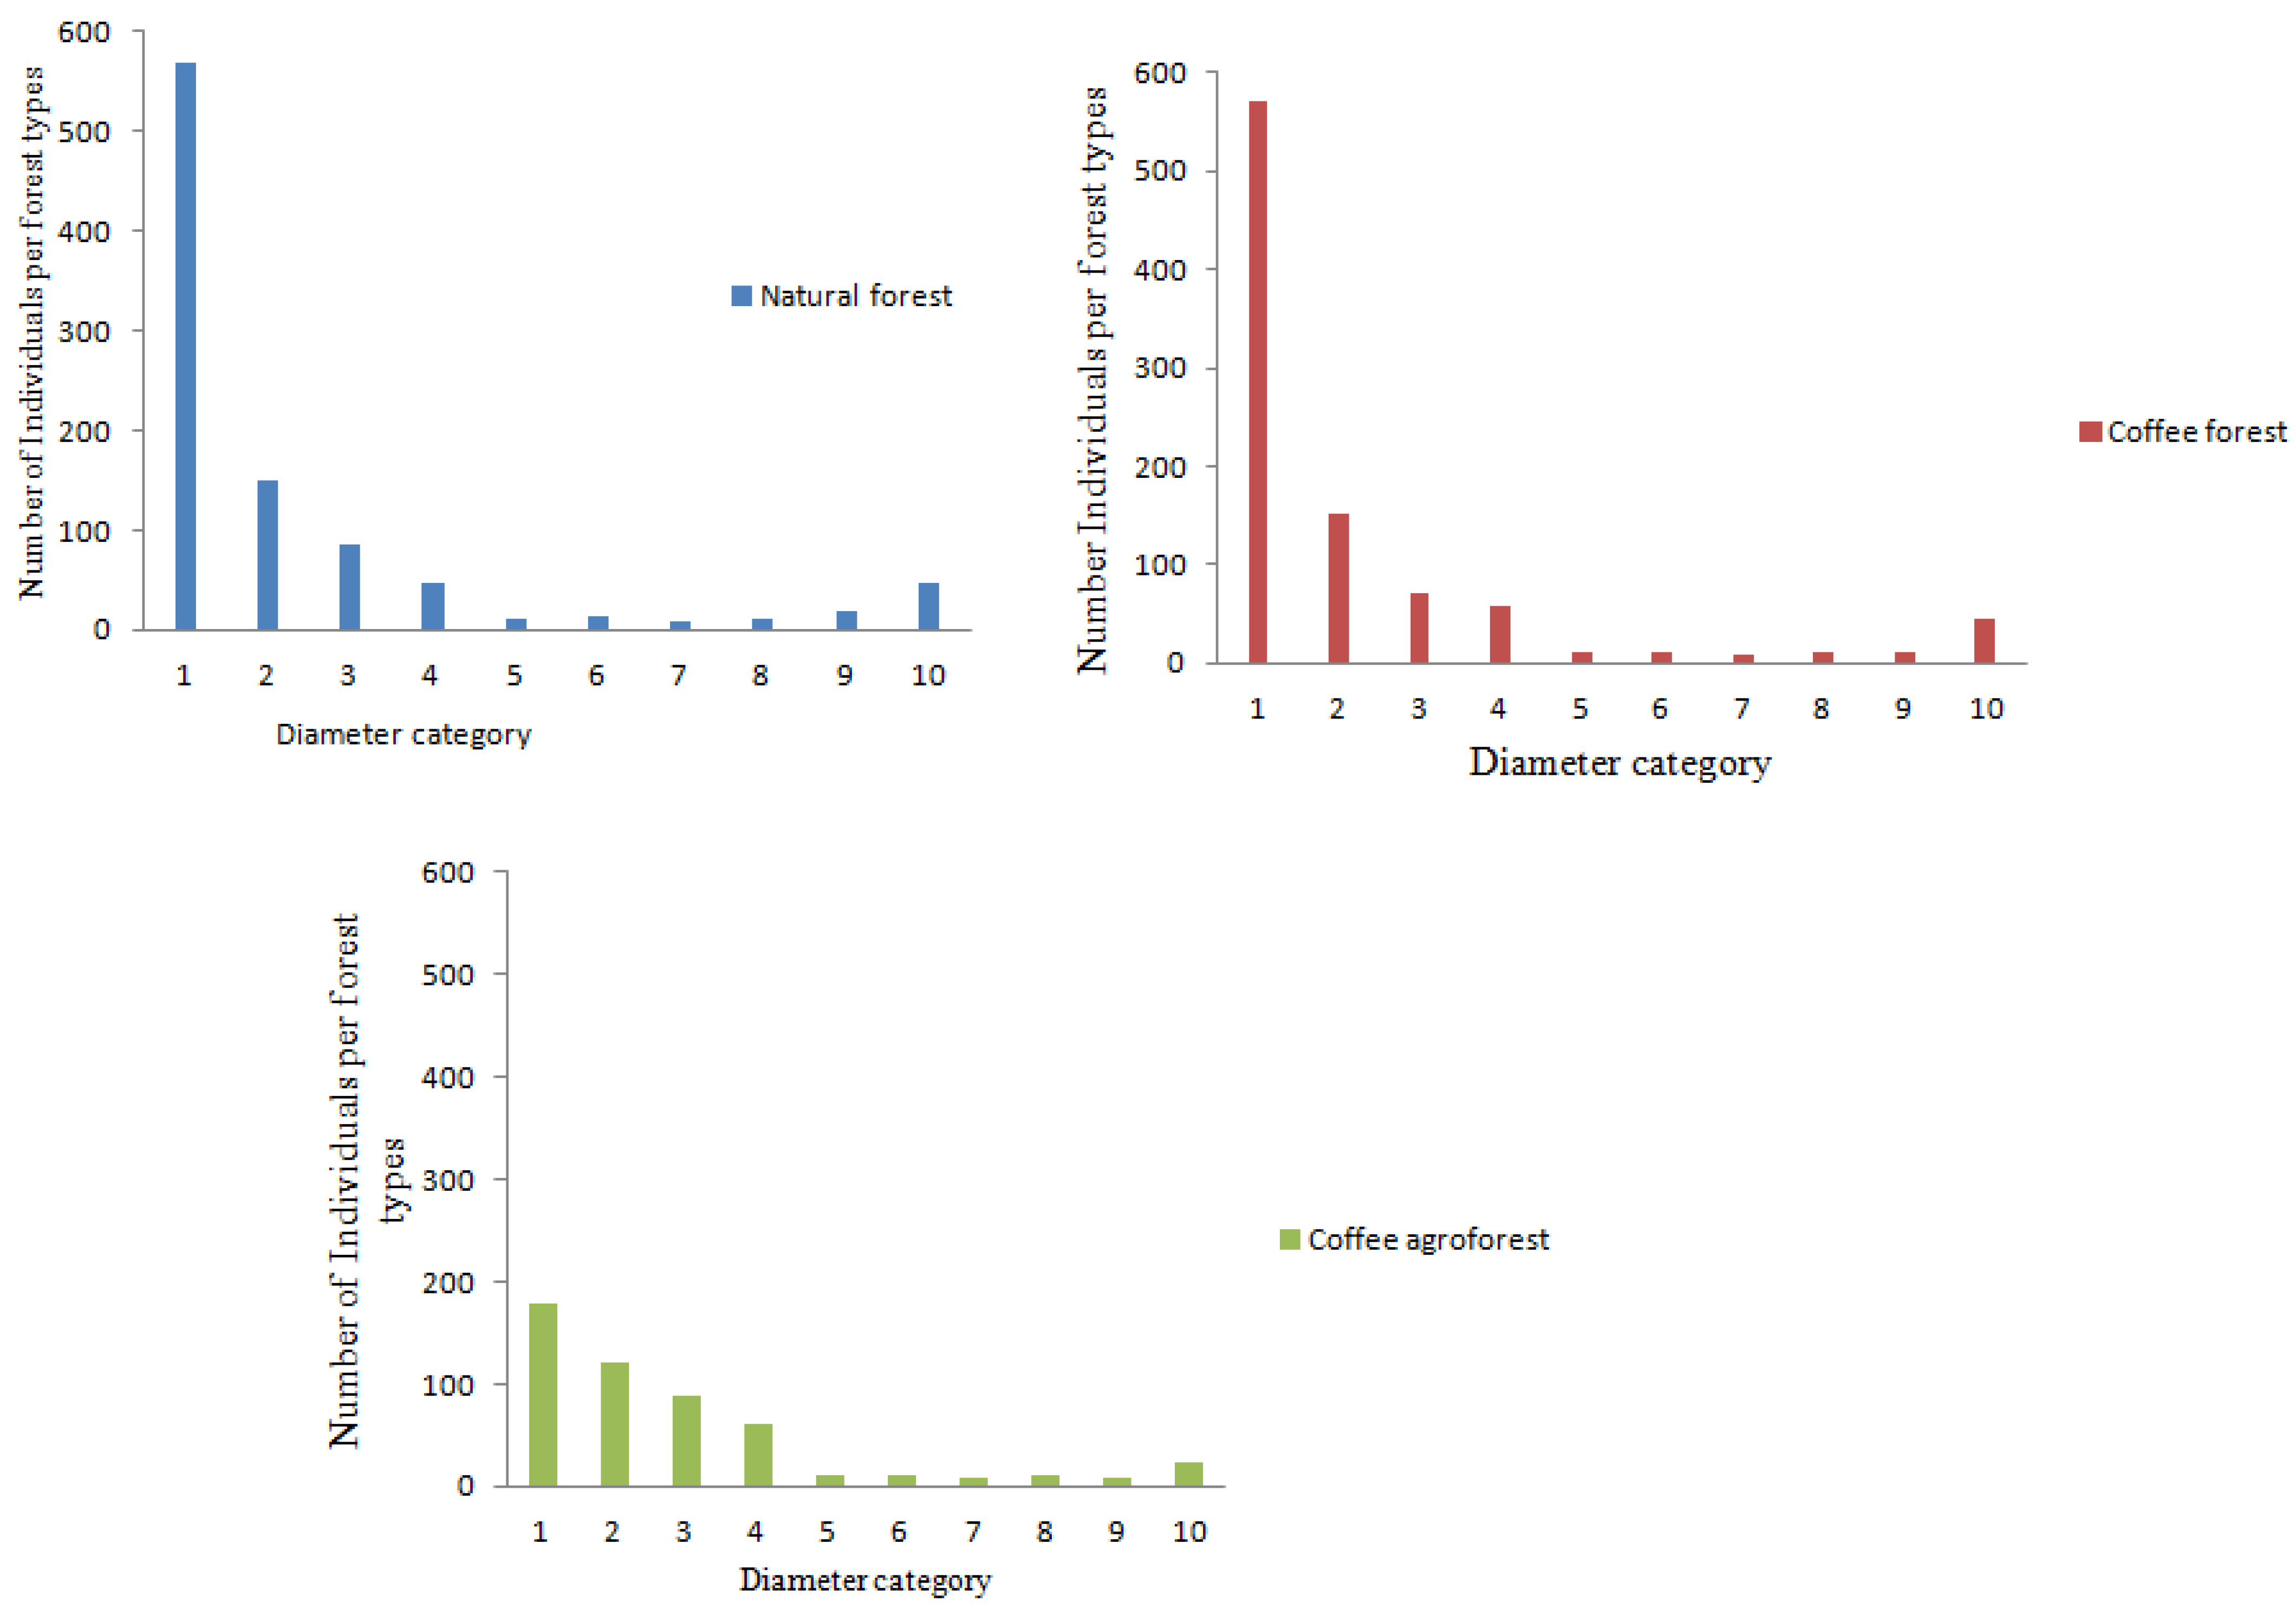
The diameter size distribution [
49] was divided arbitrarily into ten size classes from 10–20 cm, 21–30 cm, 31–40 cm, 41–50 cm, 51–60 cm, 61–70 cm, 71–80 cm, 81–90 cm, 91–100 cm and >100 cm. Forest structure was divided into four layers: emergent, canopy, middle and undergrowth [
25,
37]. Woody species are categorised as tall trees with height greater than 30 m, medium trees between 15 m to 30 m, small trees between 0.5 m to 15 m and seedlings in the forest floor at less than 0.5 m. Saplings were grouped under small tree categories. The numbers of individuals in each layer or stratum were used for description and comparison of vertical structures of the three types of forest [
47,
49,
50]. Density of woody species was estimated based on the total number individuals counted divided by the total area [
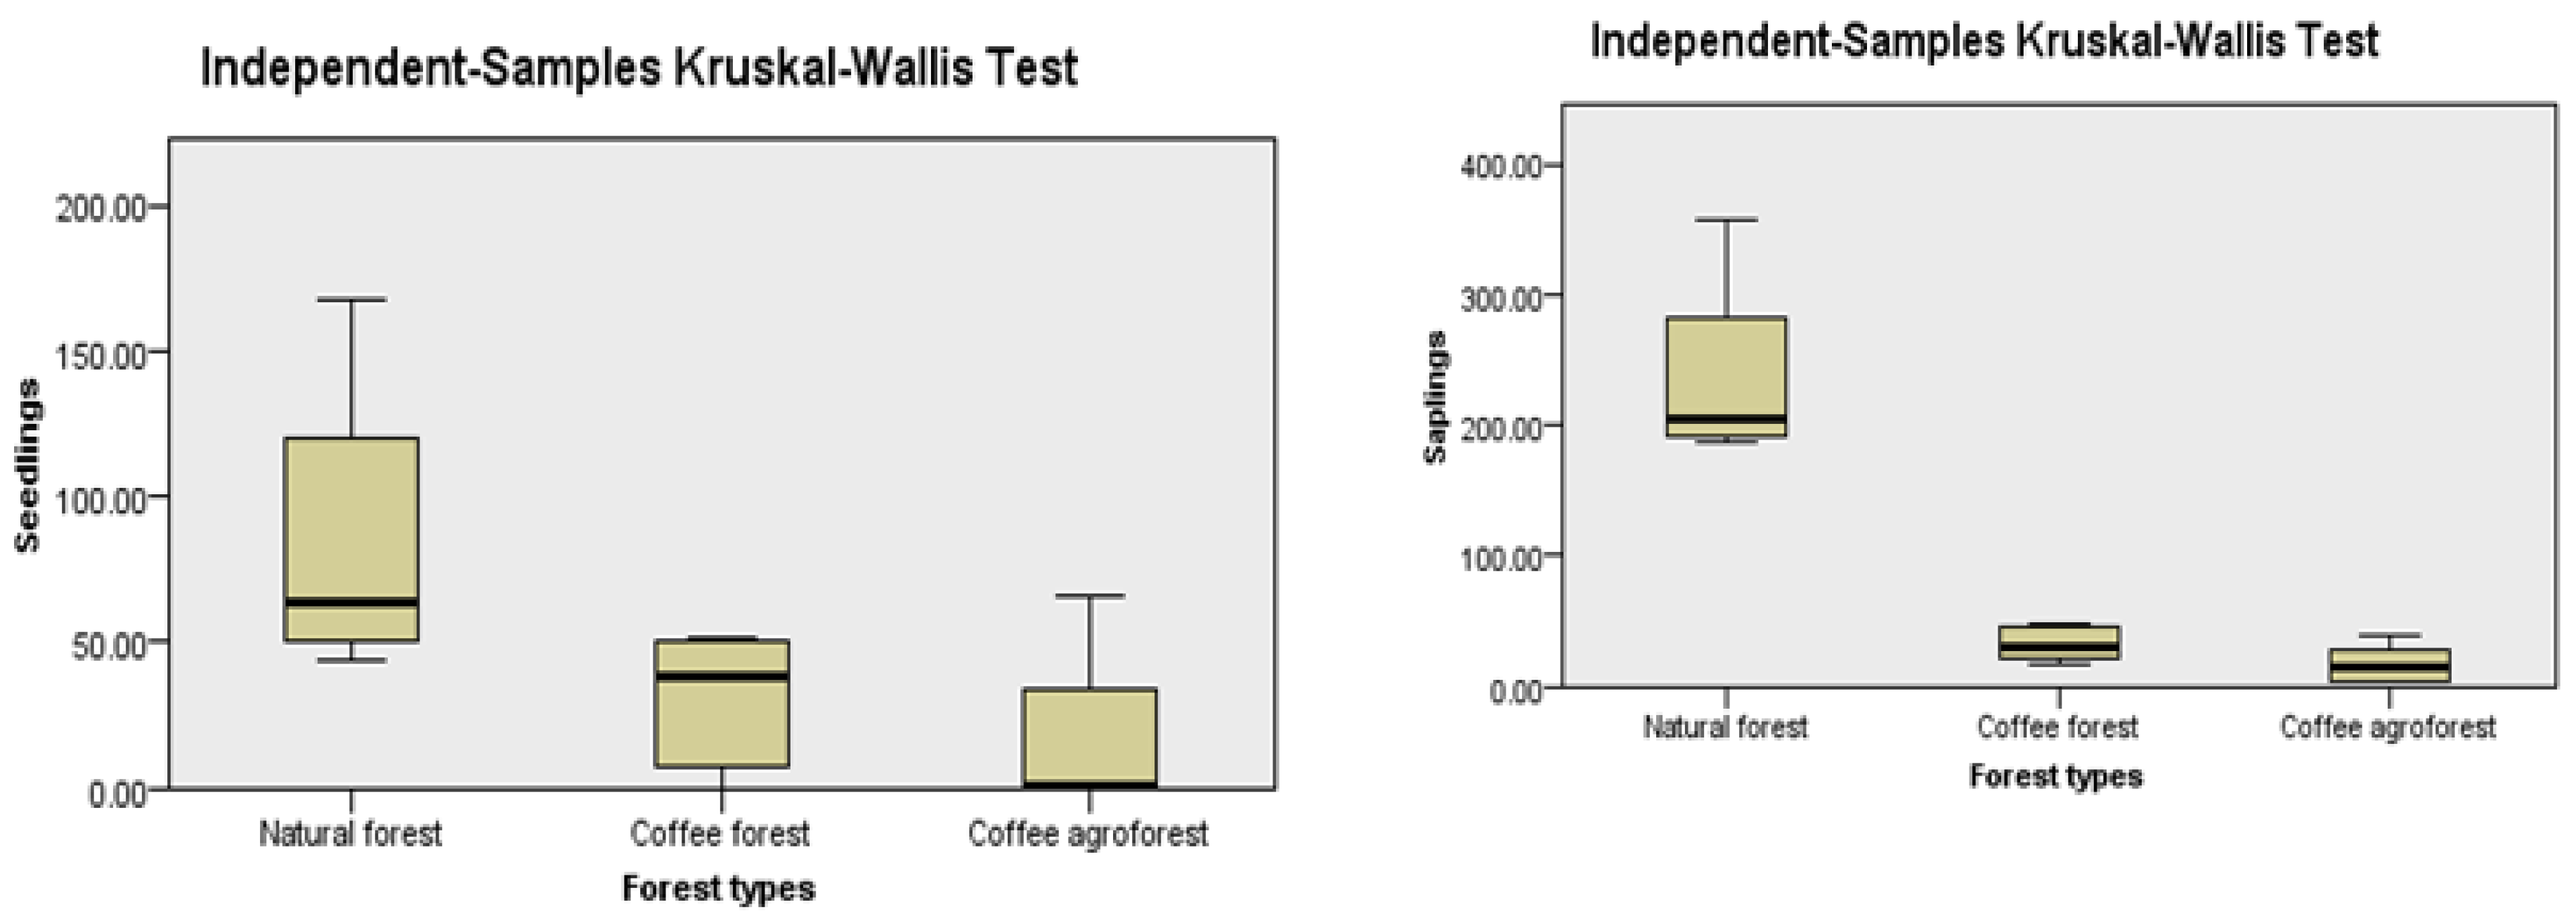
47]. The regeneration data were analyzed using the total number of seedlings and saplings as proxy measures [
49,
50] and categorised into “Good”, “Fair”, “Poor” “No regeneration” and “New regeneration” following [
51,
52]. The regeneration status was categorized as:
“Good” regeneration, if the number of seedlings > saplings > mature trees
“Fair” regeneration, if the number of seedlings < saplings < or > mature trees
“Poor” regeneration, if there are only saplings but no seedlings
“No” regeneration, if both seedlings and saplings are absent but found only in mature trees
“New” regeneration, if there is no adult but only saplings and/or seedlings stage
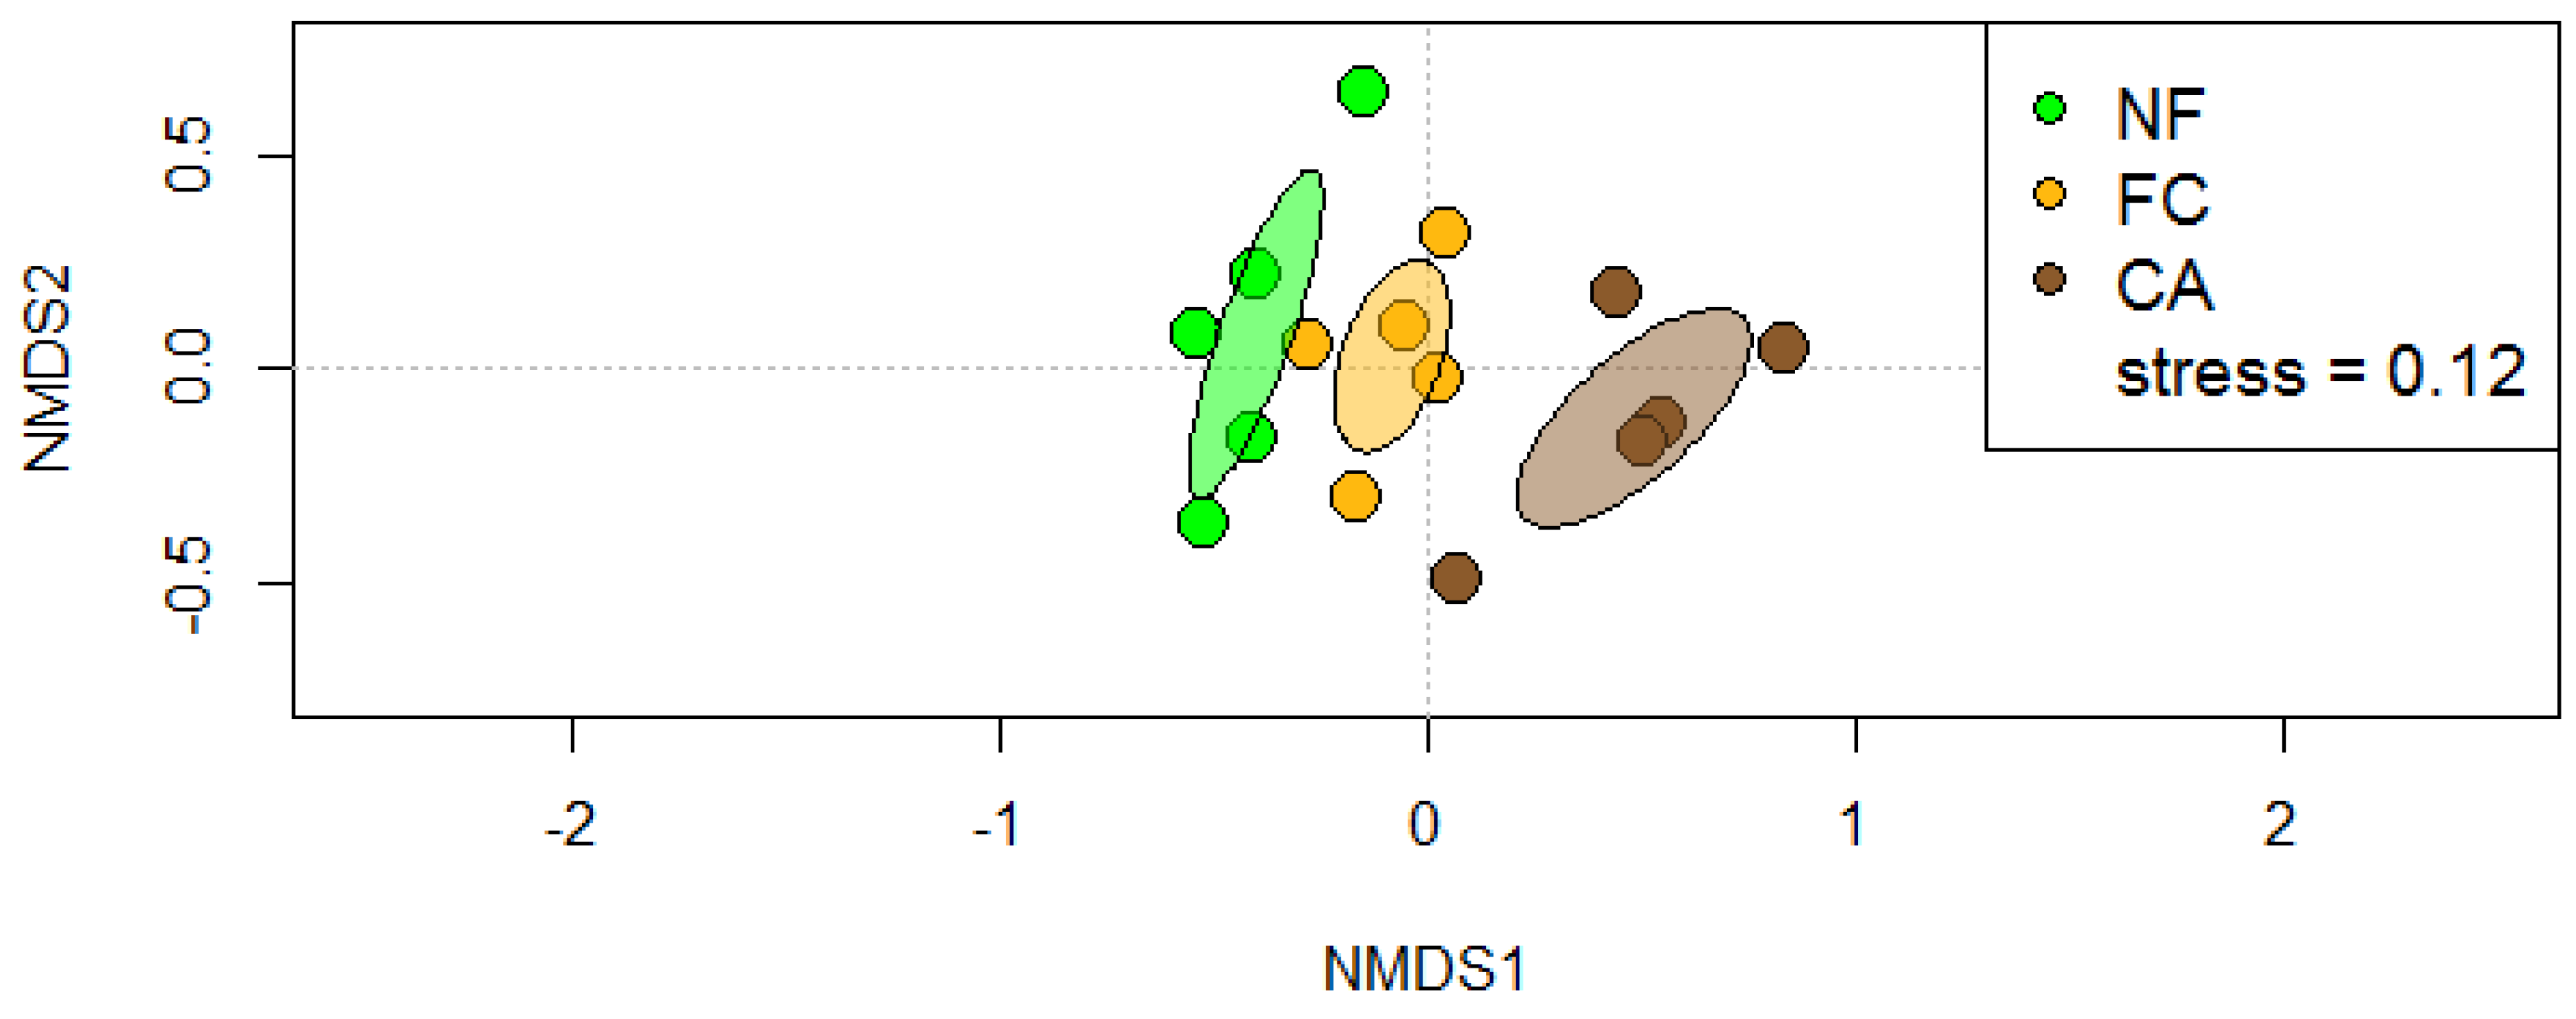
Non metrical multidimensional scaling (NMDS) ordination with Bray–Curtis distance measures [
20,
53] was employed to compare the floristic composition dissimilarity of natural forests, coffee forests and coffee agroforests. NMDS arranges forest types in ordination space close to each other when they are similar and far apart when they are dissimilar in composition. NMDS is a data reduction technique that works on rank order information [
54]. Unlike Principal Component Analysis that assumes linearity, NMDS makes no a
priori assumption about distribution of data [
55,
56]. Most ecological data are non-normally distributed and characterised by many zeroes (absence) that distort the result [
57,
58]. NMDs with Bray–Curtis distance measures are suggested for data with many zeroes (absences) [
58].
Non metrical multidimensional scaling (NMDS) was run on woody species abundance data (dbh ≥ 10 cm); however, the stress value was greater than 0.2. The stress value for most ecological data range between 0.1 to 0.2 [
59]. To reduce the stress value (stress = 0.12), the mean abundance value of each forest type was estimated per site (i.e., dividing the total abundance by plot numbers). Ref. [
60,
61] have suggested a stress value of less than or equal to 0.15 is considered generally acceptable. The mean abundance data of each forest type per site was used to run NMDS using R studio version 1.1.414.
An analysis of similarity (ANOSIM) followed non metrical multidimensional scaling to test the significance of differences between and within the three forest types [
6,
62,
63,
64]. Similarity Percentage (SIMPER) was run to determine the contribution of each species to the differences [
58,
64]. Both ANOSIM and SIMPER were run on PAST software version 3.24.
The non-parametric Kruskal–Wallis test and Chi-square tests were used to compare data between the natural forest, coffee forest and coffee agroforest using R and SPSS version 25. The non-parametric Kruskal–Wallis test is free of distribution and suitable for data failing to conform to parametric test assumptions (i.e., normal distribution and homogeneity of variance). A post hoc test was run on SPSS version 25 using Independent samples and Kruskal–Wallis one-way ANOVA (K samples) multiple comparisons. Kruskal–Wallis one-way ANOVA (K samples) multiple comparison is similar to the Mann–Whitney U test, which is suitable for two samples. However, with Kruskal–Wallis one-way ANOVA (K samples) multiple comparisons, it is possible to run multiple samples at a time. The significance values have been adjusted by Bonferroni correction for multiple comparisons and directly read from the SPSS output adjusted significant.
4. Discussion
Studies on stand structure, composition and regeneration status of woody plant species can help to assess the status of forest condition [
21,
52], which in turn will determine the need for sustainable forest management [
62,
64,
65,
66]. Both horizontal structures attributed to diameter distribution and vertical structure attributed to canopy layers stratification can give information on forest structure [
63,
64]. Undisturbed forest is expected to have good forest conditions and is usually considered as a reference to investigate the effect of human activities on original forest composition and structure [
63,
66].
Forest modification for coffee production is the concern of forest biodiversity conservation [
25,
36,
37]. Previous studies have stated that coffee management intensification changed the composition of woody species [
23,
36,
65], and this is also the case in southwest Ethiopia. It is believed that repeated coffee management impedes late successional species and skews forest tree species composition towards an early successional community [
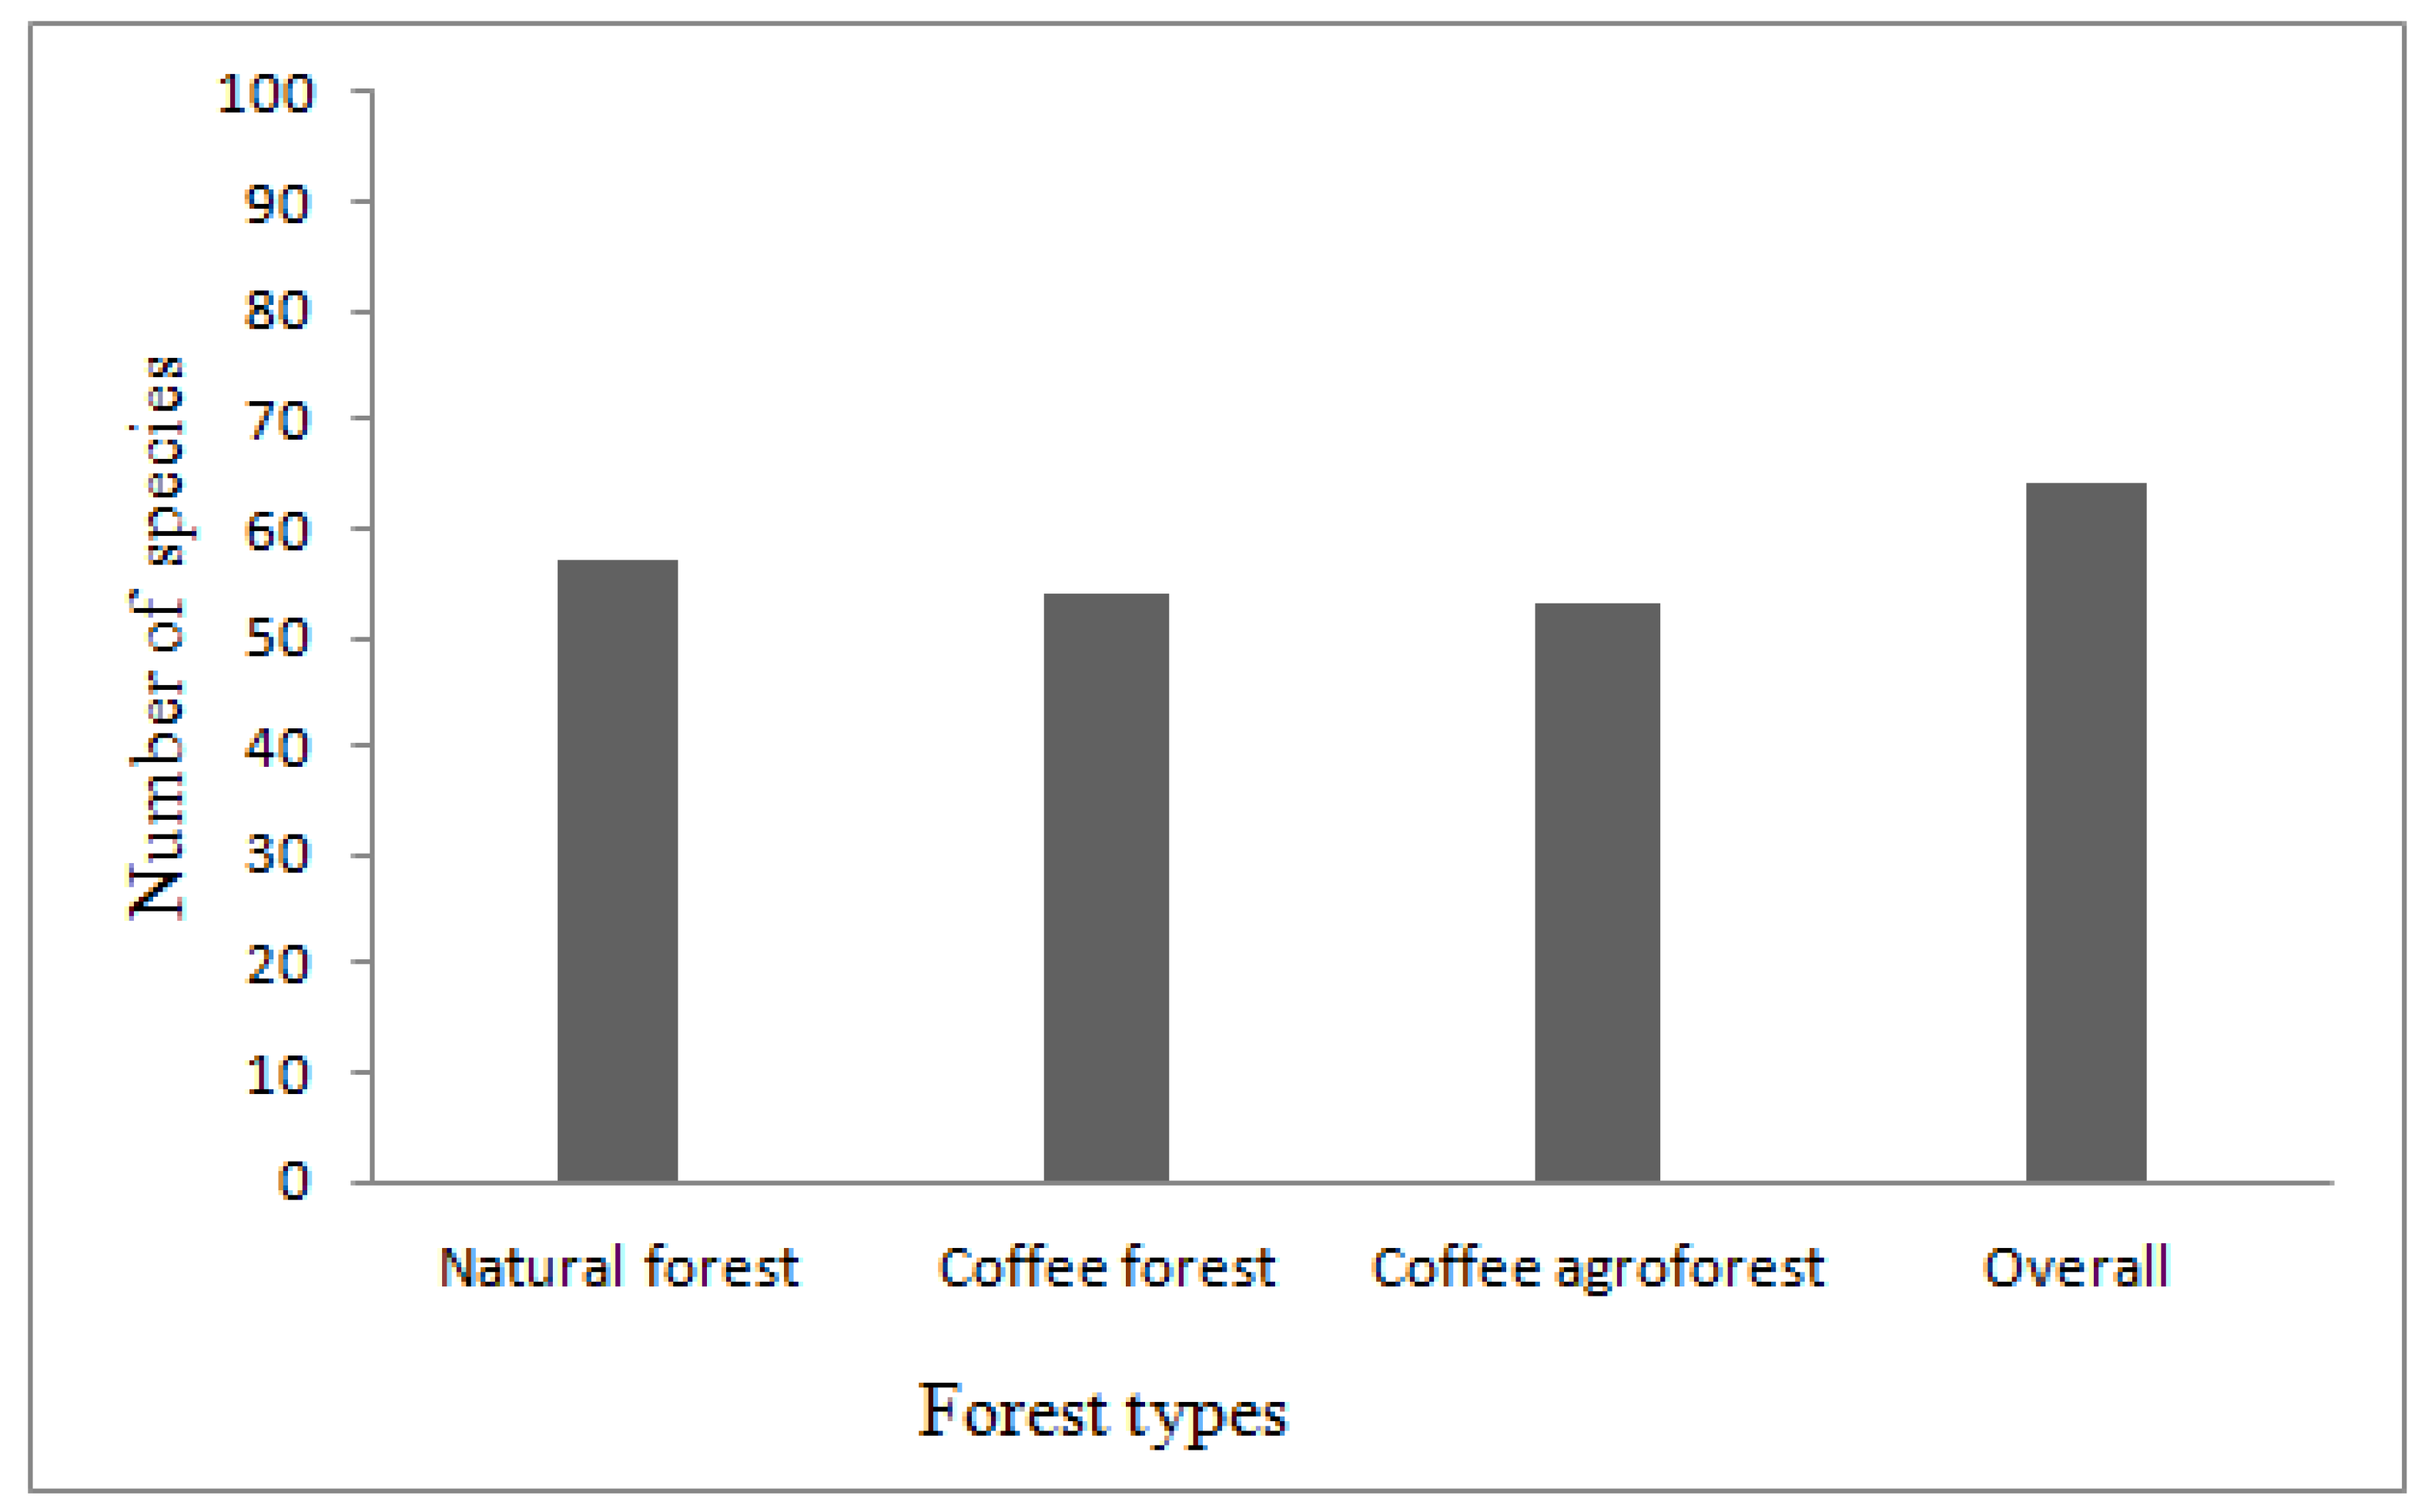
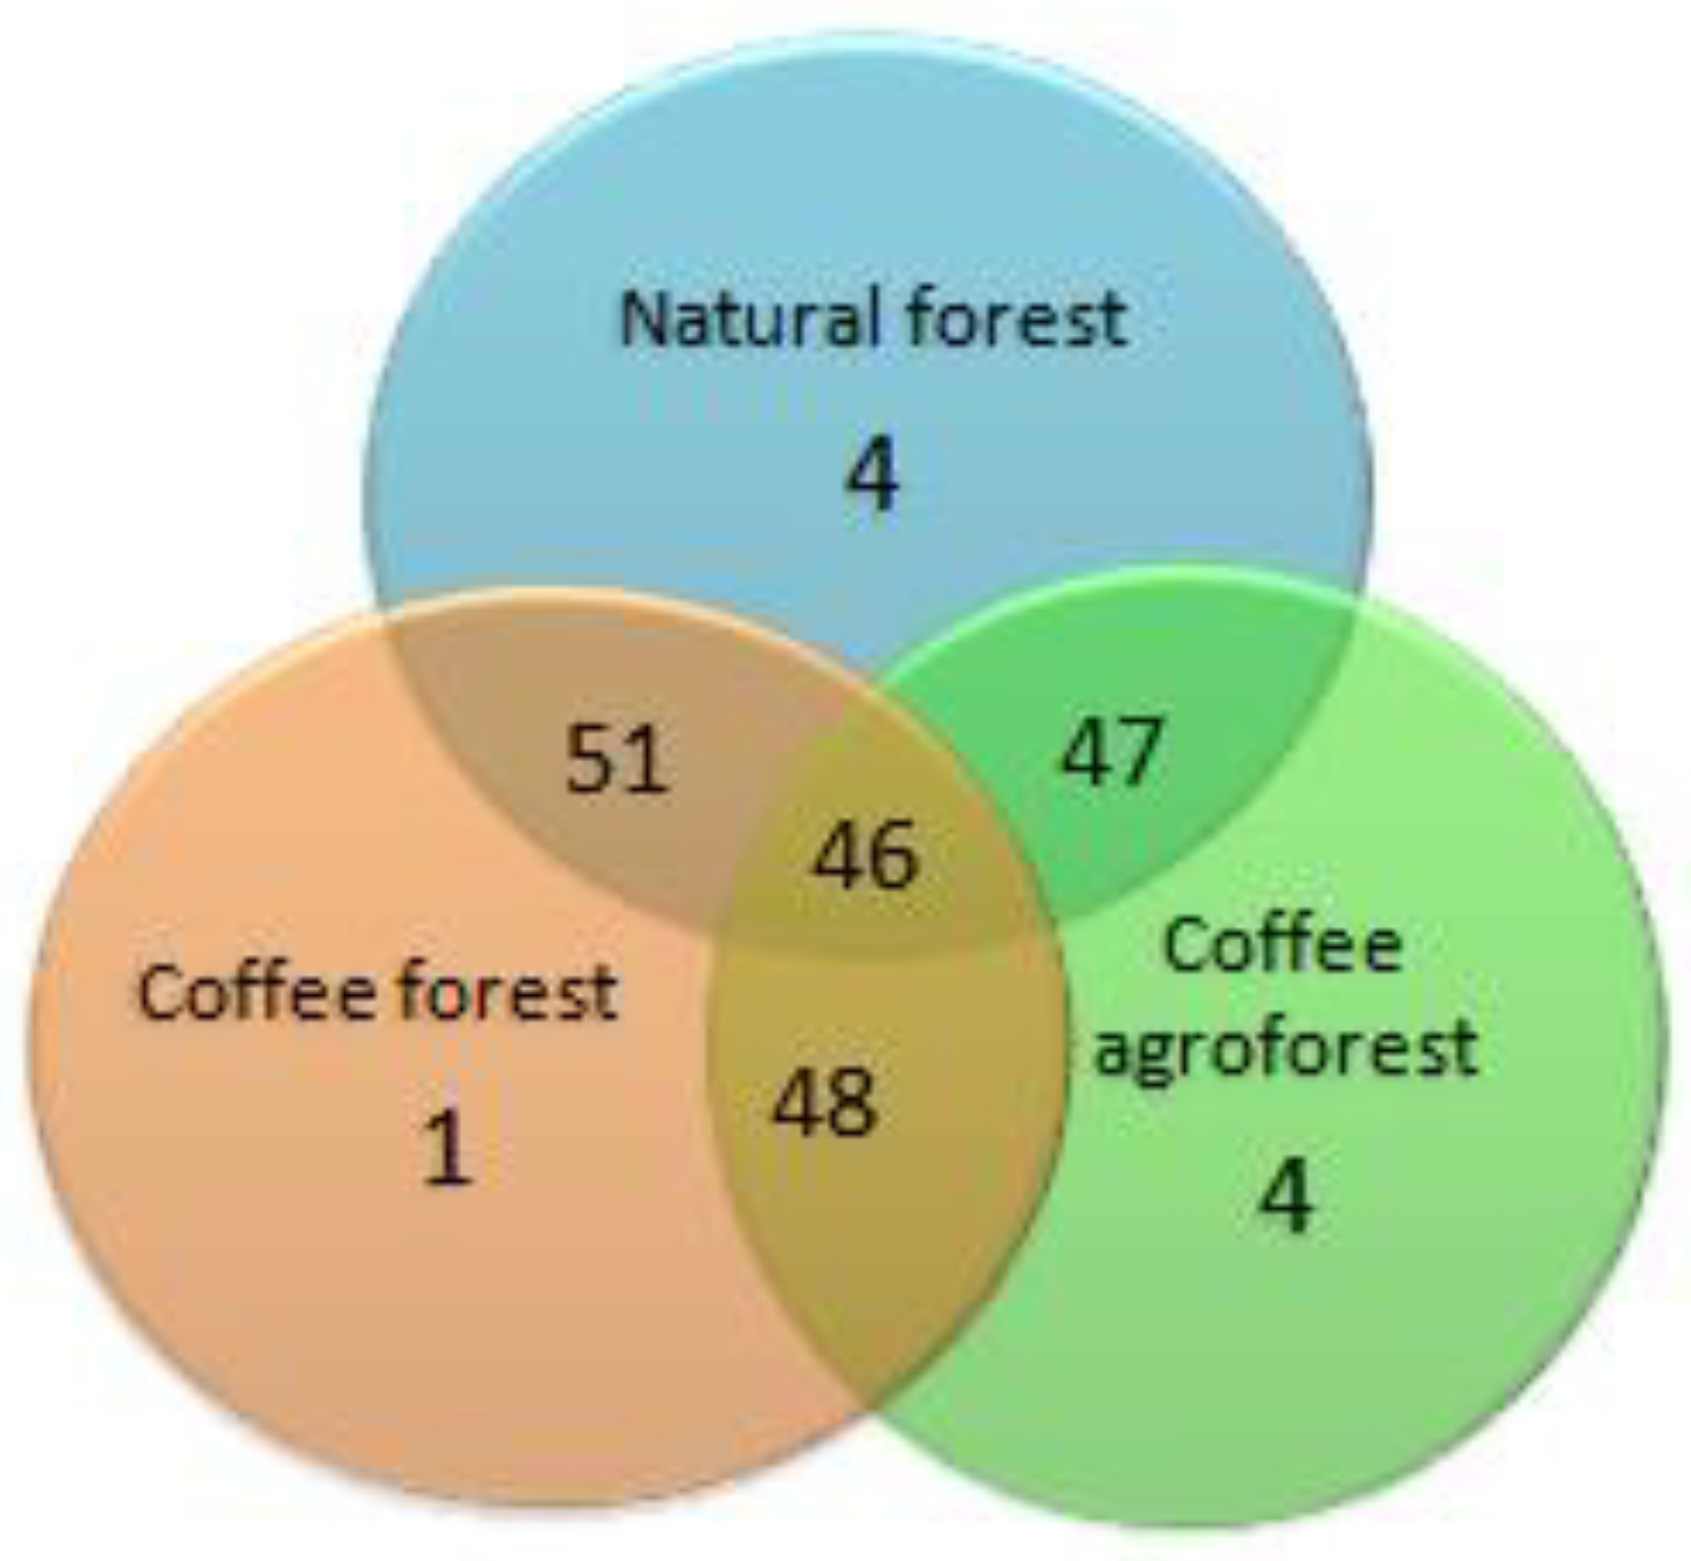
23,
36]. However, our findings show that a comparable number of woody species to the natural forest are maintained in the coffee agroforest, which has implications for the conservation of woody species. Forty-six woody species recorded in the natural forest and coffee forest were also recorded in the coffee agroforest.
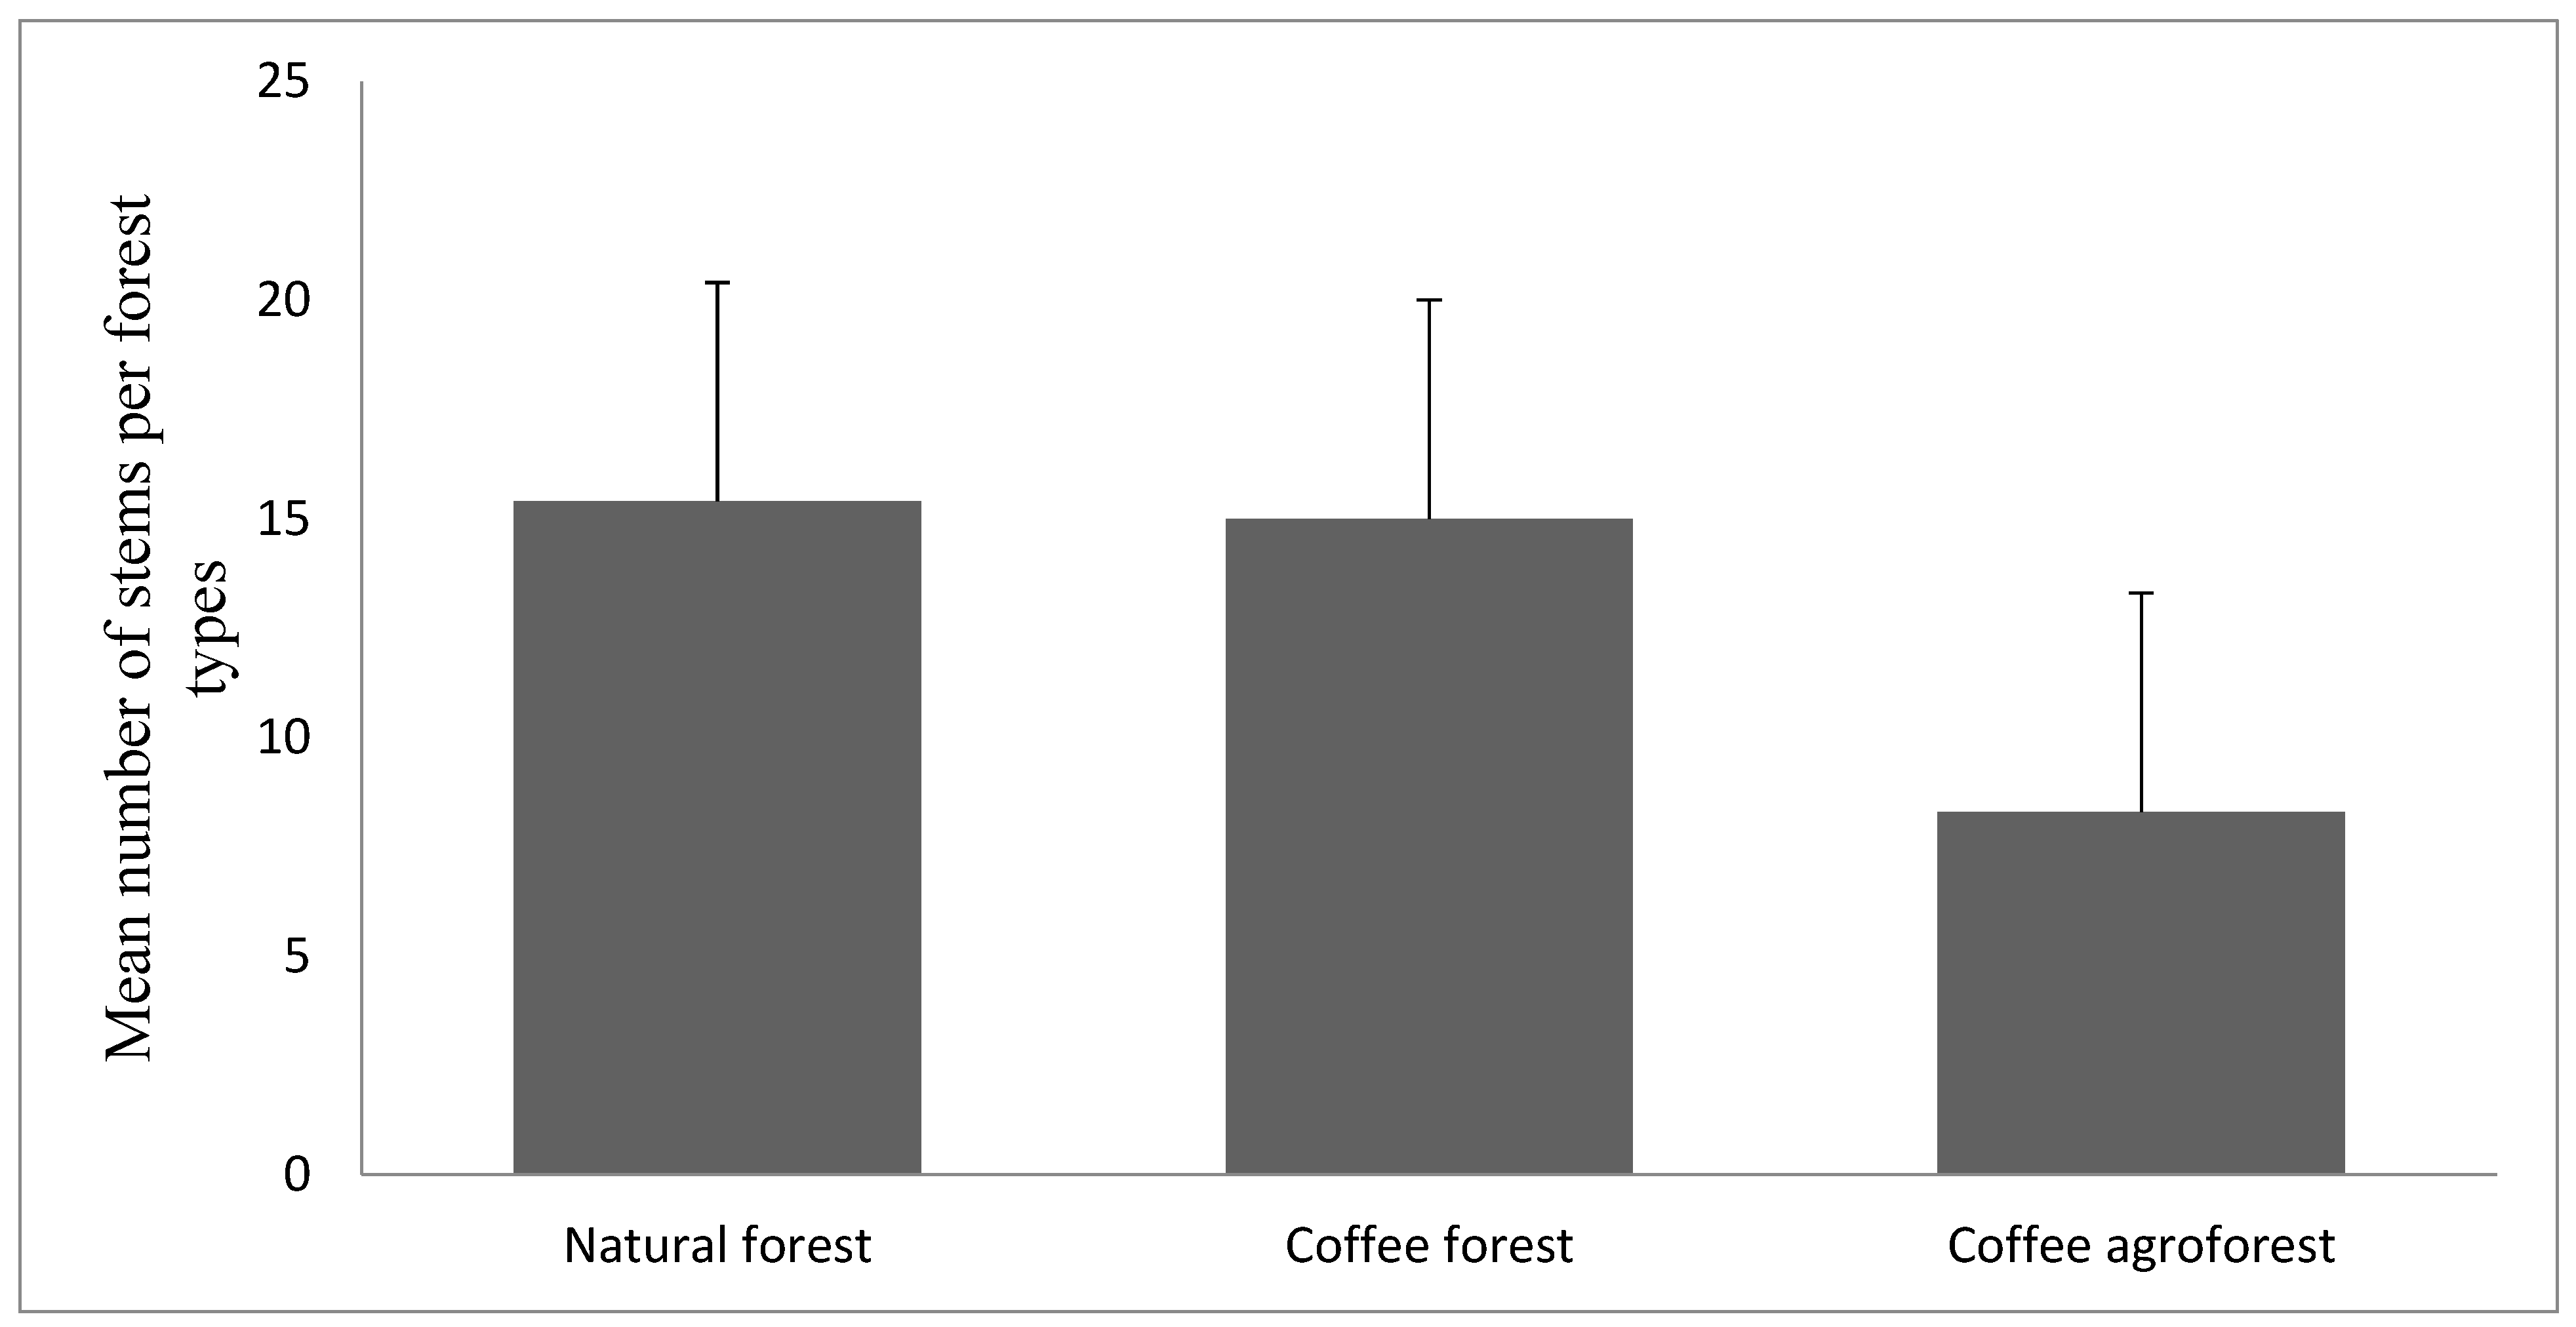
Differences were obtained in woody species abundance across the natural forest, coffee forest and coffee agroforest. According to Hundera et al. [
36], coffee management intensification changes the heterogeneous composition of the forest. However, the present study shows that forest modification for coffee simplifies the woody species spatial composition as it changes the number of individuals per plot. This is related to the land use history of the area. Some thirty to forty years ago, the current coffee agroforest was totally natural forest and the original woody plant species are still found in coffee agroforest. At the early stage of coffee management inside the forest, small trees are removed to create vacant space for planting. Reduction of stems then takes place to manipulate shade intensity when the planted coffee becomes mature. The studied coffee agroforests have been under coffee management for several decades. The long term effect of coffee management needs further research.
The number of individuals per plot were reduced by half from natural forest to coffee agroforest. The biggest single difference between the forest types was the presence of liana, which were strictly indicators of natural forest and were absent from coffee agroforest and coffee forest. This contrasts with the findings of [
24], who reported the presence of lianas in coffee agroforests in Sheka and Kaffa zones, southwest Ethiopia. The total number of stems were simplified along the gradient of natural forest to coffee agroforest (reduction in abundance) rather than the woody species composition (i.e., heterogeneity reduction). Ref. [
37] have also reported the presence of forest species across different forest types, with different abundance in southwest Ethiopia.
Ref. [
25] have shown that coffee management intensification resulted in structural modification leading to tall tree canopy and coffee canopy layers without intermediate layers. In the present study, the structure of the three forest types based on height and diameter categories were similar, and all categories of diameter and strata were represented in each forest type and woody species occupied all four strata. Differences were seen in the number of individuals in each stratum, and the diameter distribution of the three forest types exhibits more individuals in the lower diameter category and fewer in the upper diameter category.
A study by [
37] found that upper canopy trees are most strongly affected during forest modification. Our findings showed that under storey and small-sized tree zones are more affected than the upper strata. Since undergrowth and small-size trees are mostly removed, the coffee agroforest creates a vacant space that favours more pioneer species and secondary forest species rather than forest species themselves. Forest species like
Oxyanthus speciosus,
Rothmannia urcelliformis and
Vepris dainellii are found mainly in the category of small-size trees.
Regeneration of woody species provides an indication of long-term forest health and these findings showed that woody species regeneration does take place in all the three forest types. However, those differences are observed in the total number of recruits across the three forest types, and certain tree species might have regeneration problems. The higher number of seedlings under the natural forest suggest a more favourable environment for the regeneration of late successional species. Ref. [
37] have noted many tree species have specialized regeneration requirements. High light intensity due to canopy gaps favoured pioneer species or secondary species. The present study result is in line with the findings reported by [
36], stating that there is a greater than 95% reduction in the number of tree seedlings and 75% in the basal area in coffee agroforest areas compared to the natural forest. Ref. [
24] have reported more seedlings and saplings in natural forests compared to smallholder coffee farms in southwest Ethiopia. The present study shows less regeneration and low basal areas under coffee agroforest.


