Article

Study on the Combustion Characteristics of Mountain Forest Vegetation

School of Resources and Safety Engineering, Central South University, Changsha 410083, China
*
Author to whom correspondence should be addressed.
Forests 2022, 13(9), 1443; https://doi.org/10.3390/f13091443
Submission received: 21 July 2022 / Revised: 6 September 2022 / Accepted: 7 September 2022 / Published: 8 September 2022
(This article belongs to the Section Natural Hazards and Risk Management)

Abstract

:
Leaves from four common tree species in Chinese mountain forests, namely, Symplocos setchuensis Brand, Tarenna mollissima, Loropetalum chinense, and Castanopsis sclerophylla were studied to assess their ignitability. The microstructure of each sample was determined to investigate its effect on combustion performance. Differential thermogravimetric analysis–differential scanning calorimetry (DTA–DSC) was performed to characterize thermal decomposition processes and relate them to flammability and fire resistance. In addition, pyrolysis reaction kinetic models were built, and fitting results were obtained in order to estimate the ignitability of the different abovementioned tree types. In this paper, the activation energy of the lignin decomposition stage was used to determine the fire hazard and ignitability. Regression analysis and correlation tests of microstructural parameters were performed. The results indicated that Castanopsis sclerophylla possessed the greatest fire hazard, followed by Loropetalum chinense, Tarenna mollissima, and Symplocos setchuensis Brand. The results of this study can provide a practical basis for the selection of fire-resistant tree species and forest belts.

1. Introduction

Forest resources play an important role in numerous areas, including atmospheric carbon reduction, animal communities, hydrological turbulence, and consolidated soil [1]. Forests are one of the most important habitats in the Earth’s biosphere. It was reported that the area of forest was measured to be nearly 4.1 billion hectares, accounting for 9.4% of the total land area globally. As is well known, forests are also known as the “lung of the Earth”. By 2017, the total area of forest in China was 220 million hectares, reaching 22.96% coverage rate [2]. Forest fire, a kind of natural disaster, occurs with strong suddenness, great destructiveness, and difficulty during handling and rescue [3,4]. Meanwhile, it is also one of the serious public emergencies occurring worldwide. Affected by factors such as climate change, the incidence of fire accidents gradually increased in recent years. According to statistics from the Food and Agriculture Organization of the United Nations, there are over 220,000 forest fires in the world per year. This caused about 6.465 million hectares of forests burned and loss of 300 million m3 of wood annually [5,6]. Due to its geographical location, Australia experiences prolonged seasonal drought, resulting in frequent forest fires. In 1974, a fire that lasted for four months burned 117 million hectares of forest and shrubland in central Australia (nearly 20% of the national forest area). By the end of 2019, a fire that lasted for about four months as well burned 6.3 million hectares of forest and pastureland in southwestern Australia, heavily affecting the koala habitat. It was estimated that 3 billion wild animals were killed by this disaster [7]. Moreover, the amount of forest fires in the Amazon is large, accompanied by fire spread potentially owing to the vast area and hot climate. On the basis of the literature [8], nearly 100,000 forest fire incidents occurred in the Amazon in 2019, inducing 1 million hectares of land being disturbed. In China, forest fires have also caused serious impacts. For example, on 30 March 2019, the forest fire in Murli County, Liangshan, Sichuan, damaged 20 hectares, while 31 rescuers were killed during firefighting [9].
Risk perception, for example through fire risk rating systems, is therefore of upmost importance. The National Fire Risk Rating System (NFDRS) [10,11] proposed that the risk of forest fire is estimated by the state of combustibles that refers to the moisture content, combustibility of combustibles, loading capacity, and other properties. Fan et al. [12] performed fire prevention and extinguishing measures by analyzing forest fire spreading model and fire behavior. They divided the estimation of the forest fire behavior into three forms, namely, experience, semi-physics, and physical, and described the surface fire radiation spread model in this way. Forest litter has also been studied many times since it is the most important contributor in an early phase of forest fire. Gartner et al. (2004) [13] investigated weight loss of leaf mixtures of different species, demonstrating their discrepancy during the decomposition process. Sariyildiz et al. [14] analyzed nutrient content in soil and decomposition rate of vegetation litter. Vitousek et al. [15] investigated the relationship between the thickness and structure of the litter and the decomposition rate. Liao et al. [16] explored the effect of nitrogen on the decomposition process of some litter. Wang et al. [17] studied the influence of forest litter on the season and comprehensively analyzed the influence of soil temperature, moisture, pH, and relative humidity on the decomposition of litter. Saskia Grootemaat et al. (2015) [18] studied the decomposition process of litter and its relationship between flammability and species. Daniel W. Krix et al. (2018) [19] investigated the flammability changes of leaves in response to environmental gradients. In addition, some scholars study forest fire through chromatography, which can allow for the study the combustion behavior of volatile compounds contained in plant leaves [20,21].
Thermal analysis is widely used in the fire risk research of materials [22,23,24]. Methods such as thermogravimetric analysis (TGA), derivative thermogravimetry (DTG), and differential scanning calorimetry (DSC) are often adopted in the field of heat decomposition. Dimitrakopoulos [25] analyzed the pyrolysis experiments of 12 kinds of biomass combustibles under air conditions, presenting the effectiveness of the TGA method in the verification experiment of the plant combustion mechanism. Zhou et al. [26] applied the cone calorimeter method to study the influence of water content on the burning behavior of vegetation litter. Rodríguez-Añón et al. [27] conducted an evaluation of the energy of forest communities by TGA. Mohalik et al. [28] found the characteristics and classification of spontaneous combustion through TGA and DSC.
Although the burning model of forest fires has been studied by scholars, its mechanism has been rarely analyzed in detail. For example, whether fire outbreak is related to the type of vegetation and why fire intensity is affected by the vegetation type are not clear.
In this paper, leaves from four different tree species, i.e., Symplocos setchuensis Brand (SSB), Tarenna mollissima (TM), Loropetalum chinense (LC), and Castanopsis sclerophylla (CS), were obtained. Microstructures of samples were observed to identify the status of sponge and fence tissues. This provides basic data for regression analysis and correlation tests of microstructural parameters (see Section 3.4). The process of thermal decomposition of the sample was studied through thermogravimetric analysis (TGA). Trend of weight change of samples was analyzed through DTG. In addition, the heat flux and reaction enthalpy were obtained during the process of scanning thermal heat method. In order to calculate the activation energy of the sample, the Arrhenius formula was applied, and the activation energy of lignin decomposition stage was used to determine the fire hazard and ignitability. The reactions and weight losses of the thermal decomposition process were used to establish the fitting equation. Regression analysis and correlation tests of microstructural parameters were performed. The results may inform scientists and forest managers regarding ignitability of abundant tree species in Chinese forests, thus promoting prevention and governance of forest fires.

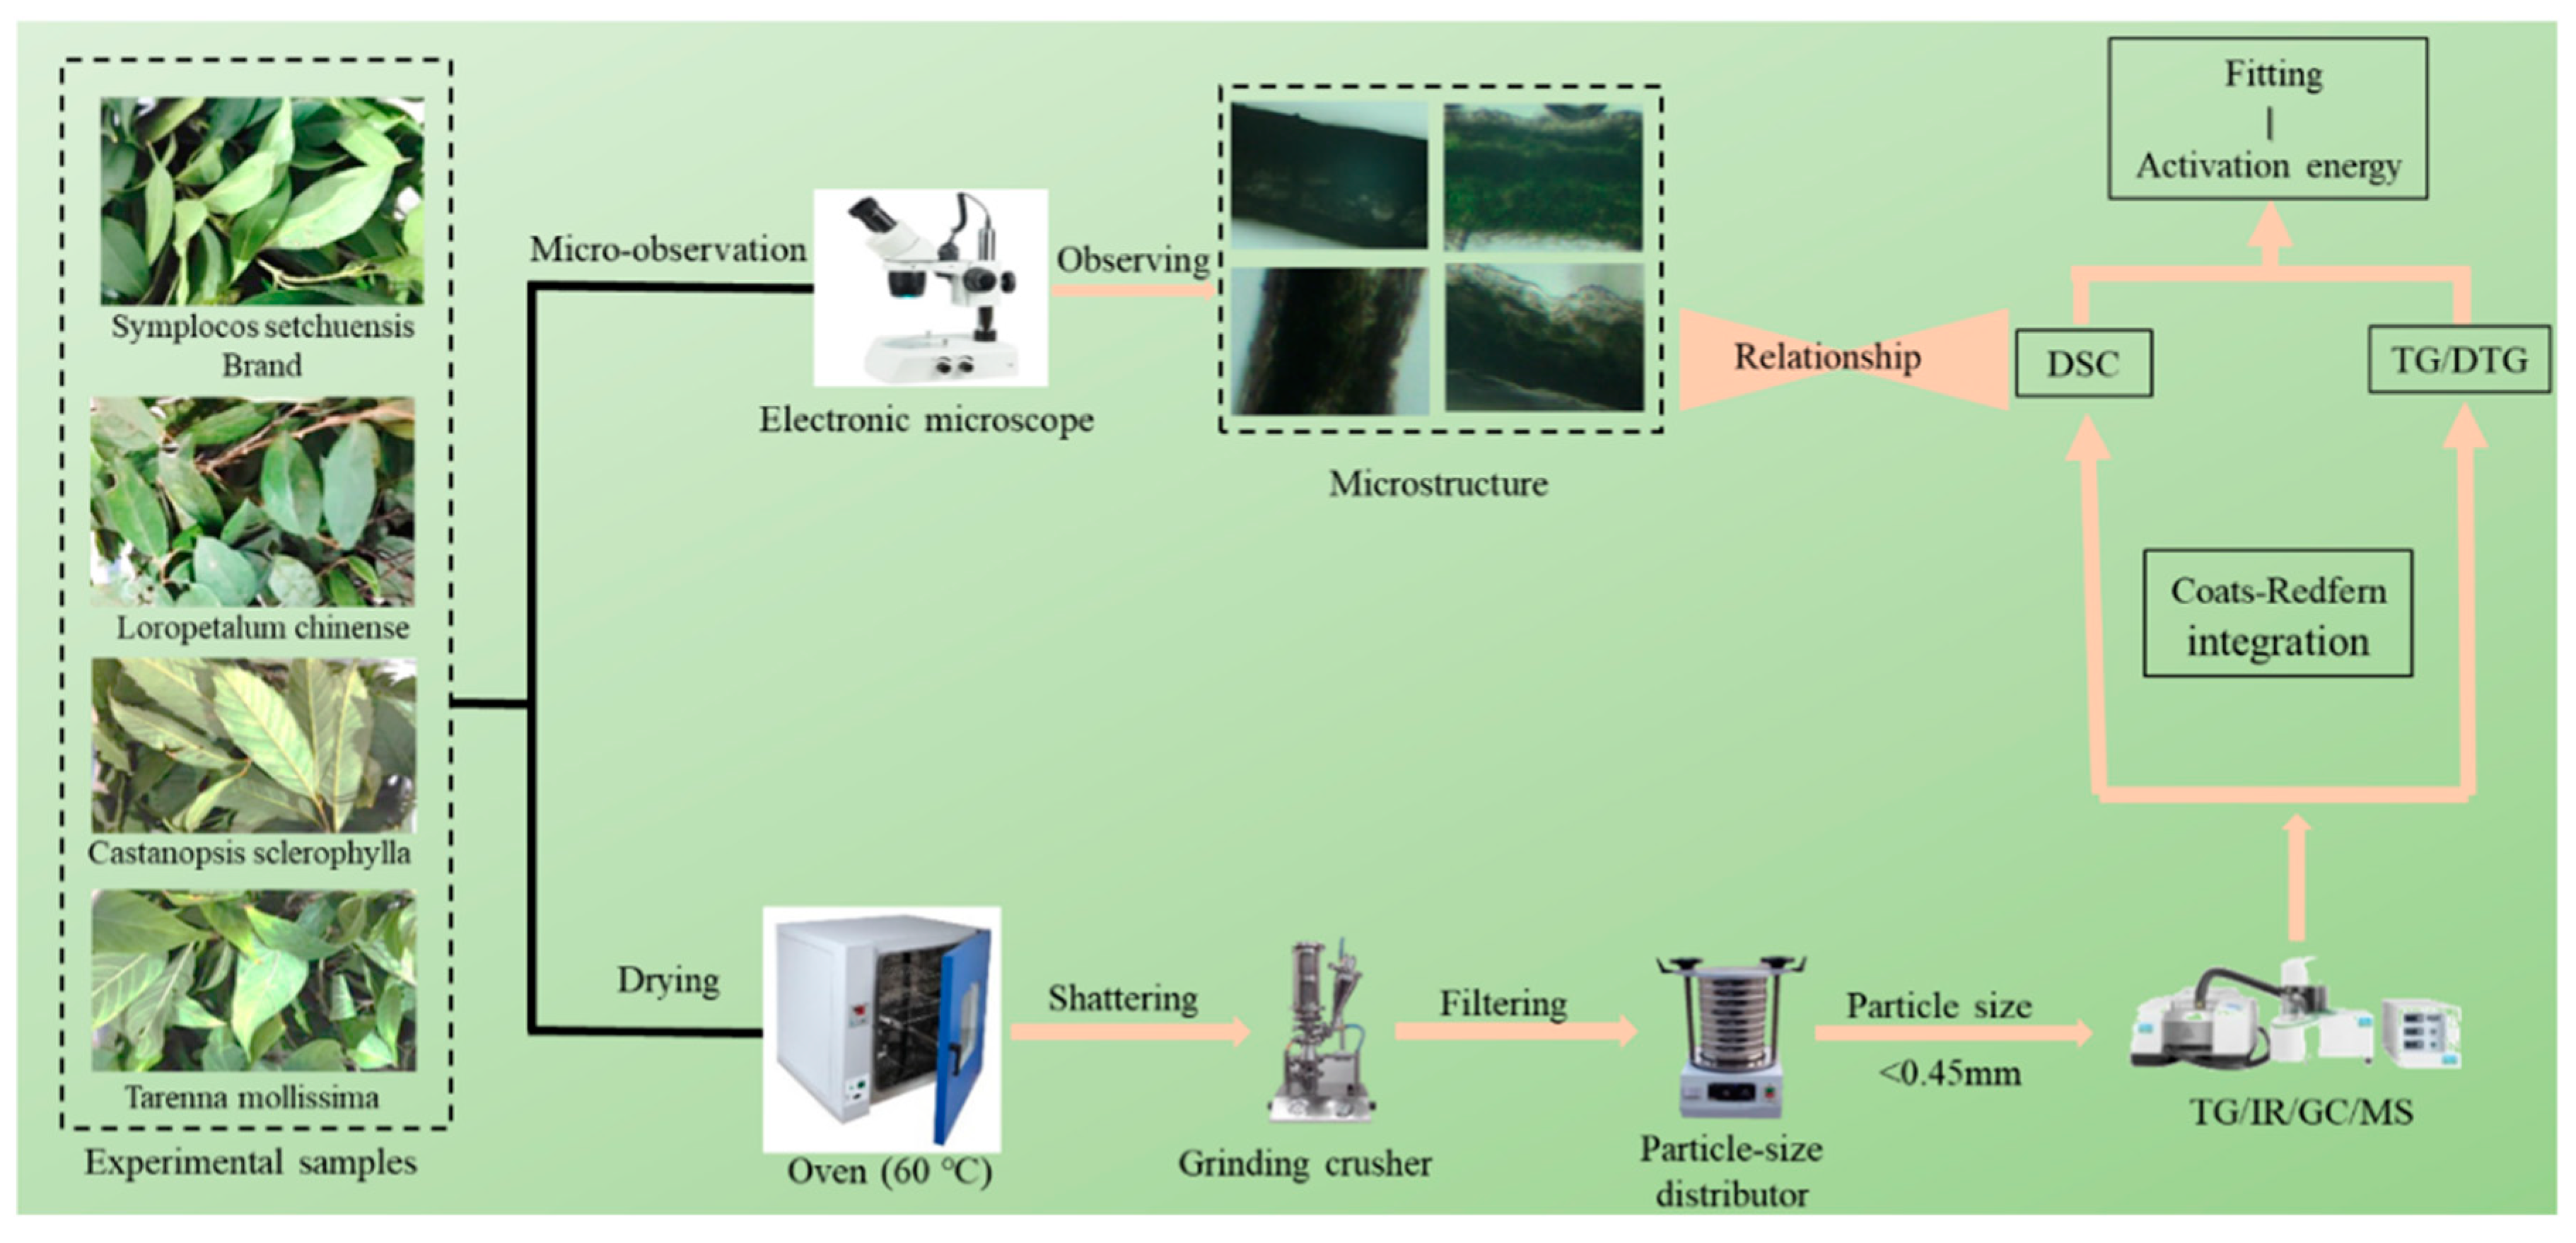
2. Materials and Methods

2.1. Study Site

Hunan Province is a high-incidence region of forest fires in China. The samples selected for this study were collected from Yuelu Mountains, Changsha, Hunan Province (112°44′–112°48′ E, 28°20′27″ N), China, with a length of about 4 km from north to south, a width of 1.2 km from east to west, and a main area of 6 km2, and the outer protection zone is about 2 km2. The main peak of Yuelu Mountain is 300.8 m above sea level. The climate is mild, the annual average temperature is 17 °C, the highest daily temperature is 40.6 °C, and the annual average rainfall is 1200~1400 mm. The Yuelu Mountains are rich in biological resources, with a total forest coverage area of 533.33 hm2, and the covering of forestry is 96%. The vegetation type of Yuelu Mountain is dominated by typical subtropical evergreen broad leaf forests and subtropical temperate coniferous forest. There are 977 species of plants in the area, belonging to 174 families and 597 genera; among them, 555 species of wild plants belong to 117 families and 403 genera. A total of 14 different plant communities were formed [29].

2.2. Samples Preparation

The leaf is the main component affecting the occurrence and spread of forest fires. Its litter is regarded as the most flammable ingredient located on the surface of mountain forests. In this study, four categories of leaves in the Yuelu Mountains in Changsha, Hunan Province, China, were selected as experimental samples. These originated from Symplocos setchuensis Brand (SSB), Tarenna mollissima (TM), Loropetalum chinense (LC), and Castanopsis sclerophylla (CS). The processing procedure for the samples is as follows. First, the average area and weight of fresh leaves were measured. The leaves were subsequently placed in the oven (60 °C) to remove moisture from their surface, which is conducive to grinding them into small pieces. Before grinding, the leaves were weighted, and the weight loss (this far) was registered. In this case, the average moisture contents were calculated. Dried leaves were grinded by the pulverizer (FK-B, 200 w, 50 Hz) and screened for samples with a diameter below 0.45 mm. The four leaves (particles after being crushed) were weighed at about 20–25 mg for experiments (SSB: 20.929 mg; TM: 20.111 mg; LC: 21.300 mg; CS: 22.664 mg). Finally, the acquired samples were sealed.

2.3. Laboratory Experiments

The experimental flowchart is shown in Figure 1.

2.3.1. Microstructure

With a goal of exploring the effect of the microstructure on combustion performance of vegetations, cross-sectioned specimens of four samples were prepared as follows. Fresh leaves from each tree species were placed flat, which were taken a strip sample with a width of 0.5 cm. Electron microscopy (MO-XRG2000) was used in this experiment to detect cross-section microstructures of samples, and the thickness values of cross-section epidermis, spongy tissue, palisade tissue, and interspaces were gained.

2.3.2. DTG–DSC

In this study, a thermogravimetric infrared GC–MS analyzer was used for thermal analysis, achieving high reproducibility of the TG curves of the same sample and acquiring related parameters. We used 99.99 N2 as the carrier gas. Under the air atmosphere, gas flow was fixed to be 60 mL/min. The temperature was raised from 25 to 650 °C with a rate of 20 °C/min. The weight of a single sample was 15–20 mg. Experiments were independently conducted on the dried samples (SSB, TM, LC, and CS).

2.4. Pyrolysis Reaction Kinetic Model

In this study, the Coats–Redfern method was chosen to integrate the constant heating process [30]. The reaction rate of the pyrolysis process can be obtained by differentiating the conversion rate against time, the kinetic mechanism function of the differential form can be expressed as f(α), and the reaction rate is expressed as
d α dt = k 0 f α
where α represents conversion rate, and k0 is the reaction rate constant. k0 can also be expressed by the Arrhenius formula as
k 0 = A e E R T
where A and E represent pre-exponential factor and activation energy, respectively. R is gas constant that is defined as 8.314 J mol/K.
For the pyrolysis reaction of biomass, it can be simplified as
S0 (solid) → S1 (solid) + G (gas)
DSC is used for analysis, and the reaction conversion rate can be obtained:
α = H H 0
where H and H0 represent cumulative value and the total heat effect of the reaction, respectively.
f α = 1 α n
It is generally assumed that f(α) has no relation with T and t, which is only used to characterize α (degree of reaction).
β = dT dt
The baseline is subtracted from the DSC curve that then is integrated in order to obtain the H at the corresponding temperature, namely, the DSC correction integral curve. The reaction equation is
d α dt = k 0 f α β = 1 α n A e E R T β
On the basis of the selected Coats–Redfern integral method, it can obtain
n 1 ,   ln 1 1 α 1 n T 2 1 n = ln AR β E 1 2 RT E E RT n = 1 , ln ln 1 α T 2 = ln AR β E 1 2 RT E E RT
For the activation energy of majority of biomass, E > > 1, it is indicated that 2RT/E < < 1. It is assumed that (1-2RT/E) ≈ 1; the left side of the equation can be regarded as a linear relationship with 1/T:
Y = a + bZ
where a = ln AR β E , b = E R .
Different n are selected; the independent variable is 1/T, and the dependent variable is the left part of the equal sign. From this, the x-y coordinate diagram can be obtained. The slope and intercept of the obtained straight line is calculated, the activation energy and pre-exponential factor of the sample is obtained, and then linear regression analysis is performed to compare the correlation of the correlation coefficients, thereby calculating the combustion kinetic parameters of the DSC curve.
α = m 0 m m 0 m
where m0 is the initial mass of the sample (g) and m is the ash residue (g).
In these equations, T means temperature, and t represents time.

3. Results and Discussion

3.1. Microstructure

It is believed that water on the surface of the leaf evaporates firstly, and then inside water evaporates by diffusion to the surface during heating. Under the same heating conditions, the speed of water evaporation and diffusion heavily depend on the microstructure of the leaf [31], Owing to its compact structure, a lower percentage of palisade tissue usually results in a larger intercellular space of plant leaves. This contributes to faster water transfer inside the leaf. Meanwhile, spongy tissue has the opposite effect. These results are consistent with the literature [32,33]. With the evaporation of water, the surface temperature decreases, accompanied by a lower concentration of released flammable gas, contributing to weakened combustibility of the leaf. The microstructural parameters of the leaf samples are presented in Table 1.

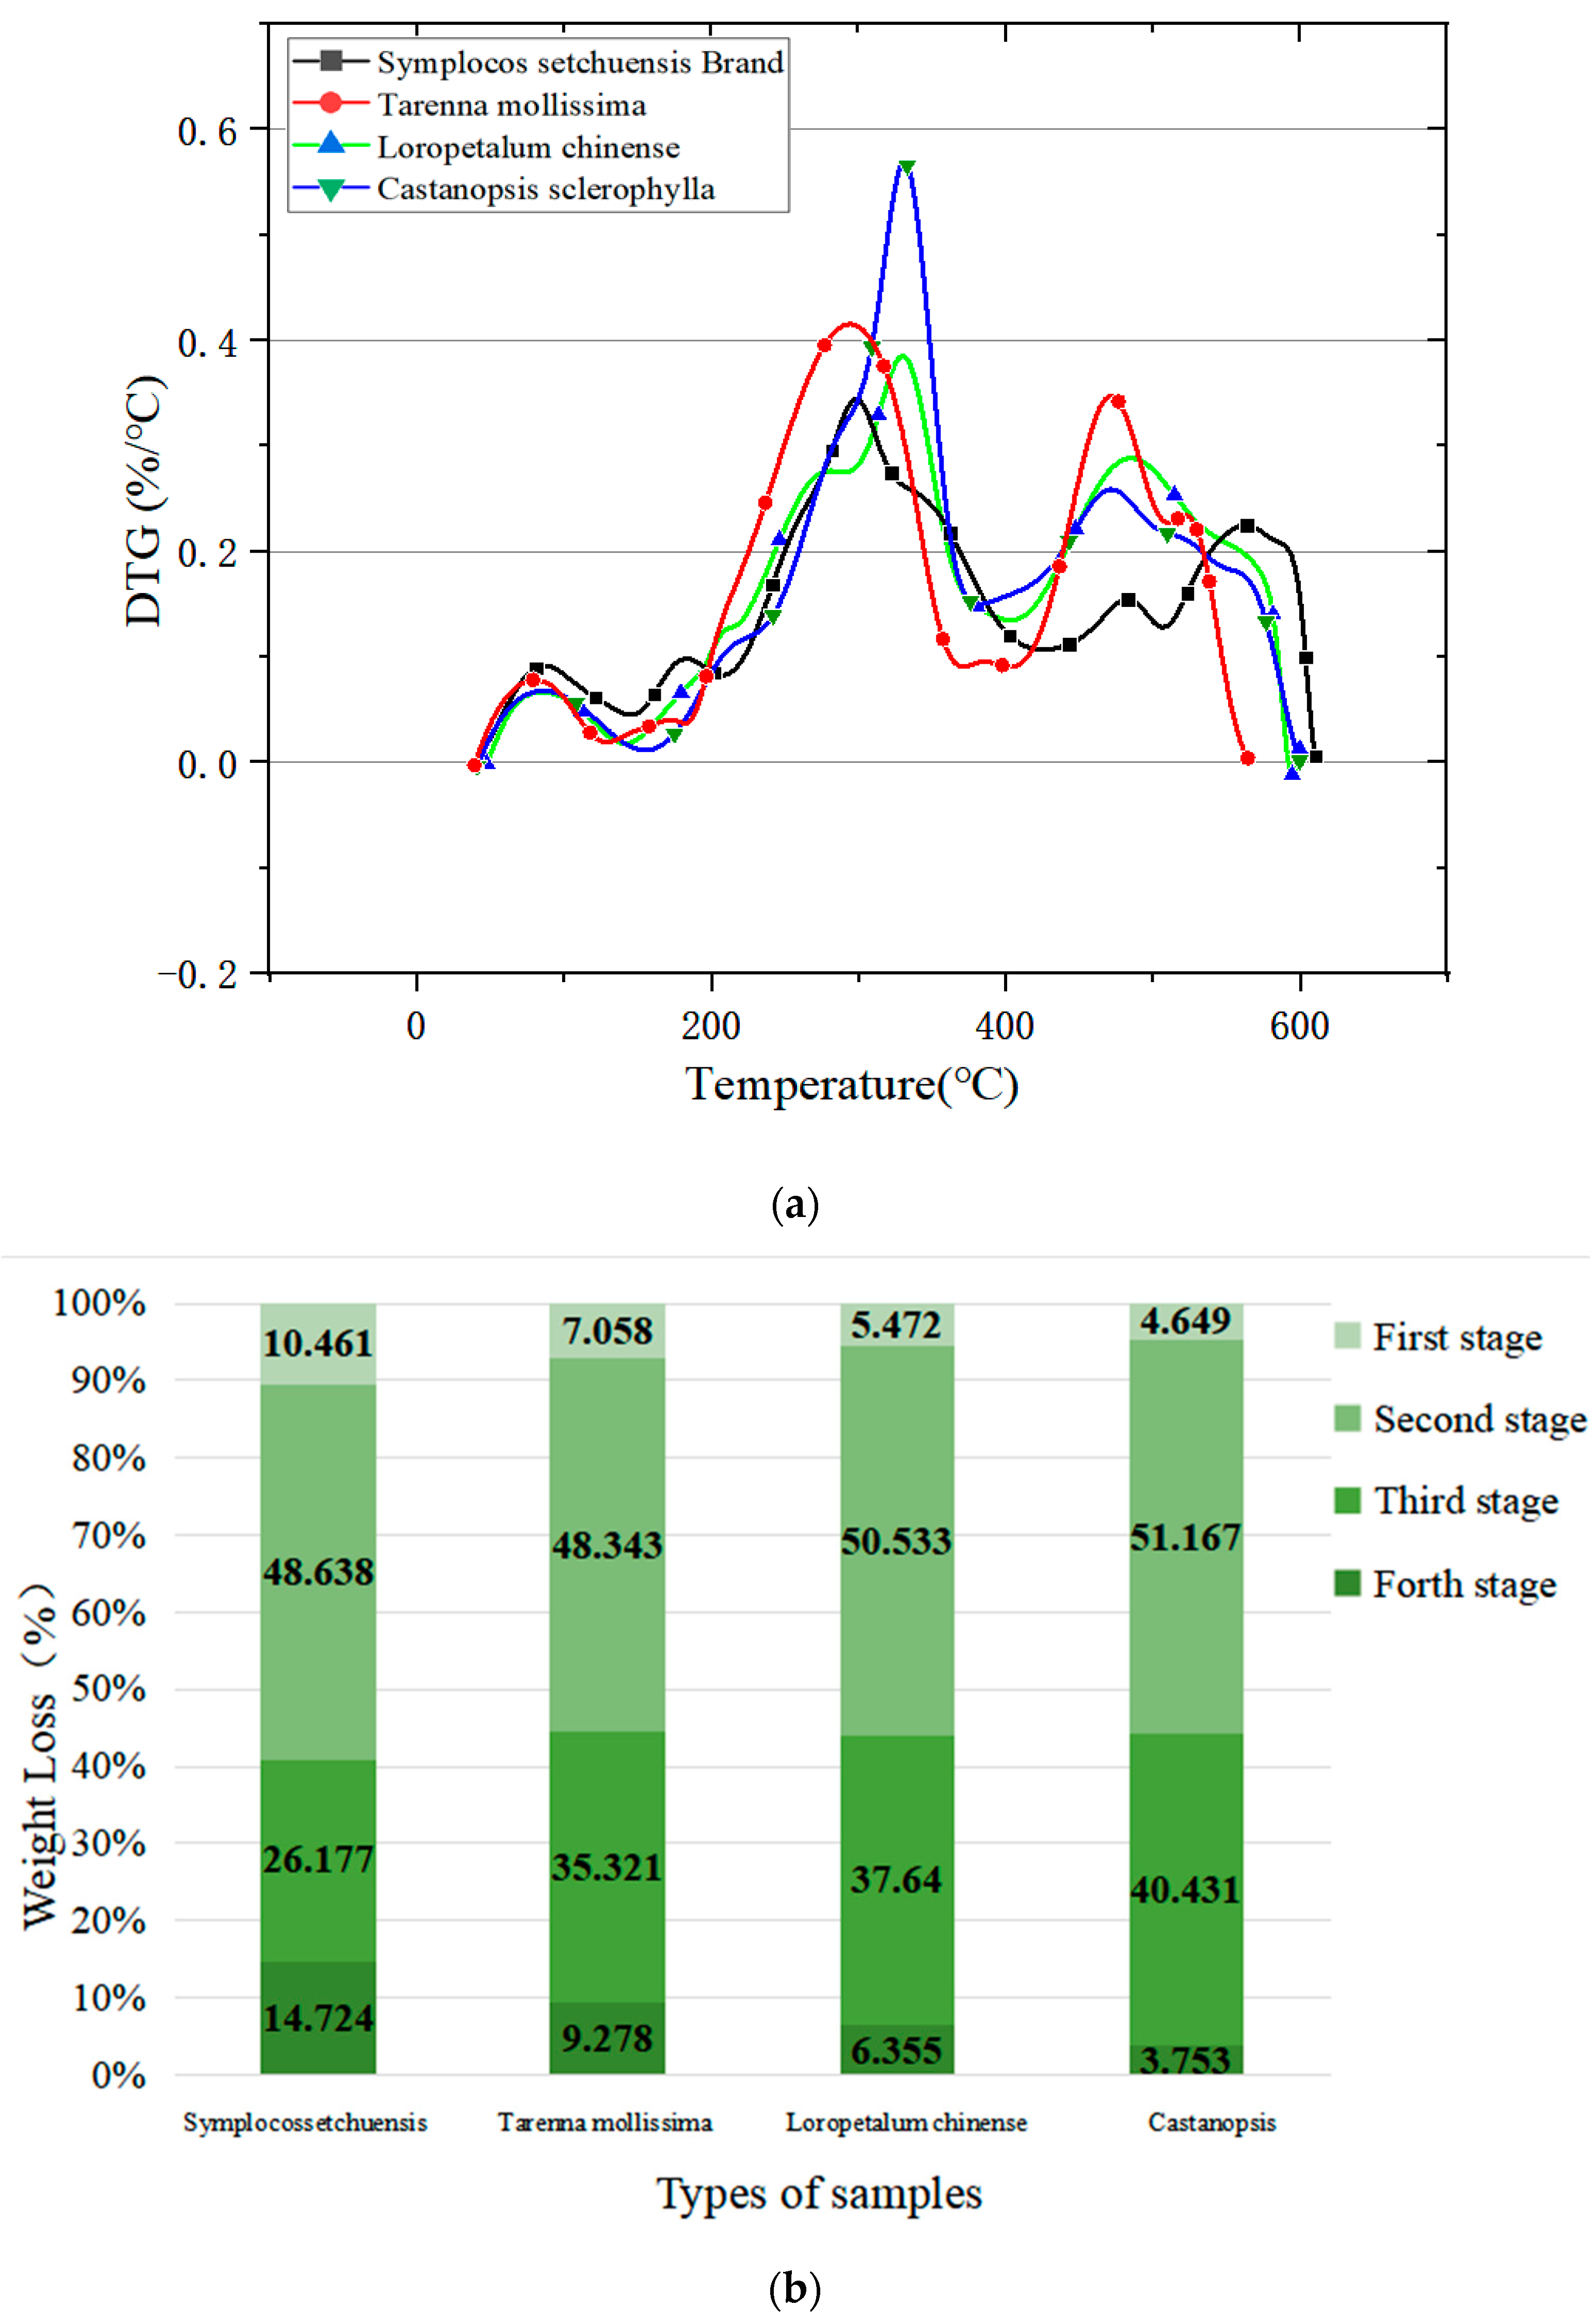
3.2. Results of TG–DTG

3.2.1. Analysis of TG

The weight loss process of samples, namely, TG, is shown in Figure 2, where temperature and ratio of residual to initial weight are arranged as abscissa and ordinates. Figure 2 indicates that four samples had different weight loss rates. TM firstly reached its constant weight. Meanwhile, SSB had the largest residual weight, followed by TM, LC, and CS.

3.2.2. Analysis of DTG

The curve of weight loss rate (DTG) can be acquired through differential calculation. On the basis of the findings shown in Figure 3, heating weight loss process can be divided into four stages, namely, dehydration, holocellulose decomposition, lignin decomposition, and ash stages. The dehydration stage is that the leaves lose internal water, which is usually considered to be the initial “weight loss peak valley” in the DTG curves. The holocellulose decomposition stage refers to the process of thermal decomposition of holocellulose inside leaves, which is the process from the first “weightless peak valley” (the first time the curve fell to the lowest point) to the second one in the DTG curve. The lignin decomposition stage is the process of thermal decomposition of lignin inside the plant leaves, which is the process from the second “weight loss peak” of to the end in the DTG curve. The last stage, namely, residual ash stage, symbolizes the end of the internal weight loss process. During this phase, the weight of the leaf tends to be stable. Residues consist of solid coke and non-decomposable ash. The duration of each stage was analyzed. The weight of loss in the first three stages and residual ash were calculated (Figure 3b), which was derived by separating the different stages of the TGA curve (Figure 2).
As shown in Figure 3, dehydration stage occurred between 30 and 180 °C. The weight loss fraction of the four samples was between 4.649% and 10.641%. Once this stage finished, combustible gas on the surface was released and it chemically reacted with oxygen in the air, resulting in increasing weight loss rate. Evaporation of water vapor reduced surface temperature and diluted the concentration of combustible gases. Therefore, water content can be used to characterize the heat stability and flame retardancy. Higher water content implies lower ignitability.
Due to poor stability of hemicellulose, it was decomposed during the range of 225–325 °C. The weight loss rate of the four samples in this process was 48.343%–51.167%. Since a mass of flammable gas was generated in this stage, the decomposition rate of holocellulose (corresponding to the formation rate of flammable gas) can be used to characterize thermal stability and thereby fire hazard of the respective species. Specifically, higher weight loss rate usually implies larger fire hazard.
In the temperature range 380–630 °C, lignin decomposition prevailed. The weight loss for the different species varied between 26.177% and 40.431%. As is well known, lignin is a complex organic polymer. Its pyrolysis process features a long period, large temperature span, and complicated reaction. Specifically, the pyrolysis process is usually accompanied by intense combustion, which releases massive heat. In this case, flame temperature increases with the decomposition and combustion of lignin, resulting in expansion of fire and acceleration of decomposition. On this basis, the period and weight loss rate of lignin can be used to identify the ignitability and fire hazard of samples. A large content of lignin implies a longer period of lignin decomposition, entailing intensive heat accumulation and strong ignitability.
After three stages of thermal decomposition, the residual ash content was between 3.753% and 14.724%. Owing to stability and non-ignitability of residual ash and solid coke, they can be used to symbolize fire resistance and flame retardancy of the samples. It can be inferred that the sample with higher residual weight naturally means excellent flame retardancy and fire resistance, which is suitable for fire prevention forests.
Comprehensively, for SSB, it has the largest weight loss rate in the water loss stage and the highest water content, as well as the largest residual ash content after the thermal decomposition. Accordingly, SSB possesses the strongest flame retardancy and fire resistance. Furthermore, during the holocellulose decomposition stage, SSB has a lower weight loss rate and release rate of combustible gas, causing its good thermal stability. During the stage of lignin decomposition, it has the least decomposition period, weight loss rate, and heat generated by the combustion reaction, indicating its weakest fire hazard. By analyses on other samples using the same procedure, fire resistance, flame retardancy, thermal stability, and fire hazard of four samples can be ranked as follows: fire resistance and flame retardancy: SSB > TM > LC > CS; thermal stability: SSB > TM > LC > CS; fire hazard: CS > LC > TM > SSB.

3.2.3. Analysis on Pyrolysis Kinetics of TGA–DTG
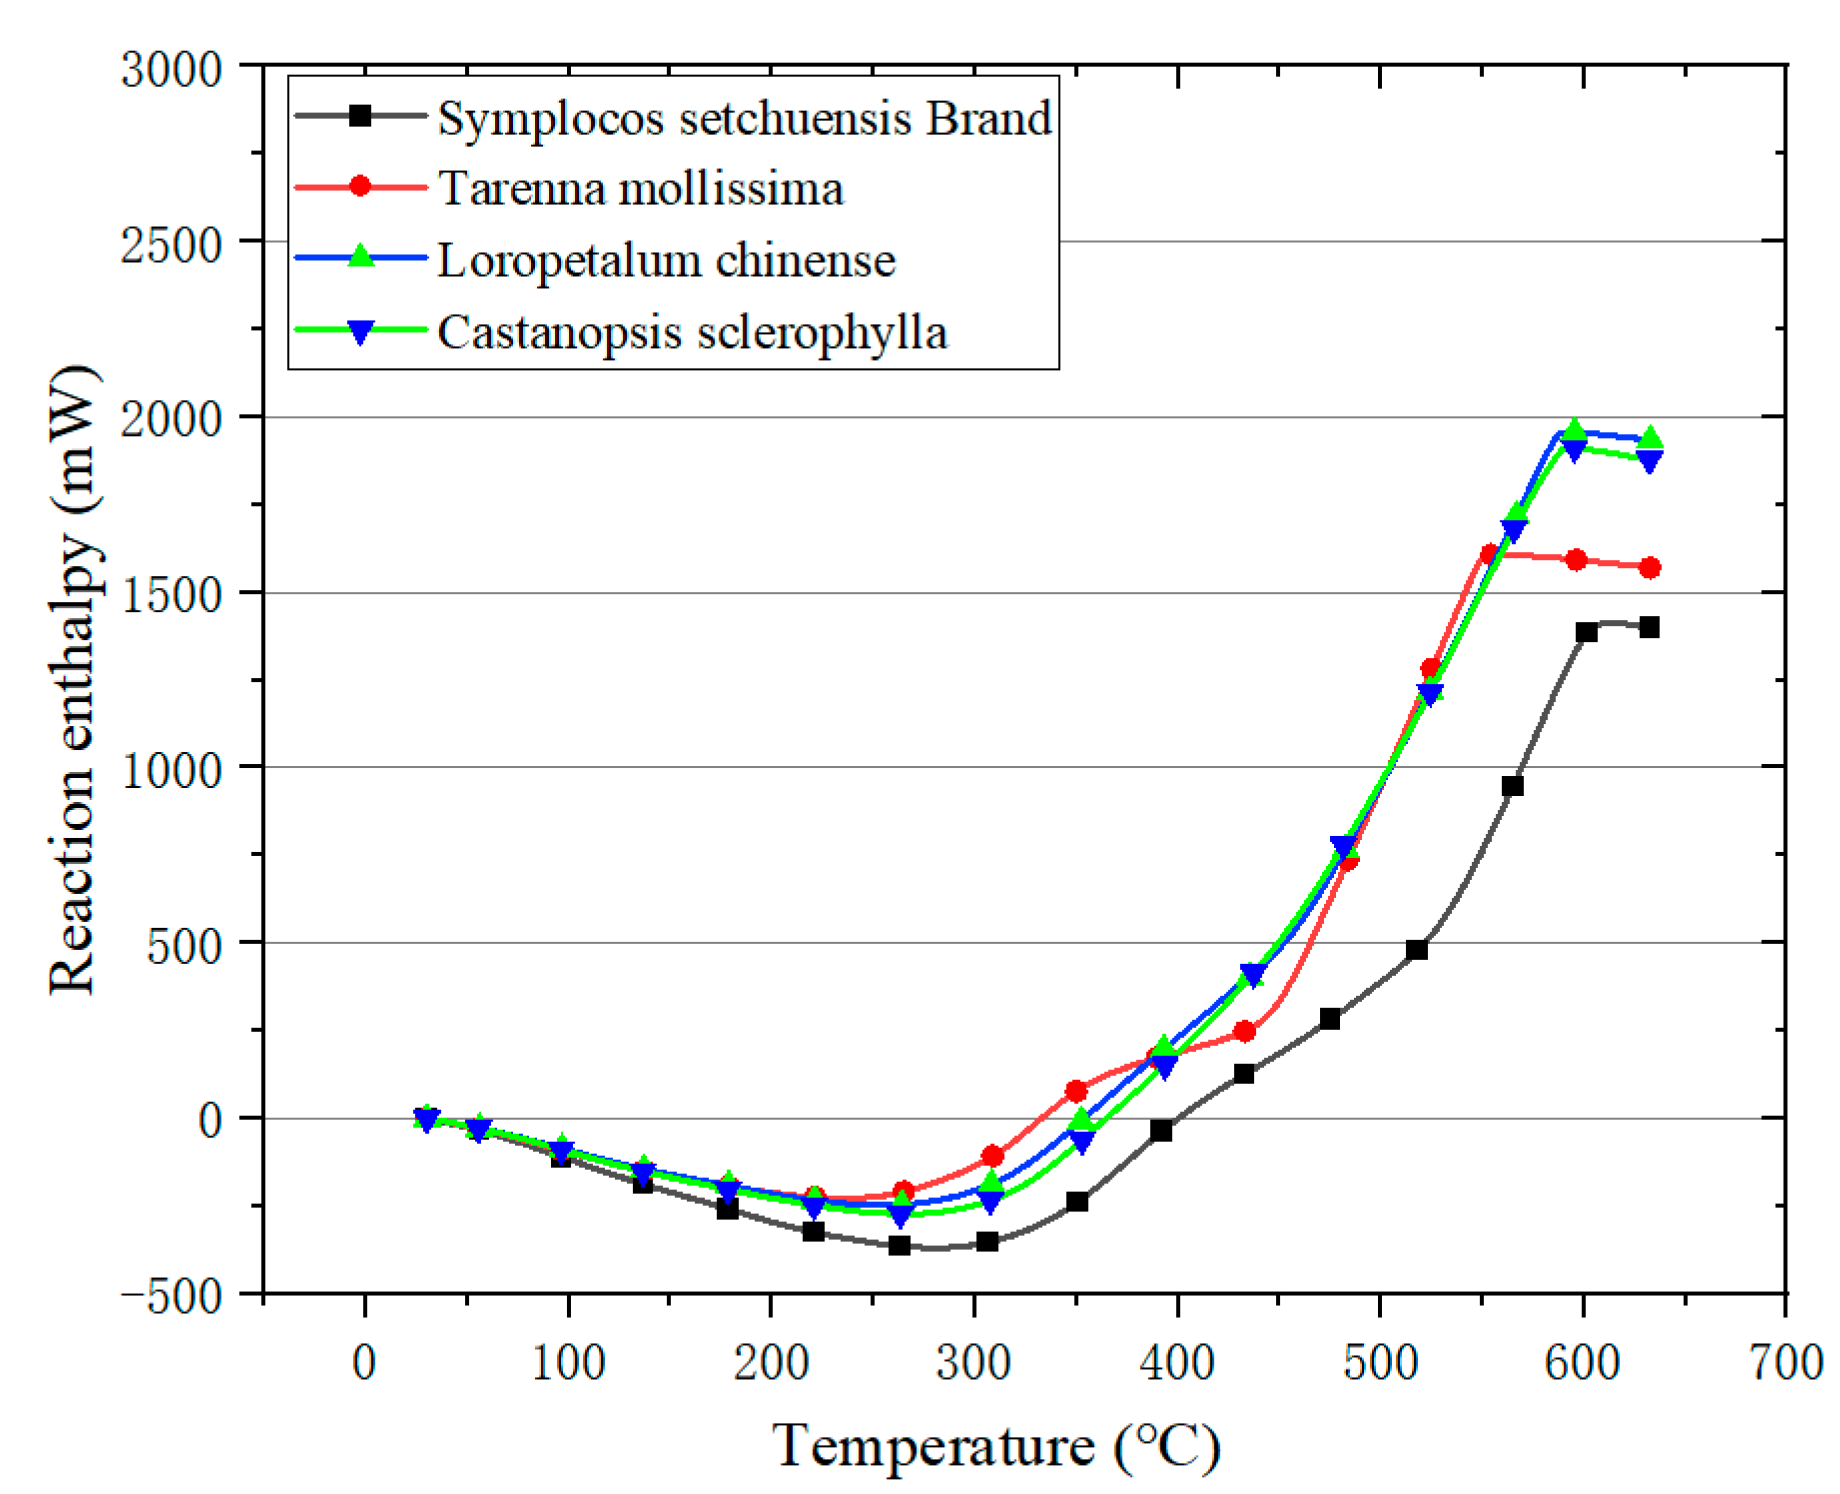
The holocellulose decomposition and lignin decomposition stages in the thermal decomposition process were fitted using the Coats–Redfern integral method, which can obtain pyrolysis kinetic models of two independent stages. After regression analysis, a first-order staged pyrolysis kinetic model was established, and the Arrhenius formula was used in the two stages to calculate the activation energy (denoted by E) and pre-exponential factor (denoted by A) of different reaction stages. The analysis results are shown in Table 2.
As shown in Table 2, the activation energy in the thermal decomposition of holocellulose in the air atmosphere ranged between 3.587 and 4.842 kJ·mol−1, while the respective activation energy of lignin decomposition was between 13.36 and 17.34 kJ·mol−1. During the holocellulose decomposition stage, the activation energies of the four samples were overall low, causing little effect on the fire hazard. In addition, lignin is the main combustion component, which upon ignition releases massive heat. Hence, it is regarded as the main reason for the expansion of forest fires [34]. Table 2 shows that CS had the smallest activation energy for lignin decomposition and is thereby easily ignitable. A lower amount of energy is required for lignin decomposition to occur, generating its highest ignitability. The results of Table 2 can effectively verify the heat disintegration dynamic process of the leaves, which is also consistent with the results of similar research of other scholars [35,36,37]. In contrast, SSB has the opposite result. Comprehensively, the decomposition process of lignin is featured by a high-speed and intense reaction, which is the main reason for spread and expansion of fire. In this paper, the activation energy of the lignin decomposition stage is used to determine the fire hazard and ignitability. It can be inferred that CS has the highest fire risk, followed by LC, TM, and SSB.

3.3. Results of DSC

3.3.1. Analysis on DSC

Results of DSC analysis of four samples are shown in Figure 4.
The DSC curve characterizes the heat flux per unit weight of each sample during the thermal decomposition process. As previously mentioned, decomposition of lignin is the main reason for the expansion and spread of the fire, and the main stage of the combustion. Therefore, the lignin decomposition stage is the key section during exploring the fire hazard of the sample. It is mainly manifested in the width and value of the exothermic peak in the DSC curve. It should be stated that the value and width of the exothermic peak can characterize the intensity and duration of the exothermic reaction, respectively. Generally, a faster rate of combustion is accompanied by greater heat release and heat accumulation, leading to higher fire spread potential. As shown in Figure 4, both SSB and TM had two exothermic peaks (SSB: 355 and 595 °C; TM: 345 and 535 °C). After the first exothermic peaks of two samples, the DSC curve showed a downward trend, demonstrating that their holocellulose and lignin decomposition processes are discontinuous. Another finding is that the second exothermic peak of TM was significantly higher than SSB, while LC and CS only had one obvious exothermic peak (exothermic peak: LC < CS, both 585 °C). Differently, the exothermic peak value of LC was lower than that of CS, illustrating that a continuous exothermic process caused heat accumulation, as indicated by Figure 4. Moreover, the values of exothermic peaks of LC and CS were markedly higher than those of SSB and TM. Therefore, it can be inferred that CS had the highest fire hazard, followed by LC, TM, and SSB.

3.3.2. Reaction Enthalpy Analysis

As shown in Figure 5, reaction enthalpy of all samples showed a similar evolution that first was endothermic and then exothermic. Additionally, reaction enthalpy decreased after it reached the peak value, which was the cooling process after the combustion reaction. As shown in Section 3.2.1, the thermal decomposition process is comprised of four stages. During the first phase, the sample continues to absorb heat with inside water evaporation, resulting in a negative reaction enthalpy with a growing absolute value. Once cellulose was decomposed, the endothermic process was mitigated. However, when temperature reached the ignition point of the sample (260–300 °C), the exothermic reaction accelerated, causing increasing reaction enthalpy until the reaction ended. It should be noted that the reaction enthalpy value at the end of the thermal decomposition process represents the total heat release during the reaction process. Figure 5 indicates that the total reaction enthalpy of LC and CS was significantly larger than that of samples SSB and TM, illustrating that the reaction heat of LC and CS was greater than that of SSB and TM. According to DSC analysis, greater heat of reaction naturally causes faster fire spread. Therefore, the fire risk of LC and CS was higher than that of SSB and TM, and fire risk of SSB was the least. It can be inferred that fire risk of LC or CS was higher than TM.

3.3.3. Analysis on Pyrolysis Kinetics of DSC

The DSC curves obtained by the differential scanning calorimetry process were model-fitted by means of the Coats–Redfern integration method, and pyrolysis kinetic models of the four samples were individually obtained. After regression analysis, a first-order staged pyrolysis kinetic model was established, and the Arrhenius formula was applied to the reaction process to obtain the activation energy (denoted by E) and pre-exponential factor (denoted by A) of the reaction. The analysis results are shown in Table 3. In the table, H0 is the maximum value after integrating the curve in Figure 5 (that is, the accumulation of the heat permission of various samples).
In Table 3, there is one equation for each species, while in Table 2, there is one for each decomposition reaction. Meanwhile, the temperature range in Table 3 started “within the temperature of cellulose decomposition” and reached the highest temperature in the experiments. According to Table 3, effective temperature ranges in the thermal decomposition kinetic models of the four samples were all after the cellulose decomposition, namely, the point when the combustion reaction begins and reaction enthalpy reaches a positive value. The activation energies of four samples were similar, namely, 32 kJ/mol. Therefore, thermal stability and fire hazard of the sample cannot be directly determined, which also needs to be verified by the aforementioned study. In addition, the results of Table 3 also verify the thermal decomposition process of the leaves from another angle (thermal flow during the thermal decomposition process), which also had the same conclusion in similar studies [35,38,39].

3.4. Regression Analysis and Correlation Test

By using an electron microscope, the microstructure parameters of four samples were obtained. According to the data presented in Table 4, in this study, the thickness of sponge tissue/the thickness of palisade tissue (X) was used as the main research index. In the thermal decomposition reaction, pyrolysis water loss (P), the residual ash after the decomposition reaction (M), the exothermic peak of the DSC curve shown in Figure 4 (H), and combustion induction time t (i.e., the duration of the endothermic period), are involved. (In Figure 5, the time required from the starting point to the minimum point of the curve is t.) A larger exothermic value per unit weight of the sample can result in shorter combustion induction time, causing higher fire risk. Therefore, H/t is defined as the risk degree (Y), which is used to characterize the flame retardant ability and fire hazard of combustibles [40]. The correlation test was carried out on the X of the four samples to P, M, and Y, and they were fitted to establish the fitting equation.

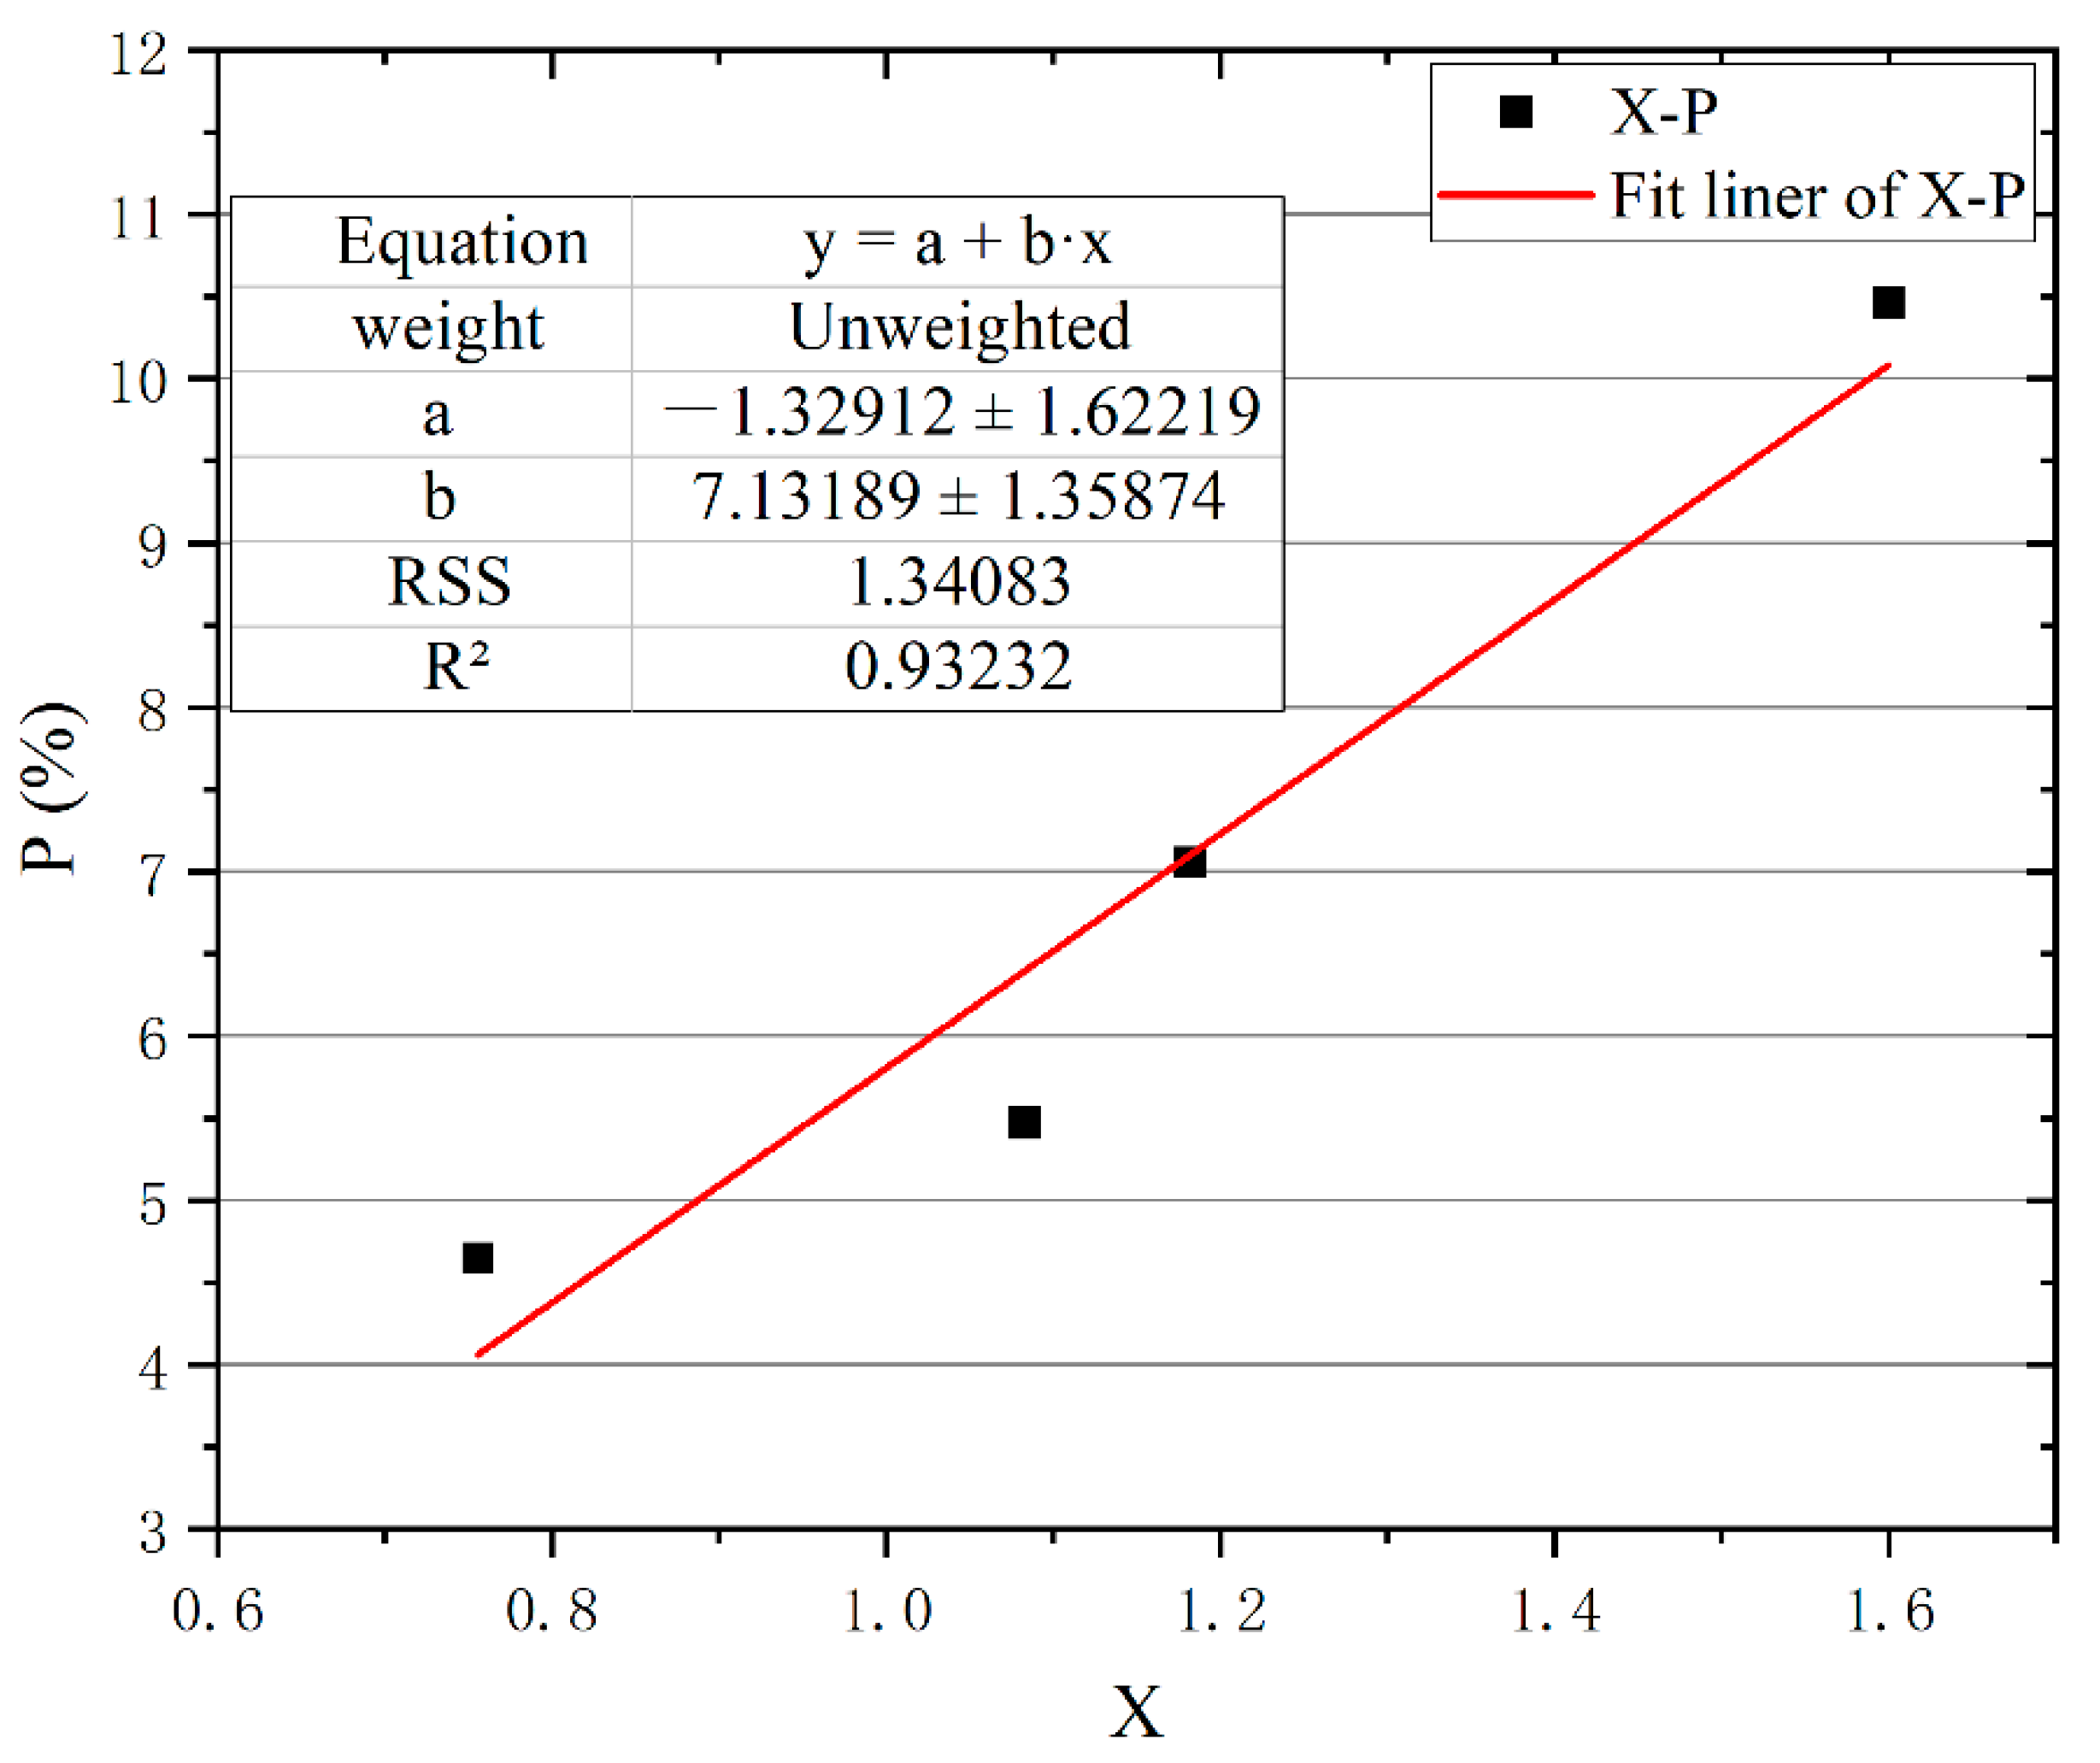
3.4.1. Microstructure Parameters and Pyrolysis Water Loss (P)

Pearson correlation analysis and significance test were performed on the thickness of sponge tissue/the thickness of palisade tissue (X) of the pyrolysis water loss (P) (Table 5). The Pearson correlation coefficient r was 0.966 (larger than 0.8); therefore, it is regarded as a strong correlation. It can also be further determined to be a strong correlation according to Sig. index = 0.017 < 0.05, and therefore there is a strong linear correlation between X and P.
As shown in Figure 6, regression analysis was performed on the thickness of sponge tissue/the thickness of palisade tissue (X) and the pyrolysis water loss (P), and the regression equation was obtained:
P = −1.32912 + 7.13189X, R2 = 0.93232
Higher sponge tissue fraction in the sample caused greater water loss during the thermal decomposition process, and there was a strong linear correlation.

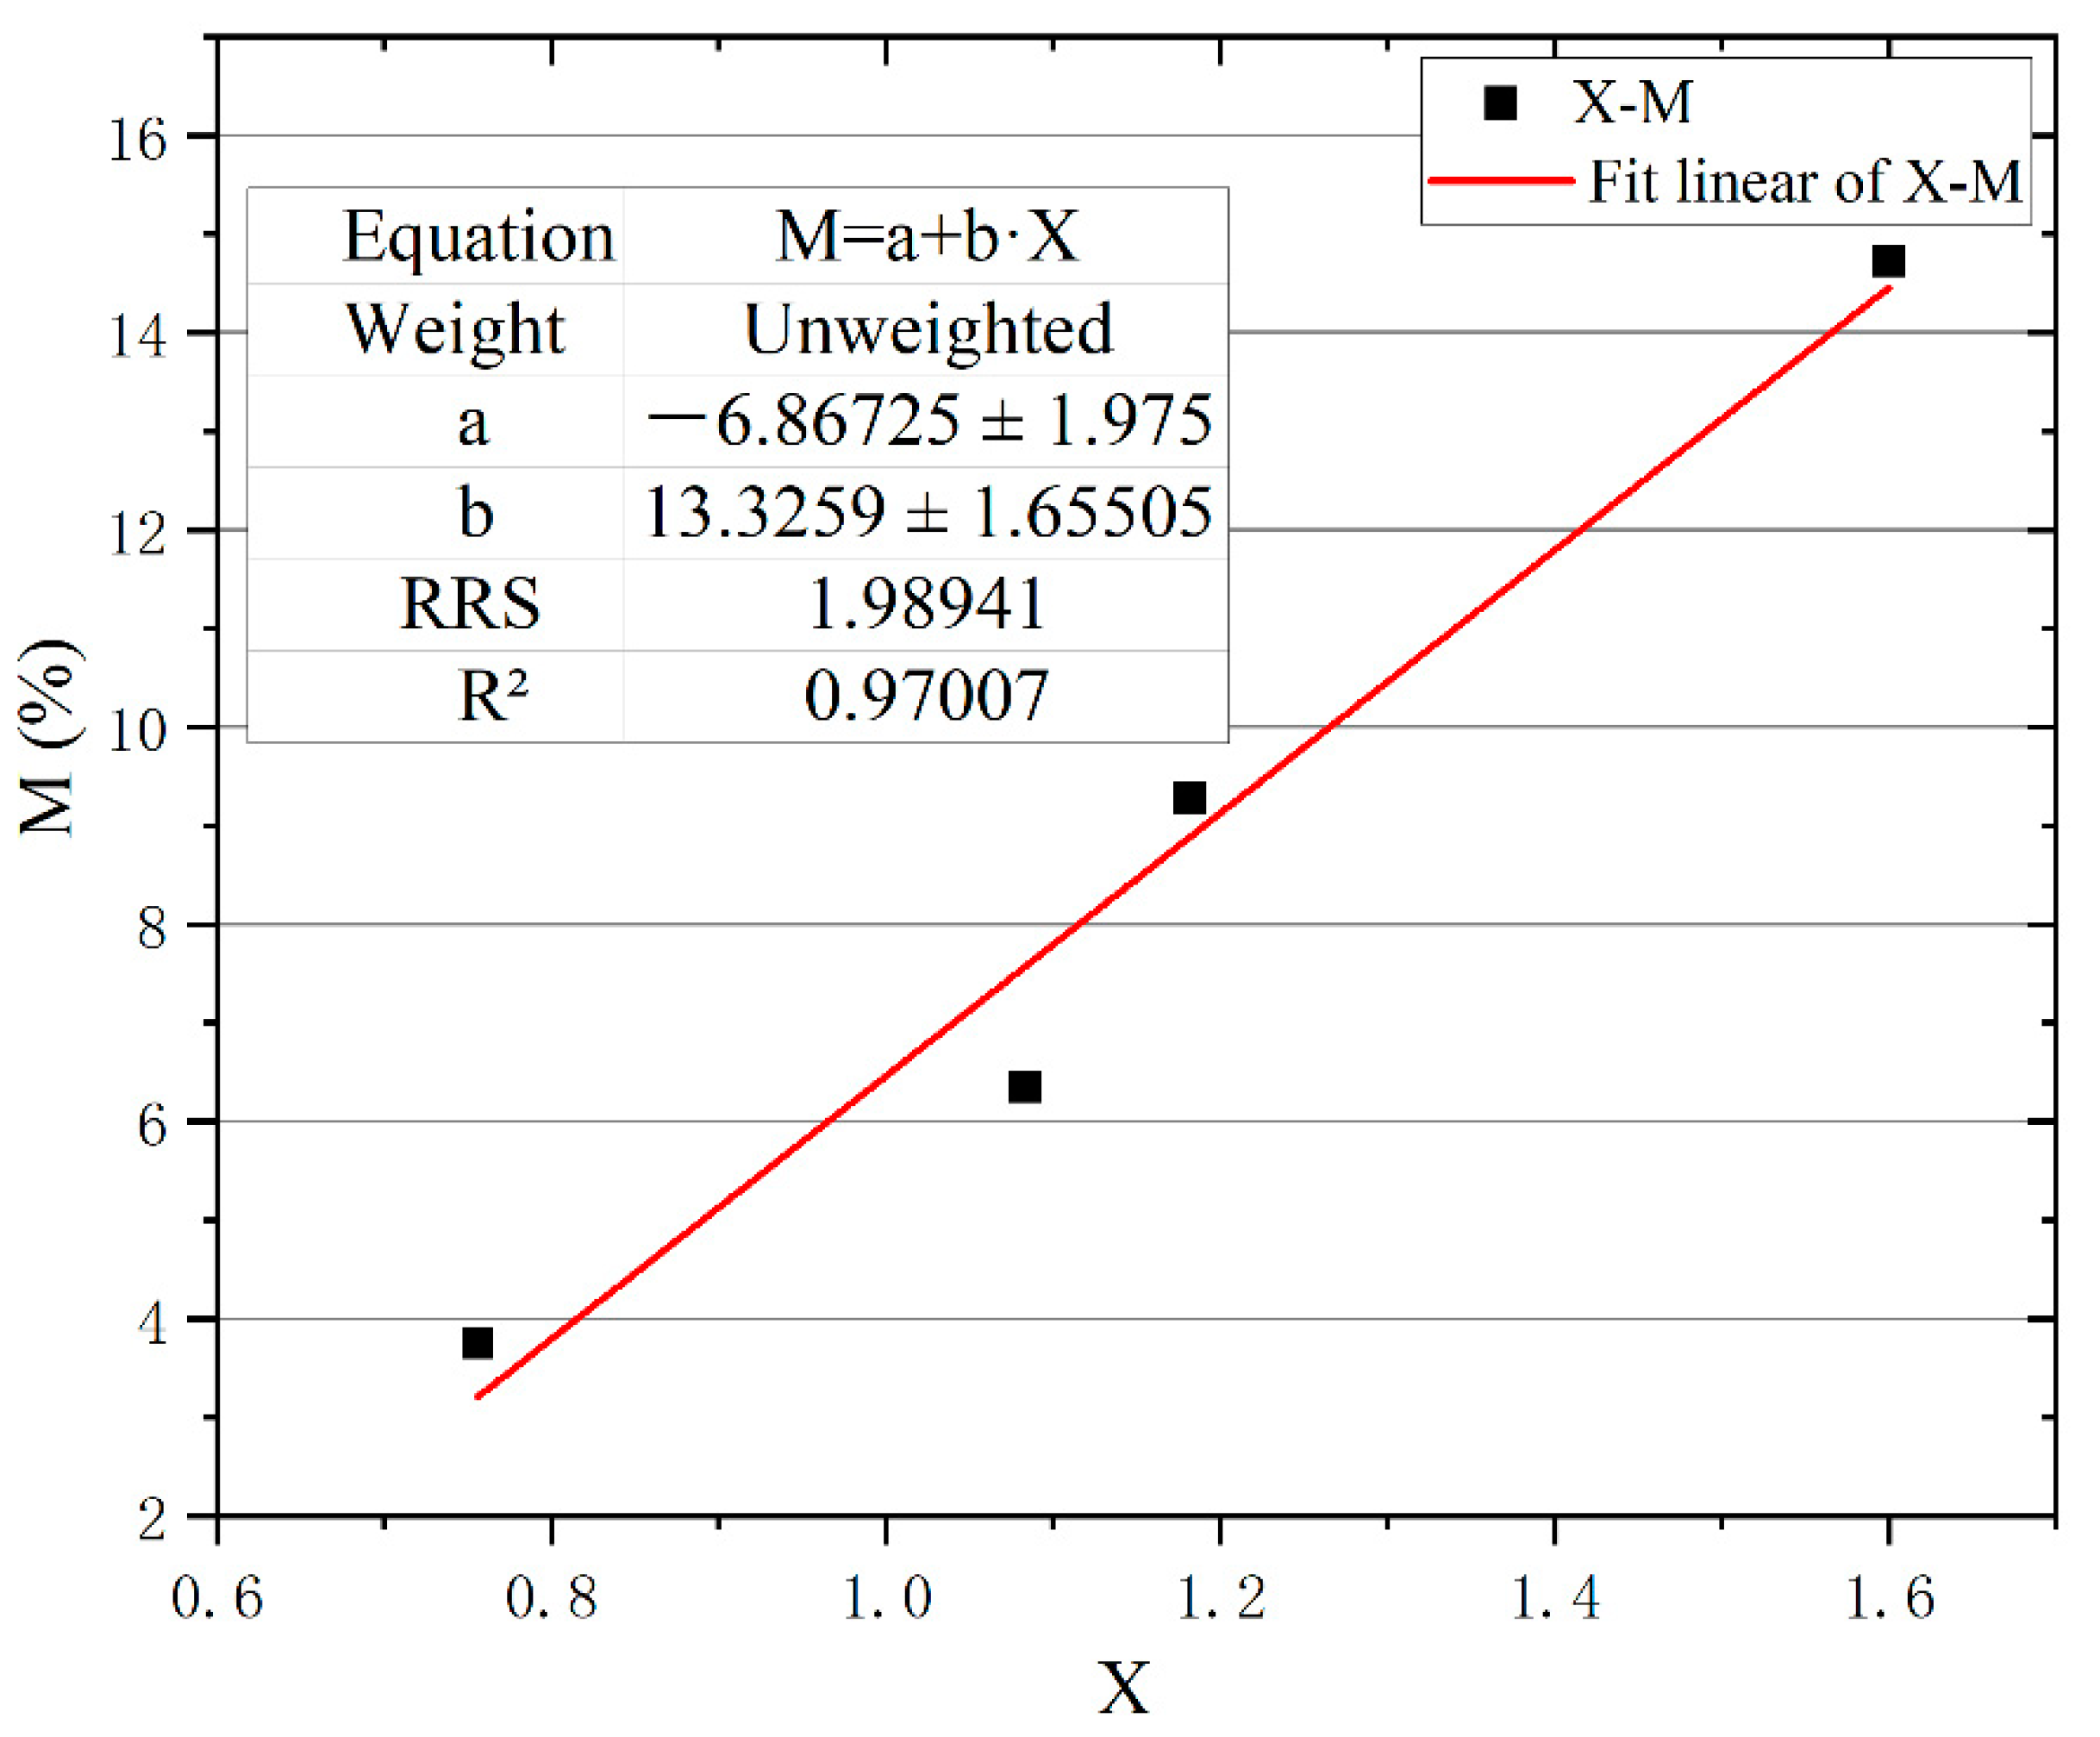
3.4.2. Microstructure and Residual Ash (M)

Pearson correlation analysis and significance test were performed on the thickness of sponge tissue/the thickness of palisade tissue (X) of four samples to residual ash (M) (Table 6). The Pearson correlation coefficient r was 0.985 (larger than 0.8); therefore, it is regarded as a strong correlation. It can also be further determined to be a strong correlation according to Sig. index = 0.008 < 0.01, and therefore there is a strong linear correlation between X and M.
As shown in Figure 7, regression analysis was performed on the thickness of sponge tissue/the thickness of palisade tissue (X) and residual ash (M), and the regression equation was obtained:
M = −6.86725 + 13.3259X, R2 = 0.97007
Higher sponge tissue fraction in the sample resulted in largest content of residual ash during the thermal decomposition process, and there was a strong linear correlation.

3.4.3. Microstructure and Fire Hazard (Y)

Pearson correlation analysis and significance test were performed on the sponge tissue/palisade tissue (X) of four samples in terms of fire hazard (Y) (Table 7). The Pearson correlation coefficient r was −0.984; therefore, it is regarded as a strong correlation. It can also be further determined to be a strong correlation according to Sig. index = 0.008 < 0.01, and therefore there is a strong linear correlation between X and Y.
As shown in Figure 8, Regression analysis was performed on the thickness of sponge tissue/the thickness of palisade tissue (X) and fire hazard (Y), and the regression equation was obtained:
M = 0.47215 − 0.2451X, R2 = 0.95176
On the basis of the results above, a higher percentage of sponge tissue can contribute to a faster transport speed of water, resulting in a lower fire risk of a sample. There exists a strong linear correlation between these two parameters. This result is in agreement with the literature [41].

4. Conclusions

In this paper, comprehensive investigations were carried out to explore ignitability and fire hazard of the leaves of four tree species common in Hunan Province, China. Laboratory experiments consisted of microstructure and DTG–DSC analyses. Meanwhile, pyrolysis reaction kinetic models were built. Regression analysis and correlation tests of microstructural parameters were conducted to accurately verify the ignitability and fire hazard of four types of vegetation. The conclusions of this research are as follows:
  • According to the results of the enthalpy of the reaction and the DSC fitting equation, the activation energies calculated were similar (32 kJ/mol), implying that the fire hazard of different vegetations can be directly determined.
  • The presented TG–DTG and DSC analysis showed a consistent result, namely, CS had the highest fire hazard, followed by LC, TM, and SSB.
  • After the regression analysis and correlation test of the microstructure parameters, a higher percentage of spongy tissue can result in a larger transport speed of water. Moreover, this contributes to lower fire risk of samples.
This study provides a method for determining the ignitability of vegetation, contributing to focusing on vegetation types with higher fire risk. In addition, massive economic benefits can be obtained from forest fire prevention. However, this paper involves limited sample types and sites that should be further investigated in the future.

Author Contributions

Conceptualization, R.H. and J.J.; methodology, R.H.; experimental, J.J. and Y.W.; validation, J.J. and Y.W.; investigation, J.J.; resources, R.H. and J.J.; data curation, J.J.; writing—original draft preparation, J.J.; writing—review and editing, R.H. All authors have read and agreed to the published version of the manuscript.

Funding

This research was funded by the National Key R&D Program of China (2018YFC0808406) and the Fundamental Research Funds for the Central Universities of Central South University (2022ZZTS0593).

Data Availability Statement

All data in this paper are obtained from our experiment and are authentic and reliable. The publication of data has obtained the consent of all authors.

Conflicts of Interest

The authors declare no conflict of interest.

References

  1. Wei, X.; Liang, C.; Chen, W. Exploring Current Status and Evolutionary Trends on the Paid Use of State-Owned Forest Resources in China: A Bibliometric Perspective. Sustainability 2022, 14, 5516. [Google Scholar] [CrossRef]
  2. Farooq, T.H.; Shakoor, A.; Wu, X.; Li, Y.; Rashid, M.H.U.; Zhang, X.; Gilani, M.M.; Kumar, U.; Chen, X.; Yan, W. Perspectives of plantation forests in the sustainable forest development of China. Iforest—Biogeosci. For. 2021, 14, 166–174. [Google Scholar] [CrossRef]
  3. Doerr, S.H.; Santin, C. Global trends in wildfire and its impacts: Perceptions versus realities in a changing world. Philos. Trans. R. Soc. Lond. B Biol. Sci. 2016, 371, 20150345. [Google Scholar] [CrossRef] [PubMed]
  4. Si, L.; Shu, L.; Wang, M.; Zhao, F.; Chen, F.; Li, W.; Li, W. Study on forest fire danger prediction in plateau mountainous forest area. Nat. Hazards Res. 2022, 2, 25–32. [Google Scholar] [CrossRef]
  5. Tyukavina, A.; Potapov, P.; Hansen, M.C.; Pickens, A.H.; Stehman, S.V.; Turubanova, S.; Parker, D.; Zalles, V.; Lima, A.; Kommareddy, I.; et al. Global Trends of Forest Loss Due to Fire From 2001 to 2019. Front. Remote Sens. 2022, 3, 825190. [Google Scholar] [CrossRef]
  6. Wang, J.; Xin, L.; Tan, M.; Wang, Y. Spatial Heterogeneity in Chinese Forest Area Change in the Early 21st Century. Forests 2016, 7, 232. [Google Scholar] [CrossRef]
  7. Salmona, J.; Dixon, K.M.; Banks, S.C. The effects of fire history on hollow-bearing tree abundance in montane and subalpine eucalypt forests in southeastern Australia. For. Ecol. Manag. 2018, 428, 93–103. [Google Scholar] [CrossRef]
  8. Dos Reis, M.; Graca, P.; Yanai, A.M.; Ramos, C.J.P.; Fearnside, P.M. Forest fires and deforestation in the central Amazon: Effects of landscape and climate on spatial and temporal dynamics. J. Environ. Manag. 2021, 288, 112310. [Google Scholar] [CrossRef]
  9. Wei, S.L.B.; Li, X.; Wang, Z.; Wu, Z.; Luo, S.; Luo, Y.; Tao, Y.; Zhong, Y.; Li, Q. Analysis and Enlightenment of Casualties in “3.30” Forest Fire Fighting in Liangshan Prefecture. For. Fire Prev. 2020, 2, 10–13. (In Chinese) [Google Scholar]
  10. Colin, C.; Hardy, C.E.H. Fire danger rating in the United States of America: An evolution since 1916. Int. J. Wildland Fire 2007, 16, 217–231. [Google Scholar]
  11. Fujioka, F.M.; Weise, D.R.; Chen, S.-C.; Kim, S.H.; Kafatos, M.C. Reaction intensity partitioning: A new perspective of the National Fire Danger Rating System Energy Release Component. Int. J. Wildland Fire 2021, 30, 351. [Google Scholar] [CrossRef]
  12. Fan, W.H.D.; Wang, Q.; Sheng, H. Mechanism and Countermeasures of Forest Fire. Disaster Reduct. 1991, 1, 42–44. (In Chinese) [Google Scholar]
  13. Tracy, B.; Gartner, Z.G.C. Decomposition dynamics in mixed-species leaf litter. Oikos 2004, 104, 230–246. [Google Scholar]
  14. Sariyildiz, T. Interactions between litter quality, decomposition and soil fertility: A laboratory study. Soil Biol. Biochem. 2003, 35, 391–399. [Google Scholar] [CrossRef]
  15. Peter, M.; Vitousek, D.R.T. Litter Decomposition on the Mauna Loa Environmental Matrix Hawai’i: Patterns, Mechanisms, and Models. Ecology 1994, 75, 418–429. [Google Scholar]
  16. Liao, L.G.H.; Wang, S.; Ma, Y.; Huang, Z.; Yu, X. The effect of nitrogen addition on soil nutrient leaching and the decomposition of Chinese fir leaf litter. Acta Phytoecol. Sin. 2000, 24, 34–39. (In Chinese) [Google Scholar]
  17. Wang, W.G.J. Seasonal dynamics of environmental factors and decomposition rate of litter in Puccinellia tenuiflora community of Songnen grassland of China. Chin. J. Appl. Ecol. 2001, 6, 841–844. (In Chinese) [Google Scholar]
  18. Grootemaat, S.; Wright, I.J.; Bodegom, P.M.; Cornelissen, J.H.C.; Cornwell, W.K.; Schweitzer, J. Burn or rot: Leaf traits explain why flammability and decomposability are decoupled across species. Funct. Ecol. 2015, 29, 1486–1497. [Google Scholar] [CrossRef]
  19. Daniel, W.; Krix, B.R.M. Landscape variation in plant leaf flammability is driven by leaf traits responding to environmental gradients. Ecosphere 2018, 9, e02093. [Google Scholar]
  20. Guerrero, F.; Carmona, C.; Hernández, C.; Toledo, M.; Arriagada, A.; Espinoza, L.; Bergmann, J.; Taborga, L.; Yañez, K.; Carrasco, Y.; et al. Drivers of Flammability of Eucalyptus globulus Labill Leaves: Terpenes, Essential Oils, and Moisture Content. Forests 2022, 13, 908. [Google Scholar] [CrossRef]
  21. Dimitrakopoulos, A.; Papaioannou, K.K. Flammability Assessment of Mediterranean Forest Fuels. Fire Technol. 2001, 37, 143–152. [Google Scholar] [CrossRef]
  22. Liodakis, S.; Bakirtzis, D.; Dimitrakopoulos, A. Dimitrakopoulos. Ignition characteristics of forest species in relation to thermal analysis data. Thermochim. Acta 2002, 390, 83–91. [Google Scholar] [CrossRef]
  23. Singh, R.K.; Pandey, D.; Patil, T.; Sawarkar, A.N. Pyrolysis of banana leaves biomass: Physico-chemical characterization, thermal decomposition behavior, kinetic and thermodynamic analyses. Bioresour. Technol. 2020, 310, 123464. [Google Scholar] [CrossRef] [PubMed]
  24. Liodakis, S.; Kakardakis, T. Thermal analysis of forest species dominating wildland/urban interface in Athens. For. Ecol. Manag. 2006, 234, S138. [Google Scholar] [CrossRef]
  25. Dimitrakopoulos, A.P. Thermogravimetric analysis of Mediterranean plant species. J. Anal. Appl. Pyrolysis 2001, 60, 123–130. [Google Scholar] [CrossRef]
  26. Zhou, G.Z.Y.; Yu, S.; Bai, S.; Lu, F. Combustibility of Litters of Three Woody Species with Different Water Contents by Cone Calorimeter. Sci. Silvae Sin. 2008, 44, 96–101. (In Chinese) [Google Scholar]
  27. Rodríguez-Añón, J.A.; Proupín-Castiñeiras, J.; Villanueva-López, M.; Mouriño-Carballido, B. Development of an experimental procedure for energy evaluation of forest communities by calorimetry and thermal analysis. Thermochim. Acta 2007, 458, 5–10. [Google Scholar] [CrossRef]
  28. Kumar Mohalik, N.; Mandal, S.; Kumar Ray, S.; Mobin Khan, A.; Mishra, D.; Krishna Pandey, J. TGA/DSC study to characterise and classify coal seams conforming to susceptibility towards spontaneous combustion. Int. J. Min. Sci. Technol. 2022, 32, 75–88. [Google Scholar] [CrossRef]
  29. Zhang, K.L.Y.; Tan, S.; Zhu, X. Vegetation Succession Trend in Yuelu Mountain, Hunan, China. Life Sci. Res. 2009, 13, 313–319. (In Chinese) [Google Scholar] [CrossRef]
  30. Dariga Altynbaeva, A.A.; Tabakaev, R. Kinetics of biomass low-temperature pyrolysis by coats–redfern method. MATEC Web Conf. 2018, 194, 01058. [Google Scholar] [CrossRef]
  31. Sack, L.; Cowan, P.D.; Jaikumar, N.; Holbrook, N.M. The ‘hydrology’ of leaves: Co-ordination of structure and function in temperate woody species. Plant Cell Environ. 2003, 26, 1343–1356. [Google Scholar] [CrossRef]
  32. Muir, C.D.; Hangarter, R.P.; Moyle, L.C.; Davis, P.A. Morphological and anatomical determinants of mesophyll conductance in wild relatives of tomato (Solanum sect. Lycopersicon, sect. Lycopersicoides; Solanaceae). Plant Cell Environ. 2014, 37, 1415–1426. [Google Scholar] [CrossRef] [PubMed]
  33. Tian, S.Z.S.; Zhu, J.; Shen, Z.; Cao, K. Impact of leaf morphological and anatomical traits on mesophyll conductance and leaf hydraulic conductance in mangrove plants. Plant Sci. J. 2016, 34, 909–919. (In Chinese) [Google Scholar]
  34. Baggaley, R.G.; Hornsby, P.R.; Yahya, R.; Cusack, P.A.; Monk, A.W. The Influence of Novel Zinc Hydroxystannate-Coated Fillers on the Fire Properties of Flexible PVC. Fire Mater. 1997, 21, 179–185. [Google Scholar] [CrossRef]
  35. Hostikka, S.; Matala, A. Pyrolysis Model for Predicting the Heat Release Rate of Birch Wood. Combust. Sci. Technol. 2017, 189, 1373–1393. [Google Scholar] [CrossRef]
  36. Marek Wesołowski, P.K.N. Thermal decomposition and elemental composition of medicinal plant materials—Leaves and flowers Principal component analysis of the results. Thermochim. Acta 2003, 397, 171–180. [Google Scholar] [CrossRef]
  37. Liu, N.; Fan, W.C. Modelling the Thermal Decompositions of Wood and Leaves Under a Nitrogen Atmosphere. Fire Mater. 1998, 22, 103–108. [Google Scholar] [CrossRef]
  38. Liu, N.; Fan, W.; Dobashi, R.; Huang, L. Kinetic modeling of thermal decomposition of natural cellulosic materials in air atmosphere. J. Anal. Appl. Pyrolysis 2002, 63, 303–325. [Google Scholar] [CrossRef]
  39. Zhang, C.-W.; Wang, C.-Z.; Tao, R. Thermal Decomposition Kinetics ofGinkgo bilobaLeaves Polyprenol in Nitrogen Atmosphere. Int. J. Chem. Kinet. 2016, 48, 671–678. [Google Scholar] [CrossRef]
  40. Yan, Y.; Meng, Y.; Tang, L.; Kostas, E.T.; Lester, E.; Wu, T.; Pang, C.H. Ignition and Kinetic Studies: The Influence of Lignin on Biomass Combustion. Energy Fuels 2019, 33, 6463–6472. [Google Scholar] [CrossRef]
  41. Tian, X.; Shu, L.; Zhang, X. Study on the influence of microstructure of tree’s twig and leaf on combustibility. Sci. Silvae Sin. 2003, 39, 84–88. (In Chinese) [Google Scholar]
Figure 1. Experimental flowchart of samples.
Forests 13 01443 g001
Figure 2. The weight loss process (TGA) of samples.
Forests 13 01443 g002
Figure 3. (a) Results of DTG for the four studied leaf species. (b) Weight loss fraction of each stage.
Forests 13 01443 g003
Figure 4. Results of DSC analysis of four samples.
Forests 13 01443 g004
Figure 5. Results of reaction enthalpy during thermal decomposition.
Forests 13 01443 g005
Figure 6. Regression analysis of microstructure parameters and pyrolysis water loss.
Forests 13 01443 g006
Figure 7. Regression analysis of microstructure parameters and residual ash.
Forests 13 01443 g007
Figure 8. Regression analysis of microstructure parameters and fire hazard.
Forests 13 01443 g008
Table 1. The microstructural parameters of the samples.
SampleThe Percentage of Micro-Tissues of Leaves (%)Spongy/Palisade
CuticlePalisade Tissue Spongy Tissue Interspace
Symplocos setchuensis Brand (SSB)14304881.600
Tarenna mollissima (TM)183339101.182
Loropetalum chinense (LC)103639151.083
Castanopsis sclerophylla (CS)12453490.756
Table 2. Results of pyrolysis kinetics of TGA–DTG.
SampleInitial Weight (g)Residual Weight
(g)
Pyrolysis Kinetic EquationTemperature Range (°C)Reaction OrderR2abE
(kJ·mol−1)
A
(min−1)
SSB20.9293.082Y = −10.5646 − 582.5/T198–4441.00.9441−10.5646−582.54.8426480.301
Y = −7.8849 − 2085.8/T444–5901.00.7110−7.8849−2085.817.3410915.701
TM20.1112.912Y = −10.4085 − 545.3/T202–4031.00.9449−10.4085−545.34.533170.329
Y = −7.5605 − 1951.8/T403–6111.00.8555−7.5605−1951.816.2270720.323
LC21.3001.976Y = −11.0089 − 431.5/T182–4061.00.9715−11.0089−431.53.587280.143
Y = −8.1659 − 1790.7/T406–6151.00.7615−8.1659−1790.714.8878910.178
CS22.6641.44Y = −10.6653 − 545.7/T185–4131.00.9281−10.6653−545.74.537070.255
Y = −8.4854 − 1606.3/T413–6011.00.7227−8.4854−1606.313.354546.632
Table 3. Results of pyrolysis kinetics of DSC.
SampleInitial Weight
(g)
Residual Weight
(g)
Temperature Range
(°C)
H0
(mW)
Fitting EquationabE
(kJ/mol)
A
(min−1)
Reaction OrderR2
SSB20.9293.082371–6325787.9Y = −5.9599 − 3781.8/T−5.9599−3781.831.442195.20.80.895
TM20.1112.912318–6325690.5Y = −4.6187 − 3905.1/T−4.6187−3905.132.467770.50.80.870
LC21.3001.976338–6328017.9Y = −4.5678 − 3929.7/T−4.5678−3929.732.671815.90.80.842
CS22.6641.44346–63210,520Y = −5.5938 − 3922.6/T−5.5938−3922.632.612291.90.80.933
Table 4. Microstructure parameters and pyrolysis parameters of four samples.
SampleXP
(%)
M
(%)
H
(mW/mg)
t
(s)
Y
(mW·mg−1·s−1)
SSB1.60010.46114.72468.069960.068
TM1.1827.0589.278120.356150.196
LC1.0835.4726.355148.546740.220
CS0.7564.6493.753192.157070.272
Table 5. Microstructure parameters and pyrolysis parameters of the four samples.
P
XPearson Correlation0.966 *
Sig. (single tail)0.017
* At the level 0.05 (single tail), the correlation was significant.
Table 6. Correlation test of microstructure parameters and residual ash.
M
XPearson Correlation0.985 **
Sig. (single tail)0.008
** At the level 0.01 (single tail), the correlation was significant.
Table 7. Correlation test of microstructure parameters and fire hazard.
Y
XPearson Correlation−0.984 **
Sig. (single tail)0.008
** At the level 0.01 (single tail), the correlation was significant.
Publisher’s Note: MDPI stays neutral with regard to jurisdictional claims in published maps and institutional affiliations.

