Article

Dynamics of Forage and Management Implications for Large Herbivore Habitat in Seasonally Dry Forest of Southeast Asia

by
Andaman Chankhao
1,
Ekaphan Kraichak
2,
Sangsan Phumsathan
3 and
Nantachai Pongpattananurak
1,*
1
Department of Forest Biology, Faculty of Forestry, Kasetsart University, Bangkok 10900, Thailand
2
Department of Botany, Faculty of Science, Kasetsart University, Bangkok 10900, Thailand
3
Department of Conservation, Faculty of Forestry, Kasetsart University, Bangkok 10900, Thailand
*
Author to whom correspondence should be addressed.
Forests 2022, 13(9), 1463; https://doi.org/10.3390/f13091463
Submission received: 1 August 2022 / Revised: 30 August 2022 / Accepted: 8 September 2022 / Published: 11 September 2022
(This article belongs to the Section Forest Ecology and Management)

Abstract

:
Forage plants, as primary producers, play an essential role in maintaining populations of large herbivores. The availability and quality of these forage plants can affect the health and viability of these animals. Seasonally dry forests of Huai Kha Khaeng Wildlife Sanctuary and Huai Thab Salao-Huai Rabum Non-Hunting Area are recognized as one of the largest contiguous pieces of forests in mainland Southeast Asia and serve as a home to many large herbivore species, particularly banteng (Bos javanicus birmanicus). However, our understanding of forage plants and their dynamics is still limited. Therefore, the current study was undertaken to understand the dynamics of forage plants, prescribed burning effects, and the associated environmental factors. During 2018–2019, the results showed that the highest forage availability was in June after the prescribed burns at 156.2–252.6 kg ha−1 and the lowest in February before the burning at 16.8–39.8 kg ha−1. Environmental factors that impacted the forage availability include canopy cover, tree density, tree basal area, soil bulk density, soil pH, and topography. However, the impacts of these factors varied among the studied plant life forms, suggesting the importance of active habitat management through prescribed burns and stand improvement to maintain sufficient forage for large herbivores in the future.

1. Introduction

Deciduous forests can be found throughout the tropics, including continental Southeast Asia [1,2]. Unlike other tropical forests, these deciduous forests have a distinct and long dry period (5–6 months) almost every year [3]. Therefore, common species in these forests are deciduous tree species that shed their leaves during the driest time of the season [4]. Distinct dry periods, combined with a large volume of fuels from deciduous trees, lead to annual low-intensity, short-lived surface fires in these forests, and all are human-caused fires consisting of prescribed burning (early burning) and burning for crop preparation by local people along the forest edge [5,6]. One consequence of the frequent, low-intensity burns is the annual supply of fresh herbaceous plants for large herbivores, including Bos javanicus birmanicus (banteng, an endangered species to these deciduous forests in mainland Southeast Asia [7,8]), Rusa unicolor (sambar deer), Rucervus eldii (eld’s deer,) and Muntiacus muntjak (red muntjac) etc. (Figure 1).
Some of the largest pieces of tropical deciduous forests are located in Huai Kha Khaeng Wildlife Sanctuary, part of the largest contiguous protected areas in Southeast Asia [9]. A large lowland deciduous dry forest in the valley of the Thab Salao watershed covers more than 17,000 ha and serves as one of the core habitats for many herbivores [8]. It is also suspected to host the largest banteng population in Thailand and the world [7]. This forest has been undergoing natural succession since 1992 after unregulated logging [10]. During 1992–2002, fire suppression was strictly enforced in this area as part of a newly established wildlife sanctuary. The continuous fire suppression resulted in high canopy cover and tree density, which are uncharacteristic of deciduous dipterocarp forests and potentially reduce forage food for large herbivores in this area [11]. Currently, no information on available forage for herbivores has been systematically collected, making it difficult to make an informed decision about wildlife management in this vulnerable habitat.
Wildlife habitat management has a central goal of increasing carrying capacity within a particular habitat [12] by providing appropriate plant species composition and sufficient water sources to sustain the animals throughout the year. More importantly, the number of resources should be enough to keep the animals from going into farmland and human settlements, which often result in human–wildlife conflicts [13]. Various management techniques have been proposed to increase the abundance of forage food. For example, prescribed burning is a popular method in many countries [14] to increase the productivity of grasses and forbs [15], as well as to preserve the structure of deciduous forests [16,17]. Permanent clearing of the land to allow regeneration of grasses [18,19] and cultivation of nutritious forage species have also been applied in wildlife management [20,21]. A combination of these methods has been shown to effectively maintain viable wildlife populations and keep animals within the protected areas [22].
Despite the continuous effort to manage wildlife habitats through prescribed burns and water source management, Huai Kha Khaeng Wildlife Sanctuary continues to see an increase in animal sightings in the farmland at the edges of the Sanctuary, intensifying the tension between the villagers and the protected areas. The problem suggests that the current management practice may not provide enough or appropriate forage plants for the large herbivore populations in this particular forest. Several studies have been conducted to describe the diversity of forage plant species in the area [23,24]. However, we still lack the data for the dynamics of these plants through the seasons, which will be critical to the success of the habitat management of this area.
Therefore, this study aimed to determine the temporal variation of forage availability for large herbivores throughout the season, particularly in deciduous forests that experience low-intensity surface fires, by collecting biomass of forage plant species from a set of semi-permanent plots in the area. The influences of various abiotic factors (fire intensity, soil property, and topology) on the forage availability were also analyzed to gain an insight into the availability and variation of forage for the animals in this area. The information of this study will allow wildlife managers to implement more effective habitat management in the future.

2. Materials and Methods

2.1. Study Site

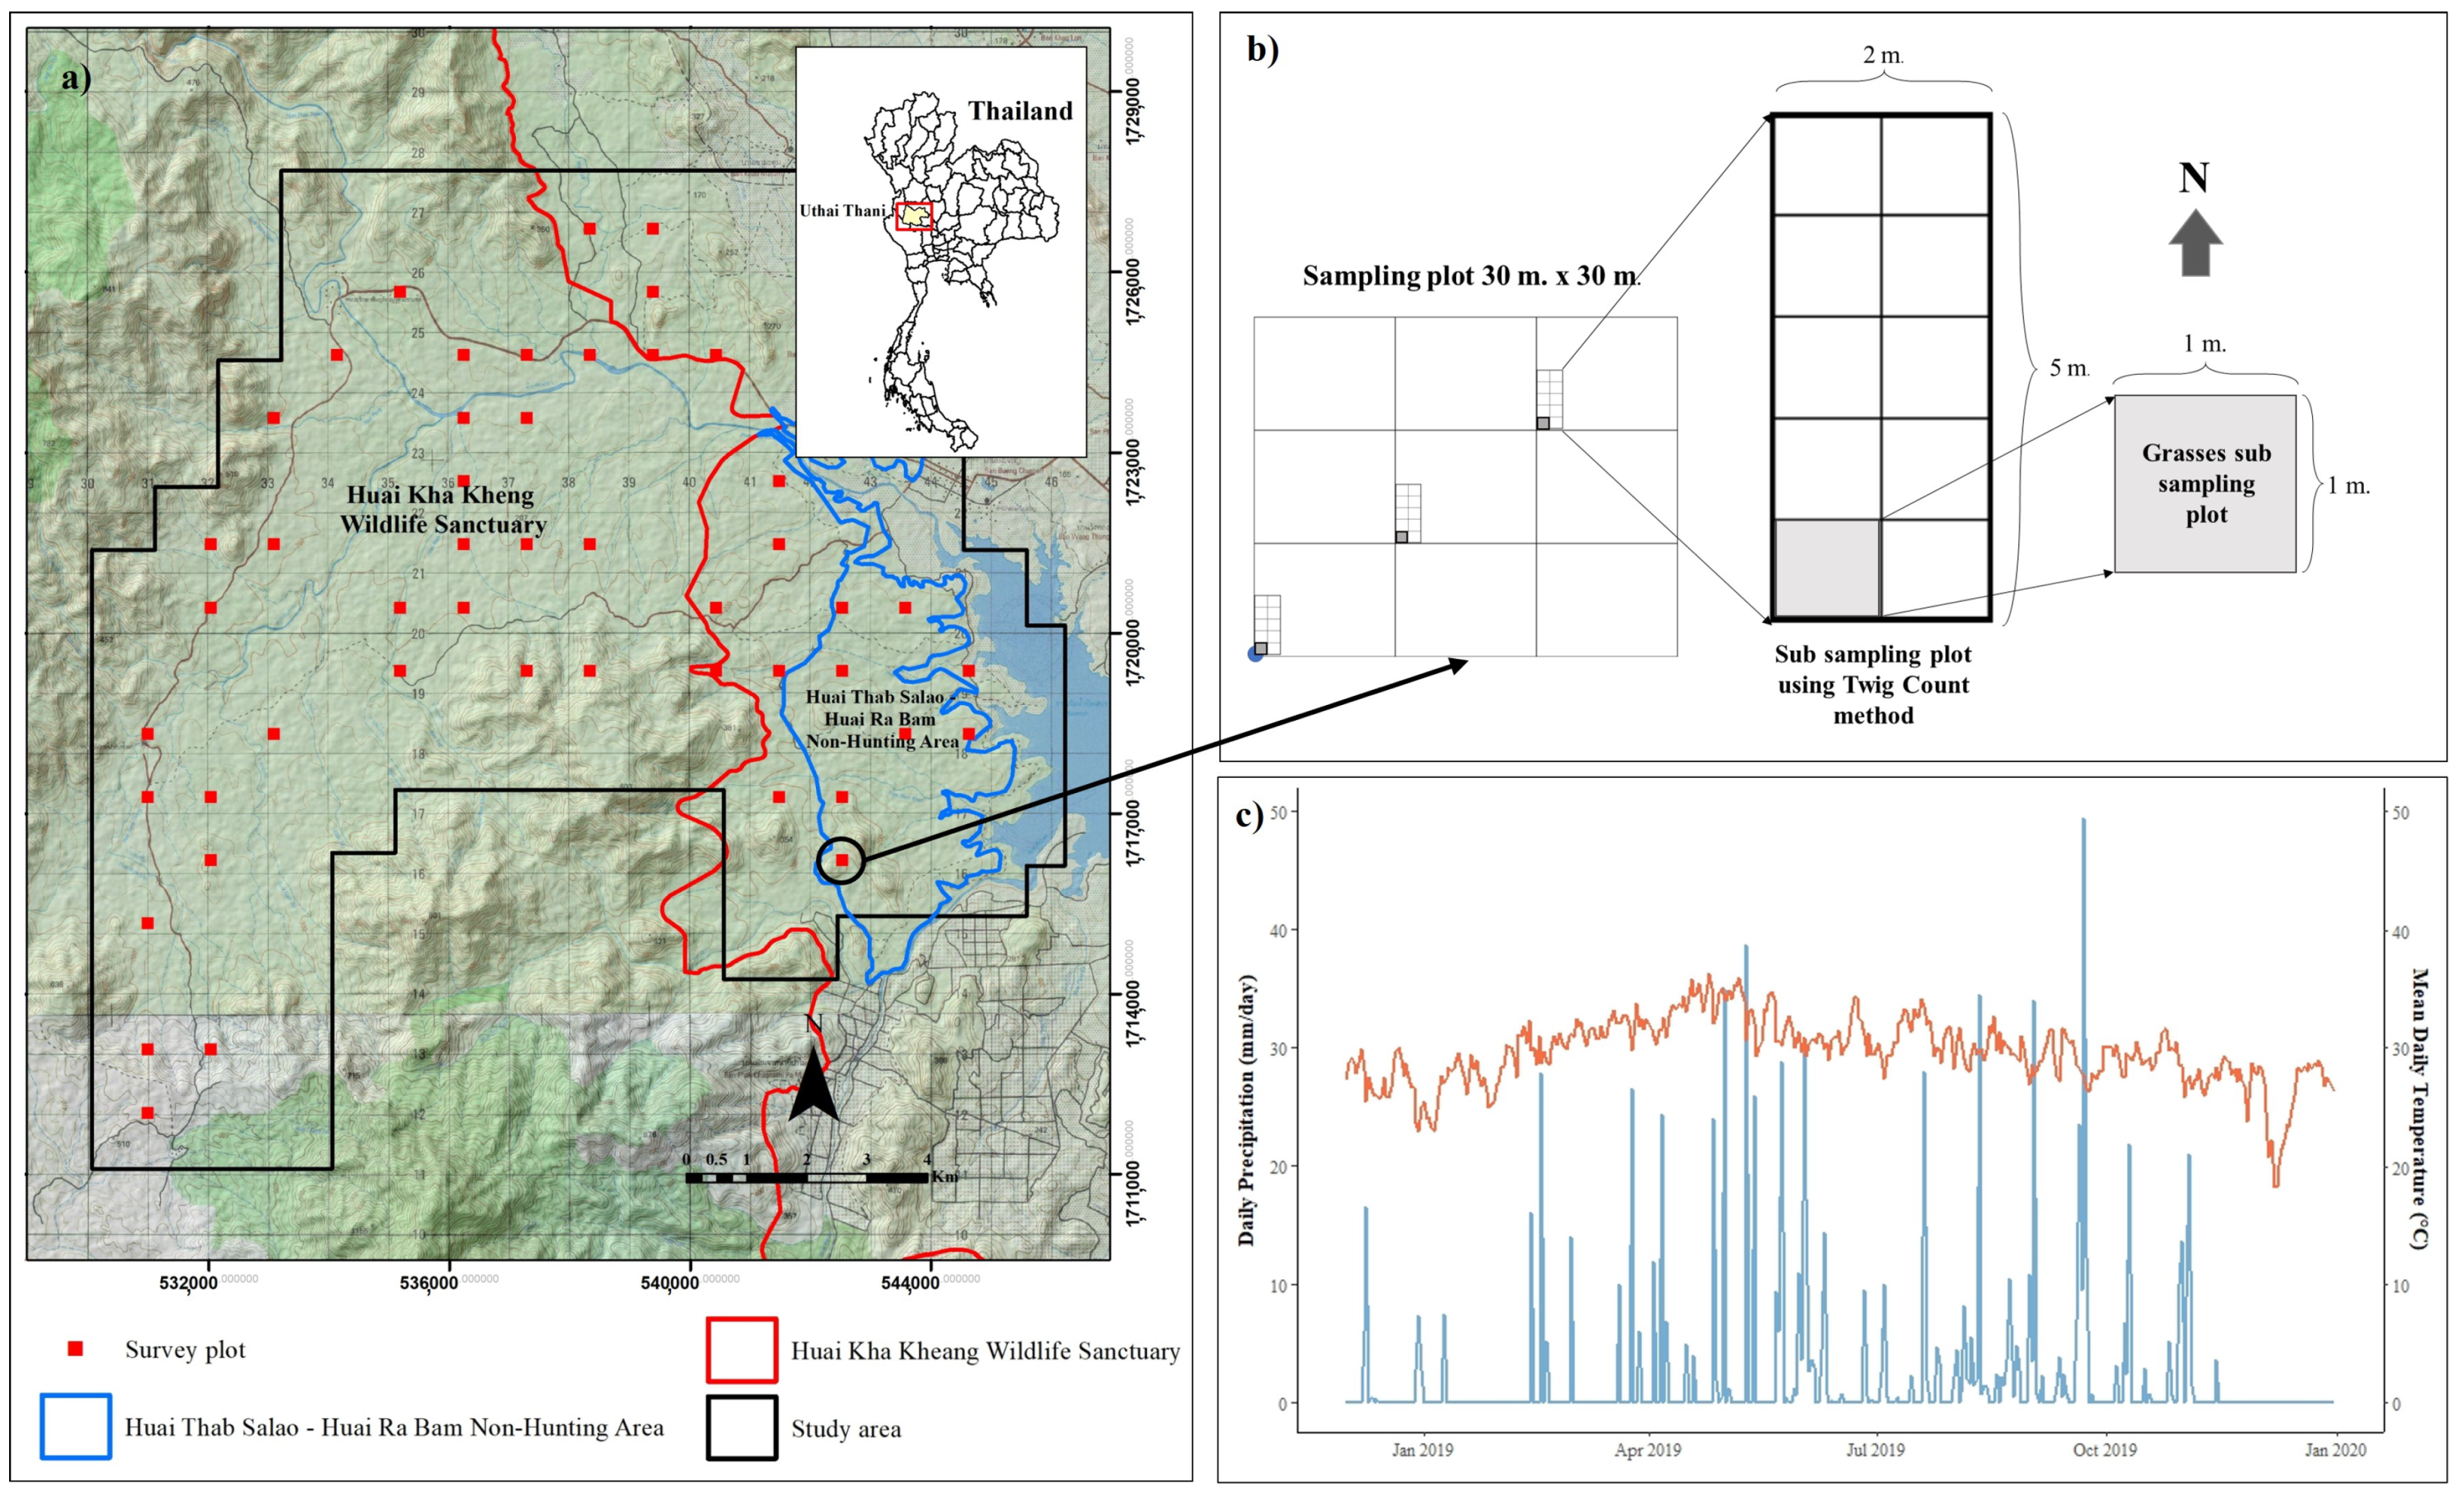
The study was conducted in the 17,000 ha buffer zone, northeast of Huai Kha Khaeng Wildlife Sanctuary and Huai Thab Salao-Huai Rabum Non-Hunting Area, Lansak District, Uthai Thani Province, Thailand (Figure 2) from December 2018 to October 2019. The study area covers part of the Thab Salao watershed, the name of the primary water source in the area. The plant community of the area consists of mainly Deciduous dipterocarp Forests (DDF) interspersed with Mixed Deciduous Forests (MDF) and Mixed Deciduous Forests with bamboo (MDFB) that experience annual surface fires.The study area had undergone unmanaged logging before the establishment of the wildlife sanctuary in 1992 [10]. During this study, the HKK wildlife sanctuary issued an annual prescribed burning between 22 February to 31 March 2019. Our study took place during a dry period (annual precipitation = 863.70 mm/year), and we compared that with a mean of annual precipitation which was 1448.65 mm/year from 2001 to 2019) (reported by the Huai Kha Khaeng Forest Fire Research Station, about 1–2 km away from study area). Since it was the year of a “Weak El Niño” [25], this study could explore the food availability during dry years (Figure S1).

2.2. Data Collection

2.2.1. Sampling Plot Design

A set of points (1 km from each other) were systematically chosen from the map to represent the heterogeneity of the whole study area. Forty-eight points were randomly chosen from these points to place a 30 × 30 m2 plot for the sampling times. Each plot was monitored for trees and forage plants every two months from December 2018 to October 2019, resulting in six time points (December 2018, February 2019, April 2019, June 2019, August 2019, and October 2019) to determine the temporal variation of forage availability for browser and grazer. Within each 30 × 30 m2 plot, three 2 × 5 m2 subplots (Figure 2) were systematically placed to determine all herbaceous plants and utilized plants by browsers and grazers with the twig count method [26,27], while 1 × 1 m2 (within 2 × 5 m2) were used estimation of grass proportion. Therefore, this study has 144 subplots from 48 plots per sampling times. A total of 48 sampling plots (Figure 2) were located in three forest types: (1) DDF (n = 23), (2) MDF (n = 11), and (3) MDFB (n = 14) (Figure S2). In this study, we performed a systematic sampling to cover the study area. The forest types of the systematic plots were determined after the plots were designated. Because of the heterogeneity within the study site, the unequal numbers of plots for the three forest types were detected. This research was conducted with permission from the Department of National Parks, Wildlife and Plant Conservation and has been complied with IUCN policy for research on plants in protected areas.

2.2.2. Forage Availability

In this study, the forage plants were classified into four categories according to the life forms and animal utilization: grasses, forbs, shrubs, and tree seedlings [24] (Figure S3). Grasses are monocot plants or grass-like plants including Poaceae (grasses), Cyperaceae (sedges), Juncaceae (rushes), Juncaginaceae (arrow-grasses), and Isoetaceae (quillworts). Forbs are vascular plants without ostensibly woody tissue above or at the ground. Forbs and herbs may be annual, biennial, or perennial but always lack significant thickening by secondary woody growth and have perennating buds borne at or below the ground surface. Shrubs are a multi-stemmed woody plant that is usually lower than 4 to 5 m. Shrubs typically have several stems arising from nearly ground, but may be taller than 5 m or single-stemmed under certain environmental conditions. Overall, shrubs are perennial plants. Tree seedlings are perennial, and are woody with a single stem (trunk) and are not higher than 1.30 m. Some tree species may develop a multi-stemmed or short growth form [28].
The animal utilization of these plants at each time interval was determined using the twig count method without specifying the species of animals. For the twig count method, all twigs with a diameter greater than 0.5 mm and less than 2 m tall in the plot were counted and measured. The twigs with the traces of animal browsing were measured for the diameter as a reference size for consumed twigs. We searched a twig that had the same diameter as the reference size for each species outside the plot to avoid disturbance and weighted this twig. For shrubs, forb, and tree seedlings, forage availability was estimated by multiplying the weight of the reference twig with the number of all available twigs of that species in the plot [26]. Each 2 × 5 m2 plot was divided into six 1 × 1 m2 plots to estimate grass cover at each time point. For grass availability, we searched in the 1 × 1 m2 plots for the trace of grazing. If we found the evidence of grazing, we found another 1 × 1 m2 outside the sampling with similar grass cover as a reference plot. The length of grazed grass blades was estimated by comparing it to the intact grass in the reference. We then cut the grass to the same length as in the reference to obtain the fresh weight. The weight of the consumed portion was divided by the percent cover, and we used this number as a reference unit for calculating grass availability in the other plots [29,30]. For each time point, three subplots were sampled within each 30 × 30 m2 plot. This study did not include bamboo because it occurred sporadically in our sampling sites. At the same time, we weighted both wet and dry twigs and grass blades to calculate the percent of water content for comparing the life forms differences.

2.2.3. Environmental Factors

Additional environmental factors were also determined for each 30 × 30 m2 plot, including (1) topographical factors, (2) biological factors, (3) edaphic factors, and (4) fire frequency.
Topographical factors, including slope, and elevation, were retrieved from 30 × 30 m2 resolution raster data [31]. Biological factors mainly refer to the forest structure, including tree density, basal area, canopy cover, and forest types. All trees with a diameter at breast height (DBH at 130 cm aboveground) greater than 4.5 cm were identified and measured for the forest structure. Forest type was determined using the composition of dominant species in each plot.
The soil samples from the plots were analyzed at the Department of Soil Science, Faculty of Agriculture, Kasetsart University. The following parameters were determined: soil pH, bulk density (bd), and available phosphorus (P) [32]. The fire frequency was based on the fire index, calculated from the available satellite imagery data from the study area between November 2007 to April 2019 (13 years) [33]. The fire index was reported to affect forage availability in various studies [34,35] and was therefore included in this study.

2.3. Data Analyses

The Kruskal–Wallis test and the subsequent Tukey’s honest significant difference test (Tukey’s HSD) were performed to determine the forage part characteristics of the different lifeforms that were utilized by large herbivores, including diameter (except grass), total length, fresh weight, dry weight, and water content.In the same way, we used the above statistical analyses to determine how the total forage availability differed significantly with respect to life forms and forest types (at α = 0.05), while the Wilcoxon signed ranks test were performed for different sampling times.
In order to study the effect of environmental factors on the forage availability, the zero-inflated negative binomial model was applied to the dataset for each of the four life forms using the package MASS in R program [36]. The model was chosen because of a large number of zeros in the dataset, indicating non-usage of plants by animals in the plot [37,38]. The explanatory variables included topographical factors, biological factors, edaphic factors, and fire frequencies described in the previous sections. All of the variables were standardized to have the mean of zero and standard deviation of one (z-score) to ensure that the resulting coefficients from the models accurately represent the relative effect size of each factor.

3. Results

Out of 486 species found during the sampling times, only 87 species (72 genera from 39 families) of plants had traces of consumption by large herbivores. These plants included 29 species of forbs, 2 species of grasses, 22 species of shrubs, and 34 species of tree seedlings (see Table S1 for a species list). The forage plant species accounted for 17.9% of all herbaceous plant species found in the area.
The twig count showed that herbivores consumed branches of similar diameters, but the length of consumed plant parts (of branches and grass blades) varied among the life forms (Table 1). More than 20 cm of the plant parts were consumed with forbs, while less than 20 cm were consumed in the other life forms (Table 1). The weights of the available twig of forbs, shrubs, and tree seedlings did not differ significantly, but the water content of forbs at 73.9% was significantly higher than the other life forms (p < 0.05). The weight of the grasses was not compared against the other life forms (forbs, shrubs, and tree seedlings) because they were harvested and measured with a different method from the others (Table 1).

3.1. Temporal Variation of Forage Availability

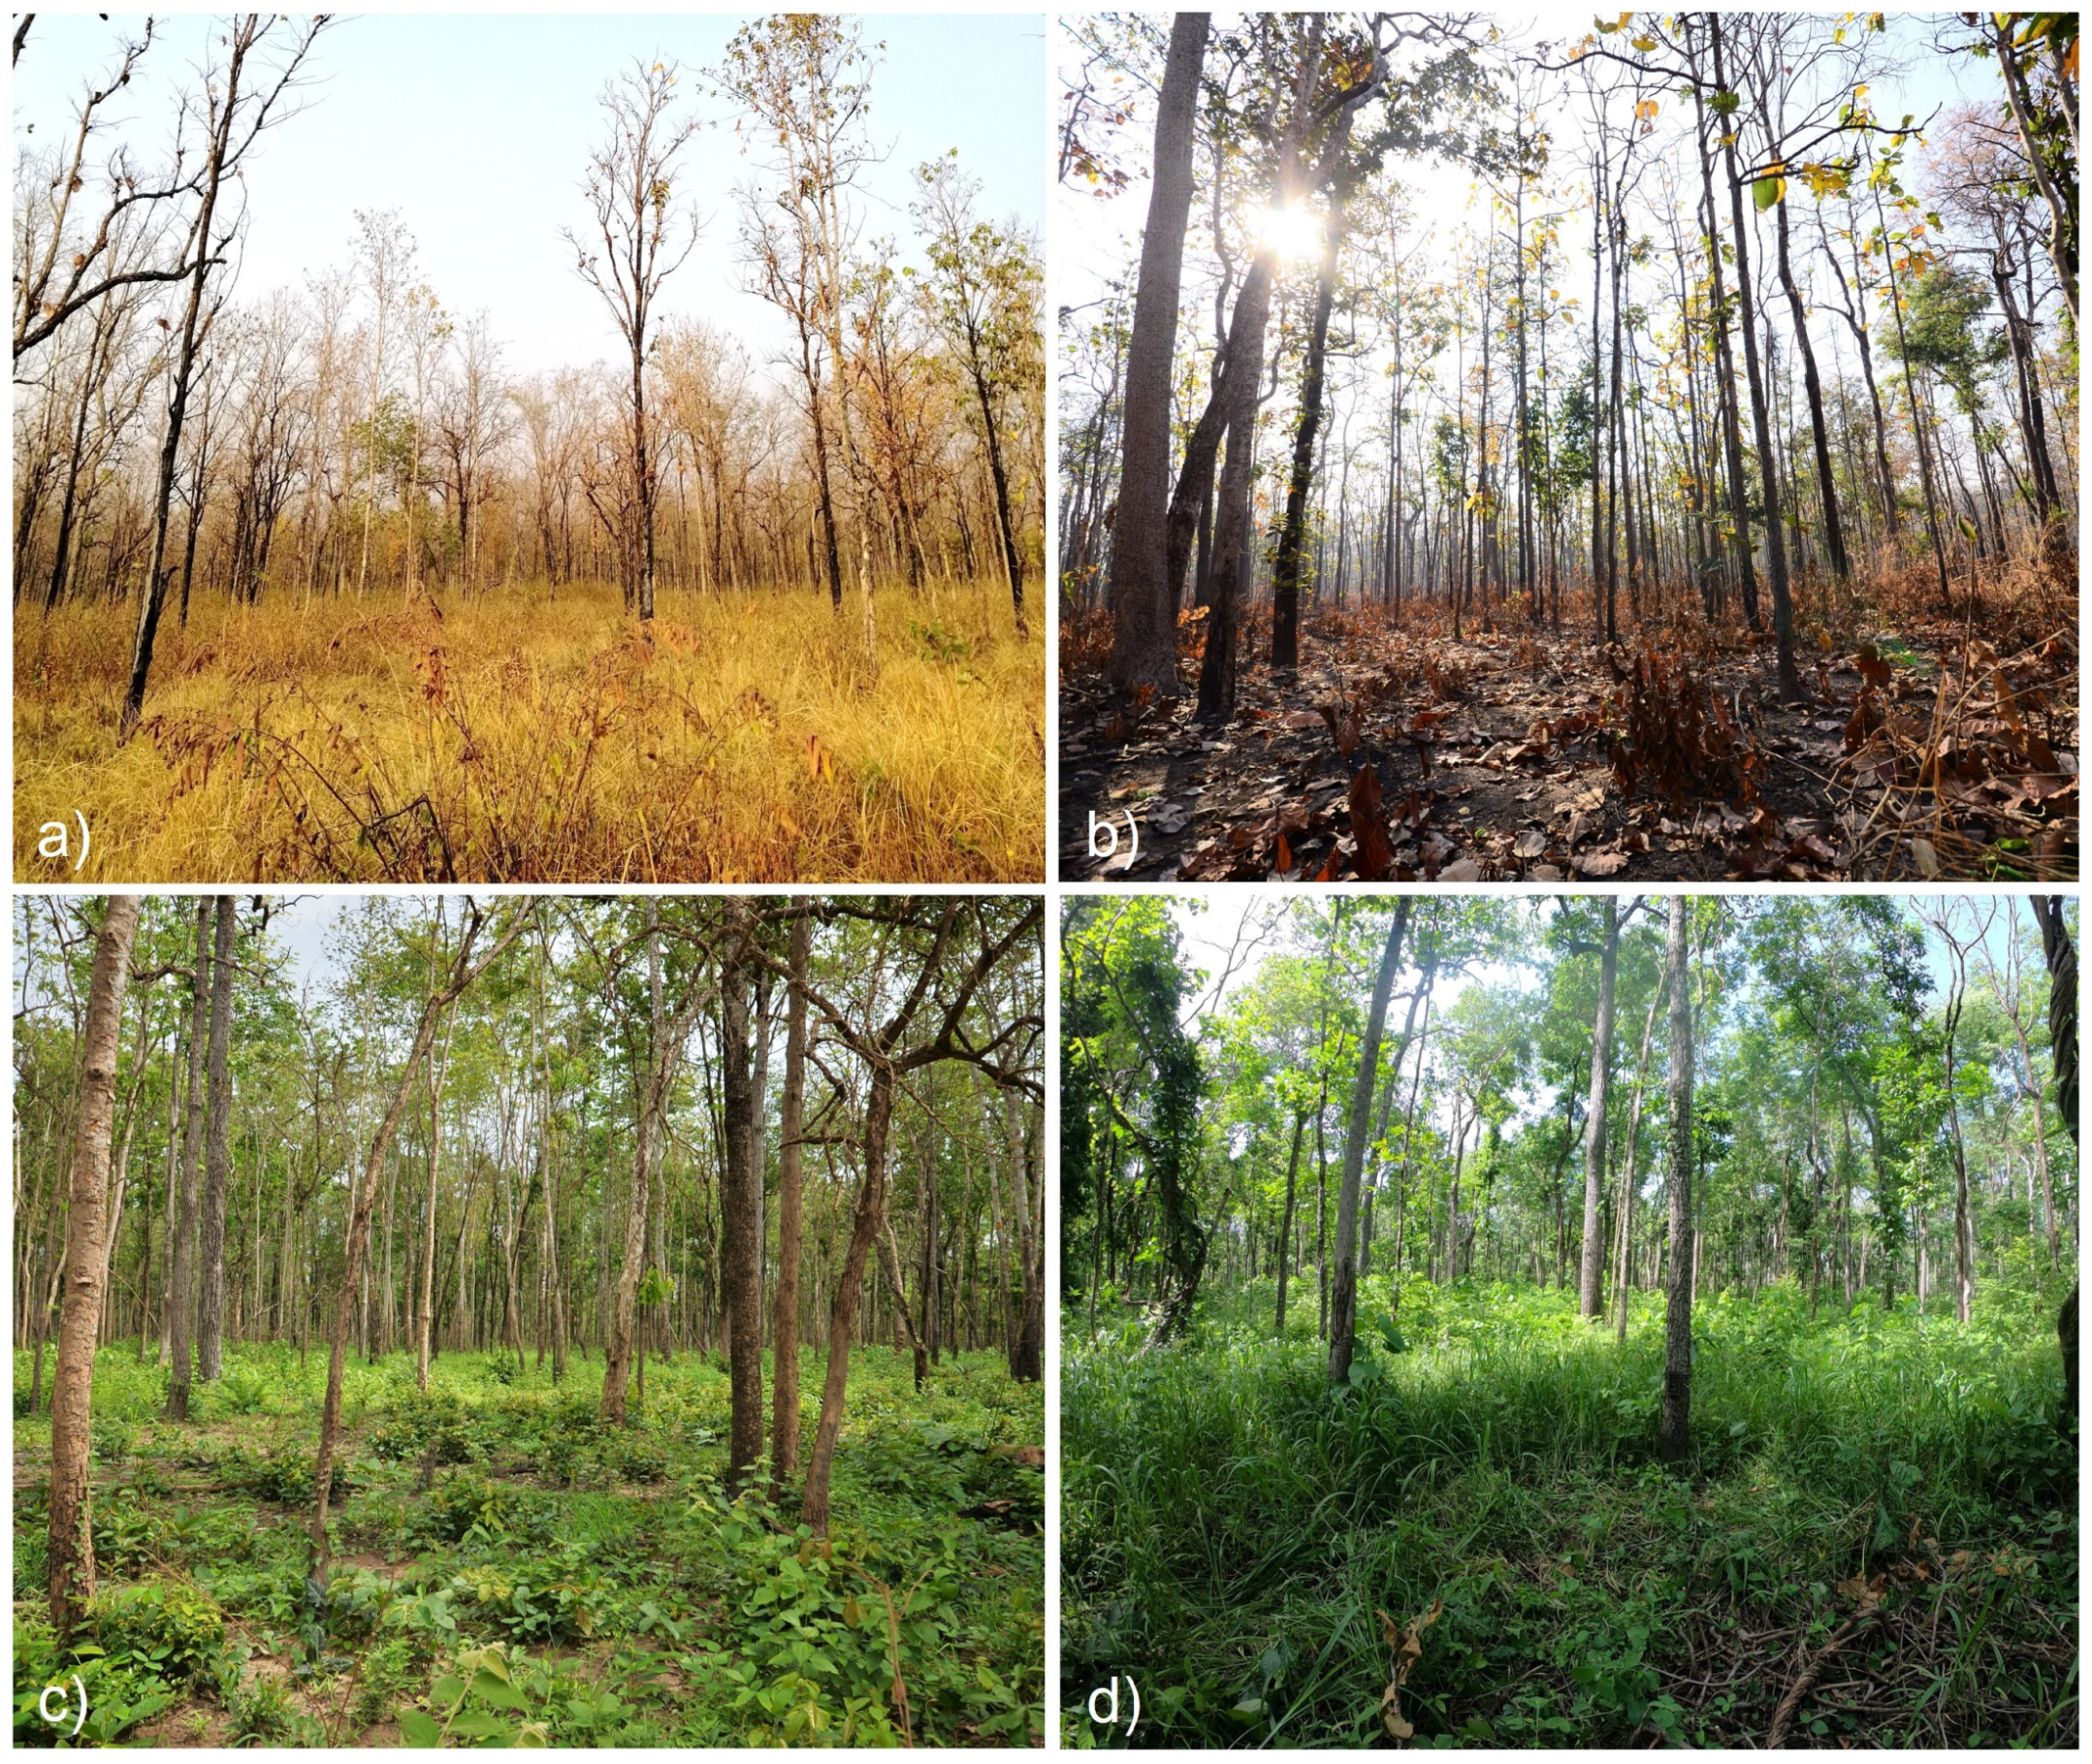
A substantial amount of variation in forage availability was observed throughout the year at the study site. At the beginning of the dry season, about 121.8 ± 31.1 kg ha−1 (mean ± 1 S.E.) of forage was available with more than 50% as shrubs. Then, forage availability reached the lowest point in February 2019 (28.1 ± 11.3 kg ha−1), with forbs as the dominant life form. This point coincided with the lowest monthly rainfall (49.2 mm/month) (Figure 2). Then, the prescribed burn occurred in March 2019, and the rainy season had begun as indicated by the increased rainfall. The forage availability increased to 59.7 ± 21.0 kg ha−1 with the shrubs as the dominant life form. The highest availability was observed between May and June 2019 (208.5 ± 51.8 kg ha−1). Most herbaceous plants started to produce new branches and leaves during this period, which contributed to the observed increase. The following sampling (August 2019) observed older plants and lower forage availability (105.5 ± 57.6 kg ha −1) with grasses as the main life form. Finally, forage availability remained low at 106.1 ± 29.1 kg ha−1 in the last sampling at the end of the rainy season (October 2019), with shrubs and tree seedlings as the main life forms (Figure 3 and Figure 4).
Temporal trends of forage availability varied among the four life forms. Shrubs were the most available form of forage in the study area, followed by tree seedlings, grasses, and forbs. Availability of shrubs decreased significantly between December 2018 and February 2019 (p < 0.001) and increased significantly after the prescribed burn (April, p = 0.009) until reaching a peak in June 2019 (103.7 ± 21.2 kg ha−1) before decreasing again. A similar temporal trend was observed for tree seedlings with the maximum availability at 80.3 ± 13.4 kg ha−1 in June 2019. Forb availability was not significant between December 2018 and February 2019 (p = 0.092), increased significantly after the prescribed burn (April, p < 0.001) until reaching a peak in June 2019 (20.4 ± 3.6 kg ha−1), and decreasing again in August 2019 and October 2019 (p < 0.001). Grass availability appeared to track the pattern of monthly precipitation more than other forms, as it increased four months after forest fire, reached its maximum in the middle of the rainy season (August 2019), and decreased toward the end of the rainy season (Figure 3 and Figure 4, Table S2).

3.2. Forage Availability by Forest Types

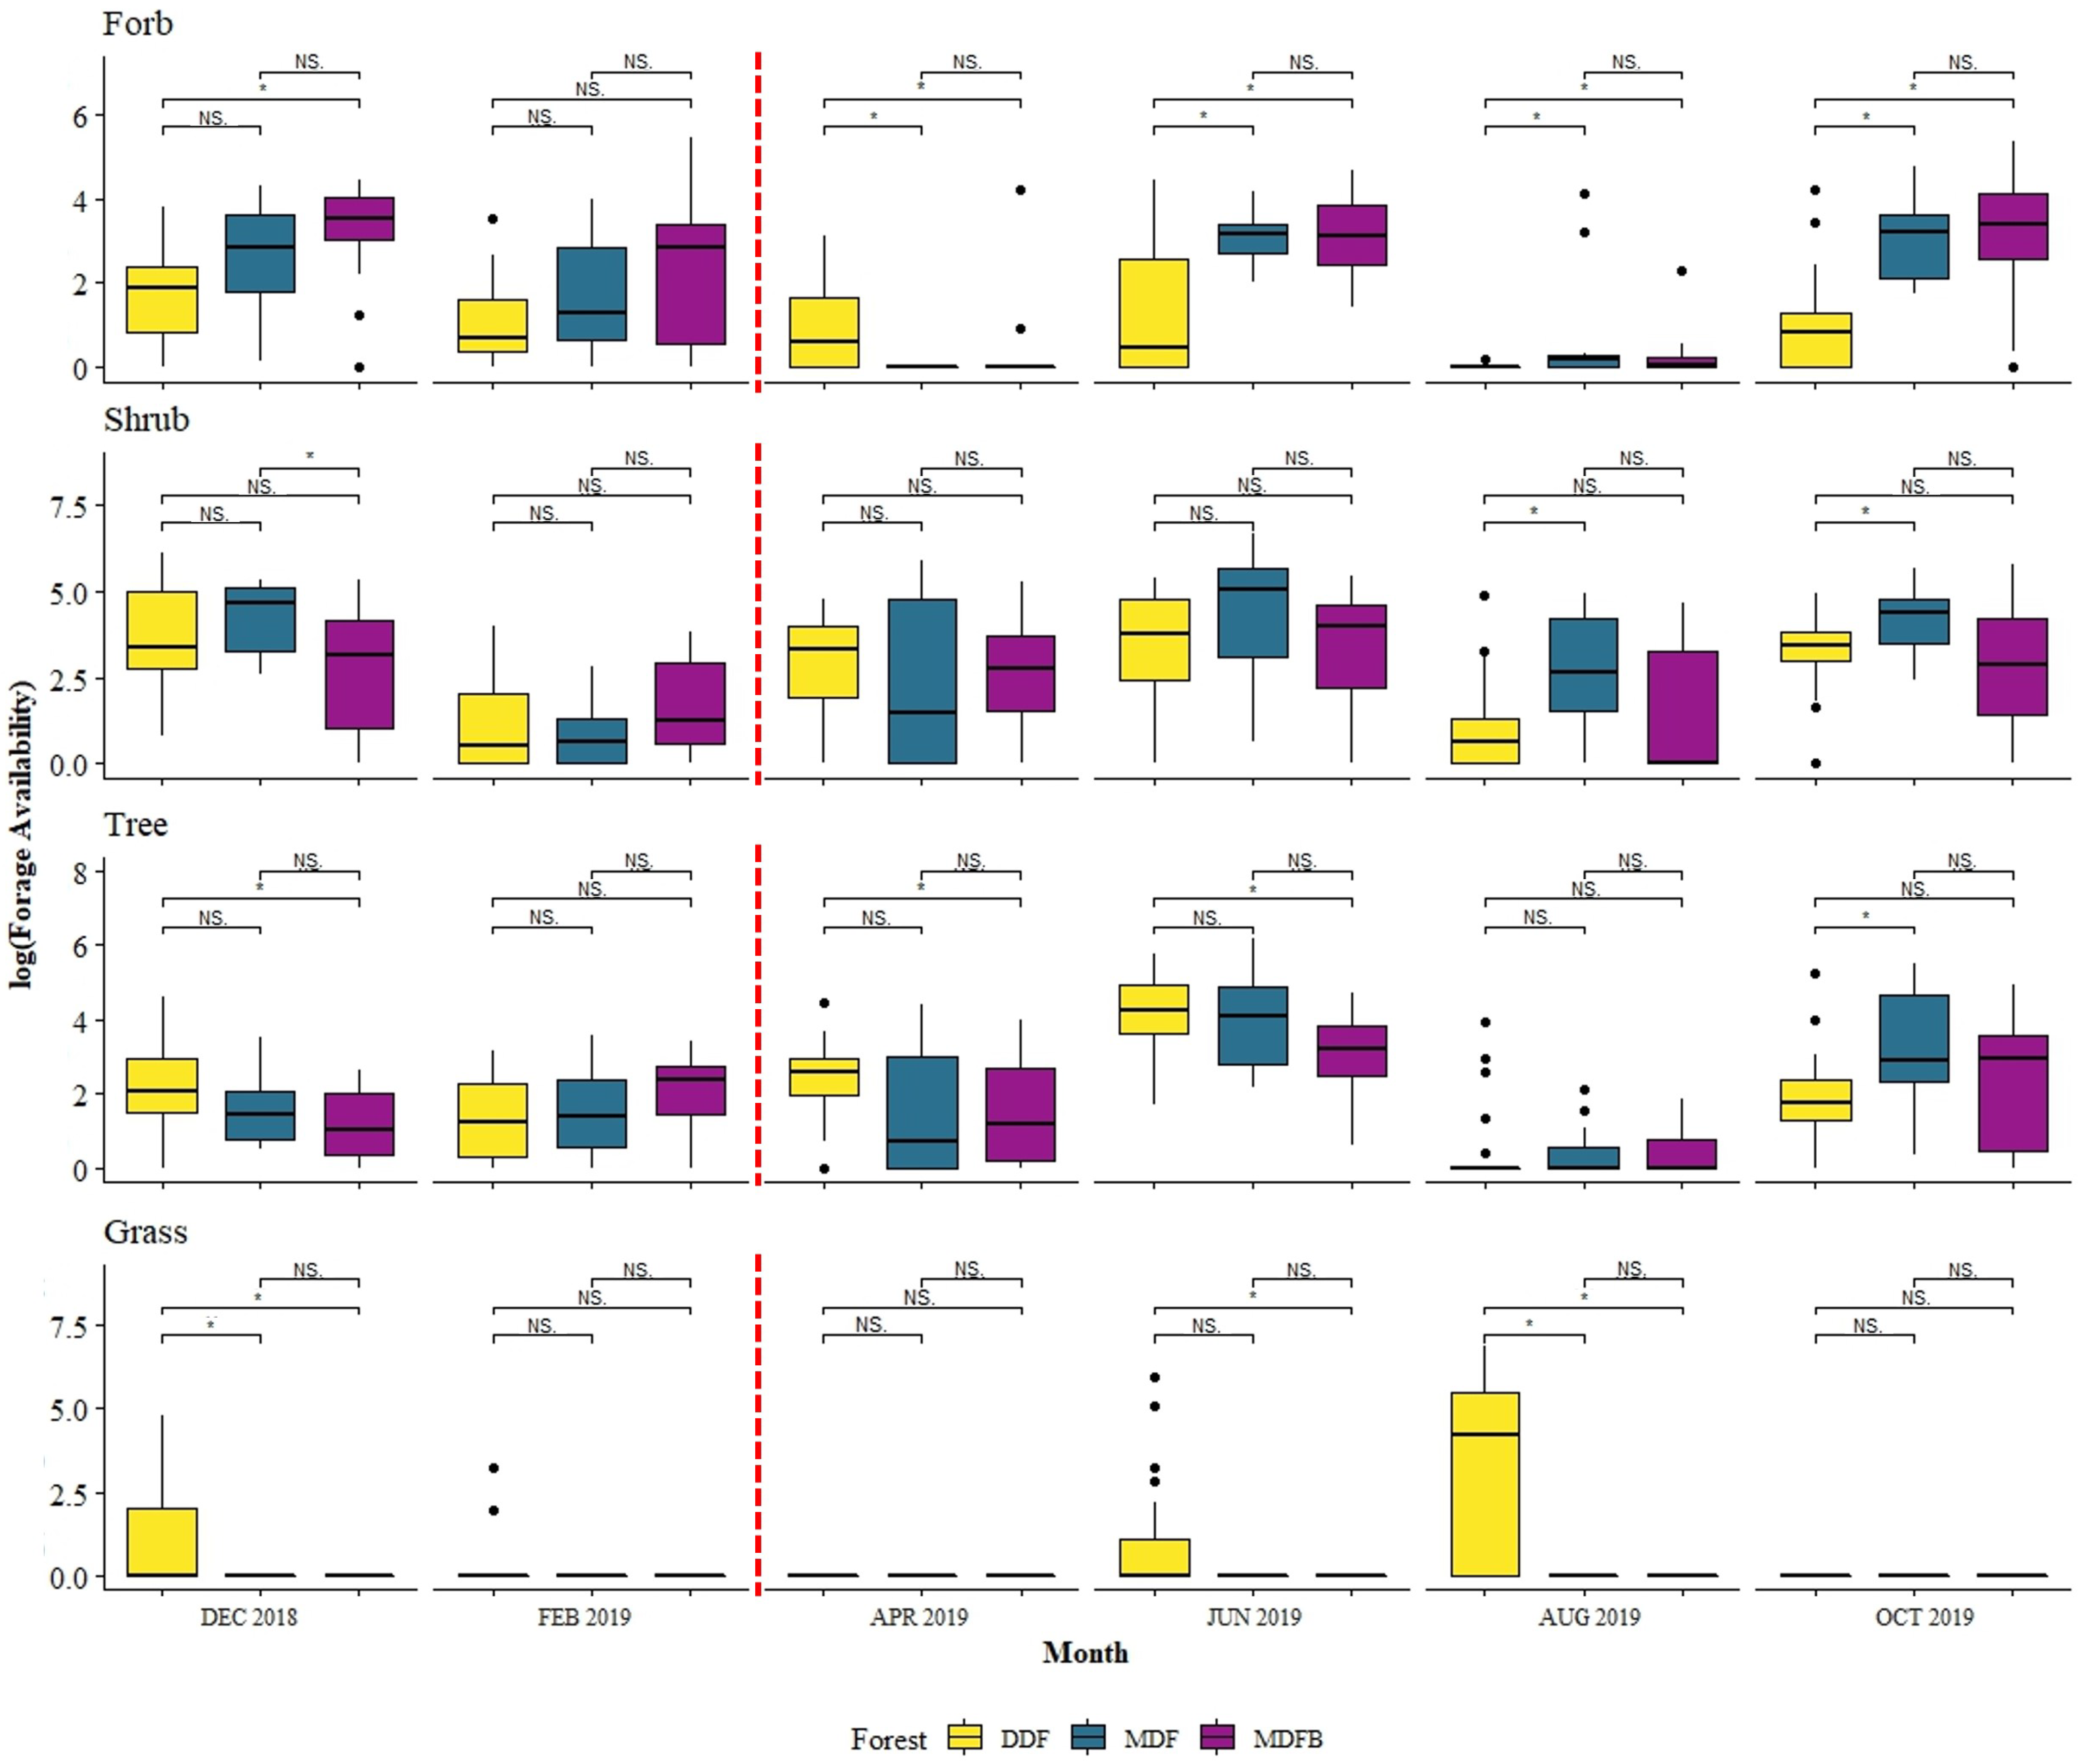
Forage availability also varied among the forest types in the study area (Figure 5). During the peak time (June 2019), plots in the Mixed Deciduous Forest (MDF) had the highest average of forage availability at 349.3 ± 85.5 kg ha−1, followed by the Deciduous dipterocarp Forest (DDF, 203.9 ± 27.6 kg ha−1), and the MDF with bamboo (MDFB, 135.1 ± 27.6 kg ha−1), respectively. However, later in the season (August 2019), the DDF had the highest average forage 195.3 ± 58.5 kg ha−1, with grasses as the primary life form at this time (182.4 ± 106.5 kg ha−1). It should be noted that grasses were only found in the DDF (Figure 5), while the MDF produced the highest available forage in the forms of shrubs and tree seedlings. Plots in the MDF with bamboo had the highest forb availability at 50.1 ± 31.8 kg ha−1 in October 2019, which was the end of the rainy season in the area (Figure 5, Tables S3 and S4).

3.3. Forage Availability and Environmental Factors

The zero-inflated negative binomial model showed significant effects of environmental factors on forage availability in each of the life forms. For forbs, the availability increased significantly with increased soil bulk density (p = 0.04) but decreased significantly with increased tree density (p < 0.001). Grass availability decreased significantly with increased slope, canopy cover, basal area, soil bulk density, and soil pH (p ≤ 0.02). For shrubs, fire frequency and soil pH positively affected the availability (p≤ 0.002), whereas the tree density and slope negatively affected the availability (p≤ 0.01). Finally, the availability of tree seedlings increased significantly with soil pH and bulk density but decreased significantly with slope (Figure 6).

4. Discussion

In the study area, the Mixed Deciduous Forest (MDF) provided the highest forage availability for all life forms, except for the grasses, which were found mainly in the Deciduous dipterocarp Forest (DDF). The results suggest that the MDF plots are the main source of available browse forage for large mammals, while grasses, their preferred food source, appeared to be limited to the DDF. The modeling results (Figure 6) showed that tree density and tree canopy negatively impact the biomass of grasses, as the tree canopy prevented light from penetrating the forest floors and subsequently limited the growth of the light-demanding understories [39]. While many herbaceous plants thrive in a low-light environment, these species are not always consumed by wildlife. The frequent ground fires in the study area might also limit the growth of the useable forage without affecting the canopy structure [11].
The tree density had no significant effect on the number of tree seedlings, probably because seedlings also had to compete with the other life forms in the understory layer. The research [40] found that tree seedlings could not grow under the canopy of denser shrubs, as the shrubs generally had a faster growth rate and tended to outgrow similarly aged tree seedlings [41]. The low density of tree seedlings in this area will result in a low density of saplings and mature trees, subsequently altering the age structure and forest dynamics, making the habitat unsuitable for foraging of large mammal species.
Prescribed burns have different effects on different life forms of forage. Availability of forage shrubs increased significantly with increased fire intensity. The results were consistent with many research [35] findings, which showed that the areas with low-intensity fire had three times more shrub growth than the fire suppressed areas. Most regenerating shrubs were perennial and fire-resistant [42,43] (Figure 4). Even after frequent natural and prescribed burns, these plants can almost immediately produce new branches [34,44], making them a more productive life form than the other herbaceous plants that are annual [45]. During the dry season, annual herbaceous plants are dried out and normally burned with forest fires, leaving only seeds for their annual regeneration.
Given that they have woody stems like shrubs, tree seedlings should have a similar set of responses to fires. However, the seedlings grow more slowly than the shrubs and are often outcompeted by the shrubs [41]. These woody life forms were shown to be sensitive to small differences in microclimates [46] and are likely to respond differently to conditions of post fires. Nonetheless, the increase of forage availability was observed during the rainy season after the fire, followed by the lowest availability right before the next prescribed burn, suggesting an annual pattern of forage availability. It is possible that prescribed burns in this area are responsible for the increased availability that followed and can be used as a way to enhance the productivity of forage plants for large mammal herbivores [15,35,47].
Among soil properties, soil pH appeared to have a significant impact on forage availability. The study area mainly had acidic soils (pH 4.6–7.4). Among the studied life forms, grasses were found in the most acidic soil of the DDF, while the other life forms tended to decrease with the increased acidity. The results were consistent with previous studies that showed higher resistance of grasses to acidic soils [48]. Acidic soils are often considered “poor soils,” as they are less likely to maintain required nutrients, such as calcium, magnesium, and phosphorus, for plant growth [49]. The low forage availability from low nutrients appeared to be in our study area, as the phosphorus concentration positively impacted the forage availability. Phosphorus is one of the macronutrients for plants [50,51], as well as a critical element for animals, particularly female mammals during lactation [52]. Therefore, the forage food grew better and became more nutritious in the high phosphorus areas, and the herbivores might prefer these plants to the less nutritious ones in the DDF. Associations between soil characteristics and food quality will require further studies to gain a complete picture of the study area.
Our study revealed that shrubs were the most available life form of forage plants, followed by tree seedlings, forbs, and grasses, which may not serve the need of the current and expected wildlife populations in the area. Not all consumed forage plant species are equally nutritious. Therefore, several forage species, especially those with high energy and high protein, should be actively managed to be available throughout the landscape and seasons [53]. Some of the notable mammal species in this area, such as banteng, require a large amount of food to sustain the population, as they foray in a herd. The habitat may need a silvicultural intervention to create more forest gaps, which will allow better regeneration of more nutritious life forms (grasses and forbs). Such management may be necessary for the wildlife, particularly during the dry season when food is most scarce [54].
Annual low-intensity ground fires in this area can increase the availability of forage plants, especially the shrubs that can resprout more effectively after the fire [44]. These new “springtime” branches [55] are a good food source for browsing mammals because they contain more protein and less fiber than the older ones. The higher quality food sources allow the animals to digest and convert the plant biomass to energy more effectively [47,56]. In addition, forest fires can help maintain deciduous species and low density in the forest stand [16,17]. Therefore, a habitat manager often uses “prescribed burns” as an easy and economical way to manage the habitat for wildlife [57]. Nonetheless, fire does not always succeed in controlling the density of small trees and shrubs because the fuel loads and fire intensity may not be sufficient to clear out the understory layers [58].
At Huai Kha Khaeng Wildlife Sanctuary, prescribed burns have been regularly administered as part of habitat management for large mammal herbivores. Despite the continuous effort, the current forest structure does not appear to produce enough forage for a large population of animals, particularly in a dry season. This forest was left primarily intact after many years of logging. Many of the sub-canopy and understory plants started to colonize the area and alter the forest structure substantially. For example, as pioneer species, Cratoxylym spp. and Croton spp. are growing at a staggering rate, but they are commonly avoided by herbivores. These species also contribute to the denser canopy cover and lower soil quality. Deciduous dipterocarp Forests in the area has a density of over 1000 stems per hectare, much higher than other typical Deciduous dipterocarp Forests in Thailand at 440–823 stems per hectare [17,59].
Moreover, the Deciduous dipterocarp Forests in the study area contain mostly even-aged stands of smaller stems, a typical stand structure of a secondary forest after logging. The altered forest structure and acidic soil can lead to colonization of other non-dipterocarp species and increase canopy cover, which will affect the productivity of grasses, a significant forage life form for wildlife in this area [60]. In order to ensure that the forest stands remain productive for large mammal herbivore populations, applications of various silvicultural techniques should be considered to manage these forests [61]. For example, stand improvement by selective cutting can remove competing saplings and maintain source trees [62]. Alternatively, some forest stands dominated by Cratoxylym spp. or Croton spp. can be managed with silviculture practices such as clearcutting or seed-tree cutting (by leaving seed trees of Shorea spp.) to provide open space for optimal growth of grasses [18].
Another alternative to altering the forest structure is to create “wildlife food plots” [21] where sources of food and water are actively managed to meet the demands of wildlife [22]. These food plots can be particularly useful during low forage availability (October–April, right before annual fires). Plants for these plots should have high productivity and nutrition to feed the wildlife. These plants include many of the livestock feed, such as Congo grass (Brachiaria ruziziensis), Napier grass (Cenchrus purpureus), and Stylo (Stylosanthes sp.), as well as agricultural crop plants, such as green beans, soybeans, corns, and oats [63]. Maintaining the food plots allow herbivores to have sufficient food all year round. However, the design of food plots and management of wildlife habitats vary with the context of the areas. A manager should consider all the relevant environmental factors before making food plots in the habitat.

5. Conclusions

Forage availability varied considerably across the study area and sampling times. While the Mixed Deciduous Forests produced the highest available forage, the Deciduous dipterocarp Forests yielded more available grasses than any other forest type. The amount of rain and prescribed burn showed significant impacts on forage availability. The negative binomial zero-inflated model showed that different sets of environmental variables significantly affect different life forms of forage plants. Our results indicated that October to February was the time period with low forage availability in the natural forest, which will be helpful for the surrounding villages and farmlands to be on the lookout for the increased wildlife presence in the agricultural areas. These data also can inform the authorities to manage the natural forests in a way that ensures sufficient forage availability for wildlife all year round to reduce the impacts to the surrounding areas. Understanding the factors involving available forage is crucial for habitat management of the buffer area of the Huai Kha Khaeng Wildlife Sanctuary, as it was recently designated as a non-hunting area. The area will need to provide sufficient food for wildlife, particularly large herbivores that require a large amount of food at the right time to sustain a viable population in the future.

Supplementary Materials

The following are available online at: https://www.mdpi.com/article/10.3390/f13091463/s1, Figure S1: Annual precipitation of the study area (mm/year). The blue line showed the total of precipitation per year (mm/year), and the dotted red line showed the mean of annual precipitation during 2001 to 2019 which 1448.65 mm/year; Figure S2: The types of seasonally dry forest in Huai Kha Khaeng Wildlife Sanctuary and Huai Thab Salao-Huai Rabum Non-Hunting Area. (a) Deciduous dipterocarp forest (DDF), (b) Mixed Deciduous Forest (MDF) and (c) Mixed Deciduous Forest with bamboo (MDFB); Figure S3: The traces of animal browsing (forbs, shrubs, and tree seedlings) and grazing (grasses); Table S1: Species list of forage plants found in the study area; Table S2: p-values from comparisons of forage availability of given life forms in between two time points, using Wilcoxon Rank Sum Test ( α = 0.05); Table S3: The means of forage availability associated with lifeforms in different forest types across time periods; Table S4: p-values from comparisons of forage availability of given life forms in between two time points by forest types, using Wilcoxon Rank Sum Test ( α = 0.05).

Author Contributions

N.P. and S.P. originated the idea; N.P., A.C. and E.K. participated in the design of the study; A.C., N.P. and S.P. performed the field work and data collection; A.C., N.P. and E.K. analyzed the data, wrote the article, and edited the manuscript; E.K. and N.P. rechecked and revised the English version of the manuscript. All authors have read and agreed to the published version of the manuscript.

Funding

This research grant was funded by National Science and Technology Development Agency (NSTDA), Thailand (contract number FDA-CO-2563-12498-TH) and the United Nations Development Programme (UNDP) in Thailand (contract reference: 2020/093). Additionally, this research is funded by Kasetsart University through the Graduate School Fellowship Program. We acknowledge the support received from Department of National Parks, Wildlife and Plant Conservation, and the Royal Forest Department gave the permission to work in the site and kept us safe. We would like to thank Uthai Thani Province for various supports. Additionally, we wish to thank various people who have contributed to data collection and valuable, constructive recommendations on this project.

Institutional Review Board Statement

Not applicable.

Informed Consent Statement

Not applicable.

Data Availability Statement

The data that support the findings of this study are available from the corresponding author upon request.

Conflicts of Interest

The authors declare no conflict of interest.

References

  1. Allen, E.B.; Rincón, E.; Allen, M.F.; Pérez-Jimenez, A.; Huante, P. Disturbance and Seasonal Dynamics of Mycorrhizae in a Tropical Deciduous Forest in Mexico. Biotropica 1998, 30, 261–274. [Google Scholar] [CrossRef]
  2. Baker, P.J.; Bunyavejchewin, S.; Oliver, C.D.; Ashton, P.S. Disturbance History and Historical Stand Dynamics of a Seasonal Tropical Forest in Western Thailand. Ecol. Monogr. 2005, 75, 317–343. [Google Scholar] [CrossRef]
  3. McShea, W.J.; Davies, S.J. Seasonally dry forests of tropical Asia: An ecosystem adapted to seasonal drought, frequent fire, and human activity. In The Ecology and Conservation of Seasonally Dry Forests in Asia; McShea, W.J., Davies, S.J., Bhumpakphan, N., Eds.; Smithsonian Institution Scholarly Press: Washington, DC, USA, 2011. [Google Scholar]
  4. Williams, L.J.; Bunyavejchewin, S.; Baker, P.J. Deciduousness in a Seasonal Tropical Forest in Western Thailand: Interannual and Intraspecific Variation in Timing, Duration and Environmental Cues. Oecologia 2008, 155, 571–582. [Google Scholar] [CrossRef]
  5. Baker, P.J.; Bunyavejchewin, S.; Robinson, A.P. The Impact of Large-Scale, Low-Intensity Fires on the Forest of Continental South- East Asia. Int. J. Wildland Fire 2008, 17, 782–792. [Google Scholar] [CrossRef]
  6. Wanthongchai, K.; Goldammer, J.G. Fire management in South and Southeast Asia seasonally dry Forests: Colonial approaches, current problems, and perspectives. In The Ecology and Conservation of Seasonally Dry Forests in Asia; McShea, W.J., Davies, S.J., Bhumpakphan, N., Eds.; Smithsonian Institution Scholarly Press: Washington, DC, USA, 2011. [Google Scholar]
  7. Trisurat, Y.; Pattanavibool, A.; Gale, G.A.; Reed, D.H. Improving the viability of large-mammal populations by using habitat and landscape models to focus conservation planning. Wildl. Res. 2010, 37, 401–412. [Google Scholar] [CrossRef]
  8. Ariyaphithak, C.; Pongpattananurak, N.; Pattanavibool, A.; Podchong, S.; Chankhao, A. Applying SMART Patrol Database for Creating Species Distribution Model of Panthera tigris corbetti in Western Forest Complex, Thailand. J. Environ. Manag. 2020, 16, 42–59. [Google Scholar] [CrossRef]
  9. IUCN-World-Heritage. IUCN World Heritage Outlook 2: A Conservation Assessment of All Natural World Heritage Sites; IUCN: Gland, Switzerland, 2017. [Google Scholar] [CrossRef]
  10. Maxwell, J.F. A Synopsis of the Vegetation of Thailand. Nat. Hist. J. Chulalongkorn Univ. 2004, 4, 19–29. [Google Scholar]
  11. Roques, K.; O’Connor, T.; Watkinson, A. Dynamics of shrub encroachment in an African savanna: Relative influences of fire, herbivory, rainfall and density dependence. J. Appl. Ecol. 2001, 38, 268–280. [Google Scholar] [CrossRef]
  12. McComb, B.C. Wildlife Habitat Management Concepts and Applications in Forestry; CRC Press: Boca Raton, FL, USA, 2007. [Google Scholar]
  13. FAO. Human-Wildlife Conflict in Africa, Causes, Consequences and Management Strategies; International Foundation for the Conservation of Wildlife (Foundation IGF): Paris, France, 2009. [Google Scholar]
  14. Sachro, L.; Strong, W.; Gates, C. Prescribed burning effects on summer elk forage availability in the subalpine zone, Banff National Park, Canada. J. Environ. Manag. 2005, 77, 183–193. [Google Scholar] [CrossRef]
  15. Masters, R.E.; Wilson, C.W.; Bukenhofer, G.A.; Payton, M.E. Effects of Pine-Grassland Restoration for Red-Cockaded Woodpeckers on White-Tailed Deer Forage Production. Wildl. Soc. Bull. 1996, 24, 77–84. [Google Scholar]
  16. Baker, P.J.; Bunyavejchewin, S. Fire behavior and fire effects across the forest landscape of continental Southeast Asia. In Tropical Fire Ecology: Climate Change, Land Use, and Ecosystem Dynamics; Cochrane, M.A., Ed.; Springer: Berlin/Heidelberg, Germany, 2009. [Google Scholar]
  17. Bunyavejchewin, S.; Baker, P.J.; Davies, S.J. Seasonally dry tropical forests in continental Southeast Asia: Structure, composition and dynamics. In The Ecology and Conservation of Seasonally Dry Forests in Asia; McShea, W.J., Davies, S.J., Bhumpakphan, N., Eds.; Smithsonian Institution Scholarly Press: Washington, DC, USA, 2011. [Google Scholar]
  18. Belsky, A.J.; Canham, C.D. Forest Gaps and Isolated Savanna Trees. BioScience 1994, 44, 77–84. [Google Scholar] [CrossRef]
  19. Litvaitis, J.A. Importance of Early Successional Habitats to Mammals in Eastern Forests. Wildl. Soc. Bull. 2001, 29, 466–473. [Google Scholar]
  20. Donalty, S.; Henke, S.E.; Kerr, C.L. Use of Winter Food Plots by Nongame Wildlife Species. Wildl. Soc. Bull. 2003, 31, 774–778. [Google Scholar]
  21. Putman, R.J.; Staines, B.W. Supplementary winter feeding of wild red deer Cervus elaphus in Europe and North America: Justifications, feeding practice and effectiveness. Mammal Rev. 2004, 34, 285–306. [Google Scholar] [CrossRef]
  22. Månsson, J.; Roberge, J.M.; Edenius, L.; Bergström, R.; Nilsson, L.; Lidberg, M.; Komstedt, K.; Ericsson, G. Food plots as a habitat management tool: Forage production and ungulate browsing in adjacent forest. Wildl. Biol. 2015, 21, 246–253. [Google Scholar] [CrossRef]
  23. Suksawat, L.; Sukmasuang, R.; Trisurat, Y. Foraging Preferences and Ecological Carrying Capacity of Banteng (Bos javanicus) and sambar deer (Rusa unicolor) in Huai Kha Khaeng Wildlife Sanctuary, Thailand. J. Trop. For. Res. 2018, 2, 69–81. [Google Scholar]
  24. McShea, W.J.; Sukmasuang, R.; Erickson, D.L.; Herrmann, V.; Ngoprasert, D.; Bhumpakphan, N.; Davies, S.J. Metabarcoding reveals diet diversity in an ungulate community in Thailand. Biotropica 2019, 51, 923–937. [Google Scholar] [CrossRef]
  25. Thai-Meteorological-Department. Annual Climate Summary. 2019. Available online: https://www.tmd.go.th/programs/uploads/yearlySummary/yearly_2562_th.pdf (accessed on 20 January 2022).
  26. Shafer, E.L., Jr. The Twig-Count Method for Measuring Hardwood Deer Browse. J. Wildl. Manag. 1963, 27, 428–437. [Google Scholar] [CrossRef]
  27. Parker, G.; Morton, L. The estimation of winter forage and its use by moose on clearcuts in northcentral Newfoundland. J. Range Manag. 1978, 31, 300–304. [Google Scholar] [CrossRef]
  28. United States Department of Agriculture. Growth Habits Codes and Definitions. Available online: https://plants.usda.gov/growth_habits_def.html (accessed on 31 December 2021).
  29. Wallis de Vries, M. Estimating forage intake and quality in grazing cattle: A reconsideration of the hand-plucking method. J. Range Manag. 1995, 48, 370–375. [Google Scholar] [CrossRef]
  30. Raynor, E.; Joern, A.; Briggs, J. Bison foraging responds to fire frequency in nutritionally heterogeneous grassland. Ecology 2015, 96, 1586–1597. [Google Scholar] [CrossRef]
  31. NASA; JPL. Nasa Shuttle Radar Topography Mission Global 1 Arc Second; NASA EOSDIS Land Processes DAAC; NASA: Washington, DC, USA, 2013.
  32. Back, R. Soil Analysis Handbook of Reference Methods; CRC Press: Boca Raton, FL, USA, 1999; p. 247. [Google Scholar]
  33. Fornacca, D.; Ren, G.; Xiao, W. Evaluating the Best Spectral Indices for the Detection of Burn Scars at Several Post-Fire Dates in a Mountainous Region of Northwest Yunnan, China. Remote. Sens. 2018, 10, 1196. [Google Scholar] [CrossRef]
  34. Peterson, D.W.; Reich, P.B. Prescribed Fire in Oak Savanna: Fire frequency effects on stand structure and dynamics. Ecol. Appl. 2001, 11, 914–927. [Google Scholar] [CrossRef]
  35. Heisler, J.L.; Briggs, J.M.; Knapp, A.; Blair, J.M.; Seery, A. Direct and Indirect Effects of Fire on Shrub Density and Aboveground Productivity in a Mesic Grassland. Ecology 2004, 85, 2245–2257. [Google Scholar] [CrossRef]
  36. Venables, W.N.; Ripley, B.D. Modern Applied Statistics with S; Springer: New York, NY, USA, 2002. [Google Scholar]
  37. Zuur, A.F.; Ieno, E.N.; Walker, N.; Saveliev, A.A.; Smith, G.M. Mixed Effects Models and Extensions in Ecology with R; Springer Science+Business Media: New York, NY, USA, 2009. [Google Scholar]
  38. R-Core-Team. R: A Language and Environment for Statistical Computing; R Foundation for Statistical Computing: Vienna, Austria, 2020. [Google Scholar]
  39. Callaway, R.M.; Walker, L.R. Competition and Facilitation: A Synthetic Approach to Interactions in Plant Communities. Ecology 1997, 78, 1958–1965. [Google Scholar] [CrossRef]
  40. Duncan, R.S.; Chapman, C.A. Tree–Shrub Interactions During Early Secondary Forest Succession in Uganda. Restor. Ecol. 2003, 11, 198–207. [Google Scholar] [CrossRef]
  41. Li, X.; Wilson, S.D.; Song, Y. Secondary succession in two subtropical forests. Plant Ecol. 1999, 143, 13–21. [Google Scholar] [CrossRef]
  42. Peterson, D.W.; Reich, P.B.; Wrage, K.J. Plant functional group responses to fire frequency and tree canopy cover gradients in oak savannas and woodlands. J. Veg. Sci. 2007, 18, 3–12. [Google Scholar] [CrossRef]
  43. Watson, P.J.; Bradstock, R.A.; Morris, E.C. Fire frequency influences composition and structure of the shrub layer in an Australian subcoastal temperate grassy woodland. Austral Ecol. 2009, 34, 218–232. [Google Scholar] [CrossRef]
  44. Hill, S.J.; French, K. Potential impacts of fire and grazing in an endangered ecological community Plant composition and shrub and eucalypt regeneration in Cumberland Plain Woodland. Aust. J. Bot. 2004, 52, 23–29. [Google Scholar] [CrossRef]
  45. Vlok, J.H.J.; Yeaton, R.I. Competitive interactions between overstorey Proteas and sprouting understorey species in South African mountain fynbos. Divers. Distrib. 2000, 6, 273–281. [Google Scholar] [CrossRef]
  46. Zhu, L.; Cooper, D.J.; Yang, J.; Zhang, X.; Wang, X. Rapid warming induces the contrasting growth of Yezo spruce (Picea jezoensis var. microsperma) at two elevation gradient sites of northeast China. Dendrochronologia 2018, 50, 52–63. [Google Scholar] [CrossRef]
  47. Wood, G.W. Effects of Prescribed Fire on Deer Forage and Nutrients. Wildl. Soc. Bull. 1988, 16, 180–186. [Google Scholar]
  48. Pabian, S.E.; Rummel, S.M.; Sharpe, W.E.; Brittingham, M.C. Terrestrial Liming as a Restoration Technique for Acidified Forest Ecosystems. Int. J. For. Res. 2012, 2012, 976809. [Google Scholar] [CrossRef]
  49. Bailey, S.; Horsley, S.; Long, R. Thirty Years of Change in Forest Soils of the Allegheny Plateau, Pennsylvania. Soil Sci. Soc. Am. J. 2005, 69, 681–690. [Google Scholar] [CrossRef] [Green Version]
  50. Malhotra, H.; Vandana; Sharma, S.; Pandey, R. Phosphorus nutrition: Plant growth in response to deficiency and excess. In Plant Nutrients and Abiotic Stress Tolerance; Hasanuzzaman, M., Fujita, M., Oku, H., Nahar, K., Hawrylak-Nowak, B., Eds.; Springer Nature: Singapore, 2018. [Google Scholar]
  51. Meyer, G.; Bell, M.J.; Doolette, C.L.; Brunetti, G.; Zhang, Y.; Lombi, E.; Kopittke, P.M. Plant-Available Phosphorus in Highly Concentrated Fertilizer Bands: Effects of Soil Type, Phosphorus Form, and Coapplied Potassium. J. Agric. Food Chem. 2020, 687, 7571–7580. [Google Scholar] [CrossRef]
  52. French, C.E.; McEwen, L.C.; Magruder, N.D.; Ingram, R.H.; Swift, R.W. Nutrient Requirements for Growth and Antler Development in the White-Tailed Deer. J. Wildl. Manag. 1956, 20, 221–232. [Google Scholar] [CrossRef]
  53. Alldredge, M.W.; Peek, J.M.; Wall, W.A. Nutritional quality of forages used by elk in northern Idaho. J. Range Manag. 2002, 55, 253–259. [Google Scholar] [CrossRef]
  54. Grant, C.; Scholes, M. The importance of nutrient hot- spots in the conservation and management of large wild mammalian herbivores in semi-arid savannas. Biol. Conserv. 2006, 130, 426–437. [Google Scholar] [CrossRef]
  55. Hedtcke, J.; Posner, J.; Rosemeyer, M.; Albrecht, K. Browsing for conservation: Springtime forage value of midstory shrubs of degraded oak savannas in southern Wisconsin. Renew. Agric. Food Syst. 2009, 24, 293–299. [Google Scholar] [CrossRef]
  56. Hobbs, N.T.; Spowart, R.A. Effects of Prescribed Fire on Nutrition of Mountain Sheep and Mule Deer during Winter and Spring. J. Wildl. Manag. 1984, 48, 551–560. [Google Scholar] [CrossRef]
  57. Lopez, R.R.; Parker, I.D.; Morrison, M.L. Applied Wildlife Habitat Management; Texas A and M University Press: College Station, TX, USA, 2017. [Google Scholar]
  58. Haney, A.; Apfelbaum, S.I. Characterization of Midwestern Oak Savannas. In 1993 Proceedings of the Midwest Oak Savanna Conferences; University of Wisconsin Press: Madison, WI, USA, 1993. [Google Scholar]
  59. Sahunalu, P. Structure and Species Composition in the Long-term Dynamic Plots of Sakaerat Deciduous Dipterocarp Forest, Northeastern Thailand. J. For. Manag. 2009, 3, 1–20. [Google Scholar]
  60. Bunyavejchewin, S. Canopy Structure of the Dry Dipterocarp Forest in Thailand. Thai For. Bull. (Bot.) 1983, 14, 1–93. [Google Scholar]
  61. Harlow, R.F.; Lear, D.H.V. Silvicultural Effects on Wildlife Habitat in the South (an Annotated Bibliography) 1953–1979; Clemson University, College of Forest and Recreation Resources: Clemson, SC, USA, 1981. [Google Scholar]
  62. Murphy, A.; Ehrenreich, J.H. Effects of timber harvest and stand Improvement on forage production. J. Wildl. Manag. 1965, 29, 734–739. [Google Scholar] [CrossRef]
  63. Natural-Resources-Conservation-Service. Food Plots for Wildlife (Iowa Job Sheet). 2012. Available online: https://www.nrcs.usda.gov/Internet/FSE_DOCUMENTS/nrcs142p2_007210.pdf (accessed on 20 January 2022).
Figure 1. Large herbivores found in the study area: (a) banteng (Bos javanicus); (b) sambar deer (Rusa unicolor); (c) eld’s deer (Rucervus eldii) and (d) red muntjac (Muntiacus muntjak).
Forests 13 01463 g001
Figure 2. (a) Map of the study area in Huai Kha Khaeng Wildlife Sanctuary and Huai Thab Salao-Huai Rabum Non-Hunting Area, Uthai Thani, Thailand; red squares indicate the location of the forty-eight 30 × 30 m2 sampling plots; (b) diagram of sampling scheme at each of the 30 × 30 m2 sampling plots. All of the environmental factors were quantified at the 30 × 30 m2 plot. The forage availability was calculated from destructive samplings at two scales: (1) The 2 × 5 m2 sub sampling plot for forbs, shrubs, and seedlings with the Twig Count method, and (2) The 1 × 1 m2 sub sampling plot for grass with the direct harvest; (c) climate graph of the study area. The blue line shows daily precipitation (mm/day), and the red line shows mean daily temperature (°C).
Forests 13 01463 g002
Figure 3. Forage availability for the different life forms over six sampling times. The dashed vertical red line shows the period of prescribed burning (22 February to 31 March 2019). The black dots represent data points that are beyond 1.5 times of the interquartile range (IQR) away from the mean. The asterisks (*) indicate a significant difference from the pairwise comparison with the Wilcoxon rank-sum test.
Forests 13 01463 g003
Figure 4. The season changing of forest in the Huai Kha Khaeng Wildlife Sanctuary and the Huai Thab Salao-Huai Rabum Non-Hunting Area. (a) During December–February, all forest condition is in the dry period, and plants drop all leaves. (b) The dry biomass (leaves, branches, and stems) on the forest floor was burned by prescribed burns during March–April. (c) After prescribed burns (begin rainy season, during May–July), most plants resprout more effectively, therefore leaves and branches of plants are new and higher quality food sources for animals. The time called “springtime”. (d) Mid rainy season, during August–October the parts of the plants are old and lower quality for herbivores.
Forests 13 01463 g004
Figure 5. Forage availability for the different life forms and forest types over six sampling times. The dashed vertical red line shows the period of prescribed burning (22 February to 31 March 2019). The black dots represents data points that are beyond the 1.5 times of interquartile range (IQR) away from the mean. The asterisks (*) indicate a significant difference, and “NS” indicate a non-significant difference from the pairwise comparison with the Wilcoxon rank-sum test.
Forests 13 01463 g005
Figure 6. Coefficient plot showing the relative effect sizes of each environmental factor on forage availability in different life forms (denoted by different colors). The squares represent the mean of the coefficient estimate, and the lines represent the 95% confidence intervals. The red dashed line indicates no effect (coefficient = 0).
Forests 13 01463 g006
Table 1. Characteristics of forage plant parts utilized by large herbivores. The numbers are means ± 1 standard error. The letters in superscript indicate significantly different groups based on Tukey Honest Significant Differences ( α = 0.05).
Life FormDiameter * Total Length + Fresh Weight + + Dry Weight + + Water Content
(n = Number of Samples)(mm)(mm)(g)(g)(%)
Forbs (n = 68)1.8 a  ± 0.1238.2 a  ± 60.61.9 a  ± 0.20.4 a  ± 0.0573.9 b  ± 1.49
Shrubs (n = 60)1.9 a  ± 0.1197.8 a  ± 13.02.3 a  ± 0.30.8 a  ± 0.166.5 a  ± 0.98
Tree seedlings (n = 92)2.0 a  ± 0.1178.1 a  ± 9.02.7 a  ± 0.30.8 a  ± 0.166.4 a  ± 0.95
Grasses (n = 9)NA162.8 a  ± 59.310.0 ± 2.52.96 ± 6.7163.7 a  ± 4.99
* Diameters were measured from the consumed plant parts. This measurement was not available for grasses. + Total lengths were estimated by comparing them to the nearby intact plants. ++ Fresh and dry weights of twigs were measured from the intact plant parts of similar sizes to the consumed ones. The weight of grasses was estimated from the consumed amount per 1 m2 and not used in the multiple comparisons with the other life forms.
Publisher’s Note: MDPI stays neutral with regard to jurisdictional claims in published maps and institutional affiliations.