Article

Does the Slope Aspect Influence the Soil Organic Matter Concentration in Forest Soils?

1
“Marin Dracea” National Institute for Research and Development in Forestry, 13 Cloşca Street, 500040 Braşov, Romania
2
“Marin Dracea” National Institute for Research and Development in Forestry, 73BIS Calea Bucovinei Street, 725100 Câmpulung Moldovenesc, Romania
*
Author to whom correspondence should be addressed.
Forests 2022, 13(9), 1472; https://doi.org/10.3390/f13091472
Submission received: 24 August 2022 / Revised: 3 September 2022 / Accepted: 7 September 2022 / Published: 13 September 2022
(This article belongs to the Section Forest Soil)

Abstract

:
Forest soils belong to the major carbon sinks on Earth because of their high organic matter content. Forest soils from Europe store approximately 1.5 times more carbon than trees (EC/UN-ECE 2003). As dystric cambisol (2,292,385 ha) and eutric cambisol (869,909 ha) are the most widespread forest soils in Romania, we studied 5958 dystric cambisol pedogenetic horizons and 6784 eutric cambisol pedogenetic horizons. A series of correlations was made between soil organic matter and elevation, but also with tree age and stand production class. The differences between stratified soil organic matter in terms of slope aspect categories were tested, and multiple linear regression was used to determine the influences of some relief (elevation) and stand (age) characteristics on the soil organic matter content. Overall, the soil organic matter content increased with increasing elevation. Based on all 12,742 soil samples over a period of 33 years, the soil organic matter content is influenced by elevation and tree age, especially on shaded and partially shaded slope aspects.

1. Introduction

Soils are the largest carbon reservoirs of the terrestrial carbon cycle, containing about three times more carbon than the world’s vegetation and holding double the quantity of carbon (at higher elevations and high-latitude permafrost soils) than the atmosphere [1,2,3,4].
Forest soils are one of the major carbon sinks on Earth because of their high organic matter content [5,6]. Soils can act as sinks or as a source for carbon in the atmosphere, depending on the changes in soil organic matter [7,8]. Forest soils in Europe store approximately 1.5 times more carbon than trees [9], and it is expected that the importance of forest soils for the European carbon cycle will increase even more in the future [10,11]. Soils play an important role in the total carbon stock and in mitigating greenhouse effects [12,13]. Of the total soil organic carbon (SOC) stock of global soils, 40% is stored in forest ecosystems [14].
Carbon storage in forest ecosystems is strongly affected by climate, forest type, stand age, disturbance regimes and edaphic conditions [15,16,17,18,19,20,21,22,23], and the organic carbon concentration is affected by soil-forming factors (climate, time, parent material, vegetation and landform) [24,25,26,27]. The relationship between environmental conditions and soil organic carbon concentration has been already proven [28] such that it may be broadly anticipated from environmental factors [29,30,31].
There are several studies on the relationships between organic carbon concentration and the factors that influence it. For example, [32] investigating carbon concentrations and taking into account climate and vegetation, [33] reported that the carbon concentration varies with annual precipitation, forest type and clay content [34], whereas [35,36,37] report that soil C concentrations in mountainous terrain increase with elevation. Other studies on the effects of elevation on community composition, forest productivity and soil carbon concentration have been performed by [38,39,40], but the elevation pattern of C storage in forest ecosystems remains poorly studied [41]. References [42,43] report that soil C concentration increases with increasing elevation (decreasing temperature) and decreases with decreasing latitude.
Depending on the elevation, in different moments it is possible to appear insolation and this determines the presence tof some microclimates [44]. Therefore, in these microclimates the soil moisture can present differences compared with the rest of the site slope aspect [44].
The slope aspect could induce microclimatic differences, which could be an important factor for the significant variations in forest carbon stocks. Elevation and slope aspect play key roles in determining the temperature regime of any site [44]. Considering sun radiation, seasonal climatic cycles differ between N- and S-, E- and W-facing slope aspects and between steep and gentle slopes [45]. In this sense, the slope aspect can contribute to the spatial variability in soil organic carbon (SOC), affecting the abiotic and biotic factors [46,47,48,49,50]. Determining the slope aspect can, therefore, be important in forest ecosystem management practices against the background of a changing climate [51,52].
However, only few studies have investigated the effect of slope aspect on soil carbon stocks [44,53,54,55]. In this sense, the aim of the current study was to understand the influence of slope aspect on organic carbon levels. For this purpose, we have chosen the two most widespread forest soils from Romania (dystric cambisol and eutric cambisol) for which the soil organic matter content was determined and also taken into account were characteristics of relief and stand. We hypothesized that the soil organic matter content may be different depending on slope aspect categories and other characteristics of stand or relief could have an influence on soil organic matter content from various slope aspects. The novelty of the present research is represented by a very large data input at the national level for the most-spread forest soils (dystric cambisol and eutric cambisol). Considering these, the results of this study bring important advance knowledge for a better understanding of the factors which can influence the soil organic matter content.

2. Materials and Methods

The data for this study were collected from the forest management plans during 1982–2014. Two types of soil, namely dystric cambisol and eutric cambisol from all over the country, were taken into account. We analysed the values for these two soils, values which are grouped on pedogenetic horizons. In total, we analysed 5958 pedogenetic horizons for dystric cambisol and 6784 horizons for eutric cambisol. These values are grouped as follows: 629 pedogenetic horizons during 1982–1989, 4742 horizons during 1990–1999, 6546 horizons during 2000–2009 and 825 horizons during 2010–2014.
In Romania, the most widespread forest soils are dystric cambisol (2,292,385 ha), haplic luvisol (1,440,052 ha), eutric cambisol (869,909 ha), entic podzol (447,657 ha), preluvisol (soil type from the Romanian classification, included in the international classifications as luvisol) (335,050 ha) and fluvisol (330,564 ha) [56]. In hilly and mountainous areas, the most widespread soils are eutric cambisol and dystric cambisol (Figure 1).
Of all the physical and chemical soil properties, the soil organic matter content was chosen. The soil organic matter content was determined according to Romanian and international standards, applying the following methods: humid oxidation and titrimetric dosage method (Walkley-Black method in Gogoasa change) [57]. The soil organic matter content for the two studied soils was separated in pedogenetic horizons (Ao—ochric; Bv—cambic) and then was sorted on the eight types of slope aspect: S, SW, W, SE, N, NE, E and NW. A series of other characteristics was taken into account such as elevation, stand age and production class. Site and stand parameters were determined within the forest management planning. In Romania, forests from the national forest fund are replanning every 10 years, determining elevation, field aspects, composition, production class and age.

Statistical Analysis

The sequences of soil organic matter values grouped within eight slope aspect types were analysed using the Shapiro–Wilk test to check normal distribution. After the tests, the normality hypothesis was rejected for both soil types and for each horizon category (Ao, Bv), thus nonparametric statistics was applied. Subsequently, we eliminated the extreme values, namely those situated outside the xi < Q1 – 1.5(Q3 – Q1) and xi > Q3 – 1.5(Q3 – Q1) intervals (where Q1 and Q3 are the first and third quartiles, respectively).
A series of correlations was then made between soil organic matter content and elevation as well as with two stand characteristics (age and production class). These correlations took advantage of the nonparametric statistics, namely the Spearman correlation coefficient. They were performed for each slope aspect category as well as for all the slope aspects considered as a whole. Furthermore, the correlations were calculated on year intervals by gradually adding a time interval. The time intervals were as follows: 1982–1989, 1990–1999, 2000–2009, 2010–2014. All correlations took into account only the soil organic matter content from the Ao horizon, as this stores the largest quantity of soil organic matter. In addition, all correlations were calculated differentially for the two studied soil types (dystric cambisol and eutric cambisol).
The Kruskal-Wallis significance test is generally used to assess the differences between more than two groups [58]. For the present study, this test was applied for testing the differences between the soil organic matter contents stratified by different slope aspect categories.
Multiple linear regression was used to determine the influences of independent characteristics on the variation of a single dependent characteristic [58]. In this case, multiple linear regression was applied to establish the influences of some relief characteristic (elevation) and stand characteristics (age) on the soil organic matter content for the different soil types and genetic horizons. Significance was tested with the Fisher test, but without testing the significance of the multiple regression equation coefficients that show which of the independent variables has a more significant influence on the dependent variable [58]. Our focus was to determine whether the main relief and stand characteristics influence the content of soil organic matter grouped on slope aspects categories. The influence degree is given by the value of the R² determination coefficient, whereas the intensity of the link between the considered variables is given by the R multiple correlation coefficient. Statistica version 8 software was used to calculate the multiple linear regression and Spearman correlation coefficient.

3. Results

This section may be divided by subheadings. It provides a concise and precise description of the experimental results, their interpretation, as well as the experimental conclusions that can be drawn.

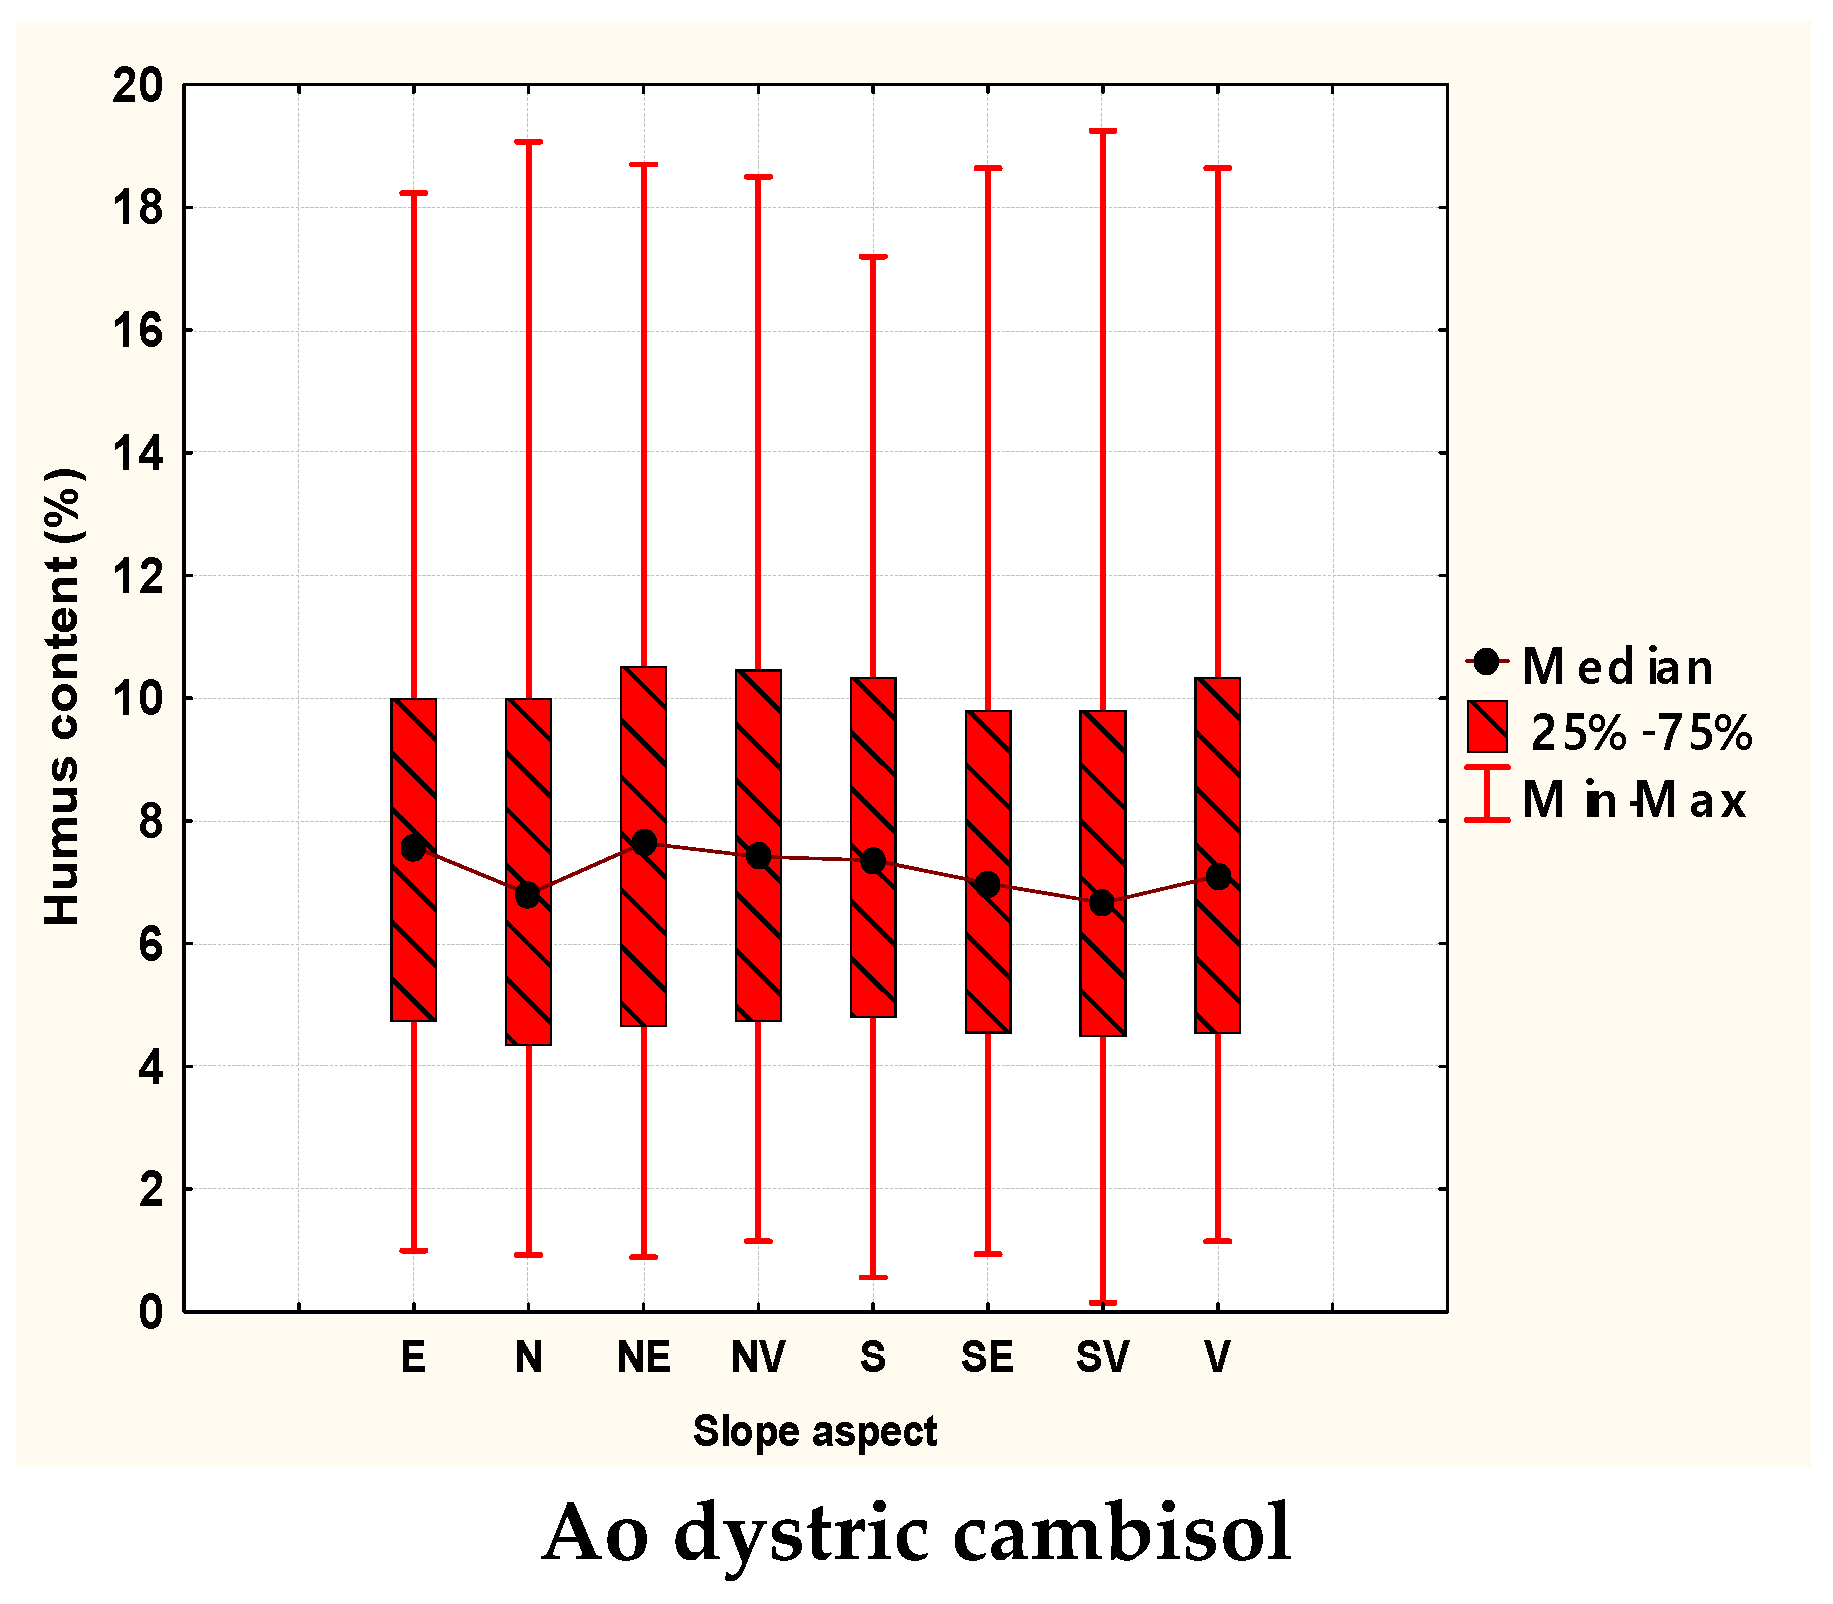
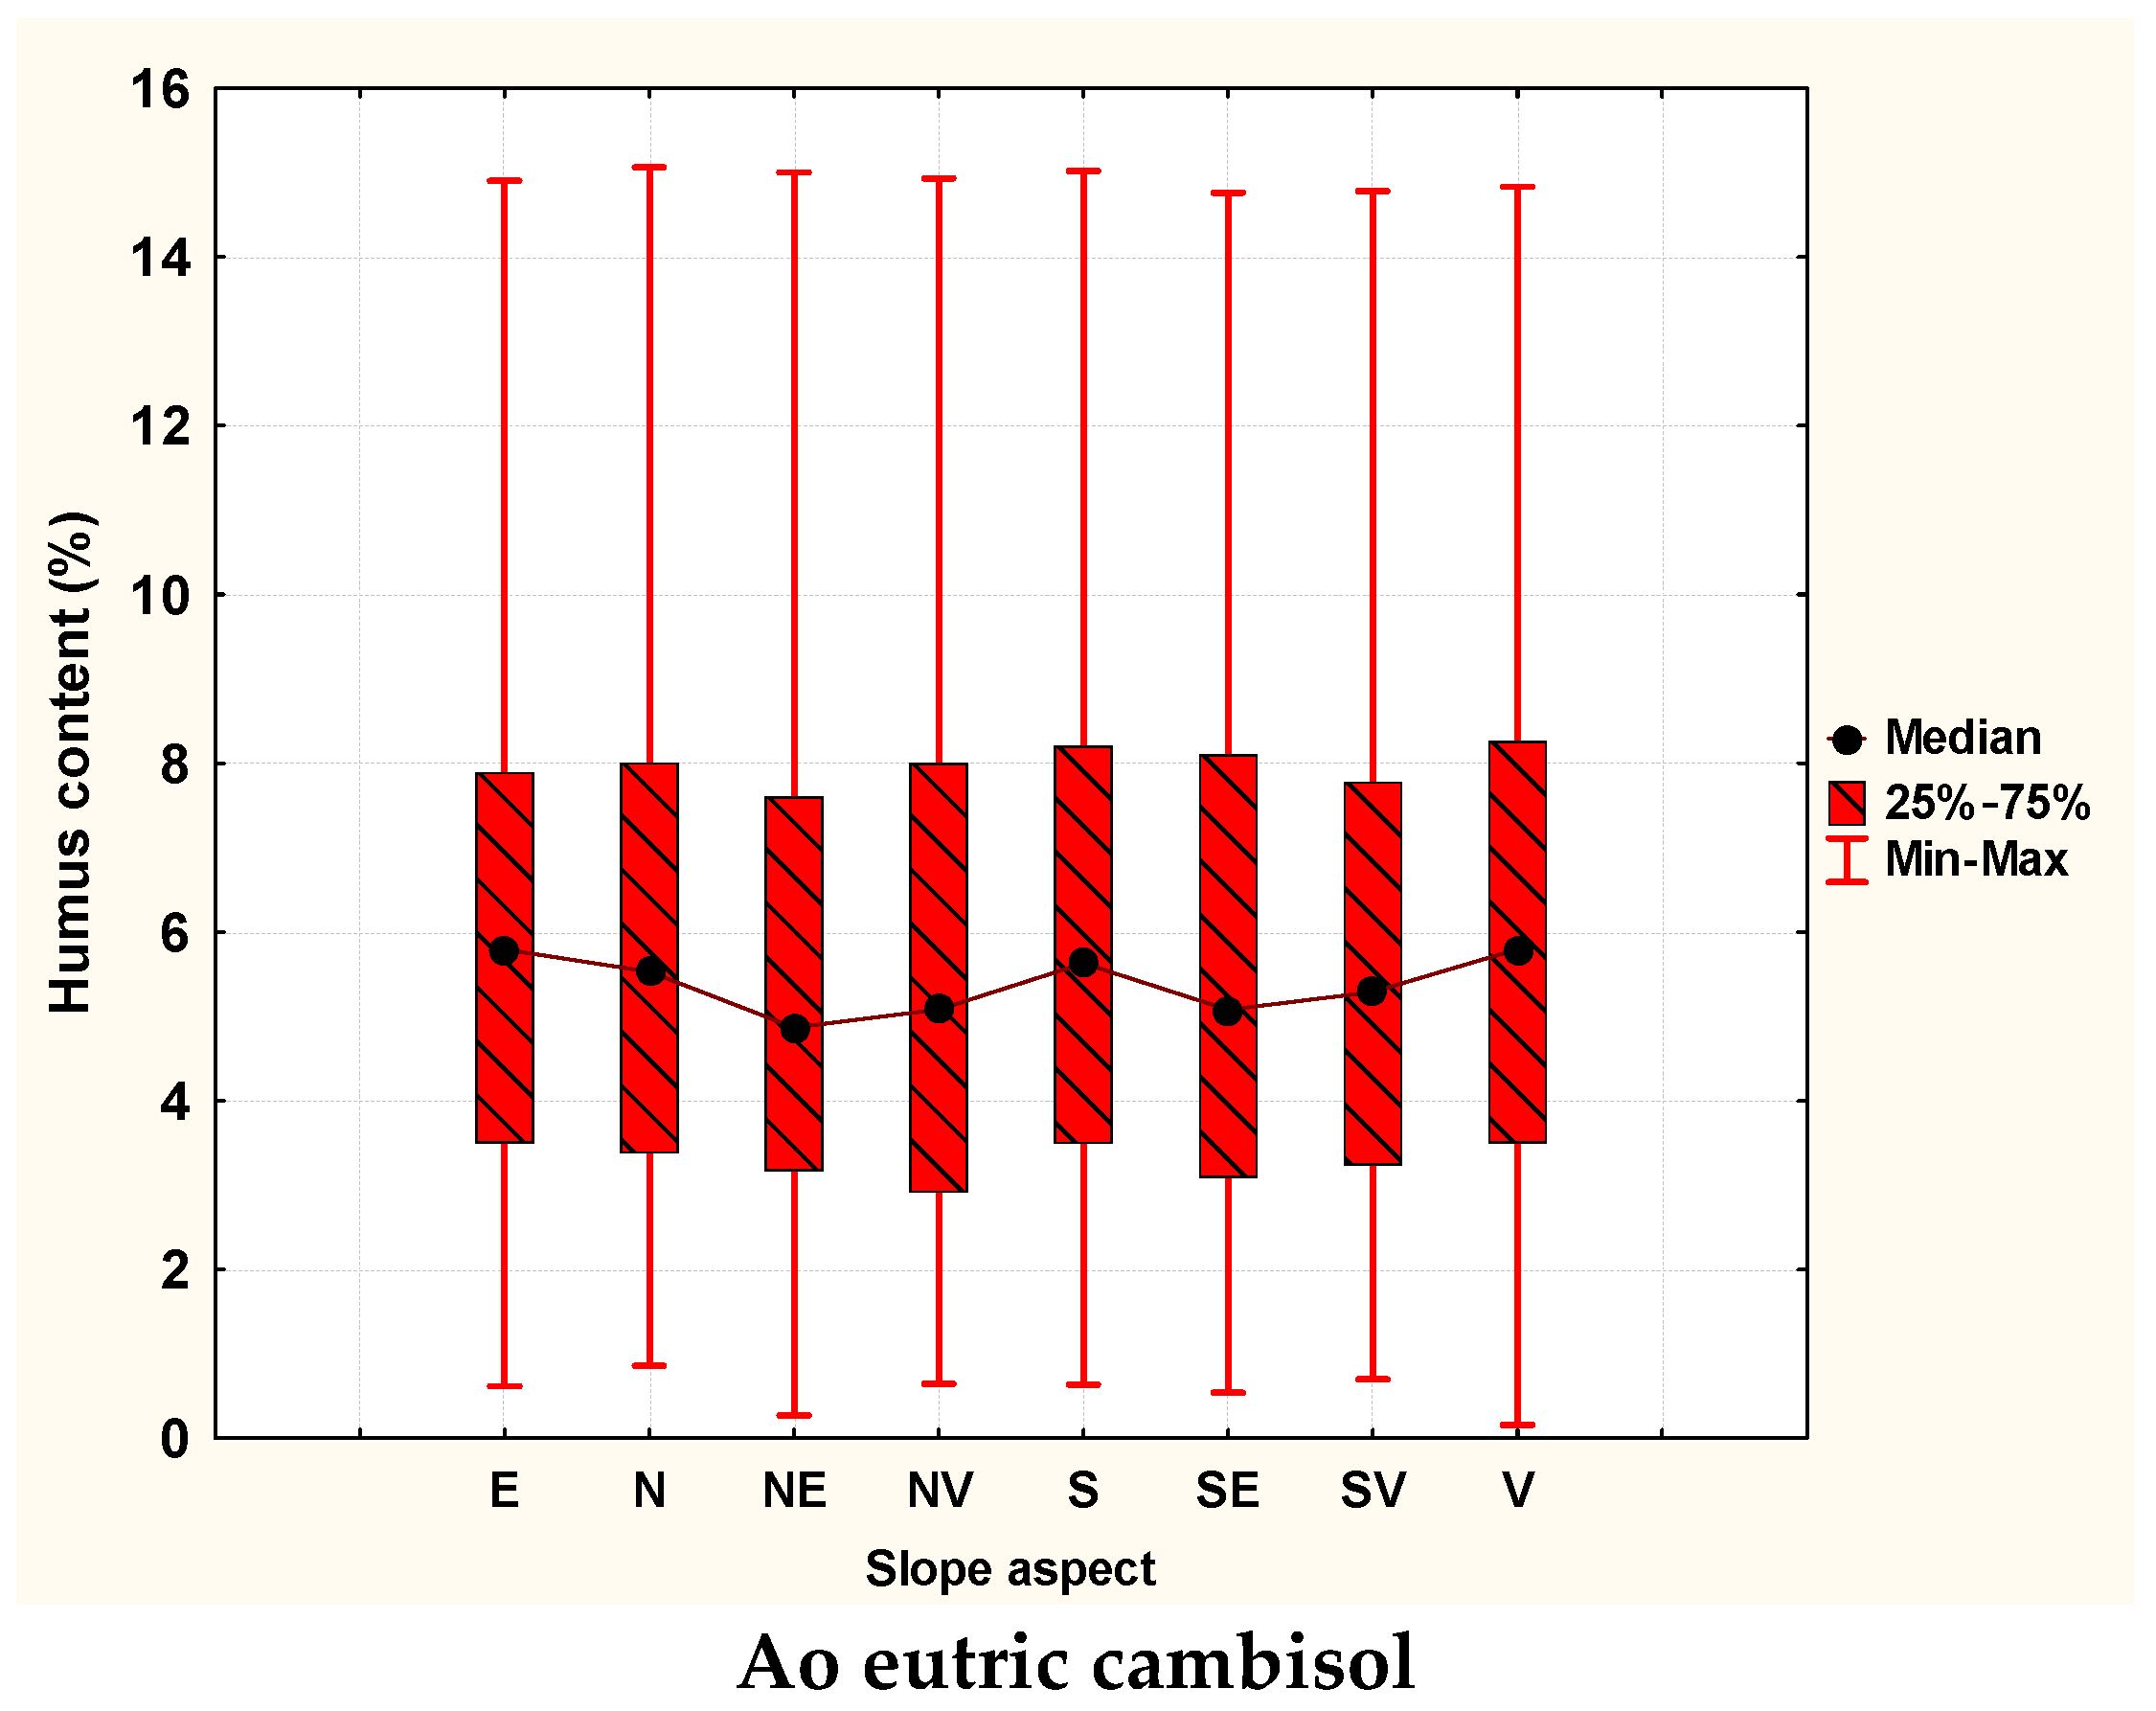
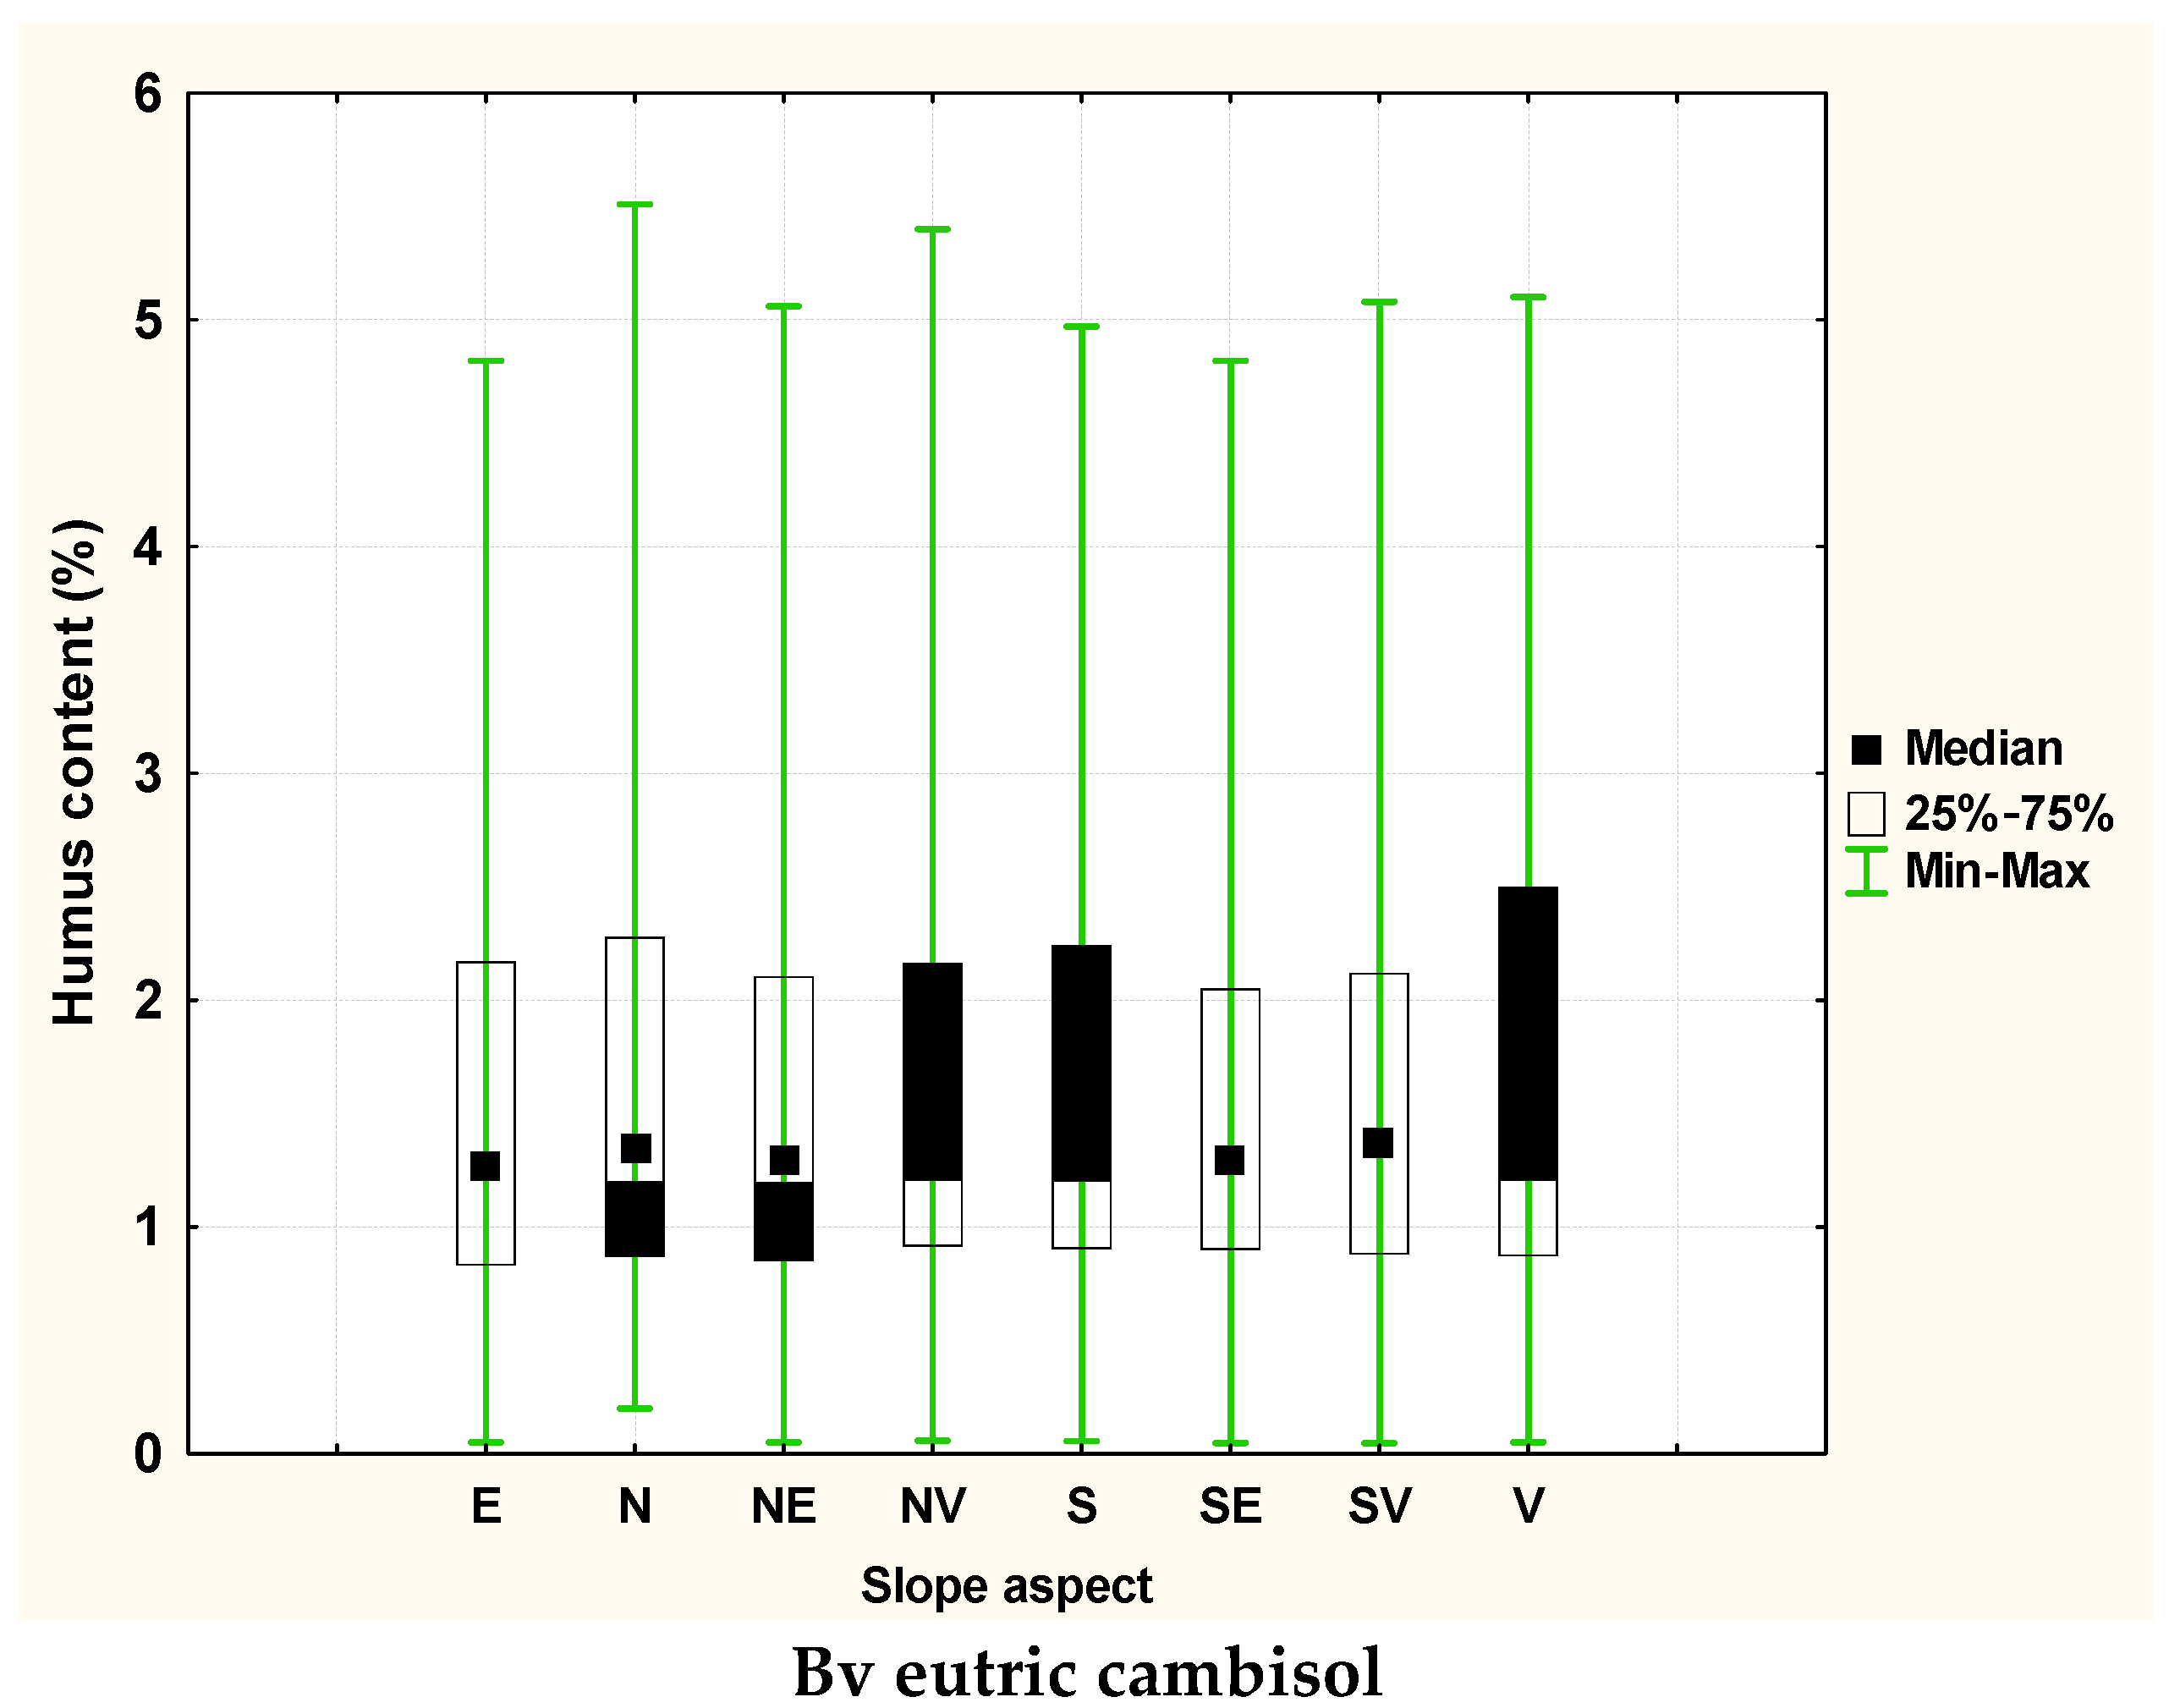
3.1. Variation of Soil Organic Matter Quantity of Soil Types and Pedogenetic Horizons Depending on Slope Aspect

The variation of soil organic matter quantity of the two studied soil types (eutric cambisol and dystric cambisol) is shown graphically for both horizons (Ao and Bv; Figure 2, Figure 3, Figure 4 and Figure 5). The soil organic matter content was stratified for the eight slope aspect categories. All available data from 1982–2014 were used. The median value was calculated for each slope aspect category instead of the arithmetic average as the data sequences did not follow a normal distribution. In this context, nonparametric statistics were used. The graphs show the minimum and maximum values of soil organic matter content for the different slope aspect categories, both in the bioaccumulation horizon (A ocric) and in the mineral horizon (B cambic) (Figure 2, Figure 3, Figure 4 and Figure 5).

3.2. Testing the Significance among Soil Organic Matter Content of Different Slope Aspect Categories

We have also tested the significance between the soil organic matter content sorted in four slope aspect categories, namely sunny (S and SW), partially sunny (W and SE), shaded (N and NE) and partially shaded (E and NW) (Table 1). As mentioned before, this was performed for both soil types as well as for the genetic horizon types (Table 1).
In addition, we made another type of sorting soil organic matter content, namely on the eight field aspect types (N, E, W, S, NE, NW, SE, SW) (Table 2). Similar to the previous testing, this was also realised for both studied soils and for the associated genetic horizons (Table 2). As such, 2468 samples were used for dystric cambisol for the Ao horizon and 3272 for the Bv horizon, 2765 samples for eutric cambisol for the Ao horizon and 3675 for the Bv horizon.

3.3. Correlation between Soil Organic Matter Content and Elevation, Stand Age, Production Class

Spearman correlation was determined for the soil organic matter contents from the Ao horizon regarding elevation, production class and stand age for both soils. The soil organic matter content was sorted in the eight slope aspect categories, and the correlation was determined for each slope aspect type and for both soils (Table 3 and Table 4). Furthermore, Spearman correlation was also performed between soil organic matter content and the above-mentioned soil types variables but without the stratification of the soil organic matter content by slope aspect categories (Table 3 and Table 4).
The correlation between soil organic matter quantity and other stand and relief characteristics was determined in year intervals, by successively adding a time interval. In this way, we started from a time interval of 8 years (1982–1989) and then to these were added data from 1990–1999 (10 years), followed by 2000–2009 (10 years) and then 2010–2014 (5 years). The last correlation category had the highest number of samples (Table 3 and Table 4). For example, in the case of dystric cambisol, the NV slope aspect started with 17 samples for the first correlation category (1982–1989 interval), reaching a number of 312 samples in the last category, including all samples from all time intervals. The correlations marked with red color are significant from statistic point of view at p < 0.05.

3.4. Influences of Different Stand and Relief Parameters on the Soil Organic Matter Content Grouped on Slope Aspect Types

We used the multiple linear regression to determine the influence degree of certain stand (age) and relief (elevation) characteristics on the soil organic matter content previously sorted for the eight slope aspect categories (N, E, W, S, NE, NW, SE, SW) (Table 5 and Table 6). As such, the multiple linear regression had one dependent variable (soil organic matter content stratified on eight slope aspect categories) and two independent variables (stand age and elevation). Multiple linear regression was realised for both soil types (dystric cambisol—Table 5; eutric cambisol—Table 6) and for genetic horizons. We took into account only the soil organic matter content from the A ochric horizon as this horizon allows the formation of soil organic matter and stores the largest quantity. All soil samples from all time intervals (1982–2014) were taken into account. In total, 2459 samples for dystric cambisol and 2758 samples for eutric cambisol were used for the multiple linear regression. In addition, the multiple linear regression was performed with the same independent variables but with the dependent variable (soil organic matter content from the Ao horizon) not grouped into slope aspect types (Table 5 and Table 6).

4. Discussion

4.1. Variation of Soil Organic Matter Quantity on Soil Types and Pedogenetic Horizons Depending on Slope Aspect

In the case of dystric cambisol, the median values for the soil organic matter quantity from the Ao horizon (Figure 2) did not significantly differ among the eight slope aspect categories; the values ranged from 7% to 8%. The lowest values were recorded for SW (sunny) and N (shadowed), namely for the two opposed slope aspects (sunny vs. shaded). The highest median value was found on the NE slope aspect, which also belongs to the shaded category. The variation amplitude was high, with minimum values between 0.5% and 1% for all eight slope aspect categories, whereas the maximum values gravitated around 18% (Figure 2). As seen in Figure 2, the soil organic matter content from the Ao horizon of the dystric cambisol did not show significant differences neither at the level of the median value, nor of the amplitude of variation.
Regarding the median values for the Bv horizon of the same soil, they were almost constant for all slope aspect types, varying between 1.5% and 1.7% (Figure 3). The variation amplitude was lower in the Bv horizon when compared to the Ao horizon, with a maximum value of approximately 11%. If variations between slope aspect categories are extremely low for minimum values, the situation reverses for maximum values. The maximum soil organic matter content regarding the slope aspect categories differed for the Bv horizon. The lowest value was recorded for SE (partially sunny), whereas the highest values were observed for E and NE, partially shaded and shaded, respectively (Figure 3).
Regarding the second soil type, eutric cambisol, the median values from the Ao horizon ranged between 5% and 6% (Figure 4). The lowest value (under 5%) was recorded for the NE slope aspect (shaded). As in the case of dystric cambisol, the soil organic matter content median values were constant for all eight slope aspect types. The variation amplitude of soil organic matter content from the Ao horizon ranged between 0.2% and 15%, being lower than those for the dystric cambisol. As seen in Figure 4, the maximum value of the soil organic matter content for all slope aspect types was lower than the median, namely around 15%. The minimum soil organic matter content was below 1% for all slope aspect categories.
The Bv horizon from eutric cambisol (Figure 5) showed the same tendency for the median value, which varied only slightly (1.2% and 1.5%) among the eight slope aspect types. The minimum and maximum soil organic matter content values are more different, especially in the case of maximum values. The highest values were found in N and S slope aspects, namely for extreme cases of shade and sunny slope aspects.
Dystric cambisol and eutric cambisol were similar regarding the median value of soil organic matter content in the Bv horizon. This is almost constant with close values for both soil types from all slope aspects. The lowest soil organic matter values for the Ao horizon were found on the shaded slope aspects (N, NE) and on sunny slope aspects, meaning on the two extreme situations. The highest values in the Ao horizon for both soils were found on the shaded and partially shaded slope aspects [59,60]. Soil organic matter and soil properties can be influenced to a certain degree by the main elements of topography, respectively, elevation and slope aspect [61,62].

4.2. Testing the Significance among Soil Organic Matter Contents of Different Slope Aspect Categories

After testing the differences between the soil organic matter contents of the four slope aspect categories (sunny, partially sunny, shaded, partially shaded), we found no significant differences among those categories for both soils and for both the Ao and Bv horizons (Table 1). Furthermore, the result was the same after we had applied this test for the soil organic matter content grouped on the eight slope aspect categories (N, E, W, S, NE, NW, SE, SW) (Table 2). However, in a study in the Bale Mountains, the SOC varied with respect to slope aspects; the mean SOC stocks were higher for forests in the southern and the eastern aspects than in the western and northern aspects, both in the upper soil layer and down to 1.0 m [51].

4.3. Correlations between Soil Organic Matter Content and Elevation, Stand Age, Production Class

As seen in Table 3, the soil organic matter content from the SW slope aspect (sunny) was the only one that was correlated positively with elevation and production class. This was the case for dystric cambisol, in the Ao horizon, for the first time interval (1982–1989), which included 104 samples.
By adding samples from the following time interval (1990–1999), two significant correlations were found between elevation and soil organic matter content on the NE and S slope aspects. The number of samples was higher, as we used 152 samples for the NE slope aspect and 95 for the S slope aspect.
When we increased the number of samples by adding another 10-year interval (2000–2009), we obtained significant correlations between elevation and soil organic matter content on all slope aspects. Practically, from two correlations recorded for the two previous time intervals (18 years), we obtained eight correlations for a time interval of 28 years. The 18-year interval included 974 samples, whereas the 25-year interval had an increase to 2265 samples. The 25-year time interval also showed a significant correlation between the stand production class and the soil organic matter content on the S slope aspect.
The last category of correlations included all samples from all time intervals, namely 33 years (1982–2014), with the largest number of samples. The results were similar to those for the previous interval, with elevation showing significant correlations with soil organic matter on all slope aspect types. There also was a correlation between production class and soil organic matter on the S slope aspect. This interval also records the only significant correlation between stand age and soil organic matter content on the E slope aspect. This last correlation involved a number of 275 samples. In total, this 33-year interval included 2478 samples.
Table 3 shows the overall correlation between the three variables (elevation, stand production class and stand age) and soil organic matter content (it was considered whole, not grouped in slope aspect categories). Soil organic matter content correlated significantly with elevation for all time intervals, whereas the correlation with stand production class was found for the 28-year and 33-year time intervals.
Regarding the eutric cambisol (Table 4), a large number of significant correlations was found for the first time interval (1982–2989), which used the lowest number of samples. These correlations were recorded only between elevation and soil organic matter content on the shaded slope aspects (E, NE and NW), with only one correlation on the sunny slope aspect (SE).
When adding a new 10-year interval, with an increase in samples, for all slope aspect categories, soil organic matter content was significantly correlated with elevation, except for the S slope aspect. Significant correlations were also obtained between stand age and soil organic matter content on the E, NW and SE slope aspects, as well as between production class and soil organic matter content on the NW slope aspect. The soil organic matter content from the NW slope aspect showed significant correlations with all three variables. When comparing the two soil types, the number of significant correlations was much higher for eutric cambisol (dystric cambisol showed only two correlations for the 18-year interval, whereas eutric cambisol showed eleven correlations). The sample number was 1301 for eutric cambisol and 974 for dystric cambisol.
When adding another 10-year interval (amounting to 28 years), we obtained significant correlations between soil organic matter content on all slope aspects and for all elevations. Compared with dystric cambisol, this result was obtained for the largest time interval, the 33-year period. The same tendency was found in this interval, namely the significant correlation between soil organic matter and all three variables on the NW slope aspect. In addition, three new correlations were obtained for stand age.
In the case of the largest time interval (33 years), the significant correlation between elevation and soil organic matter content was maintained on all slope aspects as well as on the NW slope aspect with all three variables. The same correlation was maintained between soil organic matter and stand age on the E and NW slope aspects.
Regarding the overall correlation between soil organic matter content and elevation, significant correlations were obtained for all time intervals, as in the case of dystric cambisol. However, unlike dystric cambisol, eutric cambisol showed significant correlations with all three factors, even from the 28-year interval.
All significant correlations between soil organic matter content and elevations were positive correlations, regardless of the soil type or slope aspect category, indicating that these two variables have the same tendency. When analysing the data sequences, the soil organic matter content increases with increasing elevation. To exemplify, we selected the correlation coefficient with the highest value for dystric cambisol (correlation from the SW slope aspect between 1982 and 1989) as well as for eutric cambisol (soil organic matter content from the NE slope aspect from the same time interval) (Figure 6). A similar tendency has been observed in other investigations. For example, for the Golija Mountain (Dinaric Mountain system) in Serbia [63] and for Montana soils [64], the SOC stock increased with elevation (from 500 to 1450 m). For reference [43], in studies conducted in the Changbai Mountains, north-eastern China, it was also observed that SOC density showed an increasing trend with increasing elevation (decreasing temperature and increasing precipitation). In the Qilian Mountains, near Zhangye City, Gansu Province, north-western China [65], SOC stocks increased with elevation; at 3200 m, they were significantly greater than at lower elevations. In a study in the mountainous French region (Franche-Comte), with an elevation ranging from 300 to 1450 m, the same results were obtained: the soil organic carbon content strongly correlated with elevation (SOC increased with elevation) [66]. However, in the Bale Mountains, south-eastern Ethiopia, at higher elevation, the carbon stock was greater than at lower elevations [51]; in the Austrian Limestone Alps, the SOC to bedrock increased with an increasing elevation from 900 m to 1500 m [67]. Some researchers [68] found that the soil C concentrations are positively correlated with elevation only for certain areas (bamboo forests), but for other areas such as pasture systems in Ecuador, they are not positively correlated. Some studies indicated that SOC stock increased with increasing elevation [36] while other studies [69] suggested that the variation of SOC is attributed to soil-forming factors other than elevation.

4.4. Influences of Different Stand and Relief Parameters on the Soil Organic Matter Content Grouped on Slope Aspect Types

The values of the regression coefficient (R2) for the dystric cambisol ranged between 2% and 7%. The highest value was observed for the soil organic matter content from the NW slope aspect (partially shaded), indicating that the independent values (stand age and elevation) influence the soil organic matter content from the Ao horizon by 7%. The remaining percentage was influenced by other factors that were not taken into account in the present study. The soil organic matter from the E, S and SE slope aspects was influenced by 5% by the independent variable mentioned before. On the other side, the lowest influence (of only 2%) was found in soil organic matter content from the W slope aspect (partially sunny).
Regarding the eutric cambisol, the regression coefficient had higher values than that of the dystric cambisol, ranging between 7% and 12%. This is the highest value for dystric cambisol and the lowest value for eutric cambisol. The highest value was also found for the soil organic matter located on the NW slope aspect, similar to dystric cambisol. The independent variables influenced this content by 12%. Stand age and elevation influenced the soil organic matter content from E and S slope aspects by 10%. The two independent variables influenced the least (4%) of the soil organic matter content from the SW slope aspect (partially sunny), as observed for dystric cambisol.
For future research, it is necessary to take into account a bigger number of factors. This will also help in having a better overview of the relation between soil organic matter and forest site, as well as stand characteristics.

5. Conclusions

Regarding the median value of the soil organic matter content from the Ao horizon, the lowest values for both soil types were recorded in the shaded slope aspects (N, NE), and the sunny slope aspects had the two extreme situations. The highest values in the Ao horizon for both soils were observed on the shaded and partially shaded slope aspects.
When testing the differences among the soil organic matter contents grouped on the four slope aspect categories (sunny, partially sunny, shaded, partially shaded), we found no significant differences among these categories, regardless of the soil type or of the horizon.
Correlations between soil organic matter content and elevation, stand age and production class were observed for both soils when we used samples from the 33-year period (1982–2014), namely 12,742 samples. Elevation was significantly correlated with soil organic matter content on all slope aspect types. All significant correlations between soil organic matter content (regardless of the soil type or slope aspect type) and elevation were positive. This means that if elevation increases, the soil organic matter content also increases.
In the case of the multiple linear regression with soil organic matter as a dependent variable and elevation and stand age as independent variables, both soil types showed the highest value of the regression coefficient is observed for soil organic matter content on the NW slope aspect (partially shaded). The studied independent variables (stand age and elevation) influenced the soil organic matter content from the Ao horizon by 7% for dystric cambisol and 12% for eutric cambisol.
Overall, taking all 12,742 soil samples from a period of 33 years into account, the soil organic matter content was influenced by elevation and stand age, especially on shaded and partially shaded slope aspects.

Author Contributions

Conceptualization, L.D. and R.E.; methodology, R.E.; software, R.E.; validation, D.V., L.D. and R.V.; formal analysis, R.E.; investigation, D.V.; resources, L.D.; data curation, D.V.; writing—original draft preparation, R.E.; writing—review and editing, D.V.; visualization, D.V. and R.V.; supervision, L.D. and R.V.; project administration, L.D.; funding acquisition, L.D. All authors have read and agreed to the published version of the manuscript.

Funding

This research received no external funding.

Institutional Review Board Statement

Not applicable.

Data Availability Statement

Not applicable.

Acknowledgments

We thank the anonymous reviewers and to the editors for their work in analyzing our study.

Conflicts of Interest

The authors declare no conflict of interest.

References

  1. Eswaran, H.; Berg, E.; van den Reich, P. Organic carbon in soils of the world. Soil Sci. Soc. Am. J. 1993, 57, 192–194. [Google Scholar] [CrossRef]
  2. Amundson, R. The carbon budget in soils. Annu. Rev. Earth Planet. Sci. 2001, 29, 535–562. [Google Scholar] [CrossRef]
  3. Piao, S.L.; Fang, J.Y.; Ciais, P.; Peylin, P.; Huang, Y.; Sitch, S.; Wang, T. The carbon balance of terrestrial ecosystems in China. Nature 2009, 458, 1009–1013. [Google Scholar] [CrossRef] [PubMed]
  4. Dinca, L.; Spârchez, G.; Dinca, M.; Blujdea, V. Organic Carbon Concentrations and Stocks in Romanian Mineral Forest Soils. Ann. For. Res. 2012, 55, 229–241. [Google Scholar]
  5. Dey, S.K. A preliminary estimation of carbon stock sequestrated through rubber (Hevea brasiliensis) plantation in North Eastern regional of India. Indian For. 2005, 131, 1429–1435. [Google Scholar]
  6. Dincă, L.; Dincă, M.; Vasile, D.; Spârchez, G.; Holonec, L. Calculating organic carbon stock from forest soils. Not. Bot. Horti Agrobot. Cluj-Napoca 2015, 43, 568–575. [Google Scholar] [CrossRef]
  7. Buringh, P. Organic Carbon in Soils of the World. In The Role of Terrestrial Vegetation in the Global Carbon Cycle: Measurement by Remote Sensing; Woodwell, G.M., Ed.; John Wiley & Sons Ltd.: Hoboken, NJ, USA, 1984. [Google Scholar]
  8. Lal, R. Soil carbon sequestration to mitigate climate change. Geoderma 2004, 123, 1–22. [Google Scholar] [CrossRef]
  9. EC/UN-ECE; de Vries, W.; Reinds, G.J. Intensive Monitoring of Forest Ecosystems in Europe; Posch, M., Sanz, M.J., Krause, G.H.M., Calatayud, V., Renaud, J.P., Dupouey, J.L., Sterba, H., Vel, E.M., Eds.; Technical Report; EC/UN-ECE: Brussels, Geneva, 2003; p. 163. [Google Scholar]
  10. Liski, J.; Perruchoud, D.; Karjalainen, T. Increasing carbon stocks in the forest soils of western Europe. For. Ecol. Manag. 2002, 169, 159–175. [Google Scholar] [CrossRef]
  11. Smith, P.; Smith, J.; Wattenbach, M.; Meyer, J.; Lindner, M.; Zaehle, S.; Hiederer, R.; Jones, R.J.A.; Montanarella, L.; Rounsevell, M.; et al. Projected changes in mineral soil carbon of European forests, 1990–2100. Can. J. Soil Sci. 2006, 86, 159–169. [Google Scholar] [CrossRef]
  12. Bruce, P.J.; Frome, M.; Haites, E.; Janzen, H.; Lal, R.; Pawtian, K. Carbon sequestration in soils. J. Soil Water Conserv. 1999, 54, 382–389. [Google Scholar]
  13. Jha, M.N.; Gupta, M.K.; Saxena, A.; Kumar, R. Soil Organic Carbon Store in Different Forests in India. Indian For. 2003, 129, 714–724. [Google Scholar]
  14. Eswaran, H.; Reich, P.F.; Kimble, J.M.; Beinroth, F.H.; Padmanabhan, E.; Moncharoen, P. Global Climate Change and Pedogenic Carbonates; Lal, R., Kimble, J.M., Eswaran, H., Stewart, B.A., Eds.; Lewis Publishers: Boca Raton, FL, USA, 1999; pp. 15–25. [Google Scholar]
  15. Gower, S.T.; Vogel, J.G.; Norman, J.M.; Kucharik, C.J.; Steele, S.J.; Stow, T.K. C distribution and aboveground net primary production inaspen, jack pine, and black spruce stands in Saskatchewan and Manitoba, Canada. J. Geoph. Res. 1997, 102, 29029–29041. [Google Scholar] [CrossRef]
  16. Wang, C.K.; Gower, S.T.; Wang, Y.H.; Zhao, H.X.; Yan, P.; Bond-Lamberty, B.P. The influence of fire on C and net primary productionof boreal Larix gmelinii forests in north-eastern China. Glob. Chang. Biol. 2001, 7, 719–730. [Google Scholar] [CrossRef]
  17. Wang, C.K.; Bond-Lamberty, B.; Gower, S.T. Carbon distribution of a well- and poorly-drained black spruce fire chronosequence. Glob. Chang. Biol. 2003, 9, 1066–1079. [Google Scholar] [CrossRef]
  18. Smithwick, E.A.H.; Harmon, M.E.; Remillard, S.M.; Acker, S.A.; Franklin, J.F. Potential upper bounds of carbon stores in forests of the Pacific Northwest. Ecol. Appl. 2002, 12, 1303–1317. [Google Scholar] [CrossRef]
  19. Law, B.E.; Sun, O.J.; Campbell, J.; Van Tuyl, S.; Thornton, P.E. Changes in carbon storage and fluxes in a chronosequence of Ponderosa pine. Glob. Chang. Biol. 2003, 9, 510–524. [Google Scholar] [CrossRef]
  20. Pregitzer, K.S.; Euskirchen, E.S. Carbon cycling and storage in world forests, biome patterns related to forest age. Glob. Chang. Biol. 2004, 10, 2052–2077. [Google Scholar] [CrossRef]
  21. Martin, J.L.; Gower, S.T.; Plaut, J.; Holmes, B. Carbon pools in a boreal mixed wood logging chronosequence. Glob. Chang. Biol. 2005, 11, 1883–1894. [Google Scholar]
  22. Vanguelova, E.I.; Bonifacio, E.; De Vos, B.; Hoosbeek, M.R.; Berger, T.W.; Armolaitis, K.; Celi, L.; Dincă, L.; Kjønaas, O.J.; Pavlenda, P.; et al. Sources of errors and uncertainties in the assessment of forest soil carbon stocks at different scales—Review and recommendations. Environ. Monit. Assess. 2016, 188, 630. [Google Scholar] [CrossRef]
  23. Crișan, V.; Dincă, L.; Oneț, A.; Bragă, C.I.; Enescu, E.; Teușdea, A.C.; Oneț, C. Impact of windthrows disturbance on chemical and biological properties of the forest soils from Romania. Environ. Eng. Manag. J. 2021, 20, 1163–1172. [Google Scholar]
  24. Schaefer, D.A.; Feng, W.T.; Zou, X.M. Plant carbon inputs and environmental factors strongly affect soil respiration in a subtropical forest of southwestern China. Soil Biol. Biochem. 2009, 44, 1000–1007. [Google Scholar] [CrossRef]
  25. Enescu, C.M.; Dincă, L.; Bratu, I.A. Chemical characteristics of the forest soils from Prahova County. Sci. Pap. Ser. Manag. Econ. Eng. Agric. Rural. Dev. 2018, 18, 109–112. [Google Scholar]
  26. Oneț, A.; Dincă, L.; Teușdea, A.; Crișan, V.; Bragă, C.; Enescu, R.; Oneț, C. The influence of fires on the biological activity of forest soils in Vrancea, Romania. Environ. Eng. Manag. J. 2019, 18, 2643–2654. [Google Scholar]
  27. Enescu, R.E.; Dinca, L.; Zup, M.; Davidescu, S.; Vasile, D. Assessment of Soil Physical and Chemical Properties among Urban and Peri-Urban Forests: A Case Study from Metropolitan Area of Brasov. Forests 2022, 13, 1070. [Google Scholar] [CrossRef]
  28. Albaladejo, J.; Ortiz, R.; Garcia-Franco, N.; Ruiz Navarro, A.; Almagro, M.; Garcia Pintado, J.; Martínez-Mena, M. Land use and climatechange impacts on soil organic carbon stocks in semi-arid Spain. J. Soils Sediments 2013, 13, 265–277. [Google Scholar] [CrossRef]
  29. Shary, P.A.; Sharaya, L.S.; Mitusov, A.V. Fundamental quantitative methods of land surface analysis. Geoderma 2002, 107, 1–32. [Google Scholar] [CrossRef]
  30. Murariu, G.; Dinca, L.; Tudose, N.; Crisan, V.; Georgescu, L.; Munteanu, D.; Dragu, M.D.; Rosu, B.; Mocanu, G.D. Structural Characteristics of the Main Resinous Stands from Southern Carpathians, Romania. Forests 2021, 12, 1029. [Google Scholar] [CrossRef]
  31. Michopoulos, P.; Kostakis, M.; Bourletsikas, A.; Kaoukis, K.; Pasias, I.; Grigoratos, T.; Thomaidis, N.; Samara, C. Concentrations of three rare elements in the hydrological cycle and soil of a mountainous fir forest. Ann. For. Res. 2022, 65, 155–164. [Google Scholar]
  32. Post, W.M.; Emanuel, W.R.; Zinke, P.J.; Stangenberger, A.G. Soil carbon pools and world life zones. Nature 1982, 298, 156–159. [Google Scholar] [CrossRef]
  33. Grigal, D.G.; Ohmann, L.F. Carbon storage in upland forestland of the Lake States. Soil Sci. Soc. Am. J. 1992, 56, 935–943. [Google Scholar] [CrossRef]
  34. Mueller, T.G.; Pierce, F.J. Soil carbon maps: Enhancing spatial estimates with simple terrain attributes at multiple scales. Soil Sci. Soc. Am. J. 2003, 67, 258–267. [Google Scholar] [CrossRef]
  35. Nakashizuka, T.; Yusop, Z.; Nik, A.R. Altitudinal zonation of forest communities in Selangor, Peninsular Malaysia. J. Trop. For. Sci. 1992, 4, 233–244. [Google Scholar]
  36. Garten, C.T.; Hanson, P.J. Measured forest soil C stocks and estimated turnover times along an elevation gradient. Geoderma 2006, 136, 342–352. [Google Scholar] [CrossRef]
  37. Spârchez, G.; Dincă, L.; Marin, G.; Dincă, M.; Enescu, R.E. Variation of eutric cambisols’ chemical properties based on altitudinal and geomorphological zoning. Environ. Eng. Manag. J. 2017, 16, 2911–2918. [Google Scholar]
  38. Sheikh, M.A.; Kumar, M.; Bussmann, R.W. Altitudinal variation in soil organic carbon stock in coniferous subtropical and broadleaf temperate forests in Garhwal Himalaya. Carbon Balance Manag. 2009, 4, 6. [Google Scholar] [CrossRef]
  39. Enescu, R.; Vasile, D.; Dincă, L.; Davidescu, S.; Breabăn, I.G. The favorability of orographic and edaphic factors for the main species that comprise urban forests from Brasov city. Present Environ. Sustain. Dev. 2022, 16, 139–153. [Google Scholar] [CrossRef]
  40. Siebyła, M.; Hilszczanska, D. Next Generation Sequencing genomic analysis of bacteria from soils of the sites with naturally-occurring summer truffle (Tuber aestivum Vittad.). Ann. For. Res. 2022, 65, 97–110. [Google Scholar]
  41. Kumar, S.; Kumar, M.; Sheikh, A.M. Carbon Stock Variation of Pinus roxburghii Sarg. Forest Along Altitudes of Garhwal Himalaya, India. Russ. J. Ecol. 2012, 44, 131–136. [Google Scholar] [CrossRef]
  42. Baritz, R.; Seufert, G.; Montanarella, L.; Van Ranst, E. Carbon concentrations and stocks in forest soils of Europe. For. Ecol. Manag. 2010, 260, 262–277. [Google Scholar] [CrossRef]
  43. Zhu, B.; Wang, X.; Fang, J.; Piao, S.; Shen, H.; Zhao, S.; Peng, C. Altitudinal changes in carbon storage of temperate forests on Mt Changbai, Northeast China. J. Plant. Res. 2010, 123, 439–452. [Google Scholar] [CrossRef]
  44. Sharma, C.M.; Baduni, N.P.; Gairola, S.; Ghildiyal, S.K.; Suyal, S. Effects of slope aspects on forest compositions, community structures and soil properties in natural temperate forests of Garhwal Himalaya. J. For. Res. 2010, 21, 331–337. [Google Scholar] [CrossRef]
  45. Bayat, A.T. Carbon Stock in an Apennine Beach Forest. Master’s Thesis, Geo-Information Science and Earth Observation, University of Twente, Enschede, The Netherlands, 2011; p. 54. [Google Scholar]
  46. De Deyn, G.B.; Cornelissen, J.H.C.; Bardgett, R.D. Plant functional traits and soil carbon sequestration in contrasting biomes. Ecol. 2008, 11, 516–531. [Google Scholar] [CrossRef] [PubMed]
  47. Sigua, G.C.; Coleman, S.W. Spatial distribution of soil carbon in pastures with cow calf operation: Effects of slope aspect and slope position. J. Soils Sediments 2010, 10, 240–247. [Google Scholar] [CrossRef]
  48. Sharma, C.M.; Gairola, S.; Baduni, N.P.; Ghildiyal, S.K.; Suyal, S. Variation in carbon stocks on different slope aspects in seven major forest types of temperate region of Garhwal Himalaya. India J. Biosci. 2011, 36, 701–708. [Google Scholar] [CrossRef] [PubMed]
  49. Wagner, B.; Liang, E.; Li, X.; Dulamsuren, C.; Leuschner, C.; Hauck, M. Carbon pools of semi-arid Picea crassifolia forests in the Qilian Mountains (north-eastern Tibetan Plateau). For. Ecol. Manag. 2015, 343, 136–143. [Google Scholar] [CrossRef]
  50. Dincă, L.C.; Grenni, P.; Onet, C.; Onet, A. Fertilization and Soil Microbial Community: A Review. Appl. Sci. 2022, 12, 1198. [Google Scholar] [CrossRef]
  51. Yimer, F.; Ledin, S.; Abdelkadir, A. Soil organic carbon and total nitrogen stocks as affected by topographic aspect and vegetation in the Bale Mountains, Ethiopia. Geoderma 2006, 135, 335–344. [Google Scholar] [CrossRef]
  52. Dinca, L.; Marin, M.; Vlad, R.; Murariu, G.; Drasovean, R.; Cretu, R.; Georgescu, L.; Timiș-Gânsac, V. Which are the Best Site and Stand Conditions for Silver Fir (Abies alba Mill.) Located in the Carpathian Mountains? Diversity 2022, 14, 547. [Google Scholar] [CrossRef]
  53. Baduni, N.P.; Sharma, C.M. Community structure and growing stock variation in Quercus floribunda forest on different aspects of Garhwal Himalaya. Bangladesh JFS 1999, 28, 82–93. [Google Scholar]
  54. Sharma, C.M.; Baduni, N.P. Effect of aspects on the structure of some natural stands of Abies pindrow in Himalayan moist temperate forest. Environmentalist 2000, 20, 309–317. [Google Scholar] [CrossRef]
  55. Mishra, A.; Sharma, C.M.; Sharma, S.D.; Baduni, N.P. Effect of aspect on the structure of vegetation community of moist Bhavar and Tarai Shorea robusta forest in Central Himalaya. Indian For. 2000, 126, 634–642. [Google Scholar]
  56. Dincă, L.; Spârchez, G.; Dincă, M. Romanian’s forest soil GIS map and database and their ecological implications. Carpathian J. Earth Environ. Sci. 2014, 9, 133–142. [Google Scholar]
  57. Stoica, E.; Răuță, C.; Florea, N. Methods of Chemical Analysis of the Soil; Ministerul Agriculturii: București, Romania, 1986. [Google Scholar]
  58. Sheskin, D.J. Handbook of Parametric and Nonparametric Statistical Procedures, 3rd ed.; CRC Press: Boca Raton, FL, USA, 2003; p. 1184. [Google Scholar]
  59. Rezaei, H.; Alijanpour, A.; Jafarzadeh, A.A.; Shahbazi, F. Effect of Slope Position on Soil Properties and Types Along an Elevation Gradient of Arasbaran Forest, Iran. Int. J. Adv. Sci. Eng. Inf. Technol. 2015, 5, 449–456. [Google Scholar] [CrossRef]
  60. Tsui, C.C.; Chen, Z.S.; Hsieh, C.F. Relationships between soil properties and slope position in a lowland rain forest of southern Taiwan. Geoderma 2004, 123, 131–142. [Google Scholar] [CrossRef]
  61. Pierson, F.B.; Mulla, D.J. Aggregate stability in the Palouse region of Washington: Effect of landscape position. Soil Sci. Soc. Am. J. 1990, 54, 1407–1412. [Google Scholar] [CrossRef]
  62. Plaster, E.J. Soil Science and Management, 6th ed.; Delmar Cengage Learning: Clifton Park, NY, USA, 2013. [Google Scholar]
  63. Manojlović, M.; Čabilovski, R.; Sitaula, B. Soil Organic Carbon in Serbian Mountain Soils: Effects of Land Use and Altitude. Pol. J. Environ. Stud. 2011, 20, 977–986. [Google Scholar]
  64. Sims, Z.R.; Nielsen, G.A. Organic carbon in Montana soils as related to clay content and climate. Soil Sci. Soc. Am. J. 1986, 50, 1269. [Google Scholar] [CrossRef]
  65. Chen, L.; He, Z.; Du, J.; Yang, J.; Zhu, X. Patterns and Controls of Soil Organic Carbon and Nitrogen in Alpine Forests of Northwestern China. Forest Sci. 2015, 61, 1033–1040. [Google Scholar] [CrossRef]
  66. Saby, N.P.A.; Arrouays, D.; Antoni, V.; Lemercier, B.; Follain, S.; Walter, C.; Schvartz, C. Changes in soil organic carbon in a mountainous French region, 1990–2004. Soil Use Manag. 2008, 24, 254–262. [Google Scholar] [CrossRef]
  67. Djukic, I.; Zehetne, F.; Tatzber, M.; Gerzabek, M.H. Soil organic-matter stocks and characteristics along an Alpine elevation gradient. J. Plant. Nutr. Soil Sci. 2010, 173, 30–38. [Google Scholar] [CrossRef]
  68. Tian, G.; Justicia, R.; Coleman, D.C.; Carroll, C.R. Assessment of soil and plant carbon levels in two ecosystems (woody bamboo and pasture) in Montane Ecuador. Soil Sci. 1986, 172, 459–468. [Google Scholar] [CrossRef]
  69. Podwojewski, P.; Poulenard, J.; Nguyet, M.L.; de Rouw, A.; Nguyen, V.T.; Pham, Q.H.; Tran, D.T. Climate and vegetation determine soil organic matter status in an alpine inner-tropical soil catena in the Fan Si Pan Mountain, Vietnam. Catena 2011, 87, 226–239. [Google Scholar] [CrossRef]
Figure 1. Spread of eutric cambisol and dystric cambisol in forest area of Romania.
Forests 13 01472 g001
Figure 2. The variation of soil organic matter content in Ao horizon of dystric cambisol.
Forests 13 01472 g002
Figure 3. The variation of soil organic matter content in Bv horizon of dystric cambisol.
Forests 13 01472 g003
Figure 4. The variation of soil organic matter content in Ao horizon of eutric cambisol.
Forests 13 01472 g004
Figure 5. The variation of soil organic matter content in Bv horizon of eutric cambisol.
Forests 13 01472 g005
Figure 6. Correlation between soil organic matter content and altitude ((a)—dystric cambisol; (b)—eutric cambisol).
Forests 13 01472 g006
Table 1. Testing the significance among soil organic matter content of 4 different slope aspect categories for soil types as well as for the genetic horizon types.
Soil TypeHorizon AoHorizon Bv
No. of Samplesp ValueSignificance Level (α)No. of Samplesp ValueSignificance Level (α)
Dystric cambisol24680.4195-32720.9598-
Eutric cambisol27650.8665-36750.6897-
*-α < 5%; **-α < 1%; ***-α < 0.1%
Table 2. Testing the significance among soil organic matter content of 8 different slope aspect categories for soil types as well as for the genetic horizon types.
Soil TypeHorizon AoHorizon Bv
No. of Samplesp ValueSignificance Level (α)No. of Samplesp ValueSignificance Level (α)
Dystric cambisol24680.32101-32720.9533-
Eutric cambisol27650.2612-36750.5732-
*-α < 5%; **-α < 1%; ***-α < 0.1%
Table 3. Spearman correlation coefficient values for dystric cambisol in the Ao horizon.
Soil Organic Matter Content
ENNENWSSESWWAll Slope Aspect
1982–1989
Altitude−0.0060.0280.242−0.1630.7710.2840.590−0.1330.23
Productivity class−0.0760.401−0.166−0.5860.401−0.1060.673−0.4560.05
Stand age0.1880.424−0.342−0.4880.5420.2080.094−0.523−0.05
1982–1989 + 1990–1999
Altitude0.0760.1050.2770.1120.3090.1510.0290.0790.14
Productivity class0.0800.057−0.055−0.033−0.1630.0790.044−0.1280.06
Stand age−0.0890.0010.0170.058−0.0020.015−0.016−0.049−0.06
1982–1989 + 1990–1999 + 2000–2009
Altitude0.1460.1770.2090.2140.2350.2270.1890.1480.19
Productivity class0.103−0.044−0.069−0.023−0.182−0.040−0.032−0.085−0.04
Stand age−0.1050.0410.0360.0510.062−0.002−0.034−0.0680.002
1982–1989 + 1990–1999 + 2000–2009 + 2010–2014
Altitude0.1700.2160.1770.2340.2340.2050.2090.1430.197
Productivity class0.065−0.029−0.086−0.015−0.185−0.064−0.020−0.084−0.05
Stand age−0.1220.0400.0470.0500.0810.002−0.024−0.0520.007
Values marked with bold and red color are significant.
Table 4. Spearman correlation coefficient values for eutric cambisol in the Ao horizon.
Soil Organic Matter Content
ENNENWSSESWVAll Slope Aspect
1982–1989
Altitude0.707−0.5490.8050.540−0.0590.686−0.150.340.433
Productivity class0.161−0.043−0.200−0.189−0.3430.1500.105−0.10−0.027
Stand age0.278−0.0050.2830.349−0.0020.2270.1750.190.159
1982–1989 + 1990–1999
Altitude0.3430.2380.2250.3280.1770.2990.1690.220.251
Productivity class0.043−0.019−0.110−0.1830.0550.032−0.04−0.00−0.037
Stand age0.2270.0490.0560.184−0.0940.1720.0990.120.106
1982–1989 + 1990–1999 + 2000–2009
Altitude0.3230.2470.2710.3370.2870.2650.2080.280.275
Productivity class−0.056−0.030−0.097−0.1180.020−0.01−0.01−0.02−0.043
Stand age0.1420.0670.0610.172−0.0030.0940.0640.1330.090
1982–1989 + 1990–1999 + 2000–2009 + 2010–2014
Altitude0.3190.2500.2770.3290.3020.2670.2030.2820.277
Productivity class−0.058−0.049−0.090−0.1090.0270.002−0.00−0.01−0.037
Stand age0.1440.0650.0770.159−0.0020.0920.0490.1110.086
Values marked with bold and red color are significant.
Table 5. Multiple linear regression between altitude, tree age and soil organic matter content for Ao horizon for dystric cambisol.
Independent VariablesMultiple Correlation Coefficient RCoefficient of Determination R2p ValueFexpDegrees of Freedom
East
Altitude, stand age0.2248020.0505360.0008657.238728F (2.272)
North
Altitude, stand age0.2148890.0461770.0008727.213528F (2.298)
North-east
Altitude, stand age0.1945250.0378400.0012406.823431F (2.347)
North-west
Altitude, stand age0.267800.071720.0000013.48162F (2.349)
South
Altitude, stand age0.2294250.0526360.0012256.889506F (2.248)
South-east
Altitude, stand age0.230120.052950.0000510.17667F (2.364)
South-west
Altitude, stand age0.2135460.0456020.0007387.382113F (2.309)
West
Altitude, stand age0.1574610.0247940.0428143.190775F (2.251)
All slope aspects types
Altitude, stand age0.209710.043980.0000056.55746F(2.246)
Table 6. Multiple linear regression between altitude, tree age and soil organic matter content for Ao horizon for eutric cambisol.
Independent VariablesMultiple Correlation Coefficient RCoefficient of Determination R2p ValueFexpDegrees of Freedom
East
Altitude, stand age0.322990.104320.0000016.53927F (2.284)
North
Altitude, stand age0.267720.071680.0000013.12571F (2.340)
North-east
Altitude, stand age0.276250.076310.0000016.89535F (2.409)
North-west
Altitude, stand age0.350990.123190.0000026.90560F (2.383)
South
Altitude, stand age0.316730.100320.0000014.77447F (2.265)
South-east
Altitude, stand age0.273190.074630.0000015.20309F (2.377)
South-west
Altitude, stand age0.2051960.0421050.0002768.373648F (2.381)
West
Altitude, stand age0.270160.072990.0000111.73147F (2.298)
All slope aspects types
Altitude, stand age0.27920.07800.0000116.5990F(2.276)
Publisher’s Note: MDPI stays neutral with regard to jurisdictional claims in published maps and institutional affiliations.

