Abstract
Eucommia ulmoides Oliv. (2n = 34), native to China and of a monotypic family and genus, is a multipurpose tree species with high economic, ecological, and social benefits. In this study, an F1 population of 109 progenies and tow parents were used to construct the first high-density genetic map of E. ulmoides via genotyping-by-sequencing (GBS) with single-nucleotide polymorphism (SNP) markers. A total of 191,095 SNPs were obtained, among which the available markers in F1 population were types “hkxhk,” “nnxnp,” and “lmxll” and the three polymorphic markers 35,699, 65,800, and 68,022, respectively. Finally, the map comprised 10,103 SNP markers distributed on 17 linkage groups (LGs) that were consisted with the chromosome haploid number in E. ulmoides (n = 17). The interval genetic map covered 90% of the E. ulmoides genomes, with total genetic distance of 4051.11 cM and average distance between markers of 0.45 cM. The length of LGs varied from 70.42 to 495.49 cM, with the mean size of 238.3 cM. On the other hand, 44 QTLs associated with growth traits were detected on LG02, LG06, LG07, LG08, and LG10, with phenotypical variance ranging from 10.0% to 14.2%. A total of 33 candidate genes were identified, and most of them were related to energy storage, signal transmission, hormones, and metabolic pathways. This study could provide a solid foundation for chromosome assembly and refinement, and the localization of growth-trait QTLs will advance the investigation of forestry breeding efforts in E. ulmoides.
1. Introduction
Eucommia ulmoides Oliv. (2n = 34) (E. ulmoides) is a tree native to China and of a single family (Eucommiaceae) and genus. It is a dioecious and deciduous perennial tree that can reach a height of more than 25 m [1,2]. It is widely used in landscaping and forestry greening due to its flourishing leaves, straight trunk, wind-sheltering and sand-fixation qualities, and positive impacts on water and soil conservation [3]. Because E. ulmoides is resistant to cold and draught, tolerance to barren that can be widely distributed in not only 27 provinces of China also distributed in Japan, Korea, UK and American [4,5,6]. E. ulmoides is an economically important tree that not only contains rubber but also various kinds of pharmacological ingredients, such as flavonoids, lignans, iridoids, phenolics, steroids, and other compounds [7]. Eucommia bark has been used as medicine for thousands of years, which is recorded in Shennong’s Herbal Classics and Herbal Compendium. Eucommia bark is still used for medicinal purposes. Many studies showed that E. ulmoides leaves and bark were a major medical source since they have similar chemical constituents and pharmacological effects [5,8], which was also mentioned in the Chinese Pharmacopoeia (2015).
Conventional breeding has mainly concentrated on selecting excellent individuals from the natural population of E. ulmoides, which often takes decades to evaluate and screen new cultivars [9]. Breeding excellent varieties with high yield, high quality and multiresistance is the goal of long-term breeding of E. ulmoides. The application of molecular marker-assisted selection (MAS) breeding technology can improve breeding efficiency and accelerate the breeding process, while efficient MAS technology depends on a saturated genetic map and accurate location of agronomic traits. Therefore, attention has been paid to the construction of a saturation genetic map and the development of accurate genetic markers of E. ulmoides. With the development of next-generation sequencing (NGS) technologies, a majority of plants have completed genome sequencing and assembly, which also has laid a research foundation for MAS breeding studies. High-density genetic maps have become an indispensable part of molecular breeding research for E. ulmoides, such as mapping accurate quantitative markers and MAS breeding.
Genetic linkage mapping is also the basis for obtaining accurate quantitative trait locus (QTL) and QTL analysis, which is the most effective way to excavate QTL markers and locate complex multieffect genes [10,11]. The growth traits are influenced by multiple genes, which also results in multiple single genes showing significant impact on a trait [12]. The first draft genetic map was constructed by an F1 population of 122 plants using amplified fragment length polymorphism (AFLP) markers, of which 127 markers were mapped on 14 linkage groups (LGs) with a total length of 1116.1 CM in the maternal map and 108 markers being mapped on 12 linkage groups with a total field of 929.6 cM in the paternal map. The average distances between maternal and paternal markers were 8.61 and 8.78 cM, respectively [13]. Subsequently, Li et al. [9] and Jin et al. [3] reconstructed the genetic distance of 2133 cM and 1913.29 cM based on the full-sib family using sequence-related amplification polymorphism (SRAP), amplified fragment length polymorphism (AFLP), inter-simple sequence repeat (ISSR) and simple sequence repeat (SSR) markers, and the average genetic distance between markers was 3.1 cM and 2.2 cM, respectively. The density of the E. ulmoides genetic map was increased, but the number of markers was still lower than other plants and further research is needed in E. ulmoides. Before high-throughput sequencing technologies were widely used, AFLP, SRAP, ISSR, and SSR markers were used as dominant molecular markers in plants. However, they were not enough to develop a E. ulmoides high-density linkage map. Compared with the microsatellite sequence marker, the single-nucleotide polymorphism (SNP) marker has shown rapid progress and is widely available from advanced technology and lower-cost services [14]. Thousands of SNP markers can be identified at the same time and used to analyze plenty of accessions by NGS technology in recent revolutionary genetic diversity assessment [15]. The development of SNP can easily be combined with the construction of a reduced representation library (RRL) using several methods [16]. Genotyping by sequencing (GBS) can obtain a large number of SNP markers and has become one of the most widely used sequencing methods, due to such advantages as relatively simple operation, low cost, and high-throughput SNP [17].
In this study, we used the genotyping-by-sequencing (GBS) approach, sequencing 109 F1 progenies and two parents for construction of the high-density genetic map of E. ulmoides. The SNP markers were used for the first time to construct high-density genetic maps, and the genetic map with 17 linkage groups was consistent with chromosome numbers. At the same time, combined with three growth traits, QTL mapping was performed for three important growth traits, identifying the key QTLs controlling growth traits of E. ulmoides. Preliminary screening of growth trait-related candidate genes laid the foundation for later molecular-assisted breeding and map cloning of E. ulmoides.
2. Materials and Methods
2.1. Plant Materials and DNA Extraction
The two cultivated varieties ‘Huazhong 8’ and ‘Huazhong 12’ were chosen as female and male parents independently. Cross-breeding was completed in March to April 2015 and planting seeds in February 2016 in Yuanyang county Henan province (34°55′–35°11′ N, 113°36′–114°15′ E) under the same nutrition, field soil, and irrigation conditions for preparing to build an F1 population. The tender leaves of parents and F1 progenies of saplings growing at least as high as 35 cm were collected and all samples frozen in liquid nitrogen immediately and stored at −80 °C. Whole genomic DNA was extracted by a DNeasy Plant minikit (Qiagen, Hilden, Germany) [1]. DNA purity and concentration were determined by the NanoPhot ometer® spectrophotometer (Thermo Fisher Scientific, Waltham, MA, USA).
2.2. DNA Library Preparation and High-Throughput Sequencing
Genotyping-by-sequencing (GBS) is an efficient method of large-scale genotyping, which is based on reduced-representation libraries and high-throughput sequencing [17]. Firstly, we performed a GBS predesign experiment for selecting enzymes and evaluating sizes of restriction fragments according to the reference genome of E. ulmoides (accession: PRJNA357336) [18,19]. Here, two restriction enzymes were selected for DNA digestion and 0.1–1 µg of genomic DNA was incubated at 37 °C with MseI (New England Biolabs; NEB) and then heat-inactivated at 65 °C. To further decrease the complexity and increase the sequencing depth and genome coverage, the additional restriction enzyme NlaIII was added to the MseI digestions to further digest the fragments at 37 °C. Then, the restriction ligation samples were purified with Agencourt AMPure XP (Beckman), PCR performed using purified samples, with Phusion Master Mix (NEB) universal primer and index primer to add index and complete i5 and i7 sequence. The PCR productions were purified using Agencourt AMPure XP (Beckman) and pooled, then run on 2% agarose gel. Fragments of 350–400 bp (with indices and adaptors) in size were isolated using a gel extraction kit (Qiagen). Then, pair-end sequencing was performed upon the selected tags using an Illumina HiSeq PE150 sequencing platform.
2.3. SNP Calling and Genotyping
The sequence data from each sample were sorted according to the barcodes in the raw reads. To make sure the raw reads were reliable and without artificial bias in following analyses, raw reads were in fastq format and processed through a series of quality control (QC) tests with Perl scripts as per Zhang et al. [18]. Then, a BWA (Burrows–Wheeler Aligner) [20] was used to align the clean reads of each sample against the reference genome (settings: mem d -t 4 -k 32–M -R). Alignment files were converted to BAM files using SAMtools software [21] (–bS–t). If multiple read pairs had identical external coordinates, only the pair with the highest mapping quality was retained. Variant calling was performed for both parents and progenies using GATK (Genome Analysis Toolkit) software. ANNOVAR was used to annotate SNP based on the GFF3 files for the reference genome [22]. In order to reduce the detection error rate of SNPs, the SNP filtering conditions in this study were as follows: support number of reads not less than 4; sites with MAF (minor allele frequency cutoff) less than 0.01 excluded; sites with SNP typing higher than 20% excluded.
The SNP markers between two parents were classified into eight segregation patterns (aa × bb, ab × cc, ab × cd, cc × ab, ef × eg, hk × hk, lm × ll, and nn × np). Then, unqualified SNP markers were further removed based on abnormal base detection, integrity filtration (marker genotype covering at least 90% of all progenies), and significant segregation distortion (chi-square test, p value < 0.01). Considering the results of several parameter combinations, the call parameters of SNP were determined and a reliable mark provided for the following experiments.
2.4. Growth Traits and Statistical Analysis
Growth traits included tree height (TH), basal diameter (BD) and node spacing (NS). The TH was measured from the ground to the top of a single plant with a tape measure. NS value was obtained by measuring the average distance of 15–25 buds. The diameter of each tree at three centimeters height above the ground was measured with a Vernier caliper, and the average value was taken as BD after repeating the measurement three times. In order to reduce the error, all growth traits were measured at least three times per sample on 30 August 2016. Statistical analysis was performed with SPSS 22.0 SPSS20.0 for Windows SPSS, Chicago, IL, USA for generating descriptive statistics, and Pearson correlations between three traits and frequency distribution of the F1 progenies were calculated by R (X64 4.0.3) software.
2.5. High-Density Genetic Map Construction and QTL Analysis
Linkage analysis and map construction were carried out using JoinMap 4.1 with the cross-pollinator population type [23]. JoinMap 4.1 was used to filter significantly distorted segregation (p < 0.001), integrity (>90%) and abnormal bases. Based on the results of filtering markers with missing parental information and screening the genotypes with polymorphic loci between parents, the types of markers that could be used for F1 population mapping were “hk × hk”, “nn × np”, and “lm × ll”. The regression mapping algorithm was selected for map construction and the Kosambi function used to process ordering markers. The logarithm of odds (LOD) value was set to 2–20 for the integrated map of two parents, computed by Mergemap software [24]. Perl script was used to visualize exported maps, and heat maps were constructed to evaluate the maps.
QTL analysis of the three growth traits for E. ulmoides was performed by MapQTL 6.0 with composition interval mapping (CIM) model [25]. To identify significant QTLs at the 95% confidence level, the significant LOD threshold was set at 2.5. Markers located at the peak LOD value of a QTL were identified as QTL-associated markers [26].
2.6. Prediction of Candidate Genes and Functional Annotation
In order to further determine the accuracy of QTL, we performed functional annotation and screening of genes in the 3 kb interval of trait-related QTLs. The putative function of the candidate genes was annotated by Gene Ontology (GO: http://geneontology.org/, accessed on 3 December 2021), Kyoto Encyclopedia of Genes and Genomes (KEGG: https://www.kegg.jp/, accessed on 3 December 2021), SwissProt, and NCBI Nr (https://www.ncbi.nlm.nih.gov/, accessed on 3 December 2021) databases [27]. The RNA-seq data of development stages of fruit, leaves, and bark from April to September were downloaded from NCBI under accession number PRJNA357336 [1].
3. Results
3.1. Analysis of Growth Traits
All data recorded were used for analyses, as no outlier data were detected (Table S1). Three traits were in concordance with the normal distribution (Kolmogorov–Smirnov test, asymptotic significance > 0.05; Figure 1). Variation analysis of the three traits is shown in Table S2 and Figure 1. The distribution range of tree height (TH) was 23.2–74.5 cm, base diameter (BD) 0.56–2.1 cm, and node spacing (NS) 2.0–6.2 cm. The average values of TH, BD, and NS were 49.50, 1.45, and 4.39 cm and the coefficients of variation 18.93%, 22.23%, and 22.34%, respectively. The results of correlation analysis showed that the correlation of the three traits was extremely significant: the significant coefficient was more than 0.7, and the significant coefficient of BD and NS reached 0.87, which also proved that there was a certain correlation among the three growth traits.
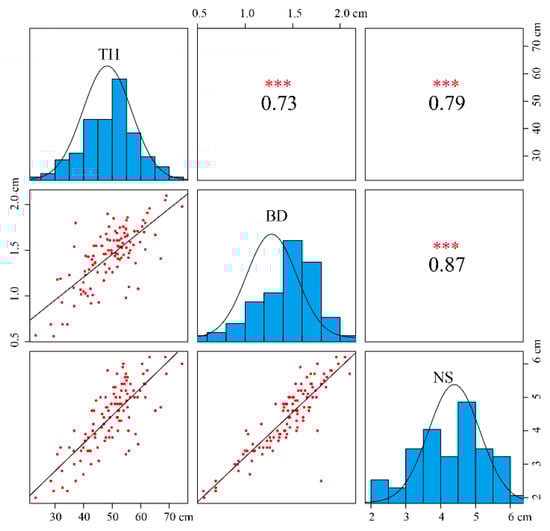
Figure 1.
Scatterplots (lower triangle) and correlations (upper triangles) among three growth traits in the F1 mapping population. Note: TH, BD, and NS represent tree height, basal diameter, and node spacing, respectively. *** indicates extreme significance.
3.2. GBS Sequencing Results and Analysis
In this study, GBS technology and Illumina HiseqPE150 were used to sequence the DNA library, in which the two parents were sequenced in 16-fold tags and 109 progenies sequenced in 8-fold tags. The library was constructed by the combination of MseI + NlaIII restriction endonuclease enzyme and the average enzyme capture rate was up to 98.5% (Table S3). The sequencing data of two parents and offspring samples were counted, including sequencing data yield, sequencing error rate, mapping data, Q20, Q30, and GC content (Table S3). The total sequencing amount was 41.8 G, in which output data of female and male parents were 2,738,575,008 bp and 276,254,409 bp, with Q20 (mass fraction above 20) and Q30 (mass fraction above 30) 95.96% and 90.06% and guanine–cytosine (GC) content 38.40% and 38.15%, respectively. The average output data of progenies were 383,576,806 bp with Q20 and Q30 were 96.42% and 90.86%, respectively, with GC content 38.73%. The mapping rates between two parents (male and female) with the E. ulmoides reference genome [1] were 98.32% and 99.64%, and the coverage rate of 4X (covering at least four bases) was greater than 1.56% (Table S3). After strict filtering of the sequencing data, high-density clean data were obtained. In addition, upon comparing clean data with the nucleotide database of NCBI, no DNA contamination from other sources was found.
3.3. SNP Marker Detection and Genotyping
SNP marker detection of two parents and F1 progenies was performed by GATK and other software [28]. In total, 456,630 and 373,429 SNPs were detected in male and female parents, respectively, and the average number of SNPs detected in F1 progenies was 147,077 (Table S4). The average heterozygosity of F1 progenies (59%) was higher than the average of two parents (41%) (Table S4). The average percentage of heterozygosity of two E. ulmoides parents was similar in other studies using GBS [29].
A total of 191,095 polymorphic SNP markers were obtained after filtering out the isolated and significantly distorted segregation SNP markers of two parents (Figure 2). The numbers of aa × bb, ab × cc, ab × cd, cc × ab, ef × eg, hk × hk, lm × ll, and nn × np segregation-pattern SNP markers between two parents were 21,132, 62, 0, 50, 330, 35,699, 68,022, and 65,800, respectively. Although the number of “aa × bb” segregation-pattern markers was 21,132 (11.06%), this was not suitable for construction of the genetic map of F1 population. Only three segregation-pattern markers—hk × hk, lm × ll, and nn × np—accounting for 88.71% of the total number of markers, could be used to construct the genetic map for the F1 population. After completing the development of parental markers, marker detection was performed in F1 population. By comparing the SNP loci of parents and offspring, 16,687 markers were obtained after abnormal detection and removing marker genotypes covering less than 90% of all progenies. Then, significant segregation distortion (chi-square test, p value < 0.01) was conducted on these 16,687 candidate markers, and 3040 segregation distortion markers were filtered out. Finally, a total of 13,675 effective markers were used to construct the linkage map.
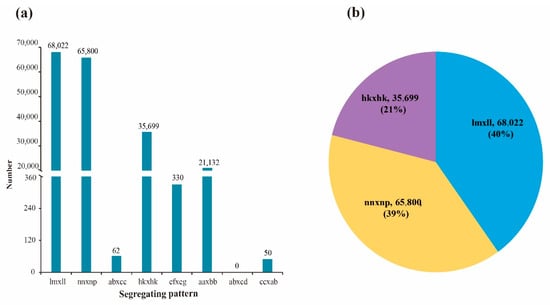
Figure 2.
Genotype distribution and number of SNP markers. Note: (a), distribution of eight types markers; (b), the proportion of three segregation patterns in linkage population.
3.4. High-Density Genetic Map Construction
The effective markers were used to construct the genetic map by using a regression mapping algorithm and Kosambi’s mapping function in JoinMap 4.1 software. On the female map, 5689 SNP markers were mapped on 17 linkage groups (LGs) and the total genetic length was 3880.84 cM with average marker interval of 0.68 cM and gap < 5 cM (percentage of gap with genetic distance less than 5 cM) among the markers was 87.5–99.3% (Table S5, Figure 3 and Figure S1). On the male map, 5816 SNP markers were mapped on 17 LGs spanning 3828 cM with average marker interval of 0.66 cM and <5 cM gap among the markers of 84.6–99.6% (Table S5, Figure 3 and Figure S2). On the final integrated map, 10,103 SNP markers were also mapped on 17 LGs, consistent with the chromosome number of E. ulmoides (Table 1, Figure 4). The interval map spanned 4051.11 cM with an average marker interval of 0.45 cM, and the map covered over 90% of the E. ulmoides genome, which also indicated that our sequencing quality was reliable. Between the detected markers in the integrated map, 10,087 gaps were detected. Among them, 9973 (98.87%) were less than 5 cM, 92 were 5 to 10 cM, and 22 were 10 to 20 cM. The distribution of markers and length of 17 LGs were not consistent. Among the 17 LGs, LG03 was the shortest group with a genetic distance 70.42 cM and 51 markers. LG08 was the longest group with 495.49 cM and 768 markers. However, LG17 had the largest number of markers with a genetic length of 310 cM.
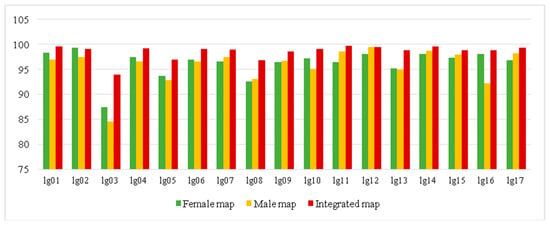
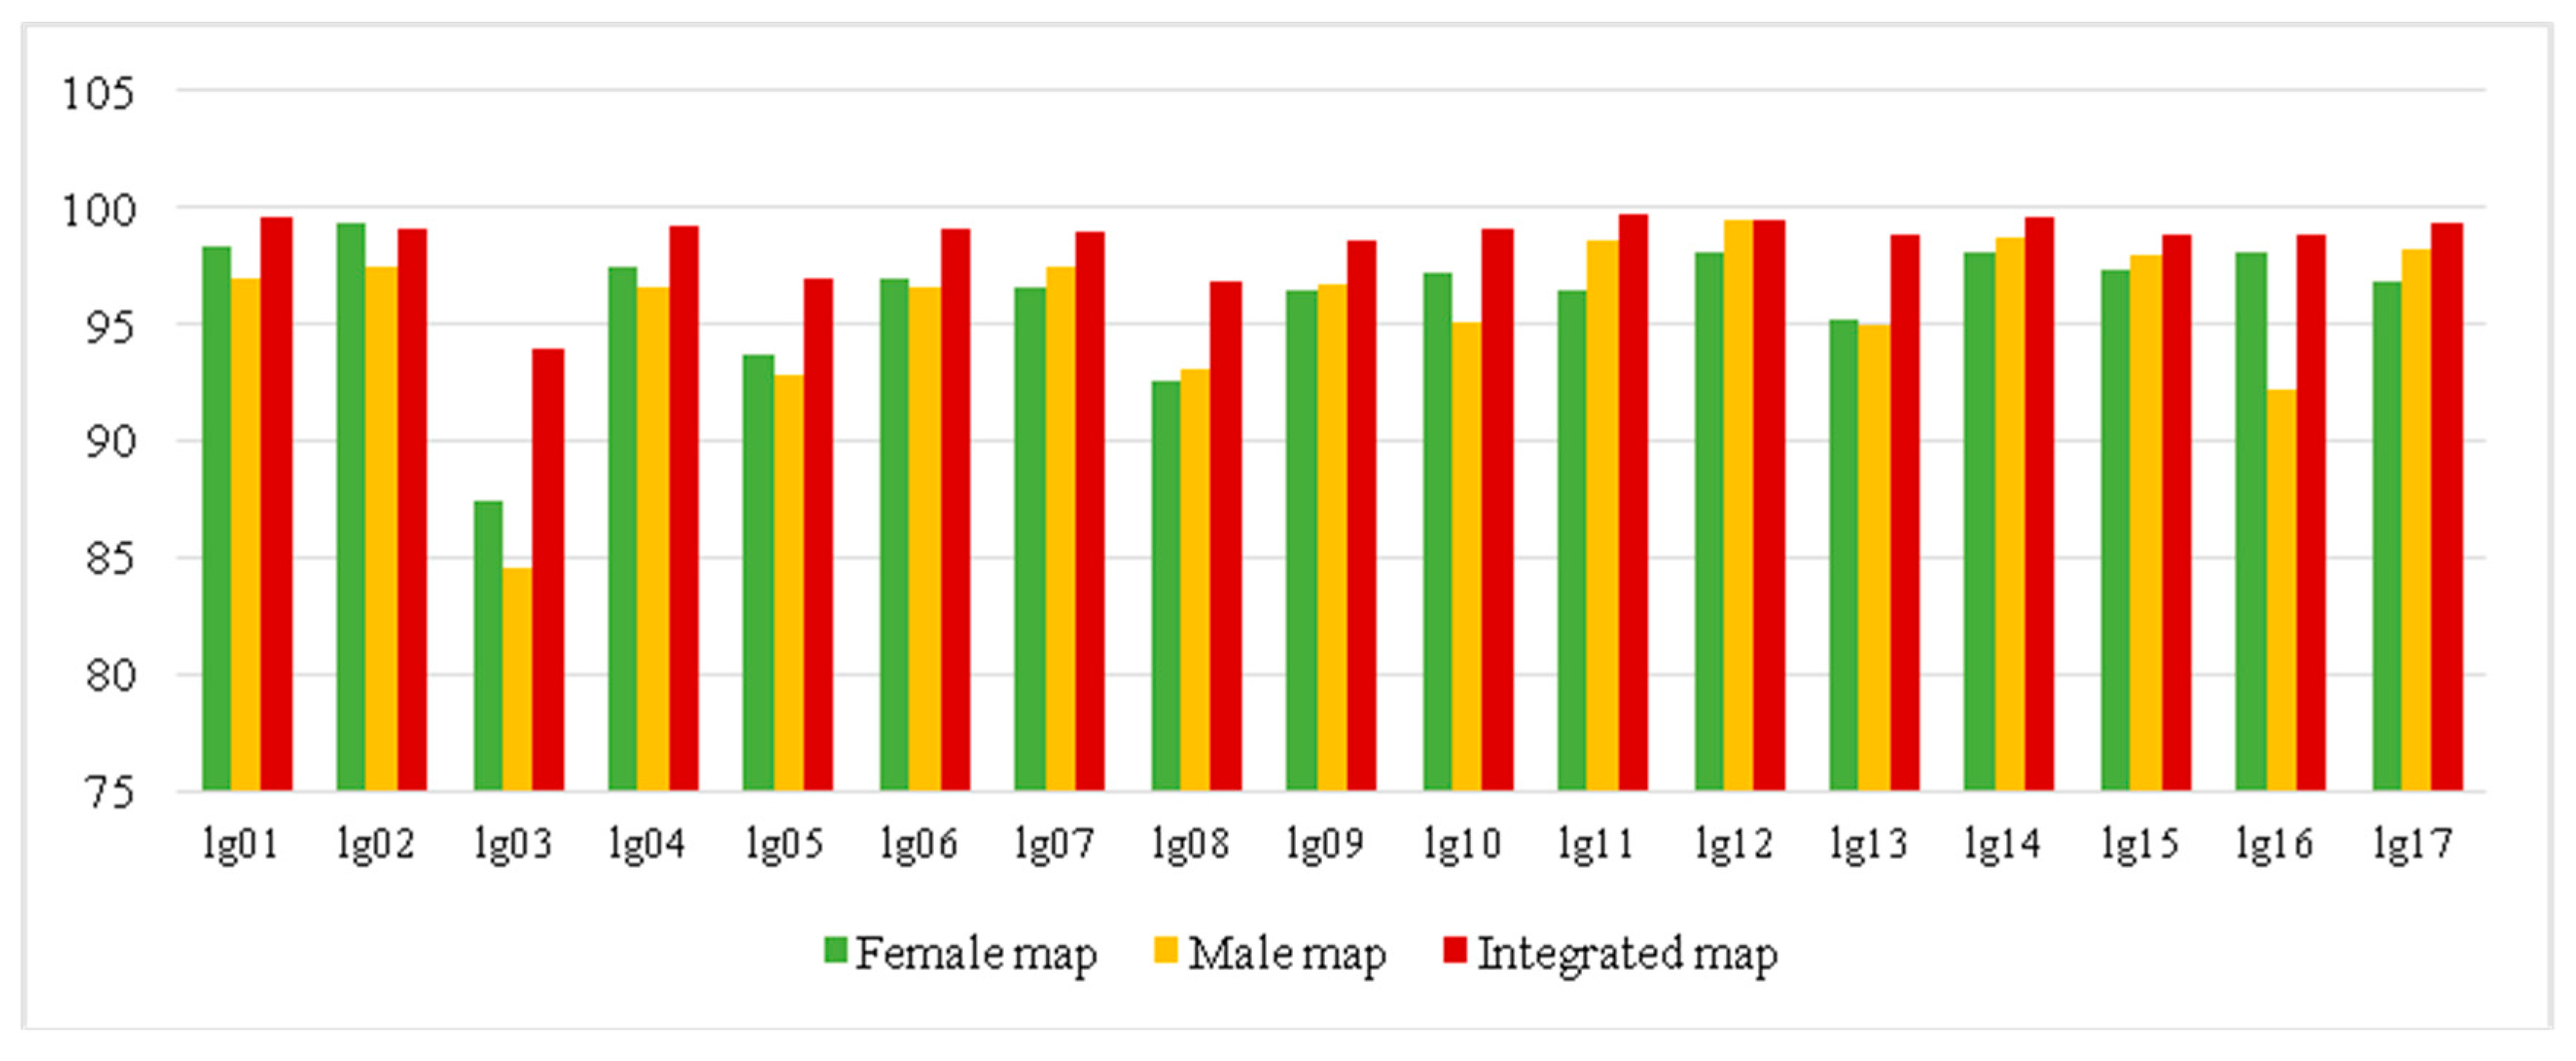
Figure 3.
The percentage of gap numbers with genetic distance less than 5 cM (gap < 5 cM) between markers in female, male, and integrated maps. The abscissa represents linkage group and the vertical axis represents gap < 5 cM number.

Table 1.
Characteristics of the integrated genetic map derived from the F1 population (‘Huazhong 8’ and ‘Huazhong 12’).
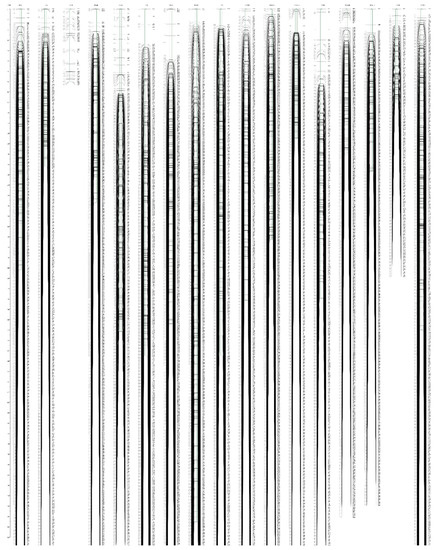
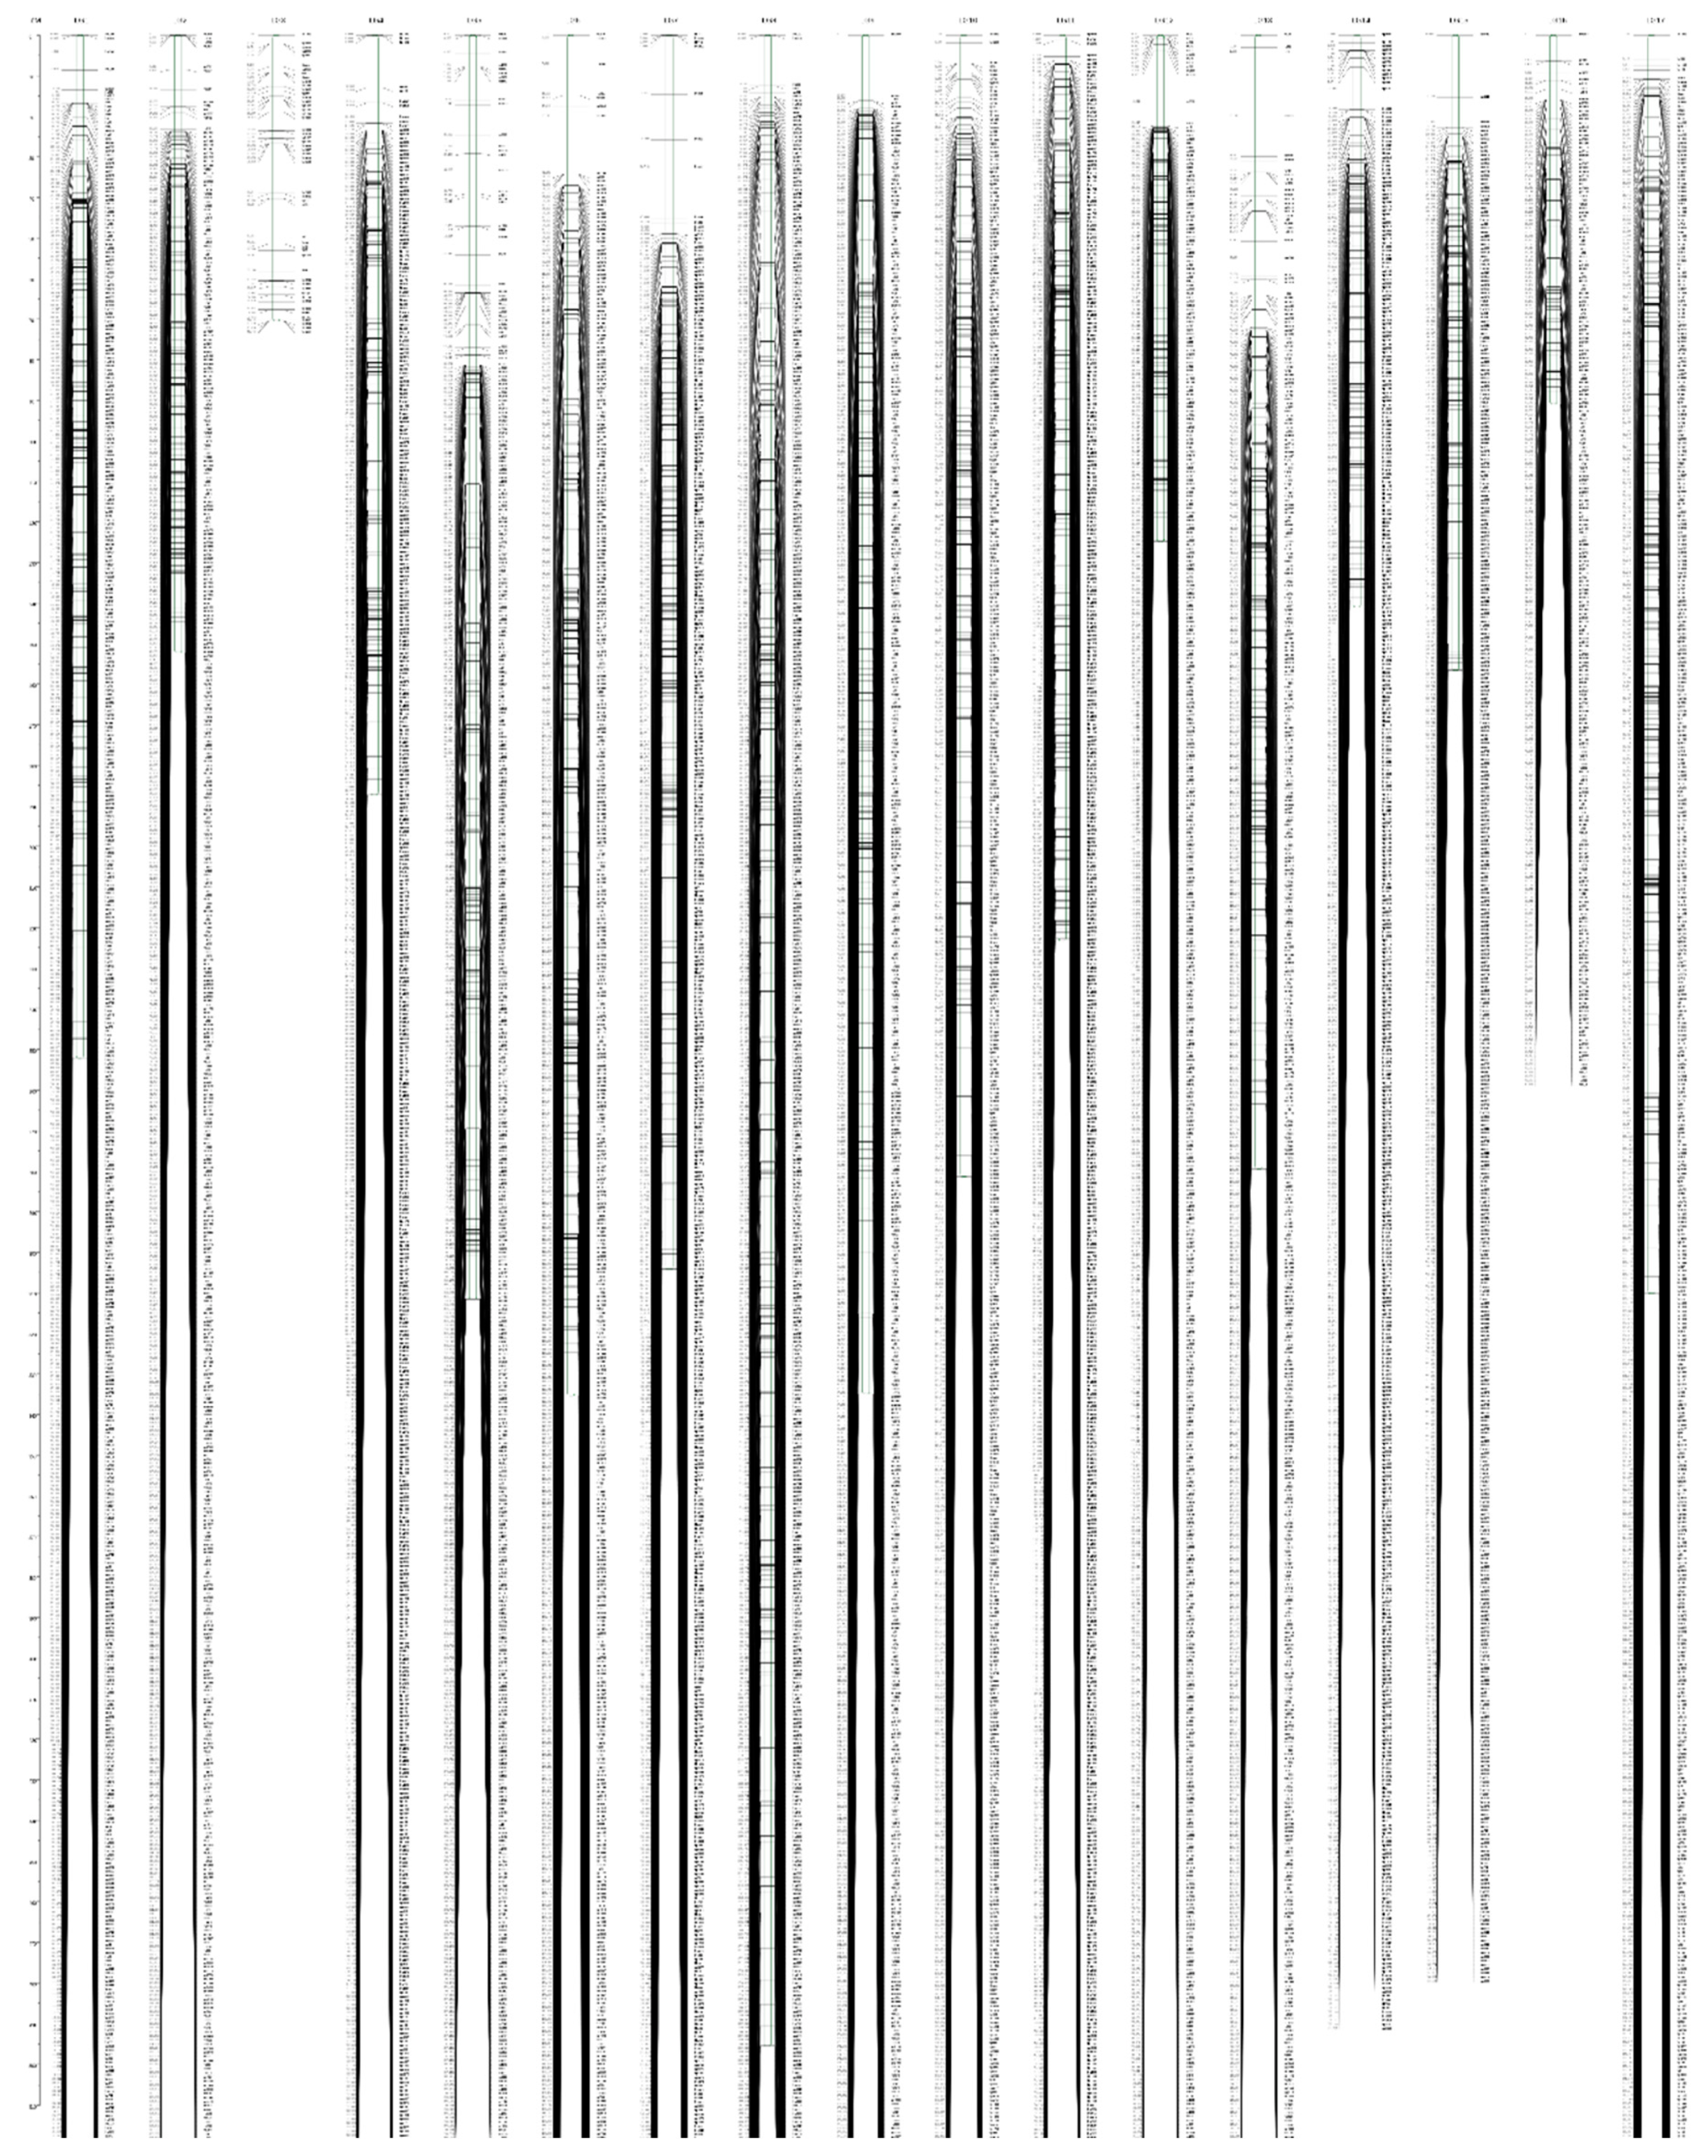
Figure 4.
High-density integrated genetic map of E. ulmoides. The SNP markers and their location are shown on the right and left side, respectively.
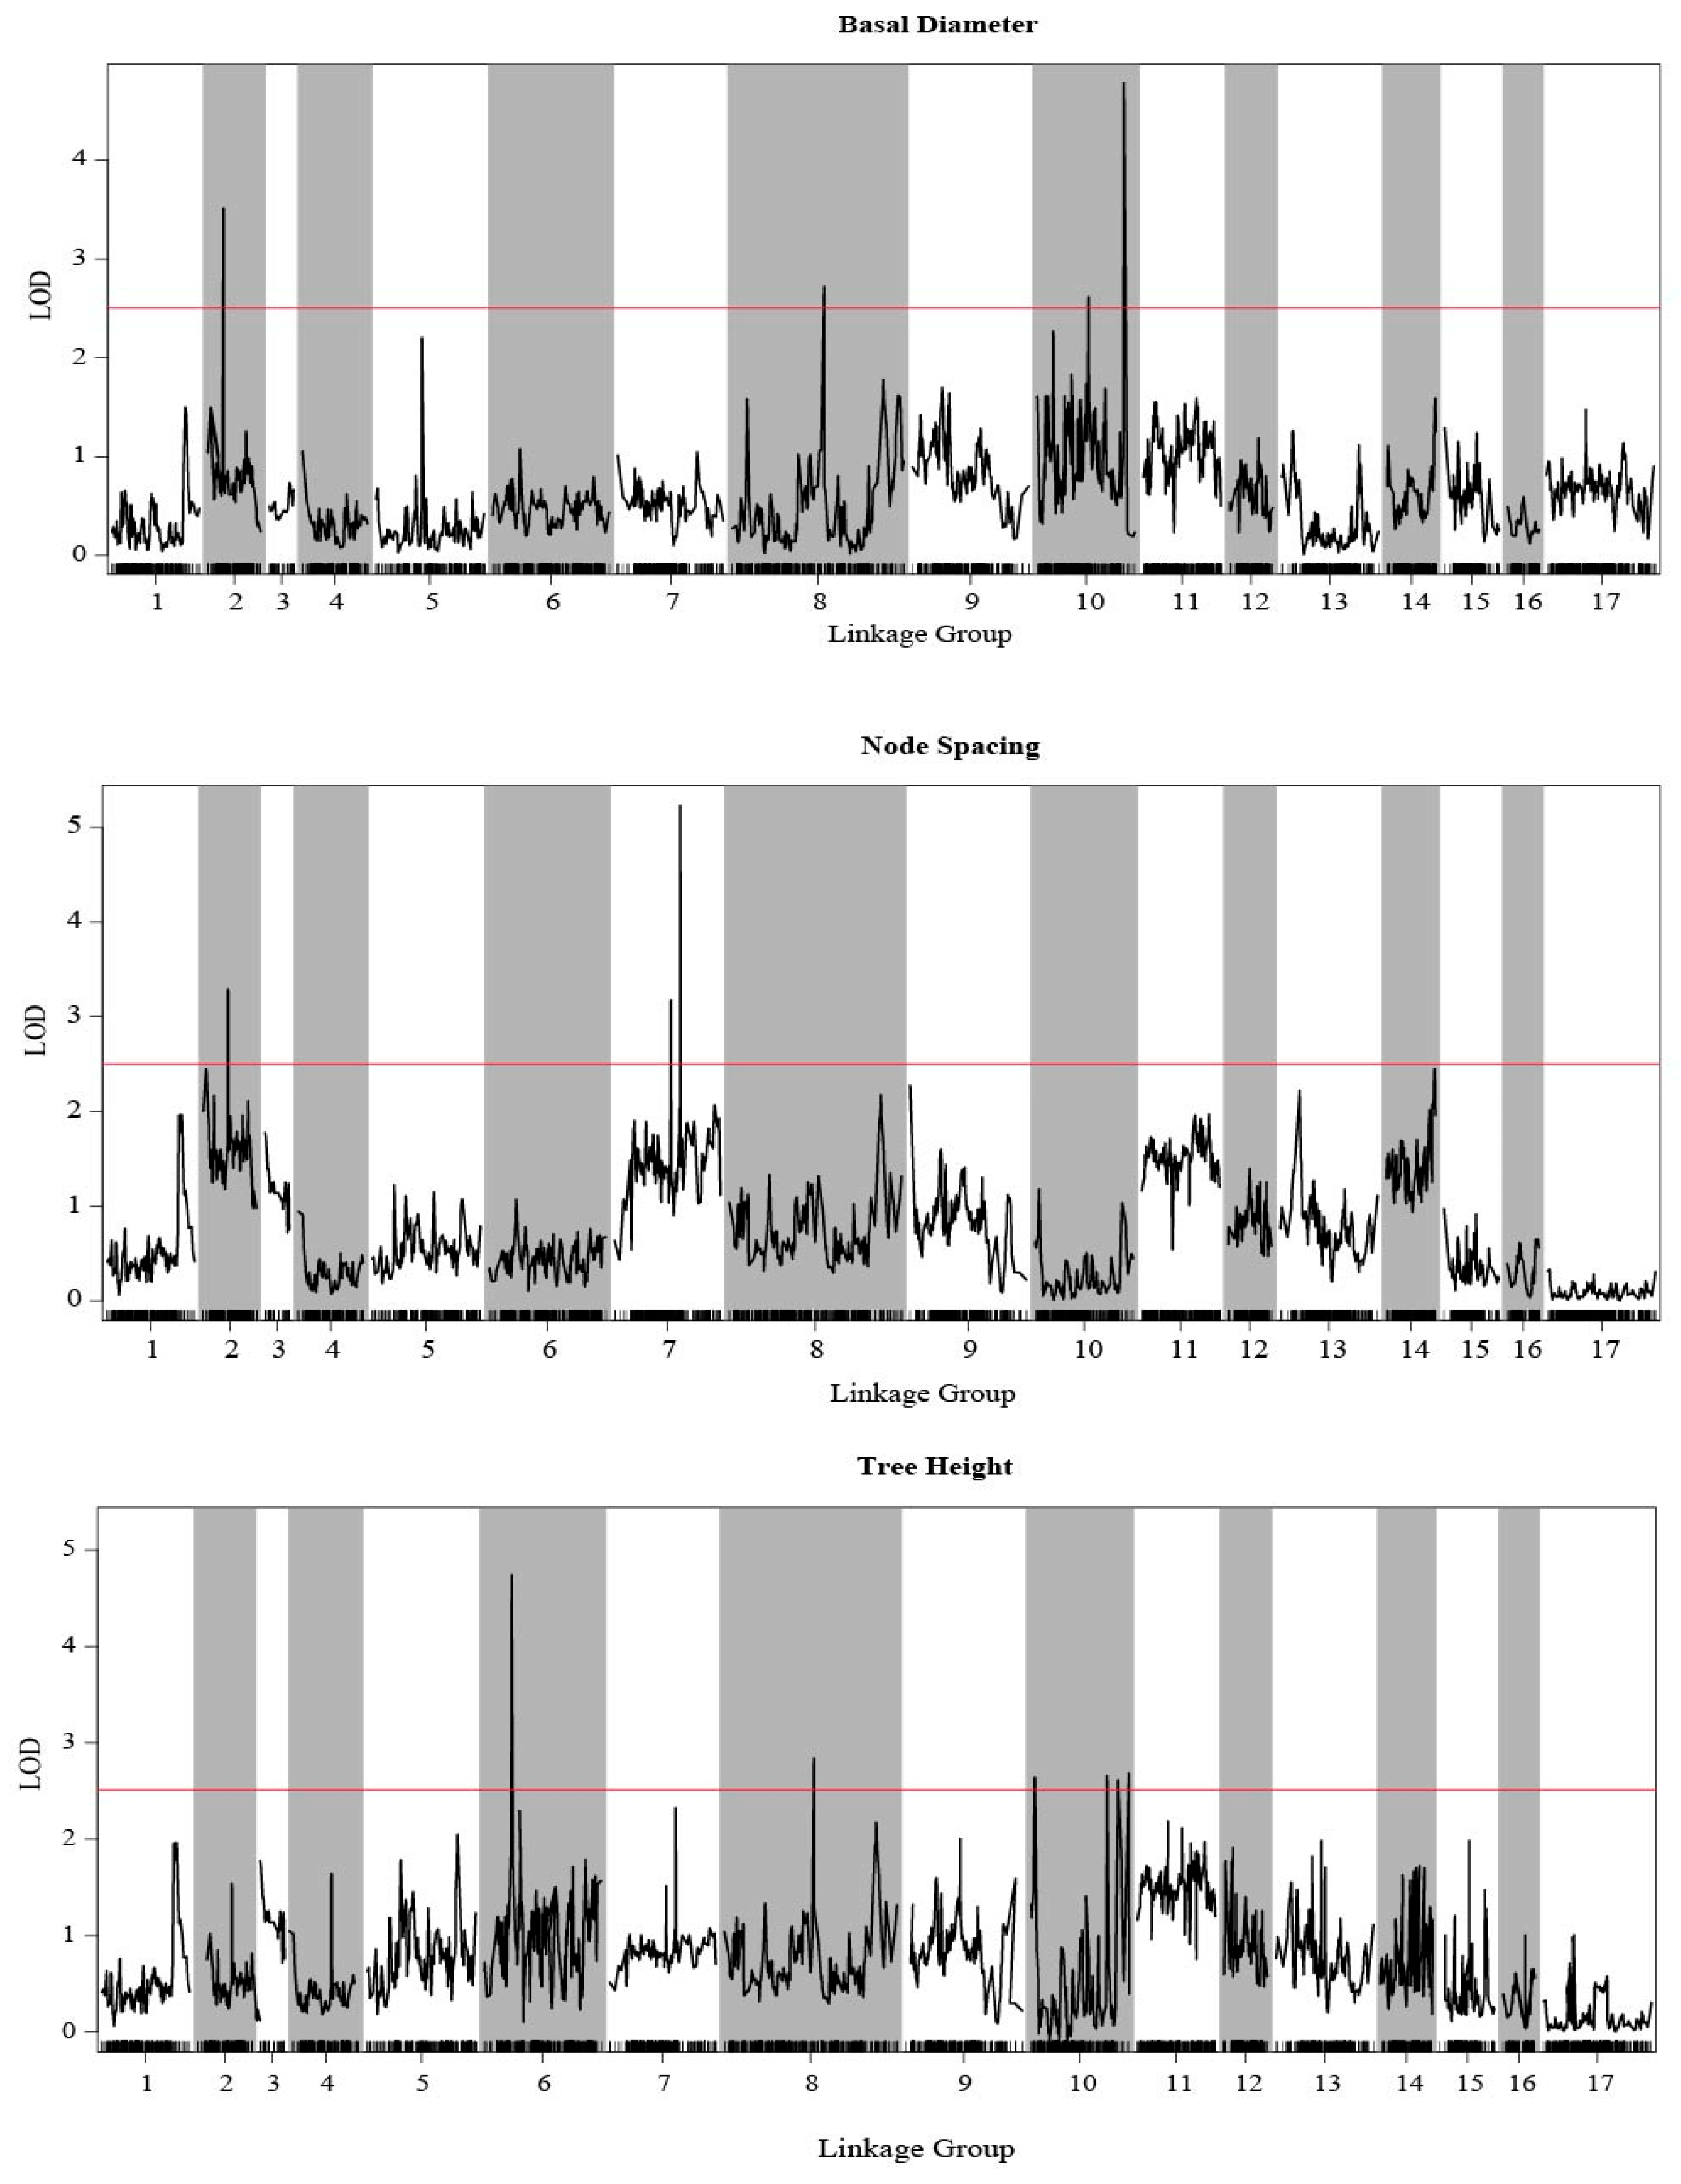
3.5. QTL Mapping of Growth Traits
The QTL analysis of three growth traits were performed by using MapQTL 6.0 with an SNP-based high-density integrated linkage map. Combining with three growth traits and the integrated genetic map, a total of 44 QTLs were detected by CIM and phenotypic variance explained (PVE) of QTLs 10.0–14.2%. The detected QTLs were distributed in 28 scaffolds and five LGs, which were LG02, LG06, LG07, LG08, and LG10, and LOD score varied from 2.60 to 5.23 (Figure 5, Table 2 and Table S7).
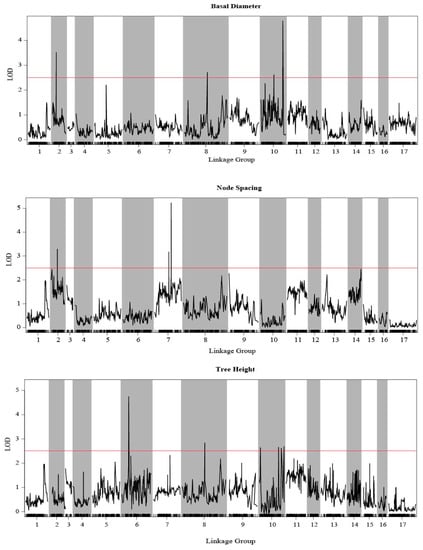
Figure 5.
Growth trait-associated QTLs in E. ulmoides among all linkage groups. The threshold was set to LOD = 2.5.
Table 2.
QTLs detected for node spacing using integrated genetic map.
For BD (Table S7), there were 29 QTLs detected, among which two were located on LG08, three on LG02, and 24 QTLs on LG07, among which two QTLs—np752 and lm5495—had the highest LOD value (5.23). Seventeen QTLs were associated with NS and distributed in LG07 and LG02 (Table 2). Among these, two QTLs were located in LG02 and rest in LG07, with the highest LOD score being 3.52. Ten QTLs were associated with TH (Table S7): one each on LG06 and LG08 and the others on LG07. The phenotypic variance explained by each marker for BD, TH, and NS was 10.0%–14.2%, 10.0%–12.3%, and 10.5%–13.4%, respectively.
3.6. Expression and Annotation of the Candidate Genes
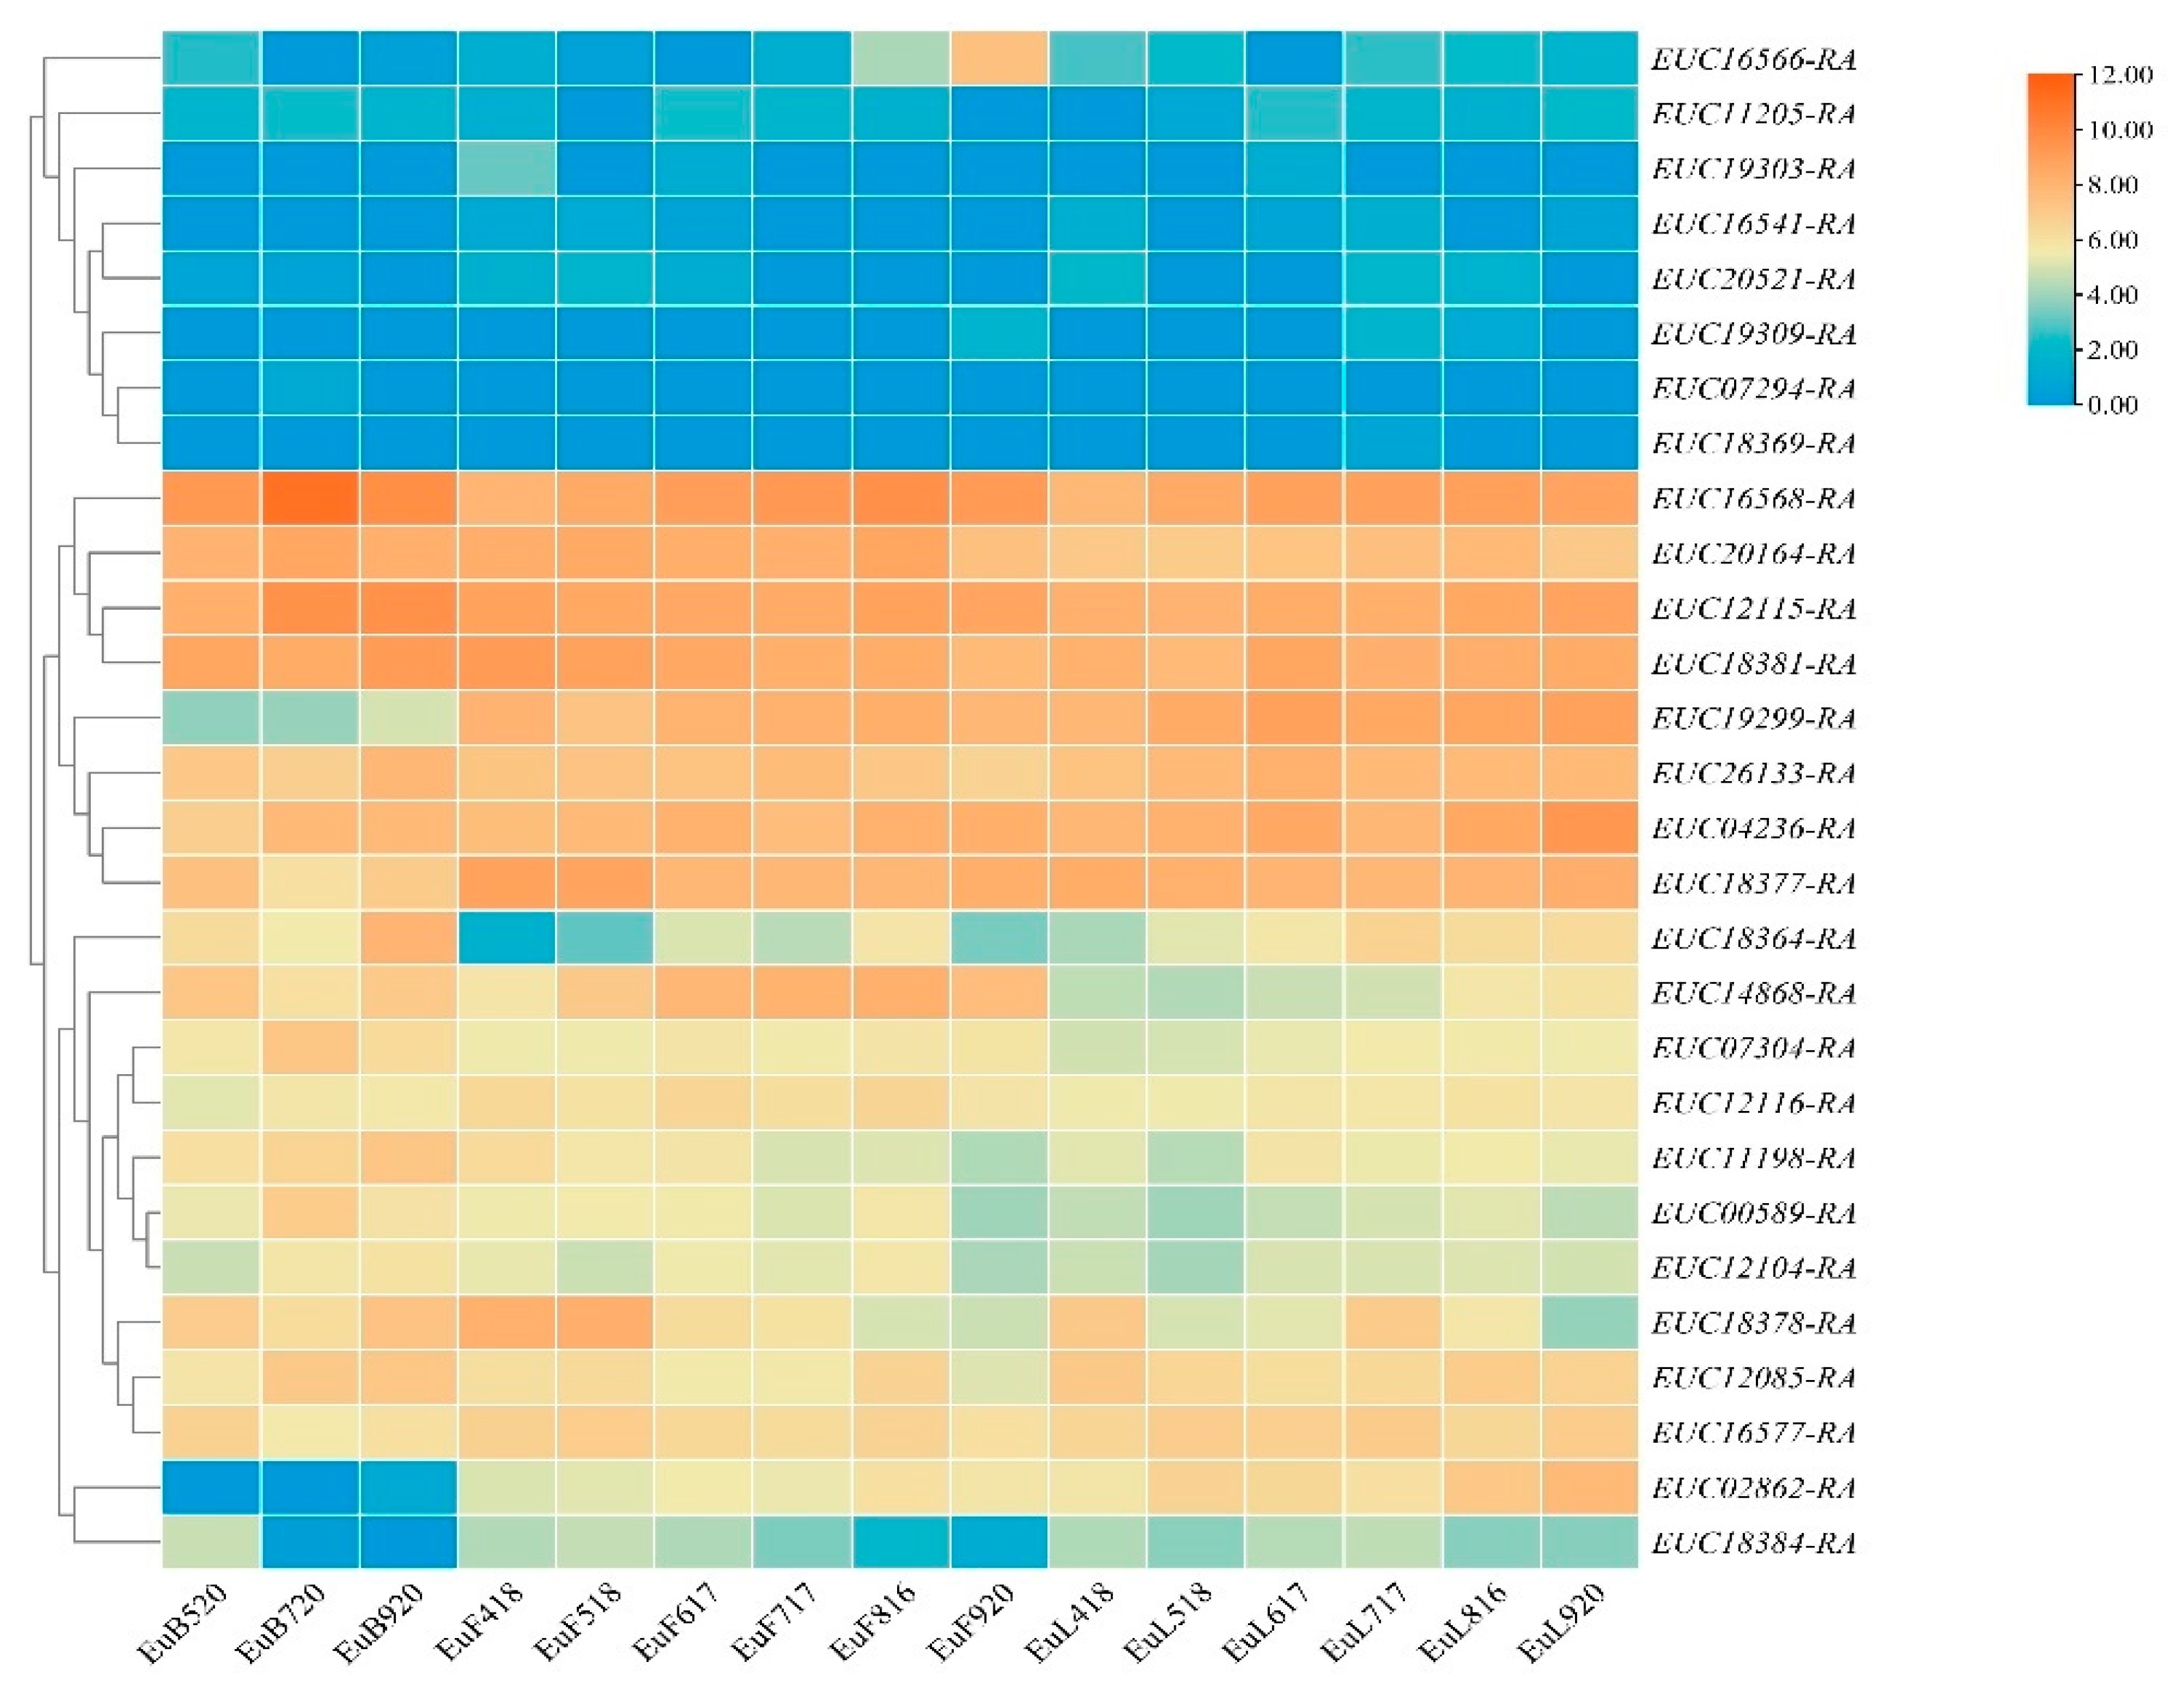
Since 44 QTLs were located on five LGs and 28 scaffolds (Table 2 and Table S7), the regions responsible were used to scan the candidate genes. In order to avoid omissions, we performed functional annotation and screening of genes in the 3 kb interval of trait-related QTLs. A total of 33 candidate genes were identified by scanning (Table 2 and Table S6), among which four (EUC12115-RA, EUC19303-RA, EUC26113-RA, EUC20164-RA) related to two traits, which also indicated growth traits were regulated by multiple genes. To verify whether these candidate genes were differently expressed in different tissue and development stages, the expressed patterns were analyzed using previously reported RNA-seq data. In the expression results showed in Figure 6, 28 genes were clustered in three groups. Gene expression in group I was generally lower, while gene expression in group II was higher in the development stages. However, genes of group II had irregular expression, which may be caused by the involvement of various hormones in plant growth and development. According to annotation as per GO, KEGG, SwissProt, and NCBI, most candidate genes were related to energy storage, signal transmission, hormones, and metabolic pathways (Table S6), e.g., abscisic aldehyde oxidase was related to growth development, auxin response factor and auxin-induced protein were related to hormone regulation [30,31], and tyrosine-specific transport protein interacted with a diverse group of proteins, leading to combinatorial variations in signal-response specificity [32].
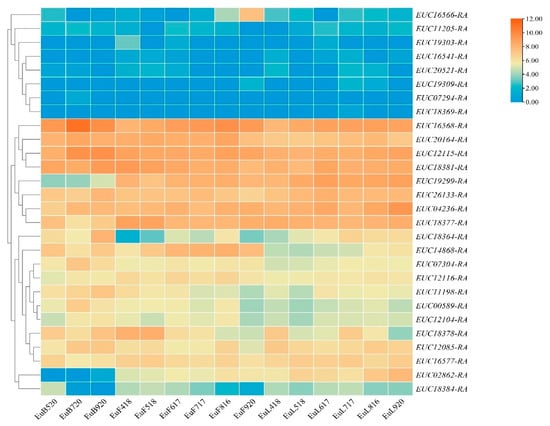
Figure 6.
Expression profiles of 28 candidate genes during development of three tissue types. EuL, EuF, and EuB indicate leaf, fruit, and bark, respectively. The following numbers indicate the collection date. The clustering tree was constructed by hierarchical clustering using average linkage method.
4. Discussion
4.1. Population Selection for Map Construction
E. ulmoides is a multipurpose tree species with high economic, ecological, and social benefits and it is widely used. The whole tree of E. ulmoides can be comprehensively utilized. The bark and seed coat can be used to produce rubber, male flowers and seeds to produce functional health products, wood to produce furniture, and leaves to extract active ingredients and produce functional feed and edible fungi [4]. Generally, segregating populations obtained from crosses between inbred lines used to construct genetic linkage maps are not available for forest trees with long generation constraints [33]. Like other tree species, E. ulmoides also has a long generation cycle. As a key step in genetic linkage map construction, the mapping population is very important and the fertility and genotype separation within the hybrid offspring should be taken into account [34]. At present, F1, F2, backcross populations and haploid populations can be used for forest genetic mapping [35]. In summary, the F1 population is an ideal mapping population for trees, and can be obtained by one-generation hybridization between individuals with high heterozygosity and individuals with relatively distant genetic relationships [36]. This is also convenient and time-saving for many tree species to construct the map. Most of the genetic maps of many trees have been constructed based on the F1 population, e.g., research on hawthorn (Crataegus spp.) [34], Poncirus trifoliata (L.) Raf [37], Fraxinus pennsylvanica Marshall [38], Ziziphus jujuba Mill. [26], Vitis [39] and Osmanthus fragrans Lour., 1790 [40] used F1 populations to construct genetic maps. In this study, we also used two elite cultivars to construct the F1 population with 109 progenies of E. ulmoides. Although our individual number is less than Crataegus and Vitis, it is more than Ziziphus jujuba and Fraxinus pennsylvanica.
4.2. The Advantage of SNP-Marker and GBS Technology
SNPs can be converted into detectable genetic markers because they are single-base differences of different individuals [41]. Studies have shown that SNP loci are ubiquitous in the genome and the most abundant forms of genetic variation between individuals of the same species [42]. Compared with traditional markers, such as RFLP, AFLP, and SSR, SNPs are the most abundant and stable genetic variation in most biological genomes [43]. Therefore, SNP markers were used to construct a genetic map of E. ulmoides, which greatly increased the density of the genetic map. Finally, 10,103 SNP markers were obtained, 11 times that of previous studies [3]. For traditional low-throughput SNP genotyping methods, time spent and low efficiency of specific primers are challenges.
With the development of an NGS platform, large-scale marker discovery and genotyping have been widely applied in the construction of high-density genetic maps. However, GBS technology stands out in NGS technology for being novel and flexible, with high throughput and enough density, with the principle reason being low cost [44]. GBS technology makes it possible to generate more saturated genetic maps and facilitates more accurate identification of QTL [29].
In this study, we obtained 456,630 and 373,429 SNPs in male and female parents, respectively, by a GBS approach, much higher than traditional marker numbers. A total of 191,095 polymorphic SNP markers were obtained after filtering, of which the F1 population can be labeled ”hkxhk,” “nnxnp,” and “lmxll” types with polymorphic markers numbering 35,699, 65,800, and 68,022, respectively, similar to previous studies [18,26,40]. Our genetic map is significantly better than existing maps for total distance and average interval, and therefore our map is denser than previous maps.
4.3. High-Density Genetic Maps
High-density genetic maps are valuable tools in genetic and genomic studies, illuminating genetic and molecular mechanisms of plants and providing the necessary framework for QTL analyses, gene cloning, and molecular breeding [26,38]. Several genetic maps of E. ulmoides have been constructed using AFLPs, SRAP, SSR, and ISSR markers [3,9,13]. However, traditional molecular markers yield less stable results and construct genetic maps with low efficiency [45]. An SSR genetic linkage map containing 869 markers was recently published with 19 linkage groups, 1913.29 cM length, and an average marker density of 2.20 m [3]. As marker numbers and linkage groups are still limited for genomic and genetic studies, their implementation cost is relatively high and operation cumbersome. We constructed a high-density genetic map for E. ulmoides using GBS technology made up of 17 linkage groups consistent with the haploid chromosome number. The integrated genetic linkage map comprised 10,103 SNP markers and spanned 4051.11 cM, with an average marker interval of 0.45 cM. Compared with previously published genetic maps, we achieved longer genetic distance and higher density [3,9,13]. With advancements in molecular marker technology, marker-assisted selection (MAS) has been increasingly applied in E. ulmoides breeding programs. High-density genetic maps with widely adaptable markers are needed to improve the efficiency and transformation of MAS breeding [46]. In this study, the first high-density genetic map based on SNP markers with high polymorphism and strong stability has been constructed for E. ulmoides. This lays a good foundation for the location of important quantitative traits and molecular marker-assisted breeding of E. ulmoides.
4.4. QTL Mapping and Candidate Genes
Growth traits are typical quantitative traits that are influenced by multiple genes, and perhaps no single gene shows significant impact on a trait [47]. In recent years, it has become increasingly common to use SNP markers for high-density genetic maps and important trait-related genes. In our study, composite interval mapping (CIM) was used to map the QTLs associated with growth traits. This method has also been used in QTL analyses for fiber quality, yield, and morphological traits in Gossypium hirsutum [46], Poncirus trifoliata [37], and Elymus sibiricus [48]. We found twelve QTLs that were related to more traits and located in the same region, such as markers lm5495 and lm3422, which were related to both BD and NS traits. One QTL related to more traits was also found in previous studies, such as QTL analysis in Populus [49], Catalpa bungee [36], and Prunus salicina [29]. Wang et al. constructed a new high-density genetic map of Ziziphus jujuba by GBS technology, and based on this map detected 30 potential QTLs that related to both leaf traits and needling length [26]. Our genetic map constructed by GBS technology with SNP makers was used to detect growth-related QTLs. Only two QTLs showed high LOD values (>5.0), while a majority were near the threshold. This may be due to the map needing to be saturated and the reference genome assembly not reaching the chromosomal level. The detected QTLs and candidate genes of growth traits will provide a scientific basis for growth and development research of E. ulmoides.
5. Conclusions
This study demonstrated that GBS sequencing based on NGS is an efficient strategy for constructing a high-density genetic map in E. ulmiodes, which can be effectively applied to QTL analysis of growth traits. A total of 10,103 SNPs were assigned to 17 LGs, agreeing with the chromosome haploid number in E. ulmoides and spanning 4051.11 cM genetic length with an average marker interval of 0.45 cM. To our knowledge, this is the first genetic map with SNP-based genetic linkage of E. ulmoides. A total of 44 growth-related QTLs were detected by MapQTL 6.0 with CIM, and the phenotypic variance explained (PVE) of QTLs ranged 10.0–14.2%. The results showed that most candidate genes were related to energy storage, signal transmission, hormones, and metabolic pathways. This study could provide a solid foundation for chromosome assembly and refinement, and the localization of growth-trait QTLs will advance the investigation of forestry breeding efforts in E. ulmoides.
Supplementary Materials
The following supporting information can be downloaded at: https://www.mdpi.com/article/10.3390/f13091479/s1, Figure S1: Female (’Huazhong 8’) genetic map of E. ulmoides; Figure S2: Male (‘Huazhong 12’) genetic map of E. ulmoides; Table S1: Data of three growth traits of 109 progenies; Table S2: Description of three growth traits of 109 progenies; Table S3: Summary of Genotyping by Sequencing data of Two parents and 109 progenies; Table S4: Detection result of SNP markers; Table S5: Summary statistics of parent linkage map of E. ulmoides; Table S6: Annotation of 33 candidate genes related growth traits of E. ulmoides; Table S7: QTLs detected for two growth traits (basal diameter and tree height) by using integrated genetic map.
Author Contributions
Conceptualization, H.D., P.L. and L.W.; formal analysis, L.D., W.L. and L.W.; funding acquisition, H.D. and L.W.; investigation, W.L. and Q.D.; methodology, W.L., J.Q. and L.W.; resources, C.L., J.Q., J.Z. and Q.D.; supervision, W.L. and H.D.; writing—original draft, W.L. and J.Q.; writing—review and editing, J.Q., P.L. and C.L. All authors have read and agreed to the published version of the manuscript.
Funding
This work was financially supported by the National Key R&D Program of China (2017YFD0600702) and the Surface Project of Fundamental Research Fund of Central Public Welfare Research Institutes (CAFYBB2021MA009).
Institutional Review Board Statement
Not applicable.
Informed Consent Statement
Not applicable.
Data Availability Statement
The data presented in this study are available on request from the corresponding author.
Acknowledgments
We thank the research institute of the Non-timber Forestry Chinese Academy of Forestry (CAF) and Key Laboratory of Non-timber Forest Germplasm Enhancement and Utilization of State Forestry and Grassland Administration for support related to the plant material and experimental equipment.
Conflicts of Interest
The authors declare no conflict of interest.
References
- Wuyun, T.N.; Wang, L.; Liu, H.; Wang, X.; Zhang, L.; Bennetzen, J.L.; Li, T.; Yang, L.; Liu, P.; Du, L. The Hardy Rubber Tree Genome Provides Insights into the Evolution of Polyisoprene Biosynthesis. Mol. Plant. 2018, 11, 429–442. [Google Scholar] [CrossRef] [PubMed]
- Call, V.B.; Dilcher, D.L. The fossil record of Eucommia (Eucommiaceae) in North America. Am. J. Bot. 1997, 84, 798–814. [Google Scholar] [CrossRef] [PubMed]
- Jin, C.; Li, Z.; Li, Y.; Wang, S.; Li, L.; Liu, M. Update of Genetic Linkage Map and QTL Analysis for Growth Traits in Eucommia ulmoides Oliver. Forests 2020, 11, 311. [Google Scholar] [CrossRef]
- Du, H. China Eucommia Pictorial; China Forestry Publishing House: Beijing, China, 2014. [Google Scholar]
- Du, H.; Hu, W.; Yu, R. The Report on Development of China’s Eucommia Rubber Resources and Industry (2014–2015); Social Sciences Academic Press: Beijing, China, 2015. [Google Scholar]
- Nakazawa, Y.; Bamba, T.; Takeda, T.; Uefuji, H.; Harada, Y.; Li, X.; Chen, R.; Inoue, S.; Tutumi, M.; Shimizu, T. Production of Eucommia-rubber from Eucommia ulmoides Oliv. (Hardy Rubber Tree). Plant Biotechnol. 2009, 26, 71–79. [Google Scholar] [CrossRef]
- Wang, C.; Tang, L.; He, J.; Li, J.; Wang, Y. Ethnobotany, Phytochemistry and Pharmacological Properties of Eucommia ulmoides: A Review. Am. J. Chin. Med. 2019, 47, 259–300. [Google Scholar] [CrossRef] [PubMed]
- Wang, C.; Tang, L.; Li, L.; Zhou, Q.; Li, Y.; Li, J.; Wang, Y. Geographic Authentication of Eucommia ulmoides Leaves Using Multivariate Analysis and Preliminary Study on the Compositional Response to Environment. Front. Plant Sci. 2020, 11, 79. [Google Scholar] [CrossRef] [PubMed]
- Li, Y.; Wang, D.; Li, Z.; Wei, J.; Jin, C.; Liu, M. A Molecular Genetic Linkage Map of Eucommia ulmoides and Quantitative Trait Loci (QTL) Analysis for Growth Traits. Int. J. Mol. Sci. 2014, 15, 2053–2074. [Google Scholar] [CrossRef]
- He, D.; Lin, Z.; Zhang, X.; Nie, Y.; Guo, X.; Zhang, Y.; Li, W. QTL mapping for economic traits based on a dense genetic map of cotton with PCR-based markers using the interspecific cross of Gossypium hirsutum × Gossypium barbadense. Euphytica 2006, 153, 181–197. [Google Scholar] [CrossRef]
- Fang, X.; Dong, K.; Wang, X.; Liu, T.; He, J.; Ren, R.; Zhang, L.; Liu, R.; Liu, X.; Li, M. A high density genetic map and QTL for agronomic and yield traits in Foxtail millet [Setaria italica (L.) P. Beauv.]. BMC Genom. 2016, 17, 336. [Google Scholar] [CrossRef]
- Adak, A.; Conrad, C.; Chen, Y.; Wilde, S.C.; Murray, S.C.; AndersonII, S.L.; Subramanian, N.K. Validation of functional polymorphisms affecting maize plant height by unoccupied aerial systems discovers novel temporal phenotypes. G3 Genes Genomes Genet. 2021, 11, jkab075. [Google Scholar] [CrossRef]
- Wang, D.; Li, Y.; Li, L.; Wei, Y.; Li, Z. The first genetic linkage map of Eucommia ulmoides. J. Genet. 2014, 93, 13–20. [Google Scholar] [CrossRef]
- Shavrukov, Y. Comparison of SNP and CAPS markers application in genetic research in wheat and barley. BMC Plant Biol. 2016, 16, 11. [Google Scholar] [CrossRef]
- Metzker, M.L. Sequencing technologies—The next generation. Nat. Rev. Genet. 2010, 11, 31–46. [Google Scholar] [CrossRef]
- Grover, A.; Sharma, P.C. Development and use of molecular markers: Past and present. Crit. Rev. Biotechnol. 2016, 36, 290–302. [Google Scholar] [CrossRef]
- He, J.; Zhao, X.; Laroche, A.; Lu, Z.; Liu, H.; Li, Z. Genotyping-by-sequencing (GBS), an ultimate marker-assisted selection (MAS) tool to accelerate plant breeding. Front. Plant Sci. 2014, 5, 484. [Google Scholar] [CrossRef]
- Zhang, Z.; Wei, T.; Zhong, Y.; Li, X.; Huang, J. Construction of a high-density genetic map of Ziziphus jujuba Mill. using genotyping by sequencing technology. Tree Genet. Genomes 2016, 12, 76. [Google Scholar] [CrossRef]
- Wang, L.; Du, H.; Li, T.; Wuyun, T.N. De novo transcriptome sequencing and identification of genes related to salt stress in Eucommia ulmoides Oliver. Trees 2018, 32, 151–163. [Google Scholar] [CrossRef]
- Li, H.; Durbin, R. Fast and accurate short read alignment with Burrows-Wheeler transform. Bioinformatics 2009, 25, 1754–1760. [Google Scholar] [CrossRef]
- Li, H.; Handsaker, B.; Wysoker, A.T.; Fennell, J.; Ruan, N.; Homer, G.; Marth, G.; Abecasis, R. Durbin: The Sequence Alignment/Map format and SAMtools. Bioinformatics 2009, 25, 2078–2079. [Google Scholar] [CrossRef]
- Wang, K.; Li, M.; Hakonarson, H. ANNOVAR: Functional annotation of genetic variants from high-throughput sequencing data. Nucleic Acids Res. 2010, 38, e164. [Google Scholar] [CrossRef]
- Ooijen, J. JoinMap 4.0: Software for the Calculation of Genetic Linkage Maps in Experimental Population; Kyazma BV: Wageningen, The Netherlands, 2006. [Google Scholar]
- Xu, S. Quantitative trait locus mapping can benefit from segregation distortion. Genetics 2008, 180, 2201–2208. [Google Scholar] [CrossRef]
- Ooijen, J.V.; Ooijen, J.; Hoorn, J.; Duin, J.; Van, J.W. MapQTL®6, Software for the Mapping of Quantitative Trait Loci in Experimental Populations of Diploid Species; Kyazma BV: Wageningen, The Netherlands, 2009. [Google Scholar]
- Wang, Z.; Zhang, Z.; Tang, H.; Zhang, Q.; Zhou, G.; Li, X. High-Density Genetic Map Construction and QTL Mapping of Leaf and Needling Traits in Ziziphus jujuba Mill. Front. Plant Sci. 2019, 10, 1424. [Google Scholar] [CrossRef]
- Schmid, R.; Blaxter, M.L. annot8r: GO, EC and KEGG annotation of EST datasets. BMC Bioinform. 2008, 9, 180. [Google Scholar] [CrossRef]
- McKenna, A.; Hanna, M.; Banks, E.; Sivachenko, A.; Cibulskis, K.; Kernytsky, A.; Garimella, K.; Altshuler, D.; Gabriel, S.; Daly, M. The Genome Analysis Toolkit: A MapReduce framework for analyzing next-generation DNA sequencing data. Genome Res. 2010, 20, 1297–1303. [Google Scholar] [CrossRef]
- Salazar, J.A.; Pacheco, I.; Shinya, P.; Zapata, P.; Silva, C.; Aradhya, M.; Velasco, D.; Ruiz, D.; Martínez-Gómez, P.; Infante, R. Genotyping by Sequencing for SNP-Based Linkage Analysis and Identification of QTLs Linked to Fruit Quality Traits in Japanese Plum (Prunus salicina Lindl.). Front. Plant Sci. 2017, 8, 476. [Google Scholar] [CrossRef]
- Hu, M.; Zhang, H.; Wang, B.; Song, Z.; Gao, Y.; Yuan, C.; Huang, C.; Zhao, L.; Zhang, Y.; Wang, L. Transcriptomic analysis provides insights into the AUXIN RESPONSE FACTOR 6-mediated repression of nicotine biosynthesis in tobacco (Nicotiana tabacum L.). Plant Mol. Biol. 2021, 107, 21–36. [Google Scholar] [CrossRef]
- Huang, G.; Hu, H.; Meene, A.; Zhang, J.; Dong, L.; Zheng, S.; Zhang, F.; Betts, N.S.; Liang, W.; Bennett, M.J. AUXIN RESPONSE FACTORS 6 and 17 control the flag leaf angle in rice by regulating secondary cell wall biosynthesis of lamina joints. Plant Cell 2021, 33, 3120–3133. [Google Scholar] [CrossRef]
- Afzal, A.J.; Wood, A.J.; Lightfoot, D.A. Plant receptor-like serine threonine kinases: Roles in signaling and plant defense. Mol. Plant-Microbe Interact. 2008, 21, 507–517. [Google Scholar] [CrossRef]
- Grattapaglia, D.; Sederoff, R. Genetic linkage maps of Eucalyptus grandis and Eucalyptus urophylla using a pseudo-testcross: Mapping strategy and RAPD markers. Genetics 1994, 137, 1121–1137. [Google Scholar] [CrossRef]
- Zhao, Y.; Zhao, Y.; Guo, Y.; Su, K.; Shi, X.; Liu, D.; Zhang, J. High-density genetic linkage-map construction of hawthorn and QTL mapping for important fruit traits. PLoS ONE 2020, 15, e0229020. [Google Scholar] [CrossRef] [Green Version]
- Wang, M. Forest Genetic and Breeding; China Forestry Publishing House: Beijing, China, 2001. [Google Scholar]
- Lu, N.; Zhang, M.; Xiao, Y.; Han, D.; Liu, Y.; Zhang, Y.; Yi, F.; Zhu, T.; Ma, W.; Fan, E. Construction of a high-density genetic map and QTL mapping of leaf traits and plant growth in an interspecific F1 population of Catalpa bungei × Catalpa duclouxii Dode. BMC Plant Biol. 2019, 19, 596. [Google Scholar] [CrossRef] [PubMed]
- Xu, Y.; Liu, S.; Gan, Z.; Zeng, R.; Zhang, J.; Hu, C. High-Density Genetic Map Construction and Identification of QTLs Controlling Leaf Abscission Trait in Poncirus trifoliata. Int. J. Mol. Sci. 2021, 22, 5723. [Google Scholar] [CrossRef] [PubMed]
- Wu, D.; Koch, J.; Coggeshall, M.; Carlson, J. The first genetic linkage map for Fraxinus pennsylvanica and syntenic relationships with four related species. Plant Mol. Biol. 2019, 99, 251–264. [Google Scholar] [CrossRef] [PubMed]
- Zhu, J.; Guo, Y.; Su, K.; Liu, Z.; Ren, Z.; Li, K.; Guo, X. Construction of a highly saturated Genetic Map for Vitis by Next-generation Restriction Site-associated DNA Sequencing. BMC Plant Biol. 2018, 18, 347. [Google Scholar] [CrossRef] [PubMed]
- He, Y.; Yuan, W.; Dong, M.; Han, Y.; Shang, F. The First Genetic Map in Sweet Osmanthus (Osmanthus fragrans Lour.) Using Specific Locus Amplified Fragment Sequencing. Front. Plant Sci. 2017, 8, 1621. [Google Scholar] [CrossRef] [PubMed]
- Mammadov, J.; Aggarwal, R.; Buyyarapu, R.; Kumpatla, S. SNP Markers and Their Impact on Plant Breeding. Int. J. Plant Genom. 2012, 2012, 728398. [Google Scholar] [CrossRef] [PubMed]
- Rafalski, J.A. Novel genetic mapping tools in plants: SNPs and LD-based approaches. Plant Sci. 2002, 162, 329–333. [Google Scholar] [CrossRef]
- Liu, J.; Huang, S.; Sun, M.; Liu, S.; Liu, Y.; Wang, W.; Zhang, X.; Wang, H.; Hua, W. An improved allele-specific PCR primer design method for SNP marker analysis and its application. Plant Methods 2012, 8, 34. [Google Scholar] [CrossRef]
- Donato, M.D.; Peters, S.O.; Mitchell, S.E.; Hussain, T.; Imumorin, I.G. Genotyping-by-Sequencing (GBS): A Novel, Efficient and Cost-Effective Genotyping Method for Cattle Using Next-Generation Sequencing. PLoS ONE 2013, 8, e62137. [Google Scholar]
- Huang, X.; Feng, Q.; Qian, Q.; Zhao, Q.; Wang, L.; Wang, A.; Guan, J.; Fan, D.; Weng, Q.; Huang, T. High-throughput genotyping by whole-genome resequencing. Genome Res. 2009, 19, 1068–1076. [Google Scholar] [CrossRef]
- Zhang, K.; Kuraparthy, V.; Fang, H.; Zhu, L.; Sood, S.; Jones, D.C. High-density linkage map construction and QTL analyses for fiber quality, yield and morphological traits using CottonSNP63K array in upland cotton (Gossypium hirsutum L.). BMC Genom. 2019, 20, 889. [Google Scholar] [CrossRef] [Green Version]
- Huang, X.; Jiang, Y.; Zhang, W.; Cheng, Y.; Wang, Y.; Ma, X.; Duan, Y.; Xia, L.; Chen, Y.; Wu, N. Construction of a high-density genetic map and mapping of growth-related QTLs in the grass carp (Ctenopharyngodon idellus). BMC Genom. 2020, 21, 313. [Google Scholar] [CrossRef]
- Zhang, Z.; Xie, W.; Zhang, J.; Wang, N.; Zhao, Y.; Wang, Y.; Bai, S. Construction of the first high-density genetic linkage map and identification of seed yield-related QTLs and candidate genes in Elymus sibiricus, an important forage grass in Qinghai-Tibet Plateau. BMC Genom. 2019, 20, 861. [Google Scholar] [CrossRef]
- Du, Q.; Yang, X.; Xie, J.; Quan, M.; Xiao, L.; Lu, W.; Tian, J.; Gong, C.; Chen, J.; Li, B. Time-specific and pleiotropic quantitative trait loci coordinately modulate stem growth in Populus. Plant Biotechnol. J. 2019, 17, 608–624. [Google Scholar] [CrossRef] [Green Version]


Publisher’s Note: MDPI stays neutral with regard to jurisdictional claims in published maps and institutional affiliations. |
© 2022 by the authors. Licensee MDPI, Basel, Switzerland. This article is an open access article distributed under the terms and conditions of the Creative Commons Attribution (CC BY) license (https://creativecommons.org/licenses/by/4.0/).