Next Article in Journal
Soil Quality Assessment and Management in Karst Rocky Desertification Ecosystem of Southwest China
Next Article in Special Issue
Research Opportunity on Fractional Cover of Forest: A Bibliometric Review
Previous Article in Journal
Genetic Diversity and Structure of a Diverse Population of Picea sitchensis Using Genotyping-by-Sequencing
Previous Article in Special Issue
Annual Change Analysis of Mangrove Forests in China during 1986–2021 Based on Google Earth Engine
 
 
Correction published on 10 July 2024, see Forests 2024, 15(7), 1190.
Article

Second-Entry Burns Reduce Mid-Canopy Fuels and Create Resilient Forest Structure in Yosemite National Park, California

by
Lacey E. Hankin
1,* and
Chad T. Anderson
2
1
Branch of Fire & Aviation Management, Yosemite National Park, National Park Service, Mariposa, CA 95338, USA
2
Branch of Physical Sciences & Landscape Ecology, Yosemite National Park, National Park Service, Mariposa, CA 95338, USA
*
Author to whom correspondence should be addressed.
Forests 2022, 13(9), 1512; https://doi.org/10.3390/f13091512
Submission received: 19 July 2022 / Revised: 19 August 2022 / Accepted: 13 September 2022 / Published: 17 September 2022 / Corrected: 10 July 2024
(This article belongs to the Special Issue Forest Vegetation Monitoring through Remote Sensing Technologies)

Abstract

:
Understanding the patterns and underlying drivers of forest structure is critical for managing landscape processes and multiple resource management. Merging several landscape-scale datasets, including long-term fire histories, airborne LiDAR, and downscaled topo-climatic data, we assessed complex ecological questions regarding the interactions of forest structure, climate, and fire in the Yosemite National Park, a protected area historically dominated by frequent fire and largely free of the impacts of commercial industrial logging. We found that forest structure broadly corresponded with forest types arranged across elevation-driven climatic gradients and that repeated burning shifts forest structure towards conditions that are consistent with increased resilience, biodiversity, and ecosystem health and function. Specifically, across all forest types, tree density and mid-canopy strata cover was significantly reduced compared to overstory canopy and the indices of forest health improved after two fires, but no additional change occurred with subsequent burns. This study provides valuable information for managers who seek to refine prescriptions based on an enhanced understanding of fire-mediated changes in ladder fuels and tree density and those seeking to define the number of treatments needed to mitigate severe fire risk and enhance resiliency to repeated fires. In addition, our study highlights the utility of large-landscape LiDAR acquisitions for supporting fire, forest, and wildlife management prioritization and wildfire risk assessments for numerous valued resources.

1. Introduction

Fire has shaped the structure, pattern, and composition of forests globally across multiple spatial and temporal scales [1,2,3]. Heterogeneity in fire severity creates natural variation in the arrangement and density of fuels, which interacts with microclimate and topography to influence subsequent fire activity and ecosystem processes [4,5,6]. Humans have moderated these fire feedbacks by maintaining relatively frequent fire for resource management and cultural purposes [7,8,9,10]; however, shifts in fire regimes due to fire suppression policies and human-driven climate change have disrupted the natural role of fire and altered forest conditions [11,12,13]. Contemporary fire activity, compounded with recent widespread drought, may therefore exceed forest resilience mechanisms [14,15] and contributes to uncertainty surrounding the persistence of forest ecosystems and risks to ecological and anthropogenic communities. The restoration and maintenance of historic fire regimes and forest structures that reduce the potential for high-severity fire are central objectives of forest managers worldwide [10,16].
In the western United States, National Parks have some of the oldest contemporary fire records and therefore provide an opportunity to evaluate the role and cumulative effects of managed fire. In addition, National Park Service (NPS) records allow for the study of forests relatively free from additional manipulations, such as widespread timber harvest, which can complicate inferences specifically related to the effects of fire [17]. Late 19th and mid-20th century fire suppression has led to the densification and homogenization of forests within many National Parks, such as the Yosemite National Park (YNP), posing challenges for resource management and human safety. However, managing natural lightning ignitions for resource benefit and prescribed fire have been at the core of Yosemite’s active fire management program since the early 1970s [18], making YNP an ideal place to study the effects of fire, topography, and climate on forest structure with few confounding circumstances related to site history. Understanding the degree to which fire has influenced forest structure in many areas of the Park is critical for implementing an effective fire management program that requires the prioritization of areas most departed from historical forest conditions and most at-risk for catastrophic high-severity wildfire.
Fire modifies forest structure through complex interactions between existing vegetation, fire activity, topography, and climate [19,20,21]. Research within YNP has highlighted the legacy of fire exclusion—montane and subalpine forests have higher levels of fuel from the forest floor to intermediate canopy strata, and these small diameter trees carry fire from the surface to tree crowns, increasing fire severity [22]. The densification of these forests has coincided with a decline in healthy, large-diameter trees and a shift towards more shade-tolerant species compositions [23,24], altering fire behavior. These changes are exacerbated at lower elevations within montane and subalpine forests [23]. Conversely, where wildfires have been managed for decades, such as in the Illilouette Creek basin in YNP, low- to moderate-severity fires have driven heterogeneous forest structure characterized by overall lower tree densities and reduced ladder fuels, which self-limit the spread of high-severity fire [2,5,25,26,27]. Management actions therefore aim to promote and mimic these natural processes to modify wildland fire behavior and reduce the risk of severe fire effects [28,29], while also increasing forest health [30,31] and potential water yield [32,33]. However, single low- to moderate-severity fire events may not drive sufficient structural change to achieve resilient forest structure, but our understanding of this feedback between repeated fire and fuel structure and therefore the number of fire entries required to achieve management objectives remains a key unknown.
The historic role of fire and its feedbacks with forest structure and ecosystem processes vary by forest type and disturbance histories in various biophysical settings, making large sample sizes that are spatially diverse critical to disentangling complex patterns [26,34,35]. Classical methods in fire history, fuels, and forest ecology studies have generally been limited in spatial scope and concentrated in small portions of the Park [26,36]. These studies have provided invaluable insight into forest dynamics in response to wildfire both within and outside the natural range of variation, but the availability of remote sensing products and high-resolution airborne light detection and ranging (LiDAR) data facilitates quantifying these fire-mediated changes in forest structure occurring from fine to broad spatial scales [37,38]. LiDAR has become a powerful tool for forest studies, increasing the scale at which forest dynamics and ecosystem processes may be evaluated [39,40,41] beyond the limited spatial scope of traditional field sampling. Several case studies within YNP have explored the relationship between horizontal and vertical forest structure and fire severity using airborne LiDAR and remote sensing products [20,39,40]. This work expands the scale at which feedbacks between pattern and process can be examined, highlighting the importance of fire severity in driving post-fire recovery trajectories and providing additional evidence for low- to moderate-severity fire creating resilient forest structures. However, previous LiDAR acquisitions in the Park were still limited to smaller spatial areas and/or single fire events, limiting the potential range of forest conditions considered in the analysis and inference of structural changes following multiple fire events.
With the availability of parkwide LiDAR in 2019, we are now able to expand these questions to forest-fire feedbacks across the entire Park to inform management and restoration by evaluating if and how managed wildfire can promote desirable forest conditions. The broad spatial coverage allows us to use a gradient of fire history to assess how repeated fire events influence forest structure, assisting in the development of target conditions and inference into the need for forest management. In particular, LiDAR has been shown to effectively quantify ladder fuels, which are a component of the canopy frequently manipulated by fire and forest managers to moderate fire behavior [42,43]. The vertical and horizontal distribution of fuels across the landscape is critical information for prioritizing management, wildfire use, and the need for second- or third-entry treatments to achieve desired conditions. Furthermore, understanding patterns in forest structure and the underlying drivers of these patterns aids in predicting forest health [31], post-fire forest recovery by quantifying seed sources [44] and suitable microclimates [45], and for managing sensitive and threatened species [46,47,48] by characterizing habitat structure and configuration in the context of disturbance.
In this study, we used parkwide LiDAR, almost a century of fire history data, and topo-climatic data to evaluate how forest structure varies across the Yosemite National Park according to multiple interacting factors, particularly fire history. With this rich dataset, we addressed the following questions on broad spatial scales not previously possible: (a) what is the relative influence of forest type, fire history, topography, and climate on forest structure? (b) how does fire history, specifically the number of burns, impact structure components frequently manipulated by management interventions? and (c) how does fire history impact forest health? Our results provide the first assessment of fire-mediated parkwide forest structure and will be useful for continued wildland fire use and the management of natural resources within the Park.

2. Materials and Methods

2.1. Study Area

The Yosemite National Park is located in the central Sierra Nevada mountains of California and encompasses over 759,000 acres of a diversity of habitat types. The Park extends from low-elevation foothills to high-elevation granite peaks, with vegetation communities broadly following this elevational gradient. Summers are characterized by hot, dry conditions, while winters are cold and snow accounts for the majority of annual precipitation. Lightning strikes are pervasive throughout the park and ignite numerous fires each year. Both from lightning and cultural burning, fire has historically occurred in all vegetation types in the Park (excluding high-elevation alpine zone); however, fire was excluded from much of the Park from the late 19th to mid-20th century. Managing natural lightning ignitions for resource benefit and prescribed fire have been a part of the active fire management program since the early 1970s [49]. In many areas, abundant high elevation granite, the lack of access, and minimal threat to human infrastructure allow for fire management strategies such as confine and contain or monitor with no direct suppression [50].

2.2. Data Sources

LiDAR-derived data layers were produced for the Yosemite National Park as part of the California LiDAR project’s southwest pilot area in collaboration with the U.S. Geological Survey’s 3DEP program (collected 7 October 2019–23 October 2019) [51]. LiDAR metrics were developed according to methods outlined in Chamberlin et al. 2021 [52] and include standard FUSION metrics [53] and post-processed metrics, such as canopy cover by stratum (Figure 1), tree approximate objects (TAO, hereafter ‘tree density’), tree height metrics, structure class layers, and topographic metrics (Table S1). Importantly, TAOs may not represent true individual trees but rather include one dominant tree as well as several subdominant trees due to detection of interlocking crowns during the LiDAR point cloud segmentation process [54]. This disparity between TAOs and true individual trees may vary under different forest conditions and likely underestimates the true number of trees in a given stand. TAOs considered here represent both live and dead canopy. We also included LiDAR-derived topographic context, the relative elevation of the sample centered within a 2000 m pixel, to incorporate potential topographic influences.
To explore the potential drivers of forest structure, we evaluated climate and disturbance characteristics across the study area. We extracted 800 m resolution mean annual temperature (MAT) and mean annual precipitation (MAP) data that were summarized to 30-year normals from 1990–2020 [55]. We obtained detailed fire history data from 1930 to present, including total number of burns (hereafter, ‘burn class’), year of last burn, and median fire return interval departure (FRID), from the National Park Service records [56]. FRID represents the deviation from pre-settlement fire frequencies due to suppression efforts in the 20th century. Fire history records include both contemporary fire perimeters derived from satellite data as well as digitized hand-drawn fire perimeters dating back to 1930. Smaller fires are known to be less accurate but were not expected to impact the inferences due to the large sample size available. All fire starts are included in the records (min size = 0.1 acres); however, only lightning and prescribed fires (excluding human-caused fire) were recorded prior to the 1980s. We also assessed the effect of fire history on vegetation health by comparing normalized difference vegetation indices (NDVI), a well-established measure of vegetation greenness used to represent changes in plant vigor [57,58]. Mean NDVI values were extracted from 10 m resolution Sentinel-2 imagery captured between June and August 2019.
We created a random subsample of these variables summarized to 30 m pixels (n = 21,444) with a minimum spacing of 100-m in ArcGIS Pro 2.9.1 [59]. Samples were further constrained to the dominant forest types (Jeffrey pine, red fir, mixed conifer, and lodgepole pine) in YNP using the 2016 National Landcover Database [60,61]. We ultimately evaluated variation in and drivers of forest structure in a subsample containing a total of 14,901 pixels, including 1467 samples in Jeffrey pine, 4404 samples in red fir, 7771 samples in mixed conifer, and 1259 samples in lodgepole pine forests (Table 1). We also tested these relationships in samples that had experienced at least one prescribed burn, which included a subset of the data totaling 212 Jeffrey pine samples, 2440 mixed conifer samples, and 168 red fir samples. Prescribed fire has been rare in lodgepole pine forests in the Park and thus were dropped from this subsequent analysis.

2.3. Statistical Analyses

Given the multivariate nature of forest structure, we first performed a non-metric multidimensional scaling (NMDS) ordination in the package ‘vegan’ [62] to assess similarities among samples according to forest structure metrics. We included the metrics of canopy strata, canopy variability and height, and tree density as response variables in the ordination. We specified a NMDS ordination with two dimensions and a distance matrix based on Bray–Curtis dissimilarities to account for changes in units among forest structure metrics. Stress was less than 0.1, indicating a good representation of samples in two-dimensional multivariate space.
Using the distance matrix specified above, we then evaluated potential drivers of multivariate forest structure as a function of forest type, burn class, FRID, MAT, and MAP using the permutational multivariate analysis of variance (PERMANOVA, [63]). We evaluated the multicollinearity of the explanatory variables using variance inflation factors in the ‘Performance’ package [64] and found that there were no significant correlations (all VIFs < 3.4). We included the interaction between forest type and burn class and forest type and FRID based on expectations of different fire regime characteristics among forest types [26,34,35]. This test compares differences in centroids and dispersion according to grouping variables of interest (i.e., forest type, burn class) and performs a linear regression of continuous explanatory variables in ordination space. PERMANOVA is a non-parametric multivariate test that allowed us to accommodate the varying distributions of each forest structure metric that contributed to the underlying distance matrix. The PERMANOVA was implemented in the ‘Vegan’ package, version 2.6-2 [62]. Explanatory variables were evaluated with pseudo F-ratios, which were permutated 999 times to determine statistical significance (α = 0.01) in driving differences in multivariate forest structure.
Finally, to evaluate how burn class influenced the specific attributes of forest structure and vegetation health, we used analysis of variance (ANOVA) tests to assess differences in each canopy strata, in TAOs, and in NDVI according to burn class. These forest structure metrics are attributes commonly manipulated by forest and fire managers to achieve desired outcomes. Pairwise differences in each response between burn classes were evaluated using TukeyHSD tests. Each analysis was performed on the entire dataset as well as the subset focused on prescribed burns.

3. Results

A range of forest structure conditions exists across the dominant forest types of the Yosemite National Park (Table 1). Samples spanned an elevational range of 1031 to 3388 m and LiDAR-derived basal area ranged from 0 to 116 m2/ha. Tree density ranged from 0 to 383 TAO/ha. Some locations burned as many as nine times since historical fire records in the Park began (1930); however, the mean number of burns was only 1.3 across all forest types. Forest types broadly corresponded to elevation-driven gradients in mean annual temperature and precipitation (Table 2).

3.1. Drivers of Forest Structure

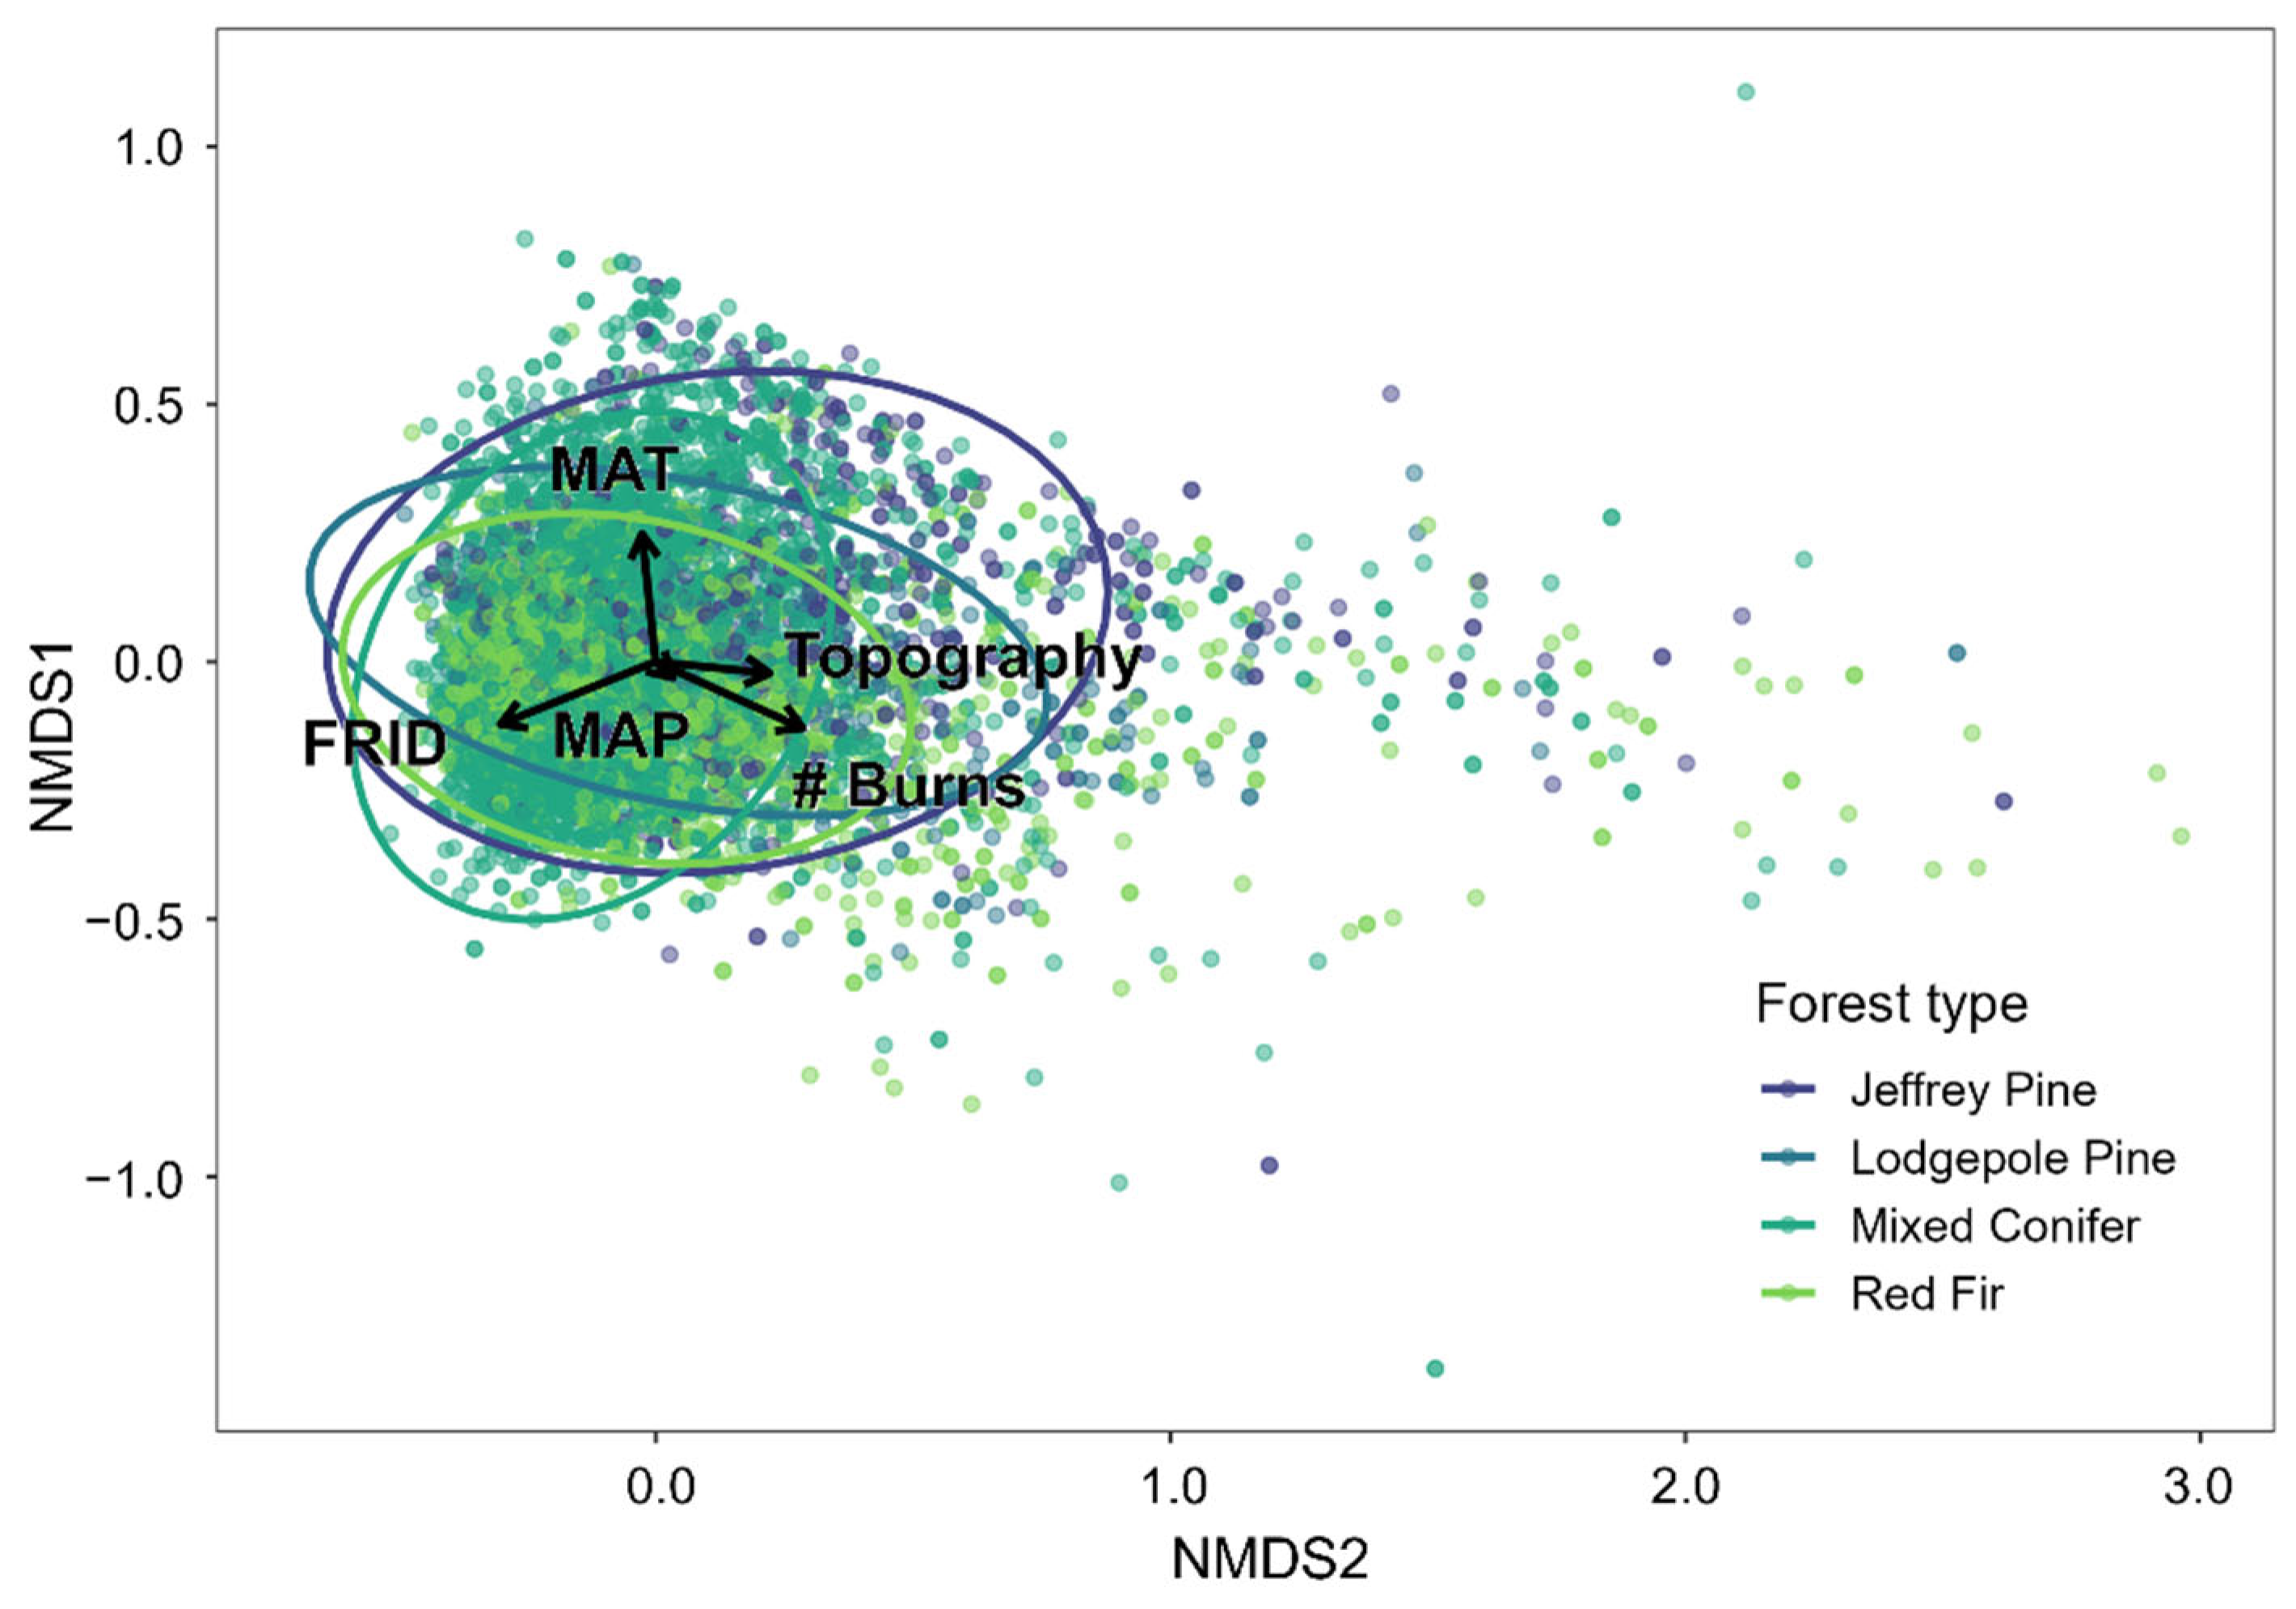
Multivariate forest structure was driven strongly by mean annual temperature (F = 265, p = 0.001), forest type (F = 176, p = 0.001), and burn class (F = 163, p = 0.001) according to the PERMANOVA analysis (Figure 2). Topographic context (F = 79, p = 0.001), FRID (F = 56, p = 0.001), and mean annual precipitation (F = 49, p = 0.001) explained a small, yet statistically significant portion of variation in forest structure as well. Together, these variables explained only 16% of variation in multivariate forest structure, indicating high variability in forest structure characteristics among samples. These patterns were consistent in sites that had experienced at least one prescribed burn, with mean annual temperature (F = 124, p = 0.001), forest type (F = 123, p = 0.001), and burn class (F = 56, p = 0.001) explaining the most variation in multivariate forest structure.
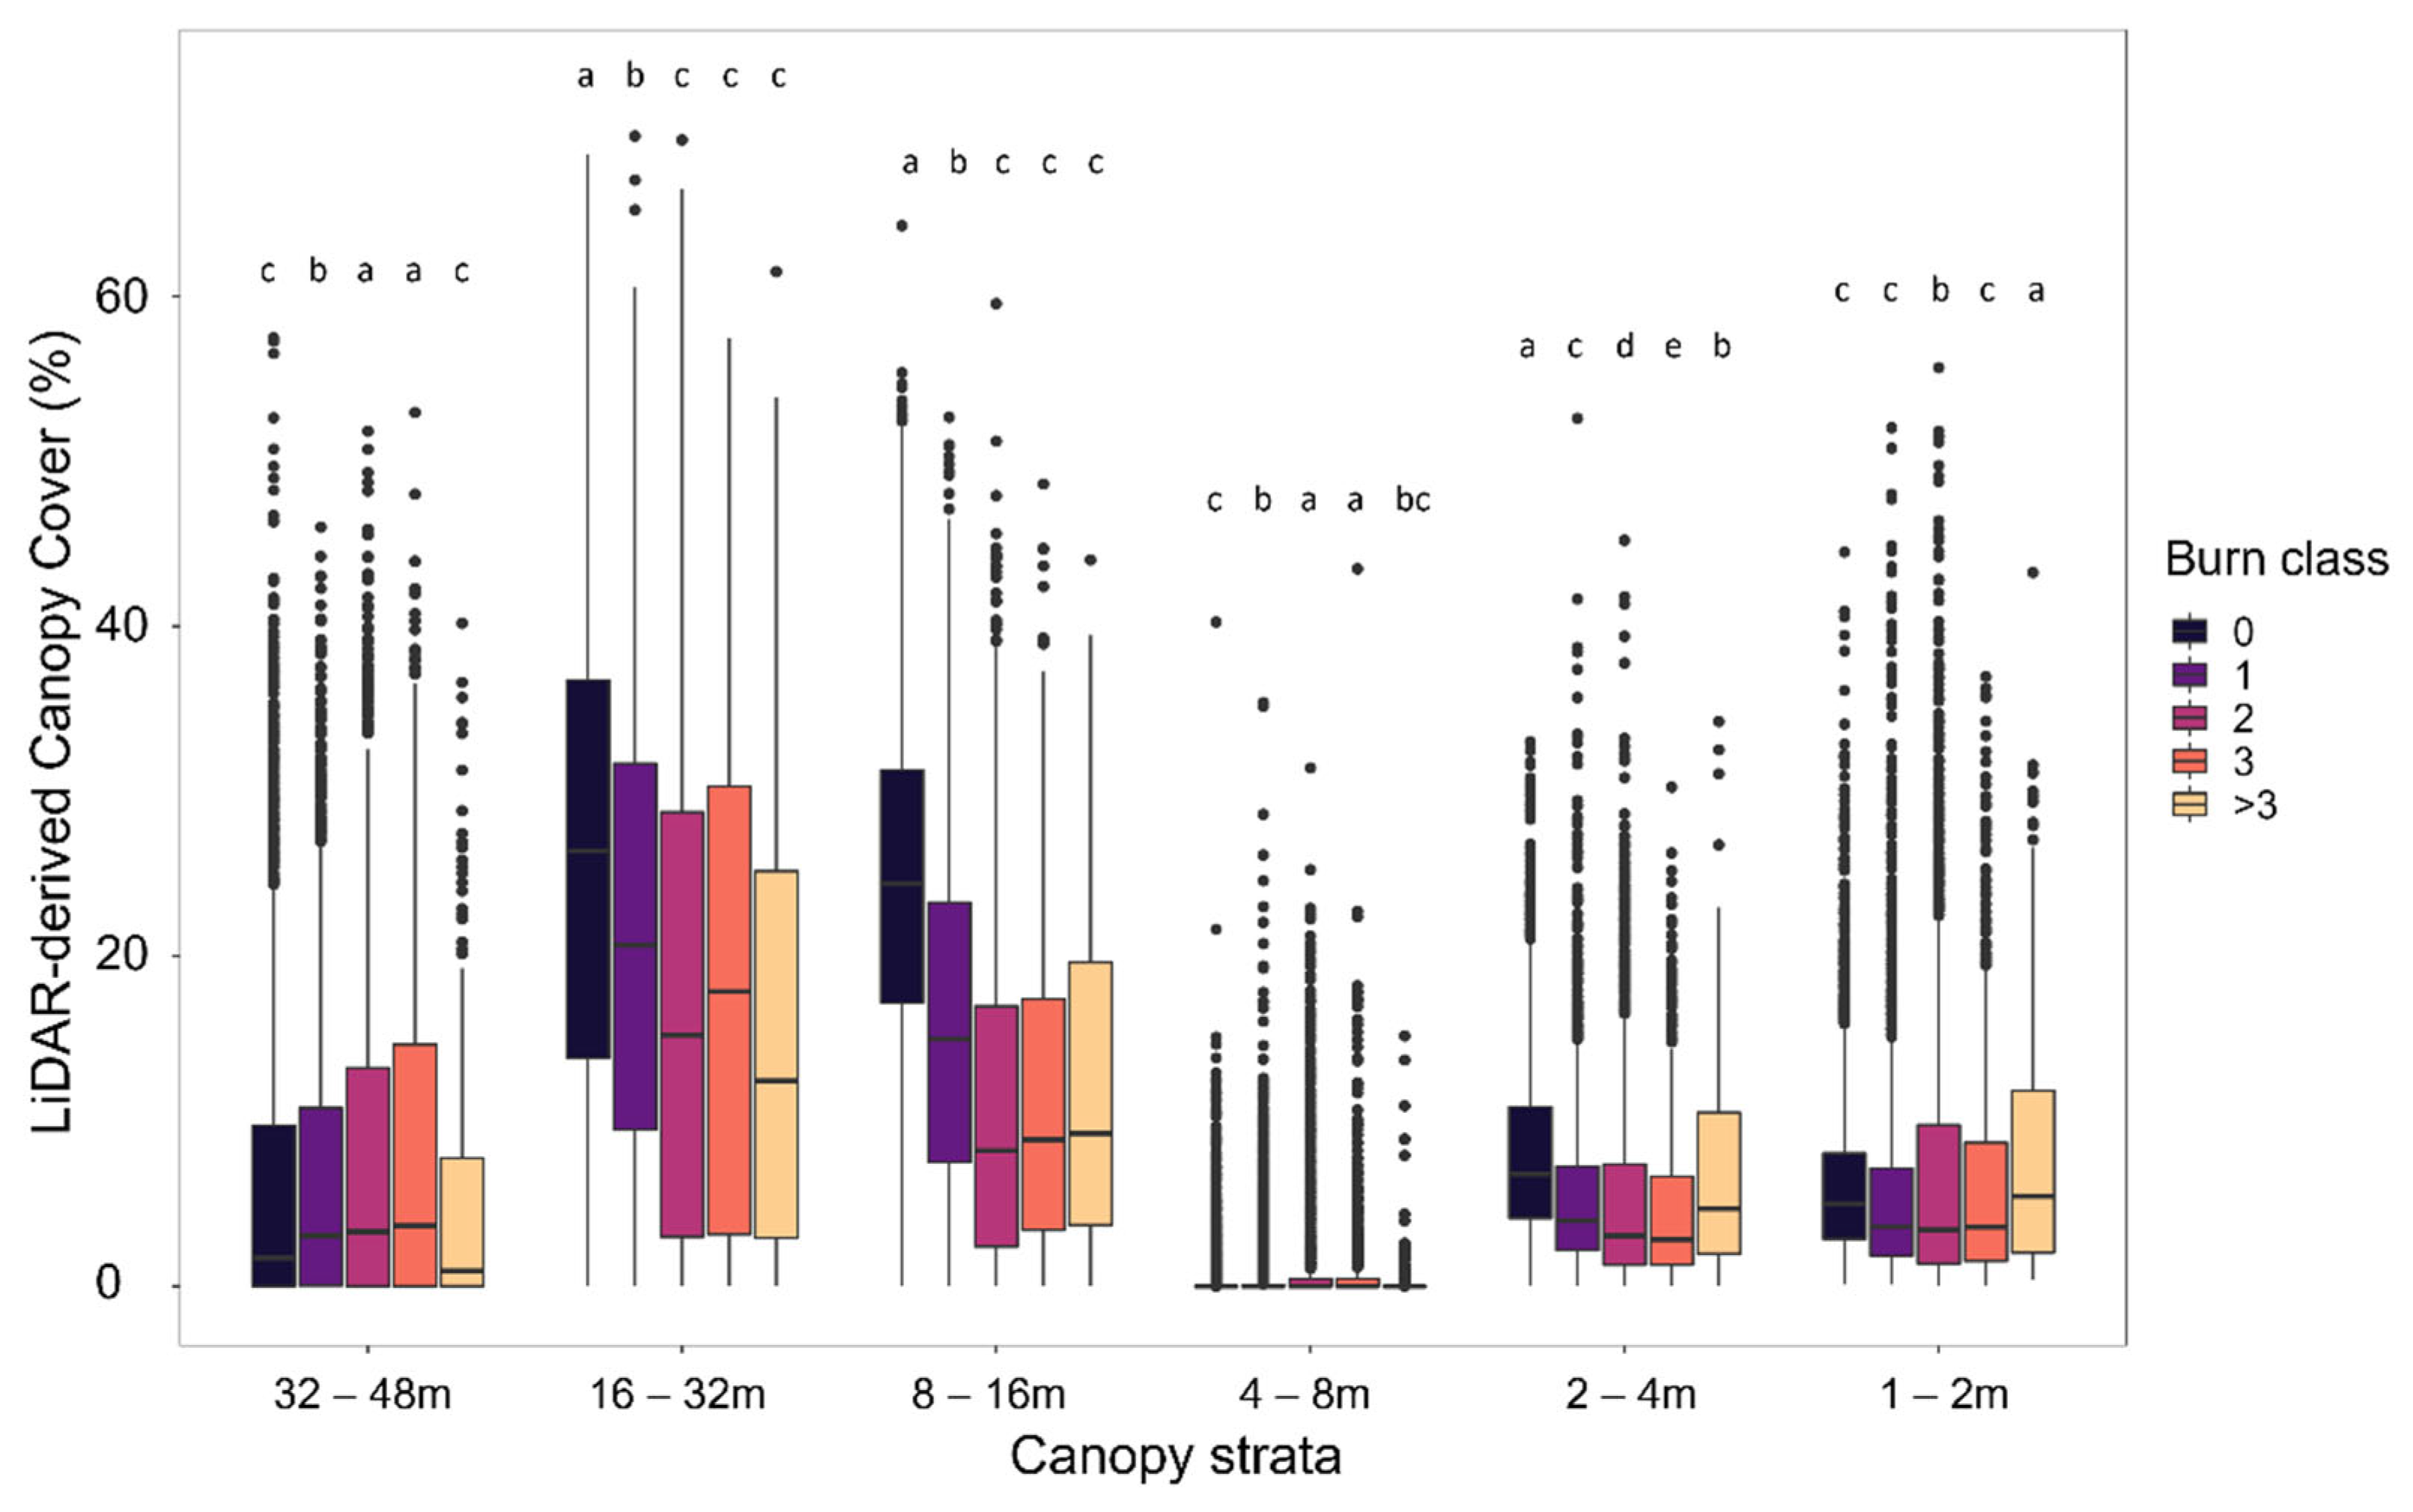
Single and repeated fires strongly influenced mid-canopy fuels, particularly in strata from 8 to 32 m (Table 3, Figure 3). The 8 to 16 m canopy stratum was particularly sensitive to the number of fires compared to other strata (F-value = 898). Canopy cover in the more sensitive strata was generally higher in sites that have not experienced fire in the last century. Notably, additional fires beyond a second burn did not drive further reductions in canopy cover according to any predictable pattern. The lowest and highest canopy strata were relatively constant across burn classes. All samples showed high variability in canopy cover for each canopy strata (Figure 3). Patterns were similar across all forest types considered (Figure S1), and interactions considering forest type were not statistically significant. The sensitivity of mid-canopy fuels to a second burn was also observed in the prescribed burn subsample, and subsequent burns did not drive additional changes in canopy cover (Figure S2).

3.2. Fire-Mediated Forest Conditions

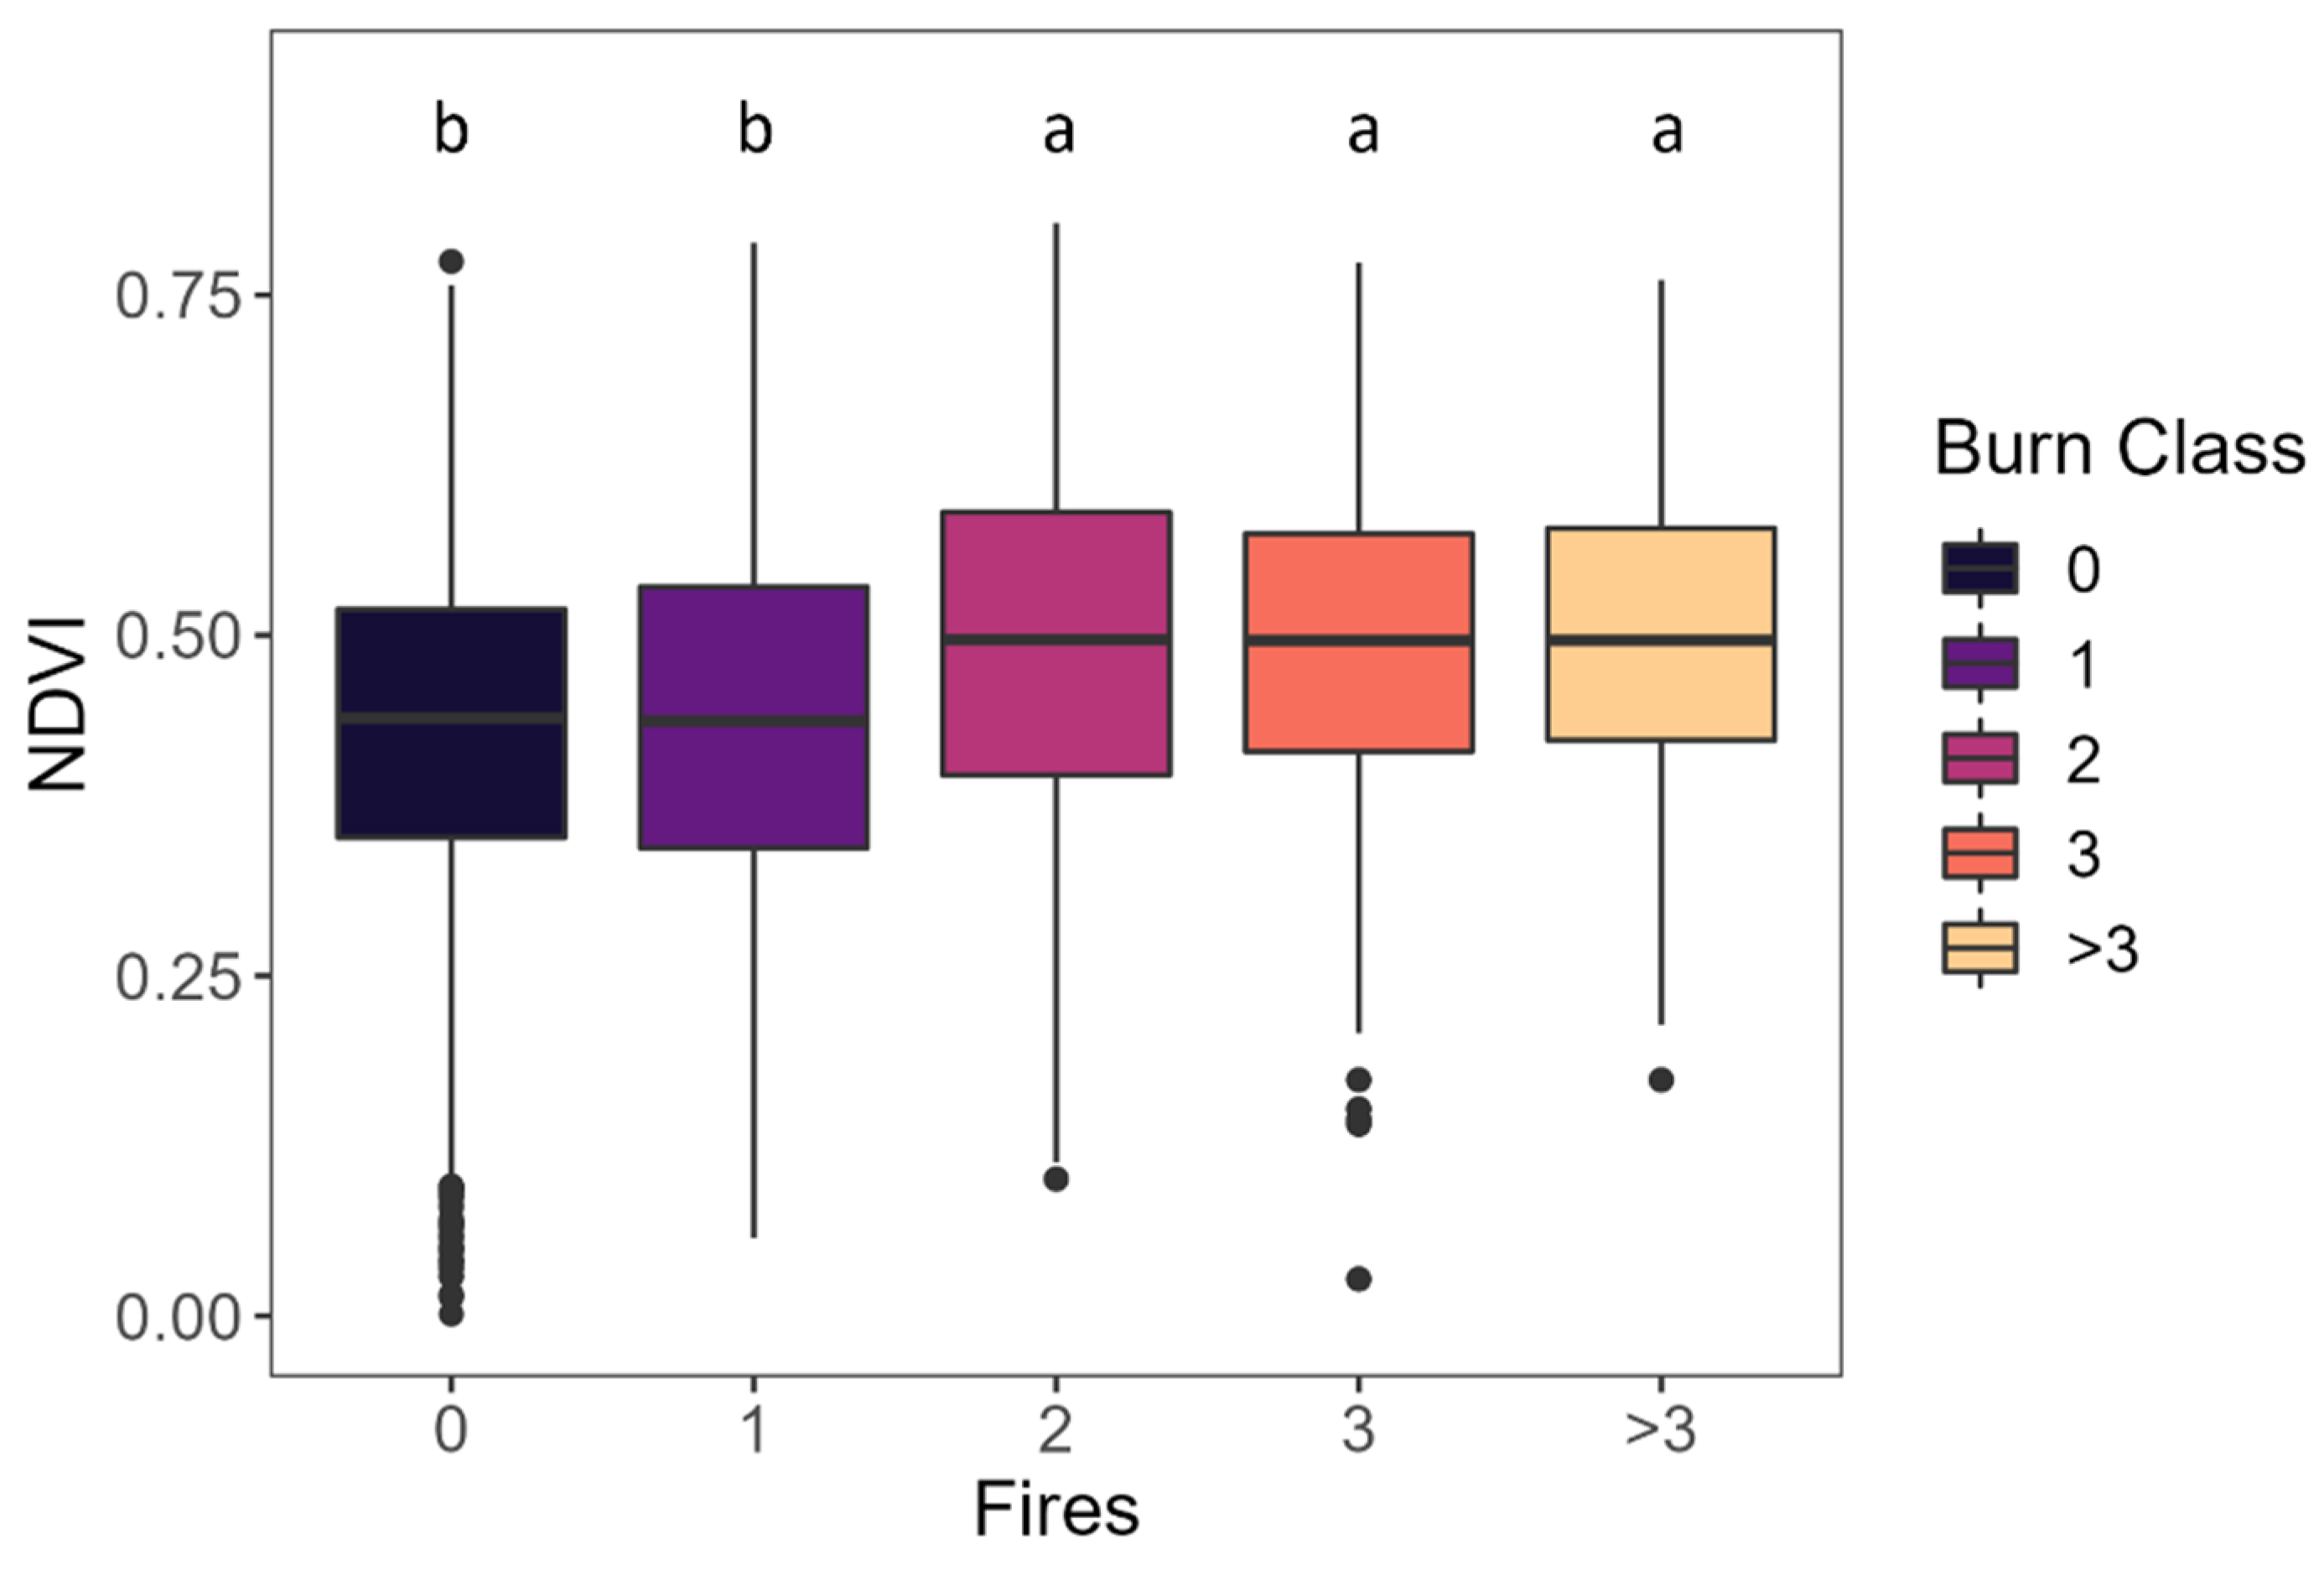
Fire history also drove variations in tree density; however, significant reductions in tree density depended on the occurrence of a second burn (p < 0.001, Figure 4). Additional fires did not significantly reduce tree density (Table 3, Figure 4). These patterns were also observed in the prescribed burn subsample (Figure S3). Similarly, fire history drove consistent trends in NDVI. NDVI values were similar between unburned and once-burned samples; however, NDVI significantly increased following a second burn (p < 0.001, Figure 5). This increase was maintained with subsequent burns, indicating that repeat burning enhances and maintains vegetation greenness.

4. Discussion

Our study provides a unique landscape-scale assessment of the effects of repeated fire on forest structure, pairing Parkwide high-density LiDAR, improved climatological models from Park long-term weather data, and extensive, accurate fire records to evaluate interactions among climate, fire, and topography across multiple spatial scales and forest types. We found that fire history introduced variation into forest structure beyond that expected of different forest types determined broadly by climate niche space. Repeated burning shifted forest structure towards conditions that are consistent with increased resilience, biodiversity, and ecosystem health and function. These structural changes are characteristic of forests experiencing frequent, low- to moderate-severity fire. Specifically, across all forest types, mid-canopy strata cover, such as small diameter trees and large shrubs (i.e., ladder fuels), was significantly reduced compared to overstory canopy and indices of forest health improved after two fires, but no additional change occurred with subsequent burns. Because our sampling network covered a broad spatial scale, including areas difficult to access within the Park, we were able to capture a wider range of forest conditions and fire histories not possible using ground-based field observations or previous LiDAR acquisitions, including areas where repeated fire has been managed in the landscape. Our study therefore provides robust support for many principles of disturbance ecology and forest management e.g., [20,59,60] at scales not previously possible in past studies, improving the Park’s capacity to manage fire and wildlife and promote forest health.
Our findings highlight how repeated fires can shape forests across a diverse landscape in ways that make them more resilient to subsequent burns. While high-severity fire has accounted for an increasing proportion of area burned within the Park [34], fires have typically been dominated by low to moderate fire severities that promote heterogenous and resilient forest conditions [5,24,26,27], even after a single fire event [65]. One such resilient watershed in YNP, the Illilouette Creek basin where fire has been managed for decades, is considered a reference area for an intact frequent fire regime resilient to large, high-severity wildfire [26,66]. While our study spanned the entire area of the Park, lower tree densities and reduced mid-strata vegetation cover associated with two burns since 1930 match forest conditions observed in this fire-restored watershed, suggesting that for much of the Park, repeat burning meets management objectives to promote natural ecosystem processes and reduce the risk of catastrophic fire (see YNP Fire Management Plan 2004). Furthermore, limited structural change beyond two fires supports widespread evidence of the ‘self-limiting’ nature of wildfires, where fire-driven declines in horizontal and vertical fuel continuity moderate fire behavior and reduce subsequent fire severity [5,6,67,68,69], which limits the associated structural change [20,22,40]. Surprisingly, these structural changes did not vary by forest type despite the expectations of varying fuel loads and fire severity among different species assemblages [26,35], as well as the evidence of individual post-fire structural trajectories [40]. Given the high variance in structural characteristics, forest type-specific responses to fire may be more likely to emerge at scales which consider fire severity patterns and are therefore subsumed at larger spatial scales [39].
Forest structural elements exhibited high variability across forest types and burn classes, highlighting the many processes that may shape forest structure (such as climate, insects, disease) as well as the fine-scale variability in fire behavior resulting in heterogenous fire effects [20,39,70]. Notably, our study did not consider variations in fire severity due to the lack of historical, spatially-explicit fire severity information; however, wildfires in Yosemite have, on average, burned at low severity with limited patches of high and moderate severity [26], even under drought conditions and when fires are burning concurrently to megafires (e.g., Creek Fire and Blue Jay Fire). While quantifying fine scale variability in fire behavior is important [40,71], our study captured the mosaic of forest structure resulting from this variability and is consistent with the historical legacies of fire elsewhere in western U.S. forests [26,38,58,59]. Using fire perimeters instead of within-fire variation in fire severity would also introduce variation into each burn class, given that not all forest area within fire perimeters burn during a fire event. Furthermore, patterns in structural changes were less predictable at high fire frequencies, which may indicate vegetation state transitions under fire and climate conditions exceeding post-fire resilience mechanisms. These frequent-fire sites were dominated by the mixed conifer forest type, which accounts for most of the wildland-urban interface in the Park and could potentially be more impacted by other management activities, invasive species, or human-caused ignitions.
The stratum-based perspective considered here has great utility for setting prescription targets and anticipating fire behavior to achieve desired management outcomes. Parkwide canopy strata information greatly improves the accuracy of landscape data being used in fire behavior models and risk assessments for fire management decision making. Given that the strongest responses to fire were in the mid-canopy stratum (8–16 m), our results support restoration actions that seek to remove smaller diameter trees to reduce fuel continuity from ground to canopy level. Furthermore, given the importance of ladder fuels for moderating fire activity, the availability of Parkwide mid-canopy fuel data highlights areas where management actions are most needed to mitigate high severity fire risk and promote diversity and connectivity of important wildlife habitat, objectives dually achieved through fuel reduction treatments [43,72,73]. Fuels are difficult and time-consuming to capture using field measurements; therefore, the use of Parkwide LiDAR in this study provides an unprecedented assessment of fuels across the Park’s dominant forest types [42]. Fuel treatments, either through mechanical means or wildland fire, typically aim to reduce tree density and ladder fuels to mitigate fire risk [29], and our study empirically demonstrates this effect after two fires.
Importantly, two entries were required to achieve these structural and density changes, but additional fire did not significantly impact canopy structure. The consistency of these patterns between our Parkwide sample and samples within prescribed burn units emphasizes the effectiveness of prescribed fire for creating resilient forest conditions, as well as matching those conditions created by natural low to moderate intensity fire regimes [74,75,76,77]. The need for two entries to achieve resilient forest structure is consistent with the ongoing implementation of fuels management within the Park, where overly dense forests with abundant dead and downed fuels require substantial fuels reduction prior to implementing prescribed burns to meet management objectives [30,78,79,80]. While we could not disentangle the effects of prescribed fire versus wildfire in samples that had experienced both, the resulting forest conditions are likely consistent with low to moderate fire effects due to prescribed fire moderating subsequent fire behavior [72,81]. These patterns provide useful targets for managers who seek to manage fire in a way that maintains or restores forest conditions that sustain low to moderate severity fire regimes. Furthermore, understanding the frequency and spatial extent of fires creating these desired conditions assists managers who must prioritize multiple treatment needs, balance the attribution of limited resources, and be able to anticipate the consequences of management actions on both short and long timescales. As the extent of prescribed fire increases in areas of the Park, additional work to isolate prescribed fire effects across a broader temperature–precipitation gradient will address additional knowledge gaps for sensitive species and long-term effects for the resilience and health of the Park’s highly valued forest communities.
Observed structural changes associated with two burns corresponded to improved forest health indices, providing additional support to the utility of fire use to achieve multiple management objectives [31,32,72,78]. Additional work is needed to assess and attribute the underlying mechanism for these observed changes in NDVI; however, NDVI is a well-established index of forest health [58] and suggests that subsequent fires promote increased vegetation greenness in some component of the canopy. Because we controlled for multiple factors within our ordination space, confounding factors, such as forest type, were minimized. An increase in NDVI can generally be attributed to improved plant vigor and could reflect known relationships between forest structure, light, and water availability, such as understory vegetation responses to reduced tree density and overstory canopy cover [79,80] or improved overstory canopy health associated with reductions in competition and potential increases in soil water [32]. Although a combination of factors is likely reasonable to assume, further field studies are needed to parse the changes observed in this study. Considering fire-forest feedbacks at a Parkwide scale necessarily loses resolution for understanding underlying mechanisms, but the fire-driven structural outcomes observed in this study are consistent with those known to sustain low- to moderate-severity fire regimes, reduce risk to catastrophic wildfire, and promote broader ecosystem health [31]. Given the value of large LiDAR acquisitions for monitoring forest resilience at the scale of a management unit, more frequent acquisitions surrounding large fire events and ongoing tree mortality will be an important component of landscape management in this era of rapid change.

5. Conclusions

This study provides insights into the lasting effects of nearly a century of fire history within the dominant forest types of the Yosemite National Park. We found that tree density and mid-canopy strata, in particular 8–16 m, were most impacted by multiple fires, supporting restoration actions that seek to remove smaller diameter trees. Importantly, two entries were required to achieve these structural and density changes, but additional fire did not significantly impact forest structure, suggesting that two fires may create forest conditions that restore self-sustaining ecosystem processes. These patterns were consistent for all forest types, which may indicate similar management strategies may be applied parkwide; however, individual forest type responses are known to emerge at finer spatial scales. This study supports past work around achieving fire resilience through restoring natural fire regimes but offers further insight into the drivers and specific strata effects by which these resilience gains are achieved. Finally, this work highlights the utility of large-landscape LiDAR acquisitions for supporting fire, forest, and wildlife management, specifically for prioritizing management needs and evaluating fire risks to numerous valued resources.

Supplementary Materials

The following supporting information can be downloaded at: https://www.mdpi.com/1999-4907/13/9/1512/s1, Figure S1: Percent canopy cover by strata, burn class, and forest type; Figure S2: Percent canopy cover by strata and burn class for prescribed burns only; Figure S3: Tree density by burn class for prescribed burns only; Table S1: LiDAR metrics.

Author Contributions

Conceptualization, C.T.A. and L.E.H.; methodology, C.T.A. and L.E.H.; formal analysis, C.T.A. and L.E.H.; writing, C.T.A. and L.E.H. All authors have read and agreed to the published version of the manuscript.

Funding

The 2019 Yosemite LiDAR acquisition was made possible with generous support from the Yosemite Conservancy (YC-63370) and United States Geological Survey (#G16PC00016).

Data Availability Statement

Data will be made publicly available through the National Park Service Data Store: https://irma.nps.gov/DataStore/ and LIDAR is available through the USGS 3DEP program at: LidarExplorer (prd-tnm.s3.amazonaws.com)

Acknowledgments

The authors would like to thank the University of Washington Forest Resilience Lab for processing LiDAR forest structure metrics and Colton Linville for processing the NDVI data product. We also express our gratitude to Kent van Wagtendonk for his instrumental work in facilitating the 2019 Parkwide airborne LiDAR acquisition and management of fire records.

Conflicts of Interest

The authors declare no conflict of interest.

References

  1. White, P.S. Pattern, Process, and Natural Disturbance in Vegetation. Bot. Rev. 1979, 45, 123. [Google Scholar] [CrossRef]
  2. Agee, J.K. The Landscape Ecology Western Forest Fire Regimes. Northwest Sci. 1998, 72, 24–34. [Google Scholar]
  3. Bond, W.J.; Keeley, J.E. Fire as a Global “Herbivore”: The Ecology and Evolution of Flammable Ecosystems. Trends Ecol. Evol. 2005, 20, 387–394. [Google Scholar] [CrossRef] [PubMed]
  4. Turner, M.G. Landscape Ecology: The Effect of Pattern on Process. Annu. Rev. Ecol. Syst. 1989, 20, 27. [Google Scholar] [CrossRef]
  5. Collins, B.M.; Miller, J.D.; Thode, A.E.; Kelly, M.; van Wagtendonk, J.W.; Stephens, S.L. Interactions Among Wildland Fires in a Long-Established Sierra Nevada Natural Fire Area. Ecosystems 2009, 12, 114–128. [Google Scholar] [CrossRef]
  6. Parks, S.A.; Holsinger, L.M.; Miller, C.; Nelson, C.R. Wildland Fire as a Self-Regulating Mechanism: The Role of Previous Burns and Weather in Limiting Fire Progression. Ecol. Appl. 2015, 25, 1478–1492. [Google Scholar] [CrossRef]
  7. Mistry, J.; Berardi, A.; Andrade, V.; Krahô, T.; Krahô, P.; Leonardos, O. Indigenous Fire Management in the Cerrado of Brazil: The Case of the Krahô of Tocantíns. Hum. Ecol. 2005, 33, 365–386. [Google Scholar] [CrossRef]
  8. Anderson, M.K. The Use of Fire by Native Americans in California. In Fire in California’s Ecosystems; Sugihara, N., Ed.; University of California Press: Berkeley, CA, USA, 2006; pp. 417–430. ISBN 978-0-520-24605-8. [Google Scholar]
  9. Lake, F.K.; Christianson, A. Indigenous Fire Stewardship. In Encyclopedia of Wildfire and Wildland-Urban Interface Fires; Springer Nature: Cham, Switzerland, 2019. [Google Scholar]
  10. Hoffman, K.M.; Davis, E.L.; Wickham, S.B.; Schang, K.; Johnson, A.; Larking, T.; Lauriault, P.N.; Quynh Le, N.; Swerdfager, E.; Trant, A.J. Conservation of Earth’s Biodiversity Is Embedded in Indigenous Fire Stewardship. Proc. Natl. Acad. Sci. USA 2021, 118, e2105073118. [Google Scholar] [CrossRef]
  11. Donovan, G.H.; Brown, T.C. Be Careful What You Wish for: The Legacy of Smokey Bear. Front. Ecol. Environ. 2007, 5, 73–79. [Google Scholar] [CrossRef]
  12. Abatzoglou, J.T.; Williams, A.P. Impact of Anthropogenic Climate Change on Wildfire across Western US Forests. Proc. Natl. Acad. Sci. USA 2016, 113, 11770–11775. [Google Scholar] [CrossRef]
  13. Doerr, S.H.; Santín, C. Global Trends in Wildfire and Its Impacts: Perceptions versus Realities in a Changing World. Philos. Trans. R. Soc. Lond. B Biol. Sci. 2016, 371, 20150345. [Google Scholar] [CrossRef] [PubMed]
  14. Stevens-Rumann, C.S.; Kemp, K.B.; Higuera, P.E.; Harvey, B.J.; Rother, M.T.; Donato, D.C.; Morgan, P.; Veblen, T.T. Evidence for Declining Forest Resilience to Wildfires under Climate Change. Ecol. Lett. 2017, 21, 243–252. [Google Scholar] [CrossRef] [PubMed]
  15. Hagmann, R.K.; Hessburg, P.F.; Salter, R.B.; Merschel, A.G.; Reilly, M.J. Contemporary Wildfires Further Degrade Resistance and Resilience of Fire-Excluded Forests. For. Ecol. Manag. 2022, 506, 119975. [Google Scholar] [CrossRef]
  16. North, M.P.; Stephens, S.L.; Collins, B.M.; Agee, J.K.; Aplet, G.; Franklin, J.F.; Fulé, P.Z. Reform Forest Fire Management. Science 2015, 349, 1280–1281. [Google Scholar] [CrossRef]
  17. Collins, B.M.; Fry, D.L.; Lydersen, J.M.; Everett, R.; Stephens, S.L. Impacts of Different Land Management Histories on Forest Change. Ecol. Appl. 2017, 27, 2475–2486. [Google Scholar] [CrossRef]
  18. Van Wagtendonk, J.W. The History and Evolution of Wildland Fire Use. Fire Ecol. 2007, 3, 3–17. [Google Scholar] [CrossRef]
  19. Taylor, A.H.; Skinner, C.N. Spatial patterns and controls on historical fire regimes and forest structure in the Klamath Mountains. Ecol. Appl. 2003, 13, 704–719. [Google Scholar] [CrossRef]
  20. Kane, V.R.; North, M.P.; Lutz, J.A.; Churchill, D.J.; Roberts, S.L.; Smith, D.F.; McGaughey, R.J.; Kane, J.T.; Brooks, M.L. Assessing Fire Effects on Forest Spatial Structure Using a Fusion of Landsat and Airborne LiDAR Data in Yosemite National Park. Remote Sens. Environ. 2014, 151, 89–101. [Google Scholar] [CrossRef]
  21. Dolanc, C.R.; Safford, H.D.; Thorne, J.H.; Dobrowski, S.Z. Changing Forest Structure across the Landscape of the Sierra Nevada, CA, USA, since the 1930s. Ecosphere 2014, 5, art101. [Google Scholar] [CrossRef]
  22. Collins, B.M.; Everett, R.G.; Stephens, S.L. Impacts of Fire Exclusion and Recent Managed Fire on Forest Structure in Old Growth Sierra Nevada Mixed-Conifer Forests. Ecosphere 2011, 2, art51. [Google Scholar] [CrossRef]
  23. Lutz, J.A.; van Wagtendonk, J.W.; Franklin, J.F. Twentieth-Century Decline of Large-Diameter Trees in Yosemite National Park, California, USA. For. Ecol. Manag. 2009, 257, 2296–2307. [Google Scholar] [CrossRef]
  24. Stephens, S.L.; Lydersen, J.M.; Collins, B.M.; Fry, D.L.; Meyer, M.D. Historical and Current Landscape-Scale Ponderosa Pine and Mixed Conifer Forest Structure in the Southern Sierra Nevada. Ecosphere 2015, 6, art79. [Google Scholar] [CrossRef]
  25. Miller, C.; Urban, D.L. Forest Pattern, Fire, and Climatic Change in the Sierra Nevada. Ecosystems 1999, 2, 76–87. [Google Scholar] [CrossRef]
  26. Collins, B.M.; Kelly, M.; van Wagtendonk, J.W.; Stephens, S.L. Spatial Patterns of Large Natural Fires in Sierra Nevada Wilderness Areas. Landsc. Ecol 2007, 22, 545–557. [Google Scholar] [CrossRef]
  27. Scholl, A.E.; Taylor, A.H. Fire Regimes, Forest Change, and Self-Organization in an Old-Growth Mixed-Conifer Forest, Yosemite National Park, USA. Ecol. Appl. 2010, 20, 362–380. [Google Scholar] [CrossRef]
  28. Agee, J.K.; Skinner, C.N. Basic Principles of Forest Fuel Reduction Treatments. For. Ecol. Manag. 2005, 211, 83–96. [Google Scholar] [CrossRef]
  29. Stephens, S.L.; Moghaddas, J.J.; Edminster, C.; Fiedler, C.E.; Haase, S.; Harrington, M.; Keeley, J.E.; Knapp, E.E.; McIver, J.D.; Metlen, K.; et al. Fire Treatment Effects on Vegetation Structure, Fuels, and Potential Fire Severity in Western U.S. Forests. Ecol. Appl. 2009, 19, 305–320. [Google Scholar] [CrossRef]
  30. Allen, C.D.; Savage, M.; Falk, D.A.; Suckling, K.F.; Swetnam, T.W.; Schulke, T.; Stacey, P.B.; Morgan, P.; Hoffman, M.; Klingel, J.T. Ecological Restoration of Southwestern Ponderosa Pine Ecosystems: A Broad Perspective. Ecol. Appl. 2002, 12, 1418–1433. [Google Scholar] [CrossRef]
  31. Stephens, S.L.; Thompson, S.; Boisramé, G.; Collins, B.M.; Ponisio, L.C.; Rakhmatulina, E.; Steel, Z.L.; Stevens, J.T.; van Wagtendonk, J.W.; Wilkin, K. Fire, Water, and Biodiversity in the Sierra Nevada: A Possible Triple Win. Environ. Res. Commun. 2021, 3, 081004. [Google Scholar] [CrossRef]
  32. Boisramé, G.; Thompson, S.; Collins, B.; Stephens, S. Managed Wildfire Effects on Forest Resilience and Water in the Sierra Nevada. Ecosystems 2017, 20, 717–732. [Google Scholar] [CrossRef]
  33. Goeking, S.A.; Tarboton, D.G. Forests and Water Yield: A Synthesis of Disturbance Effects on Streamflow and Snowpack in Western Coniferous Forests. J. For. 2020, 118, 172–192. [Google Scholar] [CrossRef]
  34. Skinner, C.N.; Chang, C.; Et-man, D.C.; Husari, S.J.; Parsons, D.J.; van Wagtendonk, J.W.; Weatherspoon, C.P. An Overview of Fire in the Sierra Nevada. In Sierra Nevada Ecosystem Project, Final Report to Congress, Vol. II, Assessments and Scientific Basis for Management Options; University of California, Centers for Water and Wildland Resources: Davis, CA, USA, 1996. [Google Scholar]
  35. Van Wagtendonk, J. Fuel Bed Characteristics of Sierra Nevada Conifers. West. J. Appl. Forestry. 1998, 13, 73–84. [Google Scholar] [CrossRef]
  36. Stephens, S.L. Fire History Differences in Adjacent Jeffrey Pine and Upper Montane Forests in the Eastern Sierra Nevada. Int. J. Wildland Fire 2001, 10, 161. [Google Scholar] [CrossRef]
  37. Reutebuch, S.E.; Andersen, H.-E.; McGaughey, R.J. Light Detection and Ranging (LIDAR): An Emerging Tool for Multiple Resource Inventory. J. For. 2005, 103, 286–292. [Google Scholar]
  38. Hudak, A.T.; Evans, J.S.; Stuart Smith, A.M. LiDAR Utility for Natural Resource Managers. Remote Sens. 2009, 1, 934–951. [Google Scholar] [CrossRef]
  39. Kane, V.R.; Gersonde, R.F.; Lutz, J.A.; McGaughey, R.J.; Bakker, J.D.; Franklin, J.F. Patch Dynamics and the Development of Structural and Spatial Heterogeneity in Pacific Northwest Forests. Can. J. For. Res. 2011, 41, 2276–2291. [Google Scholar] [CrossRef]
  40. Kane, V.R.; Lutz, J.A.; Roberts, S.L.; Smith, D.F.; McGaughey, R.J.; Povak, N.A.; Brooks, M.L. Landscape-Scale Effects of Fire Severity on Mixed-Conifer and Red Fir Forest Structure in Yosemite National Park. For. Ecol. Manag. 2013, 287, 17–31. [Google Scholar] [CrossRef]
  41. Cansler, C.A.; Kane, V.R.; Bartl-Geller, B.N.; Churchill, D.J.; Hessburg, P.F.; Povak, N.A.; Lutz, J.A.; Kane, J.; Larson, A.J. Postfire Treatments Alter Forest Canopy Structure up to Three Decades after Fire. For. Ecol. Manag. 2022, 505, 119872. [Google Scholar] [CrossRef]
  42. Olszewski, J.H.; Bailey, J.D. LiDAR as a Tool for Assessing Change in Vertical Fuel Continuity Following Restoration. Forests 2022, 13, 503. [Google Scholar] [CrossRef]
  43. Kramer, H.; Collins, B.; Kelly, M.; Stephens, S. Quantifying Ladder Fuels: A New Approach Using LiDAR. Forests 2014, 5, 1432–1453. [Google Scholar] [CrossRef]
  44. Kemp, K.B.; Higuera, P.E.; Morgan, P. Fire Legacies Impact Conifer Regeneration across Environmental Gradients in the U.S. Northern Rockies. Landsc. Ecol. 2016, 31, 619–636. [Google Scholar] [CrossRef]
  45. Wolf, K.D.; Higuera, P.E.; Davis, K.T.; Dobrowski, S.Z. Wildfire Impacts on Forest Microclimate Vary with Biophysical Context. Ecosphere 2021, 12, e03467. [Google Scholar] [CrossRef]
  46. Beedy, E.C. Bird Communities and Forest Structure in the Sierra Nevada of California. The Condor 1981, 83, 97–105. [Google Scholar] [CrossRef]
  47. Sollmann, R.; White, A.M.; Gardner, B.; Manley, P.N. Investigating the Effects of Forest Structure on the Small Mammal Community in Frequent-Fire Coniferous Forests Using Capture-Recapture Models for Stratified Populations. Mamm. Biol. 2015, 80, 247–254. [Google Scholar] [CrossRef]
  48. Blomdahl, E.M.; Thompson, C.M.; Kane, J.R.; Kane, V.R.; Churchill, D.; Moskal, L.M.; Lutz, J.A. Forest Structure Predictive of Fisher (Pekania Pennanti) Dens Exists in Recently Burned Forest in Yosemite, California, USA. For. Ecol. Manag. 2019, 444, 174–186. [Google Scholar] [CrossRef]
  49. van Wagtendonk, J.W.; van Wagtendonk, K.A.; Meyer, J.B.; Paintner, K.J. The Use of Geographic Information for Fire Management Planning in Yosemite National Park. Georg. Wright FORUM 2002, 19, 22. [Google Scholar]
  50. Pyne, S.J. Pyrocene Park. Aeon. Available online: https://aeon.co/essays/what-yosemites-fire-history-says-about-life-in-the-pyrocene (accessed on 24 March 2022).
  51. Kane, V.R. Patterns of Forest Structural Complexity Studied with Airborne LiDAR Data. Ph.D. Thesis, University of Washington, Seattle, WA, USA, 2010. [Google Scholar]
  52. Chamberlain, C.P.; Kane, V.R.; Case, M.J. Accelerating the development of structural complexity: Lidar analysis supports restoration as a tool in coastal Pacific Northwest forests. For. Ecol. Manag. 2021, 500, 119641. [Google Scholar] [CrossRef]
  53. McGaughey, R.J. FUSION/LDV LIDAR Analysis and Visualization Software. Pacific Northwest Research Station, USDA Forest Service, Portland, OR, USA. 2020. Available online: http://forsys.sefs.uw.edu/fusion/fusion_overview.html (accessed on 1 December 2020).
  54. Jeronimo, S.M.A.; Kane, V.R.; Churchill, D.J.; McGaughey, R.J.; Franklin, J.F. Applying LiDAR Individual Tree Detection to Management of Structurally Diverse Forest Landscapes. J. For. 2018, 116, 336–346. [Google Scholar] [CrossRef]
  55. PRISM Climate Group PRISM Gridded Climate Data 2022. Available online: https://www.prism.oregonstate.edu/ (accessed on 1 January 2022).
  56. Yosemite National Park NPS Geospatial Data, El Portal, CA, USA. 2021. Available online: https://irma.nps.gov/DataStore/ (accessed on 1 March 2022).
  57. Pettorelli, N.; Vik, J.O.; Mysterud, A.; Gaillard, J.-M.; Tucker, C.J.; Chr Stenseth, N. Using the Satellite-Derived NDVI to Assess Ecological Responses to Environmental Change. Trends Ecol. Evol. 2005, 20, 503–510. [Google Scholar] [CrossRef]
  58. Meneses-Tovar, C.L. NDVI as Indicator of Degradation. Unasylva 2011, 62, 39–46. [Google Scholar]
  59. ArcGIS Pro v2.9.1; ESRI: Redlands, CA, USA, 2021.
  60. Earth Resources Observation and Science (EROS) Center, National Land Cover Database. 2018. Available online: https://www.usgs.gov/centers/eros/science/national-land-cover-database (accessed on 1 March 2022).
  61. Dewitz, J. National Land Cover Database 2019; United States Geological Survey: Reston, VA, USA. [CrossRef]
  62. Oksanen, J.; Blanchet, F.G.; Friendly, M.; Kindt, R.; Legendre, P.; McGlinn, D.; Minchin, P.R.; O’Hara, R.B.; Simpson, G.L.; Solymos, P.; et al. Community Ecology Package “Vegan”. 2022. Available online: https://github.com/vegandevs/vegan (accessed on 1 March 2022).
  63. Anderson, M.J. Permutational Multivariate Analysis of Variance ( PERMANOVA ). In Wiley StatsRef: Statistics Reference Online; Balakrishnan, N., Colton, T., Everitt, B., Piegorsch, W., Ruggeri, F., Teugels, J.L., Eds.; John Wiley & Sons, Inc.: Hoboken, NJ, USA, 2017; pp. 1–15. ISBN 978-1-118-44511-2. [Google Scholar]
  64. Lüdecke, D.; Ben-Shachar, M.S.; Patil, I.; Waggoner, P.; Makowski, D. Performance: An R Package for Assessment, Comparison and Testing of Statistical Models. J. Open Source Softw. 2021, 6, 3139. [Google Scholar] [CrossRef]
  65. Kane, V.R.; Bartl-Geller, B.N.; North, M.P.; Kane, J.T.; Lydersen, J.M.; Jeronimo, S.M.A.; Collins, B.M.; Monika Moskal, L. First-Entry Wildfires Can Create Opening and Tree Clump Patterns Characteristic of Resilient Forests. For. Ecol. Manag. 2019, 454, 117659. [Google Scholar] [CrossRef]
  66. Boisramé, G.F.S.; Thompson, S.E.; Kelly, M.; Cavalli, J.; Wilkin, K.M.; Stephens, S.L. Vegetation Change during 40 Years of Repeated Managed Wildfires in the Sierra Nevada, California. For. Ecol. Manag. 2017, 402, 241–252. [Google Scholar] [CrossRef]
  67. Collins, B.M.; Lydersen, J.M.; Everett, R.G.; Stephens, S.L. How Does Forest Recovery Following Moderate-Severity Fire Influence Effects of Subsequent Wildfire in Mixed-Conifer Forests? Fire Ecol 2018, 14, 3. [Google Scholar] [CrossRef]
  68. Parks, S.A.; Miller, C.; Nelson, C.R.; Holden, Z.A. Previous Fires Moderate Burn Severity of Subsequent Wildland Fires in Two Large Western US Wilderness Areas. Ecosystems 2014, 17, 29–42. [Google Scholar] [CrossRef]
  69. Cansler, C.A.; Kane, V.R.; Hessburg, P.F.; Kane, J.T.; Jeronimo, S.M.A.; Lutz, J.A.; Povak, N.A.; Churchill, D.J.; Larson, A.J. Previous Wildfires and Management Treatments Moderate Subsequent Fire Severity. For. Ecol. Manag. 2022, 504, 119764. [Google Scholar] [CrossRef]
  70. Odion, D.C.; Hanson, C.T.; Arsenault, A.; Baker, W.L.; DellaSala, D.A.; Hutto, R.L.; Klenner, W.; Moritz, M.A.; Sherriff, R.L.; Veblen, T.T.; et al. Examining Historical and Current Mixed-Severity Fire Regimes in Ponderosa Pine and Mixed-Conifer Forests of Western North America. PLoS ONE 2014, 9, e87852. [Google Scholar] [CrossRef] [PubMed]
  71. Airey-Lauvaux, C.; Pierce, A.D.; Skinner, C.N.; Taylor, A.H. Changes in Fire Behavior Caused by Fire Exclusion and Fuel Build-up Vary with Topography in California Montane Forests, USA. J. Environ. Manag. 2022, 304, 114255. [Google Scholar] [CrossRef] [PubMed]
  72. Jones, G.M.; Keyser, A.R.; Westerling, A.L.; Baldwin, W.J.; Keane, J.J.; Sawyer, S.C.; Clare, J.D.; Gutiérrez, R.; Peery, M.Z. Forest Restoration Limits Megafires and Supports Species Conservation under Climate Change. Front. Ecol Env. 2022, 20, 210–216. [Google Scholar] [CrossRef]
  73. Stephens, S.L.; Bigelow, S.W.; Burnett, R.D.; Collins, B.M.; Gallagher, C.V.; Keane, J.; Kelt, D.A.; North, M.P.; Roberts, L.J.; Stine, P.A.; et al. California Spotted Owl, Songbird, and Small Mammal Responses to Landscape Fuel Treatments. BioScience 2014, 64, 893–906. [Google Scholar] [CrossRef]
  74. Knapp, E.E.; Lydersen, J.M.; North, M.P.; Collins, B.M. Efficacy of Variable Density Thinning and Prescribed Fire for Restoring Forest Heterogeneity to Mixed-Conifer Forest in the Central Sierra Nevada, CA. For. Ecol. Manag. 2017, 406, 228–241. [Google Scholar] [CrossRef]
  75. van Mantgem, P.J.; Stephenson, N.L.; Knapp, E.; Battles, J.; Keeley, J.E. Long-Term Effects of Prescribed Fire on Mixed Conifer Forest Structure in the Sierra Nevada, California. For. Ecol. Manag. 2011, 261, 989–994. [Google Scholar] [CrossRef]
  76. Hood, S.M.; Baker, S.; Sala, A. Fortifying the Forest: Thinning and Burning Increase Resistance to a Bark Beetle Outbreak and Promote Forest Resilience. Ecol Appl 2016, 26, 1984–2000. [Google Scholar] [CrossRef] [PubMed]
  77. Fulé, P.Z.; Crouse, J.E.; Roccaforte, J.P.; Kalies, E.L. Do Thinning and/or Burning Treatments in Western USA Ponderosa or Jeffrey Pine-Dominated Forests Help Restore Natural Fire Behavior? For. Ecol. Manag. 2012, 269, 68–81. [Google Scholar] [CrossRef]
  78. Stevens, J.T.; Boisramé, G.F.S.; Rakhmatulina, E.; Thompson, S.E.; Collins, B.M.; Stephens, S.L. Forest Vegetation Change and Its Impacts on Soil Water Following 47 Years of Managed Wildfire. Ecosystems 2020, 23, 1547–1565. [Google Scholar] [CrossRef]
  79. Wilkin, K.; Ponisio, L.; Fry, D.L.; Collins, B.M.; Moody, T.; Stephens, S.L. Drivers of Understory Plant Communities in Sierra Nevada Mixed Conifer Forests with Pyrodiversity. Fire Ecol 2021, 17, 30. [Google Scholar] [CrossRef]
  80. Collins, B.M.; Moghaddas, J.J.; Stephens, S.L. Initial Changes in Forest Structure and Understory Plant Communities Following Fuel Reduction Activities in a Sierra Nevada Mixed Conifer Forest. For. Ecol. Manag. 2007, 239, 102–111. [Google Scholar] [CrossRef]
  81. Stephens, S.L.; Moghaddas, J.J. Experimental Fuel Treatment Impacts on Forest Structure, Potential Fire Behavior, and Predicted Tree Mortality in a California Mixed Conifer Forest. For. Ecol. Manag. 2005, 215, 21–36. [Google Scholar] [CrossRef]
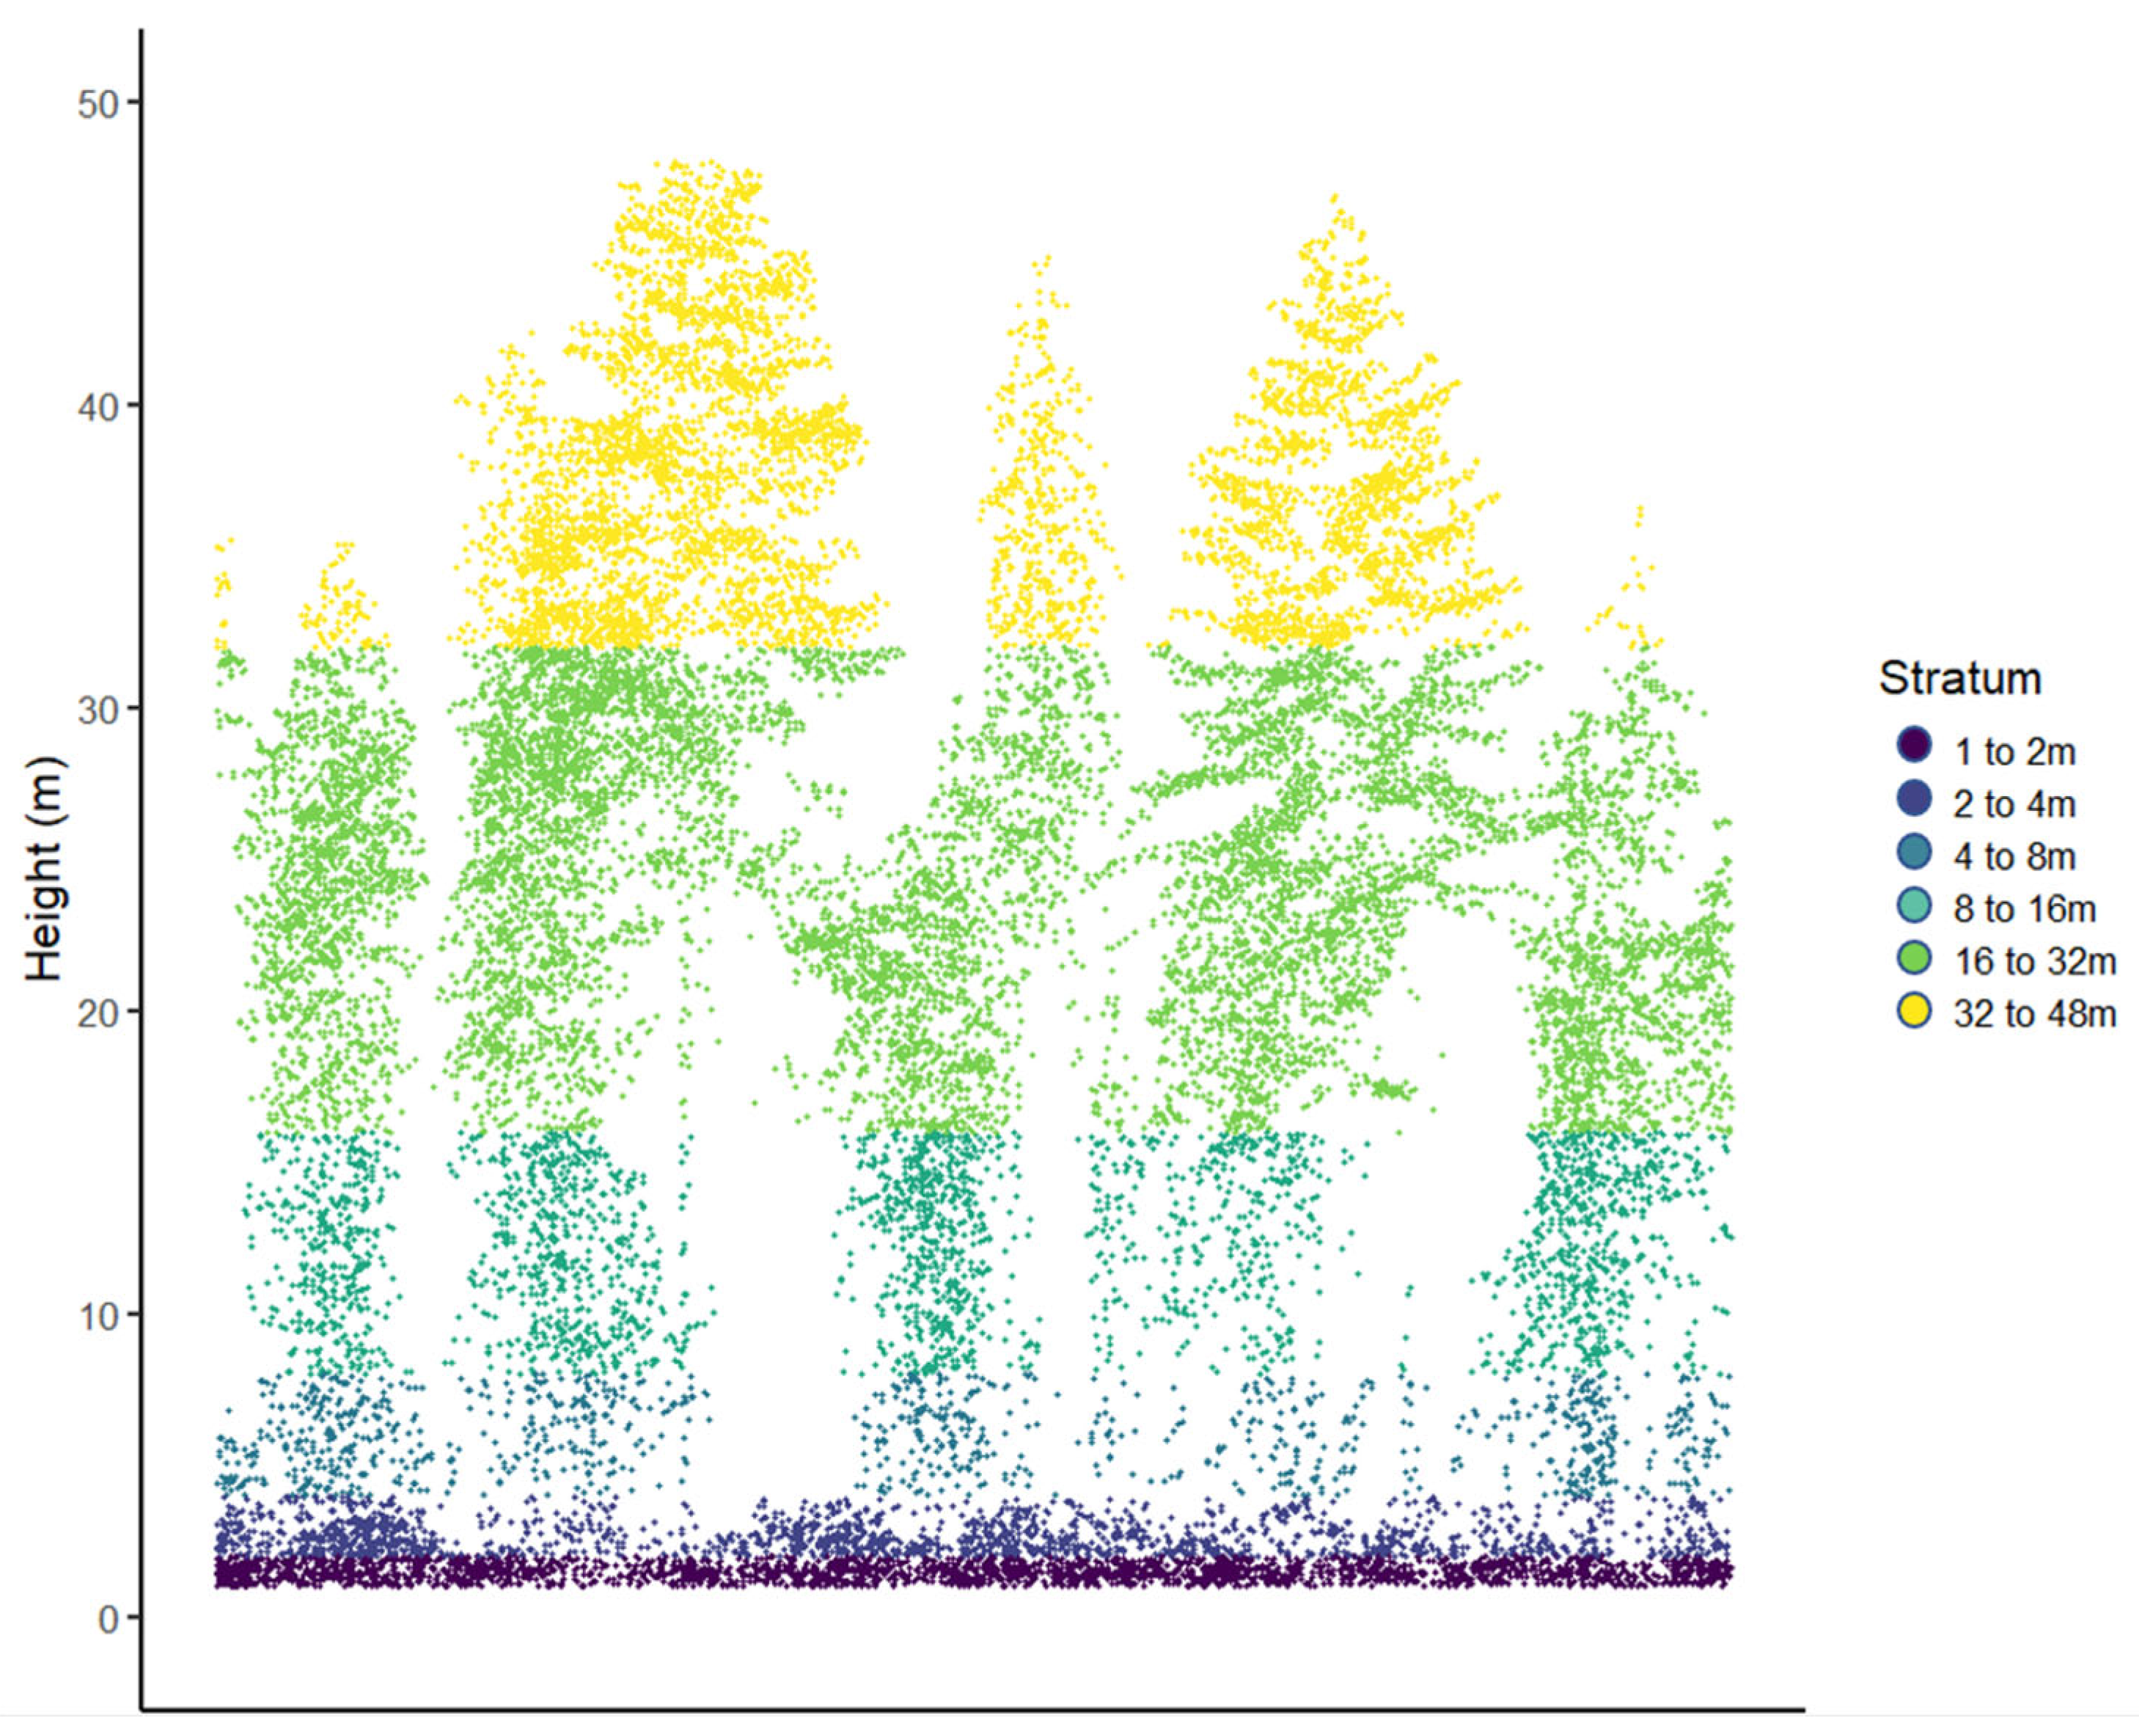
Figure 1. Example LiDAR point cloud with height strata, shown in different colors, used in the analysis.
Forests 13 01512 g001
Figure 2. Non-metric dimensional scaling analysis of LiDAR-derived forest structure metrics. Arrows show the strength and direction of the relationship between multidimensional forest structure and mean annual temperature (MAT), mean annual precipitation (MAP), the number of fires (# Burns), fire return interval departure (FRID), and topographic context (Topography). Ellipses correspond to forest type, and their location is based on samples in ordination space.
Forests 13 01512 g002
Figure 3. Percent cover of each LiDAR-derived canopy strata in samples differing in burn class. Letters are ordered alphabetically according to the magnitude of the mean value in each group (‘a’ corresponds to the group with the largest mean value) and different letters represent statistically significant differences in means according to one-way analysis of variance.
Forests 13 01512 g003
Figure 4. LiDAR-derived tree density (TAOs/ha) in samples differing in burn class. TAOs capture both live and dead tree stems. Letters are ordered alphabetically according to the magnitude of the mean value in each group (‘a’ corresponds to the group with the largest mean value) and different letters represent statistically significant differences in means according to one-way analysis of variance.
Forests 13 01512 g004
Figure 5. Normalized difference vegetation index (NDVI) values across differing burn classes. Higher NDVI values indicate more vegetation ‘greenness’. Letters are ordered alphabetically according to the magnitude of the mean value in each group (‘a’ corresponds to the group with the largest mean value) and different letters represent statistically significant differences in means according to one-way analysis of variance.
Forests 13 01512 g005
Table 1. Sample size within each forest type and burn class.
Forest TypeBurn Class
0123>3Total
Jeffrey Pine300417494192641467
Mixed Conifer12612280285610882867771
Red Fir14661740902238584404
Lodgepole Pine8442891022041259
Total387147264354153841214,901
Table 2. Mean (standard deviation) elevation, forest density, number (#) of fires, mean annual temperature (MAT), and mean annual precipitation (MAP) across the dominant forest types in Yosemite NP.
Forest TypeElevation (m)Tree Density (TAO/ha)# Fires (Since 1930)MAT (°C)MAP (mm)
Jeffrey pine2076 (413)124 (46)1.6 (1.7)8.0 (2.3)1173 (104)
Mixed conifer1774 (234)138 (44)1.1 (1.4)10.0 (1.2)1106 (73)
Red fir2284 (183)124 (44)1.3 (1.5)7.3 (1.2)1183 (92)
Lodgepole pine2583 (238)131 (51)2.0 (1.5)5.2 (1.6)1303 (142)
Table 3. Mean (standard deviation) canopy cover by height strata, tree density, and normalized difference vegetation index (NDVI) from samples differing in burn class. One-way analysis of variance results testing differences in means for each response variable according to burn class (df = 4). Pairwise differences were assessed with Tukey HSD tests and are shown in Figure 2, Figure 3 and Figure 4.
ResponseBurn ClassMean (sd)Sum SqMean SqF-Valuep-Value
Canopy cover 1–2 m06.3 (5.1)4303107721<0.001
16 (6.9)
27.1 (8.7)
36.4 (7)
>38.3 (8.4)
Canopy cover 2–4 m08.1 (5.4)207615188170<0.001
15.6 (5.3)
25.3 (5.9)
34.8 (5.1)
>37 (6.5)
Canopy cover 4–8 m00.4 (1.7)140335149<0.001
10.8 (2.6)
21.2 (3.2)
31.2 (3.4)
>30.6 (2)
Canopy cover 8–16 m023.9 (10.6)38335095838898<0.001
116.2 (10.7)
210.7 (10)
311.1 (9.6)
>312.2 (10.1)
Canopy cover 16–32 m025.3 (14.8)14725836814174<0.001
121.3 (14.2)
217.2 (14.7)
318.1 (14.8)
>315.9 (14.1)
Canopy cover 32–48 m06.3 (9)9166229225.3<0.001
17 (8.9)
27.9 (10.2)
38.6 (10.7)
>35.9 (9.1)
Tree density (TAOs/ha)0141.2 (37.2)1604513401128207<0.001
1140.6 (46.8)
2120.7 (46.5)
3115.4 (45.1)
>3126.1 (37.7)
NDVI00.43 (0.13)12.853.21183.7<0.001
10.44 (0.14)
20.49 (0.14)
30.50 (0.12)
>30.50 (0.11)
Publisher’s Note: MDPI stays neutral with regard to jurisdictional claims in published maps and institutional affiliations.