
Tracking the Extent and Impacts of a Southern Pine Beetle (Dendroctonus frontalis) Outbreak in the Bienville National Forest
 ,
,
Abstract
:1. Introduction
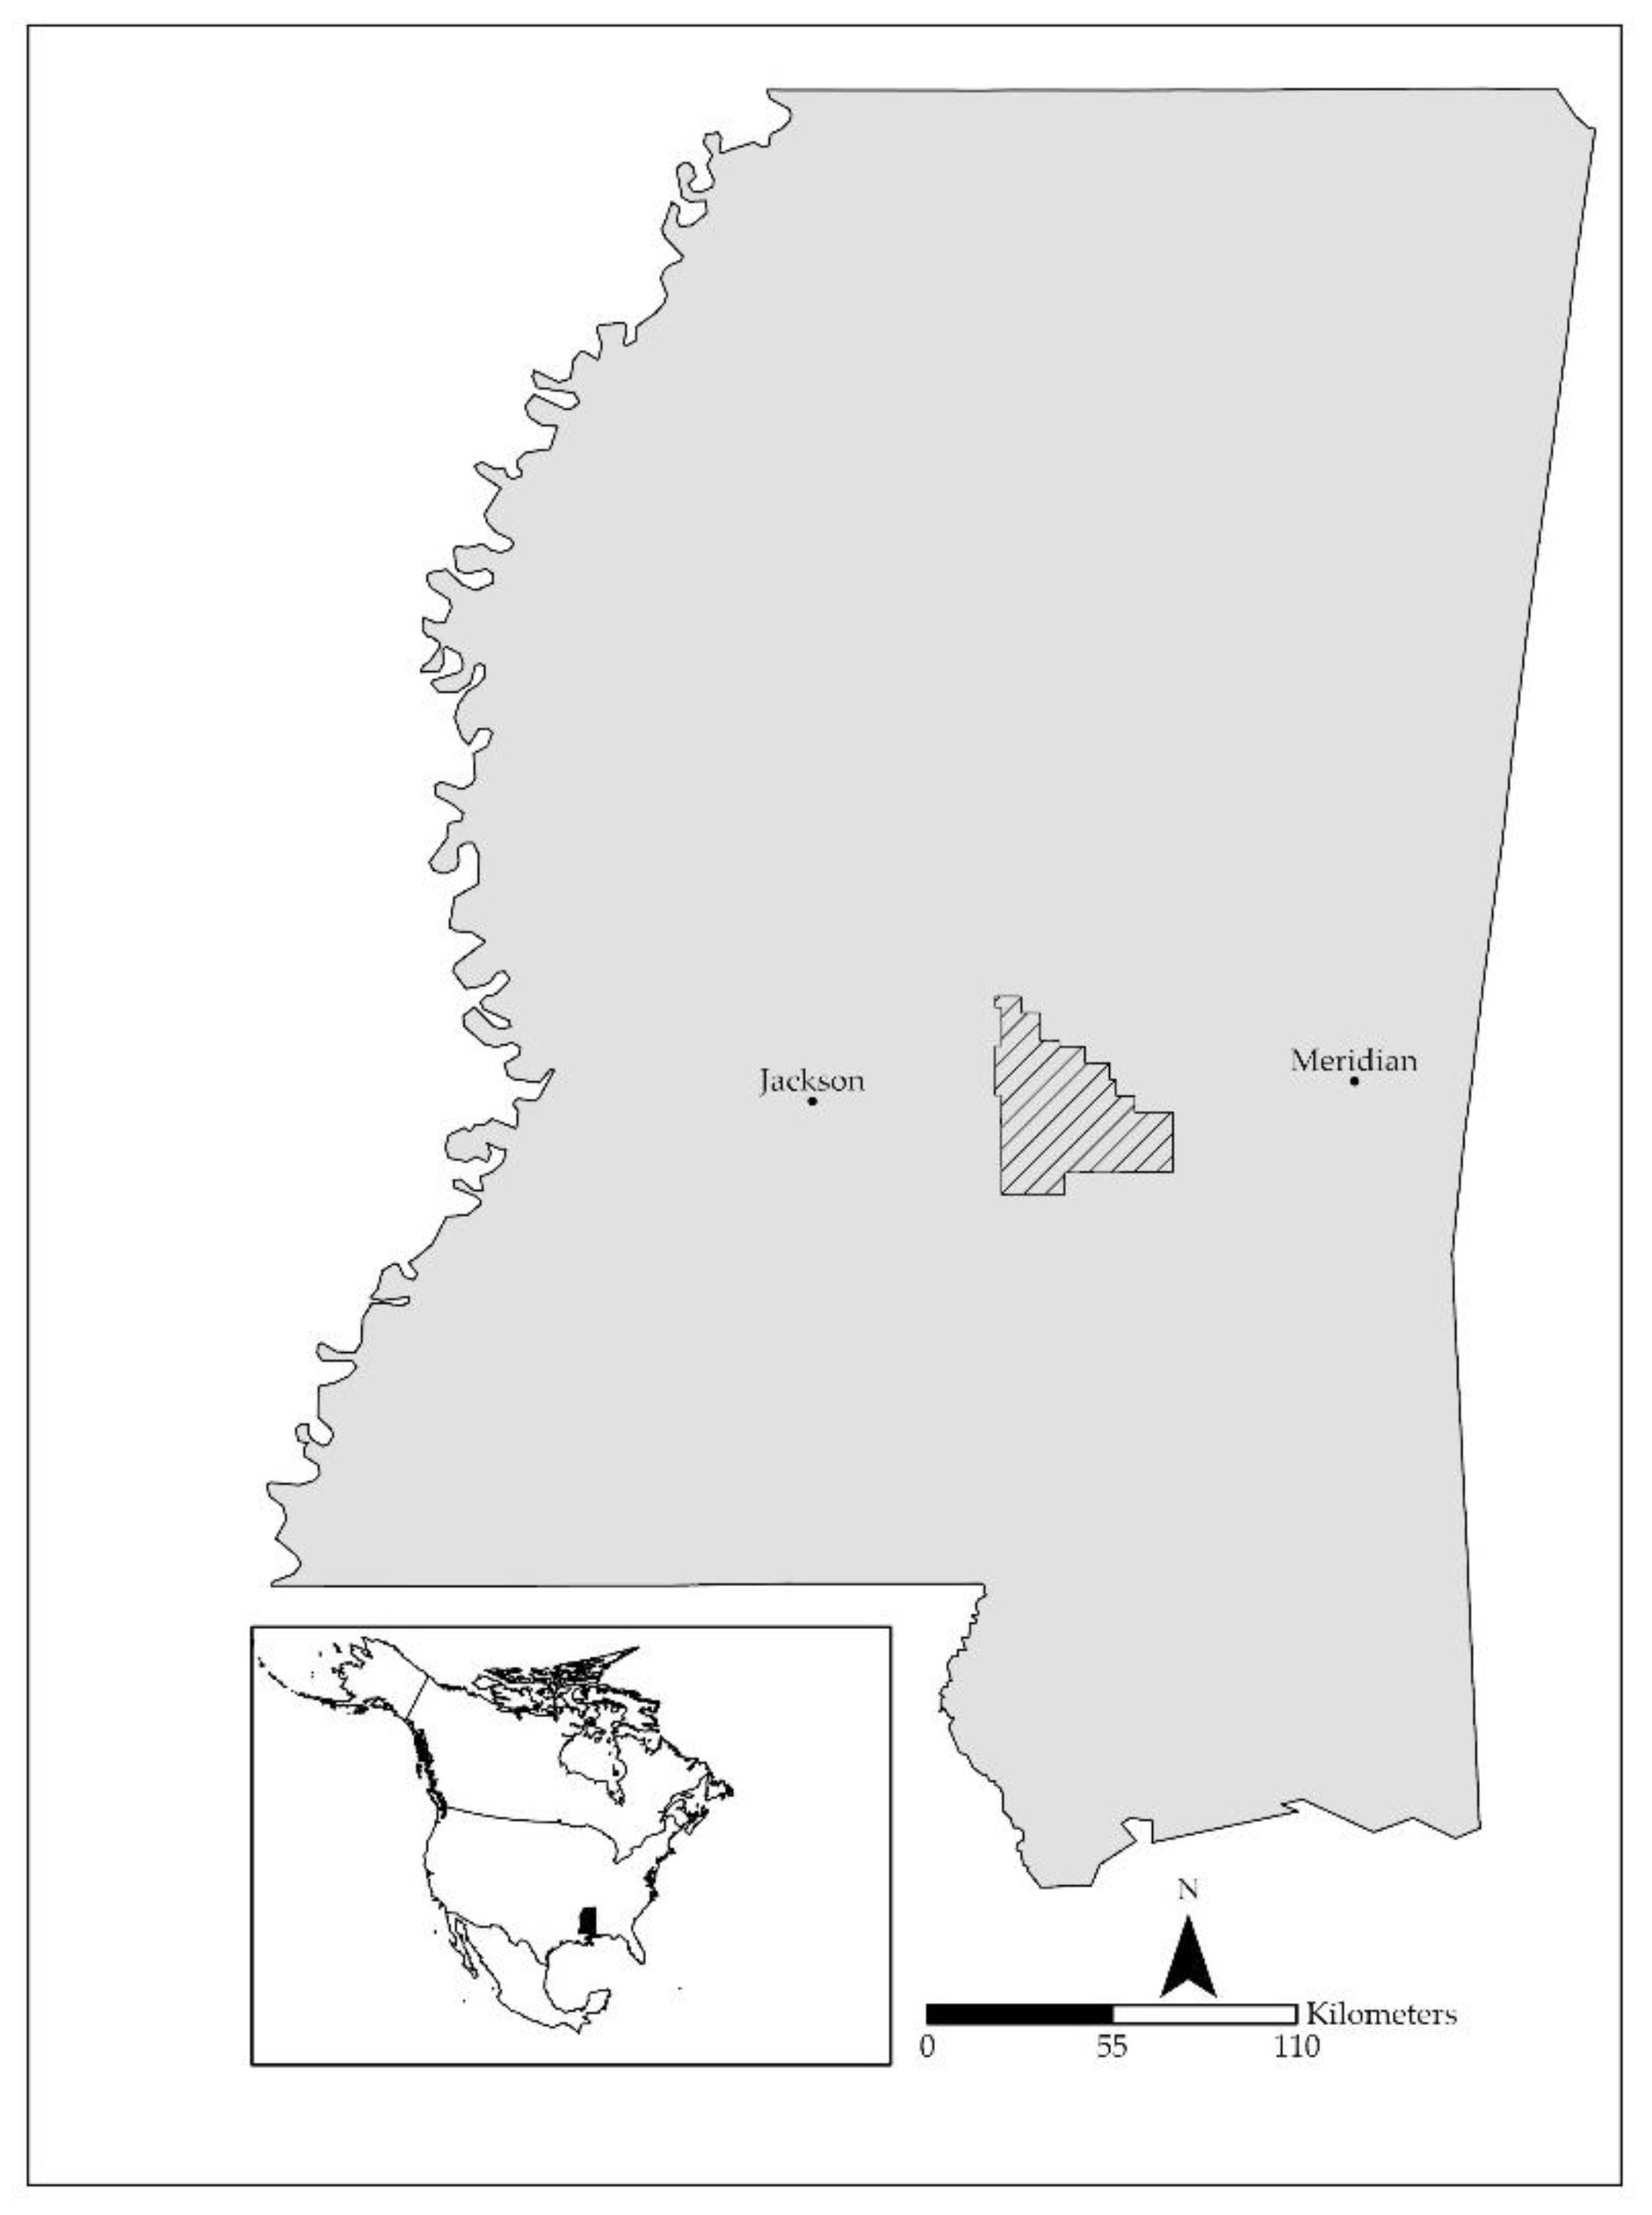
2. Materials and Methods
3. Results
4. Discussion
5. Conclusions
Author Contributions
Funding
Data Availability Statement
Acknowledgments
Conflicts of Interest
References
- Crosby, M.K.; Fan, Z.; Spetich, M.A.; Leininger, T.; Fan, X. Early indications of drought impacts on forests in the southeastern United States. For. Chron. 2015, 91, 376–383. [Google Scholar] [CrossRef] [Green Version]
- Ojha, S.N.; Naka, K.; Dimov, L.D. Assessment of disturbance across forest inventory plots in the southeastern United States for the period 1995-2018. For. Sci. 2020, 66, 242–255. [Google Scholar] [CrossRef] [Green Version]
- Munro, H.L.; Montes, C.R.; Kinane, S.M.; Gandhi, K.J.K. Through space and time: Predicting numbers of an eruptive pine tree pest and its predator under changing climate conditions. For. Ecol. Manag. 2021, 483, 118770. [Google Scholar] [CrossRef]
- Nowak, J.; Asaro, C.; Klepzig, K.; Billings, R. The southern pine beetle initiative: Working for healthier forests. J. For. 2008, 106, 261–267. [Google Scholar]
- Clarke, S.R.; Nowak, J.T. Southern Pine Beetle. USDA For. Serv., For. Insect and Dis. Leaflet 49, FS-R6-RO-FIDL49, Pacific Northwest Region, Portland, OR. 8 p. 2009. Available online: https://www.fs.usda.gov/Internet/FSE_DOCUMENTS/fsbdev2_042840.pdf (accessed on 23 May 2021).
- Nowak, J.T.; Meeker, J.R.; Coyle, D.R.; Steiner, C.A.; Brownie, C. Southern pine beetle infestations in relation to forest stand conditions, previous thinning, and prescribed burning: Evaluation of the Southern Pine Beetle Prevention Program. J. For. 2015, 113, 454–462. [Google Scholar] [CrossRef] [Green Version]
- Kushla, J.D.; Dicke, S.G.; Henderson, J.E.; Gordon, J.S.; Londo, A.J.; Meeker, J. Economic impact of a large-scale, collaborative forest health project: A model for making a difference. J. Ext. 2019, 57, 3FEA3. [Google Scholar]
- Krist, F.J., Jr.; Ellenwood, J.R.; Woods, M.E.; McMahan, A.J.; Cowardin, J.P.; Ryerson, D.E.; Sapio, F.J.; Zweifler, M.O.; Romero, S.A. 2014. 2013–2027 National Insect and Disease Forest Risk Assessment. U.S. Department of Agriculture. Fort Collins, Colorado: Forest Service, Forest Health Technology Enterprise Team. Available online: https://www.fs.fed.us/foresthealth/technology/pdfs/2012_RiskMap_Report_web.pdf (accessed on 14 May 2021).
- USDA Forest Service. 2022. Forest Products Cut and Sold from the National Forests and Grasslands. Available online: https://www.fs.fed.us/forestmanagement/products/cut-sold/index.shtml (accessed on 11 February 2022).
- USDA Forest Service Forest Inventory and Analysis. 2022. EVALIDator. Available online: https://www.fia.fs.fed.us/tools-data/ (accessed on 11 February 2022).
- Pye, J.M.; Holmes, T.P.; Prestemon, J.P.; Wear, D.N. 2011; Economic Impacts of the Southern Pine Beetle. In: Coulson, R.N.; Klepzig, K.D. 2011. Southern Pine Beetle II. Gen. Tech. Rep. SRS-140. Asheville, NC: U.S. Department of Agriculture Forest Service, Southern Research Station. 213-222. Available online: https://www.srs.fs.usda.gov/pubs/gtr/gtr_srs140/gtr_srs140_213.pdf (accessed on 6 December 2021).
- Clarke, S.R.; Hartshorn, J. Contrasting competitor and predator responses to a short-lived southern pine beetle outbreak: A Case study. For. Sci. 2021, 67, 22–29. [Google Scholar] [CrossRef]
- Billings, R.F.; Pase, H.A. A Field Guide for Checking Southern Pine Beetle Spots; USDA Agriculture Handbook: Washington, DC, USA, 1983; No.558. [Google Scholar]
- Maingi, J.K.; Luhn, W.M. Mapping insect-induced pine mortality in the Daniel Boone National Forest, Kentucky using Landsat TM and ETM+ Data. GIScience Remote Sens. 2005, 42, 224–250. [Google Scholar] [CrossRef]
- Billings, R.; Smith, L.A.; Zhu, J.; Verma, S.; Kouchoukos, N.; Heo, J. Developing and validating a method for monitoring and tracking changes in southern pine beetle hazard at the landscape level. In Advances in Threat Assessment and Their Application to Forest and Rangeland Management; Pye, J.M., Rauscher, H.M., Sands, Y., Lee, D.C., Beatty, J.S., Eds.; Gen. Tech. Rep. PNW-GTR-802; U.S. Department of Agriculture, Forest Service, Pacific Northwest and Southern Research Stations: Portland, OR, USA, 2010; pp. 541–549. [Google Scholar]
- Bright, B.C.; Hudak, A.T.; Meddens, A.J.H.; Egan, J.M.; Jorgensen, C.L. Mapping multiple insect outbreaks across large regions annually using Landsat time series data. Remote Sens. 2020, 12, 1655. [Google Scholar] [CrossRef]
- Näsi, R.; Honkavaara, E.; Blomqvist, M.; Lyytikäinen-Saarenmaa, P.; Hakala, T.; Viljanen, N.; Kantola, T.; Holopainen, M. Remote sensing of bark beetle damage in urban forests at individual tree level using a novel hyperspectral camera from UAV and aircraft. Urban For. Urban Green. 2018, 30, 72–83. [Google Scholar] [CrossRef]
- Hais, M.; Wild, J.; Berec, L.; Brůna, J.; Kennedy, R.; Braaten, J.; Brož, Z. Landsat imagery spectral trajectories-important variables for spatially predicting the risks of bark beetle disturbance. Remote Sens. 2016, 8, 687. [Google Scholar] [CrossRef] [Green Version]
- Senf, C.; Seidl, R.; Hostert, P. Remote sensing of forest insect disturbances: Current state and future directions. Int. J. Appl. Earth Obs. Geoinf. 2017, 60, 49–60. [Google Scholar] [CrossRef] [PubMed]
- Gomez, D.F.; Ritger, H.M.W.; Pearce, C.; Eickwort, J.; Hulcr, J. Ability of remote sensing systems to detect bark beetle spots in the Southeastern US. Forests 2020, 11, 1167. [Google Scholar] [CrossRef]
- McConnell, T.E. Ranking agricultural and natural resources contributions to Mississippi. J. Agribus. 2021, 39, 1–14. [Google Scholar]
- Golden, J.S.; Handfield, R.B.; Daystar, J.S.; McConnell, T.E. An Economic Impact Analysis of the U.S. Biobased Products Industry: A Report to the Congress of the United States of America. In A Joint Publication of the Duke Center for Sustainability & Commerce and the Supply Chain Resource Cooperative at North Carolina State University; USDA: Washington DC, WA, USA, 2015; 127p. [Google Scholar]
- Mississippi Forestry Commission. Mississippi’s Forest Action Plan 2020. Jackson, MS, Mississippi Forestry Commission. 241 p. 2020. Available online: https://www.mfc.ms.gov/wp-content/uploads/2021/01/Mississippi-Forest-Action-Plan-January-2021-compressed.pdf (accessed on 24 August 2021).
- Dahal, R.P.; Henderson, J.E.; Munn, I.A.; Grala, R.K. Forestry in Mississippi-the Contribution of the Industry to the Mississippi Economy: An Input-Output Analysis. Forest and Wildlife Research Center, Research Bulletin FO464, Mississippi State University. 32 pp. 2017. Available online: https://www.fwrc.msstate.edu/pubs/foinms2017.pdf (accessed on 18 August 2021).
- USDA. National Agricultural Imaging Program, USDA-FSA-APFO Digital Ortho Mosaic. Imagery from the USDA-FSA-APFO Aerial Photography Field Office, Salt Lake City, UT. 2017. Available online: https://www.maris.state.ms.us/NAIP_2016/ (accessed on 23 May 2021).
- Mississippi Automated Resource Information System (MARIS). 2021. 2016 Mississippi NAIP. Available online: https://www.maris.state.ms.us/HTML/DATA/data_Aerial/NAIP/NAIP2016.html#gsc.tab=0 (accessed on 2 July 2021).
- SAS, Version 9.4; SAS Institute: Cary, NC, USA, 2022.
- Clarke, S.R.; Riggins, J.J.; Stephen, F.M. Forest management and southern pine beetle outbreaks: A historical perspective. For. Sci. 2016, 62, 166–180. [Google Scholar] [CrossRef]
- Kutner, M.H.; Nachtsheim, C.J.; Neter, J. Applied Linear Regression Models, 4th ed.; McGraw-Hill Irwin: New York, NY, USA, 2004; 701p. [Google Scholar]
- Billings, R.F. Mechanical Control of Southern Pine Beetle Infestations. In Southern Pine Beetle II. Gen. Tech. Rep. SRS-140; Coulson, R.N., Klepzig, K.D., Eds.; U.S. Department of Agriculture Forest Service, Southern Research Station: Asheville, NC, USA, 2011; pp. 399–413. [Google Scholar]
- Immitzer, M.; Atzberger, C. Early detection of bark beetle infestation in Norway spruce (Picea abies, L.) using WorldView-2 data. Photogramm. -Fernerkund. -Geoinf. 2014, 5, 351–367. [Google Scholar] [CrossRef]
- Dalponte, M.; Solano-Correa, Y.T.; Frizzera, L.; Gianelle, D. Mapping a European spruce beetle outbreak using Sentinel-2 remote sensing data. Remote Sens. 2022, 14, 3135. [Google Scholar] [CrossRef]
- Bright, B.C.; Hudak, A.T.; Egan, J.M.; Jorgensen, C.L.; Rex, F.E.; Hicke, J.A.; Meddens, A.J.H. Using satellite imagery to evaluate bark beetle-caused tree mortality reported in aerial surveys in a mixed conifer forest in Northern Idaho, USA. Forests 2020, 11, 529. [Google Scholar] [CrossRef]
- Meng, R.; Gao, R.; Zhao, F.; Huang, C.; Sun, R.; Lv, Z.; Huang, Z. Landsat-based monitoring of southern pine beetle infestation severity and severity change in a temperate mixed forest. Remote Sens. Environ. 2022, 269, 112847. [Google Scholar] [CrossRef]
- Pietzsch, B.W.; Peter, F.J.; Berger, U. The effect of sanitation felling on the spread of European spruce bark beetle-an individual-based modeling approach. Front. For. Glob. Change 2021, 4, 704930. [Google Scholar] [CrossRef]
- Dobor, L.; Hlásny, T.; Rammer, W.; Zimová, S.; Barka, I.; Seidl, R. Spatial configuration matters when removing windfelled trees to manage bark beetle disturbances in central European forest landscapes. J. Environ. Manag. 2020, 254, 109792. [Google Scholar] [CrossRef] [PubMed]
- Meddens, A.J.H.; Hicke, J.A.; Vierling, L.A.; Hudak, A.T. Evaluating methods to detect bark beetle-caused tree mortality using single-date and multi-date Landsat imagery. Remote Sens. Environ. 2013, 132, 49–58. [Google Scholar] [CrossRef]
- Prestemon, J.P.; Abt, K.L.; Potter, K.M.; Koch, F.H. An economic assessment of mountain pine beetle timber salvage in the West. West. J. Appl. For. 2013, 28, 143–153. [Google Scholar] [CrossRef]
- Little, N.S.; McConnell, T.E.; Irby, N.E.; Shi, S.Q.; Riggins, J.J. Surface free energy of blue-stained southern pine sapwood from bark-beetle attacked trees. Wood Fiber Sci. 2013, 45, 206–214. [Google Scholar]
- Hlásny, T.; König, L.; Krokene, P.; Lindner, M.; Montagné-Huck, C.; Müller, J.; Qin, H.; Raffa, K.F.; Schelhaas, M.; Svoboda, M.; et al. Bark beetle outbreaks in Europe: State of knowledge and ways forward for management. Curr. For. Rep. 2021, 7, 138–165. [Google Scholar] [CrossRef]
- Pickering, J.; Tyukavina, A.; Khan, A.; Potapov, P.; Adusei, B.; Hansen, M.C.; Lima, A. Using multi-resolution satellite data to quantify land dynamics: Applications of PlanetScope imagery for cropland and tree-cover loss area estimation. Remote Sens. 2021, 13, 2191. [Google Scholar] [CrossRef]
- Rossi, J.P.; Samalens, J.C.; Guyon, D.; van Halder, I.; Jactel, H.; Menassieu, P.; Piou, D. Multiscale spatial variation of the bark beetle Ips sexdentatus damage in a pine plantation forest (Landes de Gascogne, Southwestern France). For. Ecol. Manag. 2009, 257, 1551–1557. [Google Scholar] [CrossRef]
- Clarke, S.R.; Meeker, J.R.; Dodds, K.A. Revised and potential new tactics for the suppression of southern pine beetle infestations. J. Integr. Pest Manag. 2021, 12, 1–8. [Google Scholar] [CrossRef]
- Munn, I.A.; Rucker, R.R. An economic analysis of the differences between bid prices on forest service and private timber sales. For. Sci. 1995, 41, 823–840. [Google Scholar]
- Carter, D.R.; Newman, D.H. The impact of reserve prices on sealed bid federal timber sale auctions. For. Sci. 1988, 44, 485–495. [Google Scholar]
- Sendak, P.E. Timber Sale Value as a Function of Sale Characteristics and Number of Bidders; Res. Pap. NE-657; U.S. Department of Agriculture, Forest Service, Northeastern Forest Experiment Station: Radnor, PA, USA, 1991; 7p. [Google Scholar]
- Leefers, L.A.; Potter-Witter, K. Timber sale characteristics and competition for public lands stumpage: A case study from the Lake States. For. Sci. 2006, 52, 460–467. [Google Scholar]


| Year | Active Infestation | Standing Dead | Cut and Leave | Cut and Remove | Hazard Mitigation | Yearly Totals |
|---|---|---|---|---|---|---|
| 2016 | 607 | 476 | 63 | 2 | 0 | 1148 |
| 2017 | 485 | 574 | 176 | 7 | 1 | 1243 |
| 2018 | 487 | 1087 | 60 | 166 | 164 | 1964 |
| 2019 | 607 | 700 | 4 | 41 | 15 | 1367 |
| Spot Status Totals | 2186 | 2837 | 303 | 216 | 180 | 5722 |
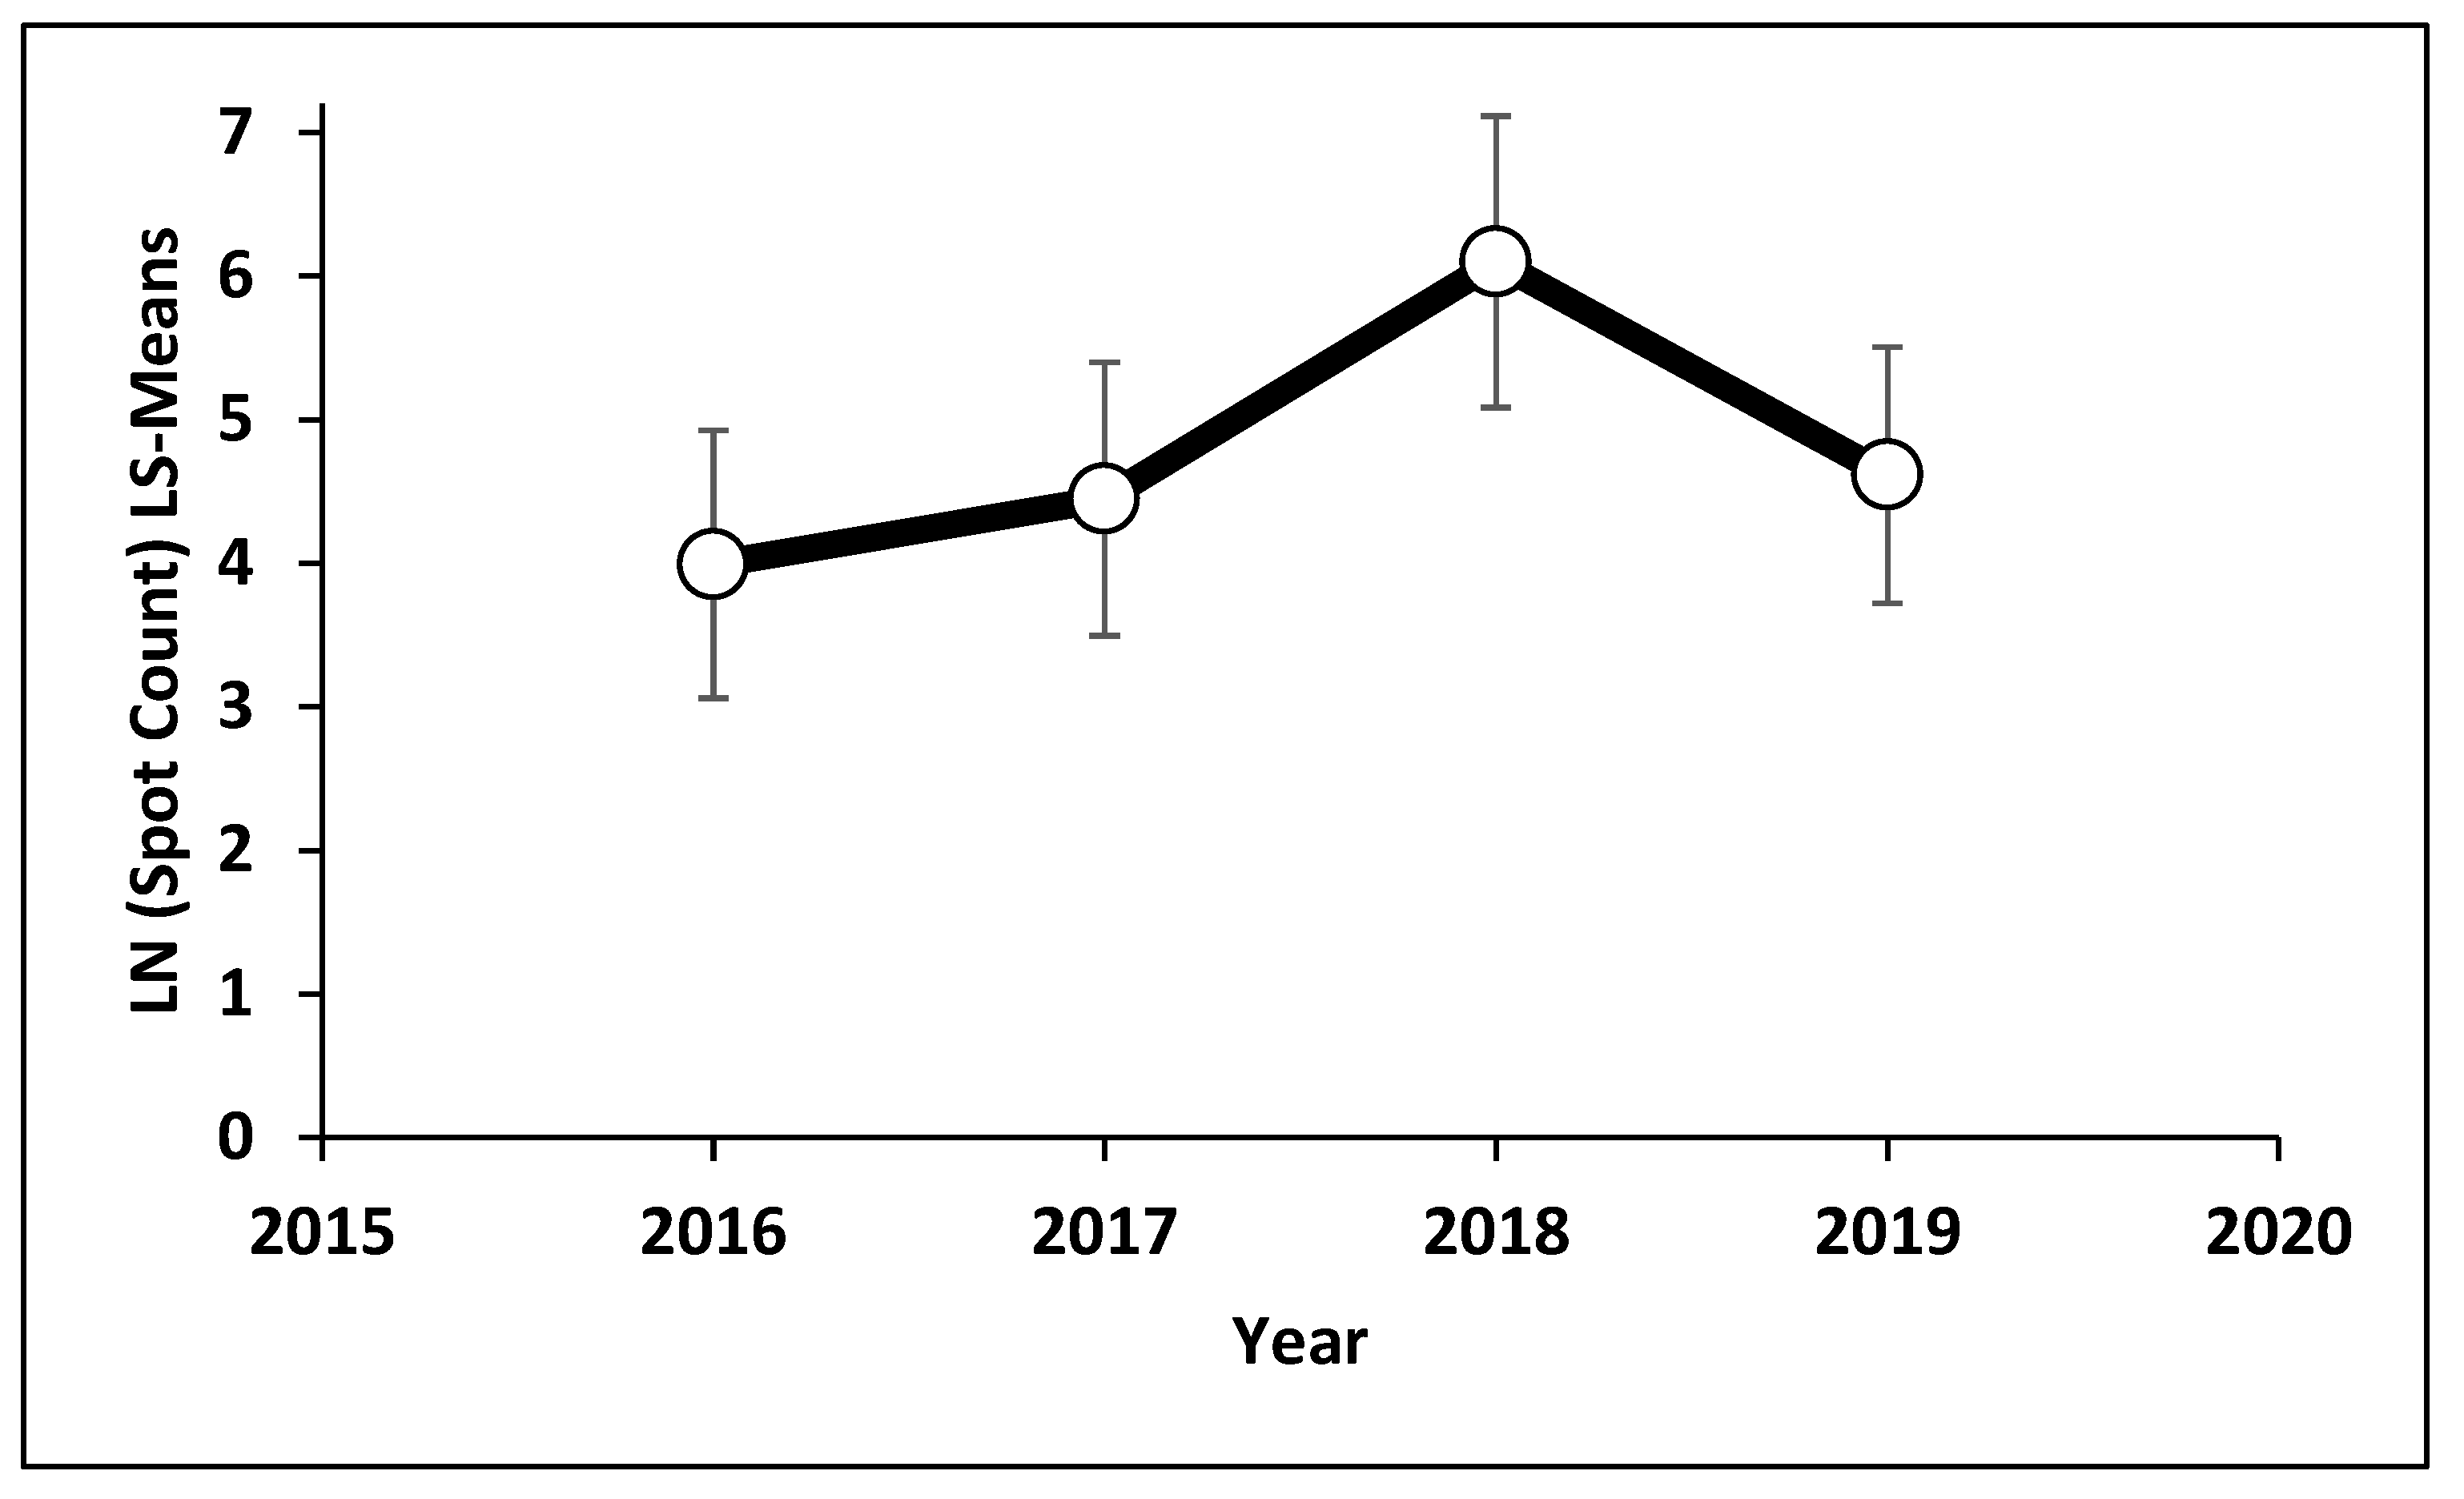
| Year | Estimate | Difference from 2016 | Incident Rate Ratio |
|---|---|---|---|
| 2016 | 3.9912 | ---- | 1.0000 |
| 2017 | 4.4457 | 0.4545 | 1.5736 |
| 2018 | 6.0981 | 2.1069 | 8.2231 |
| 2019 | 4.6118 | 0.6206 | 1.8601 |
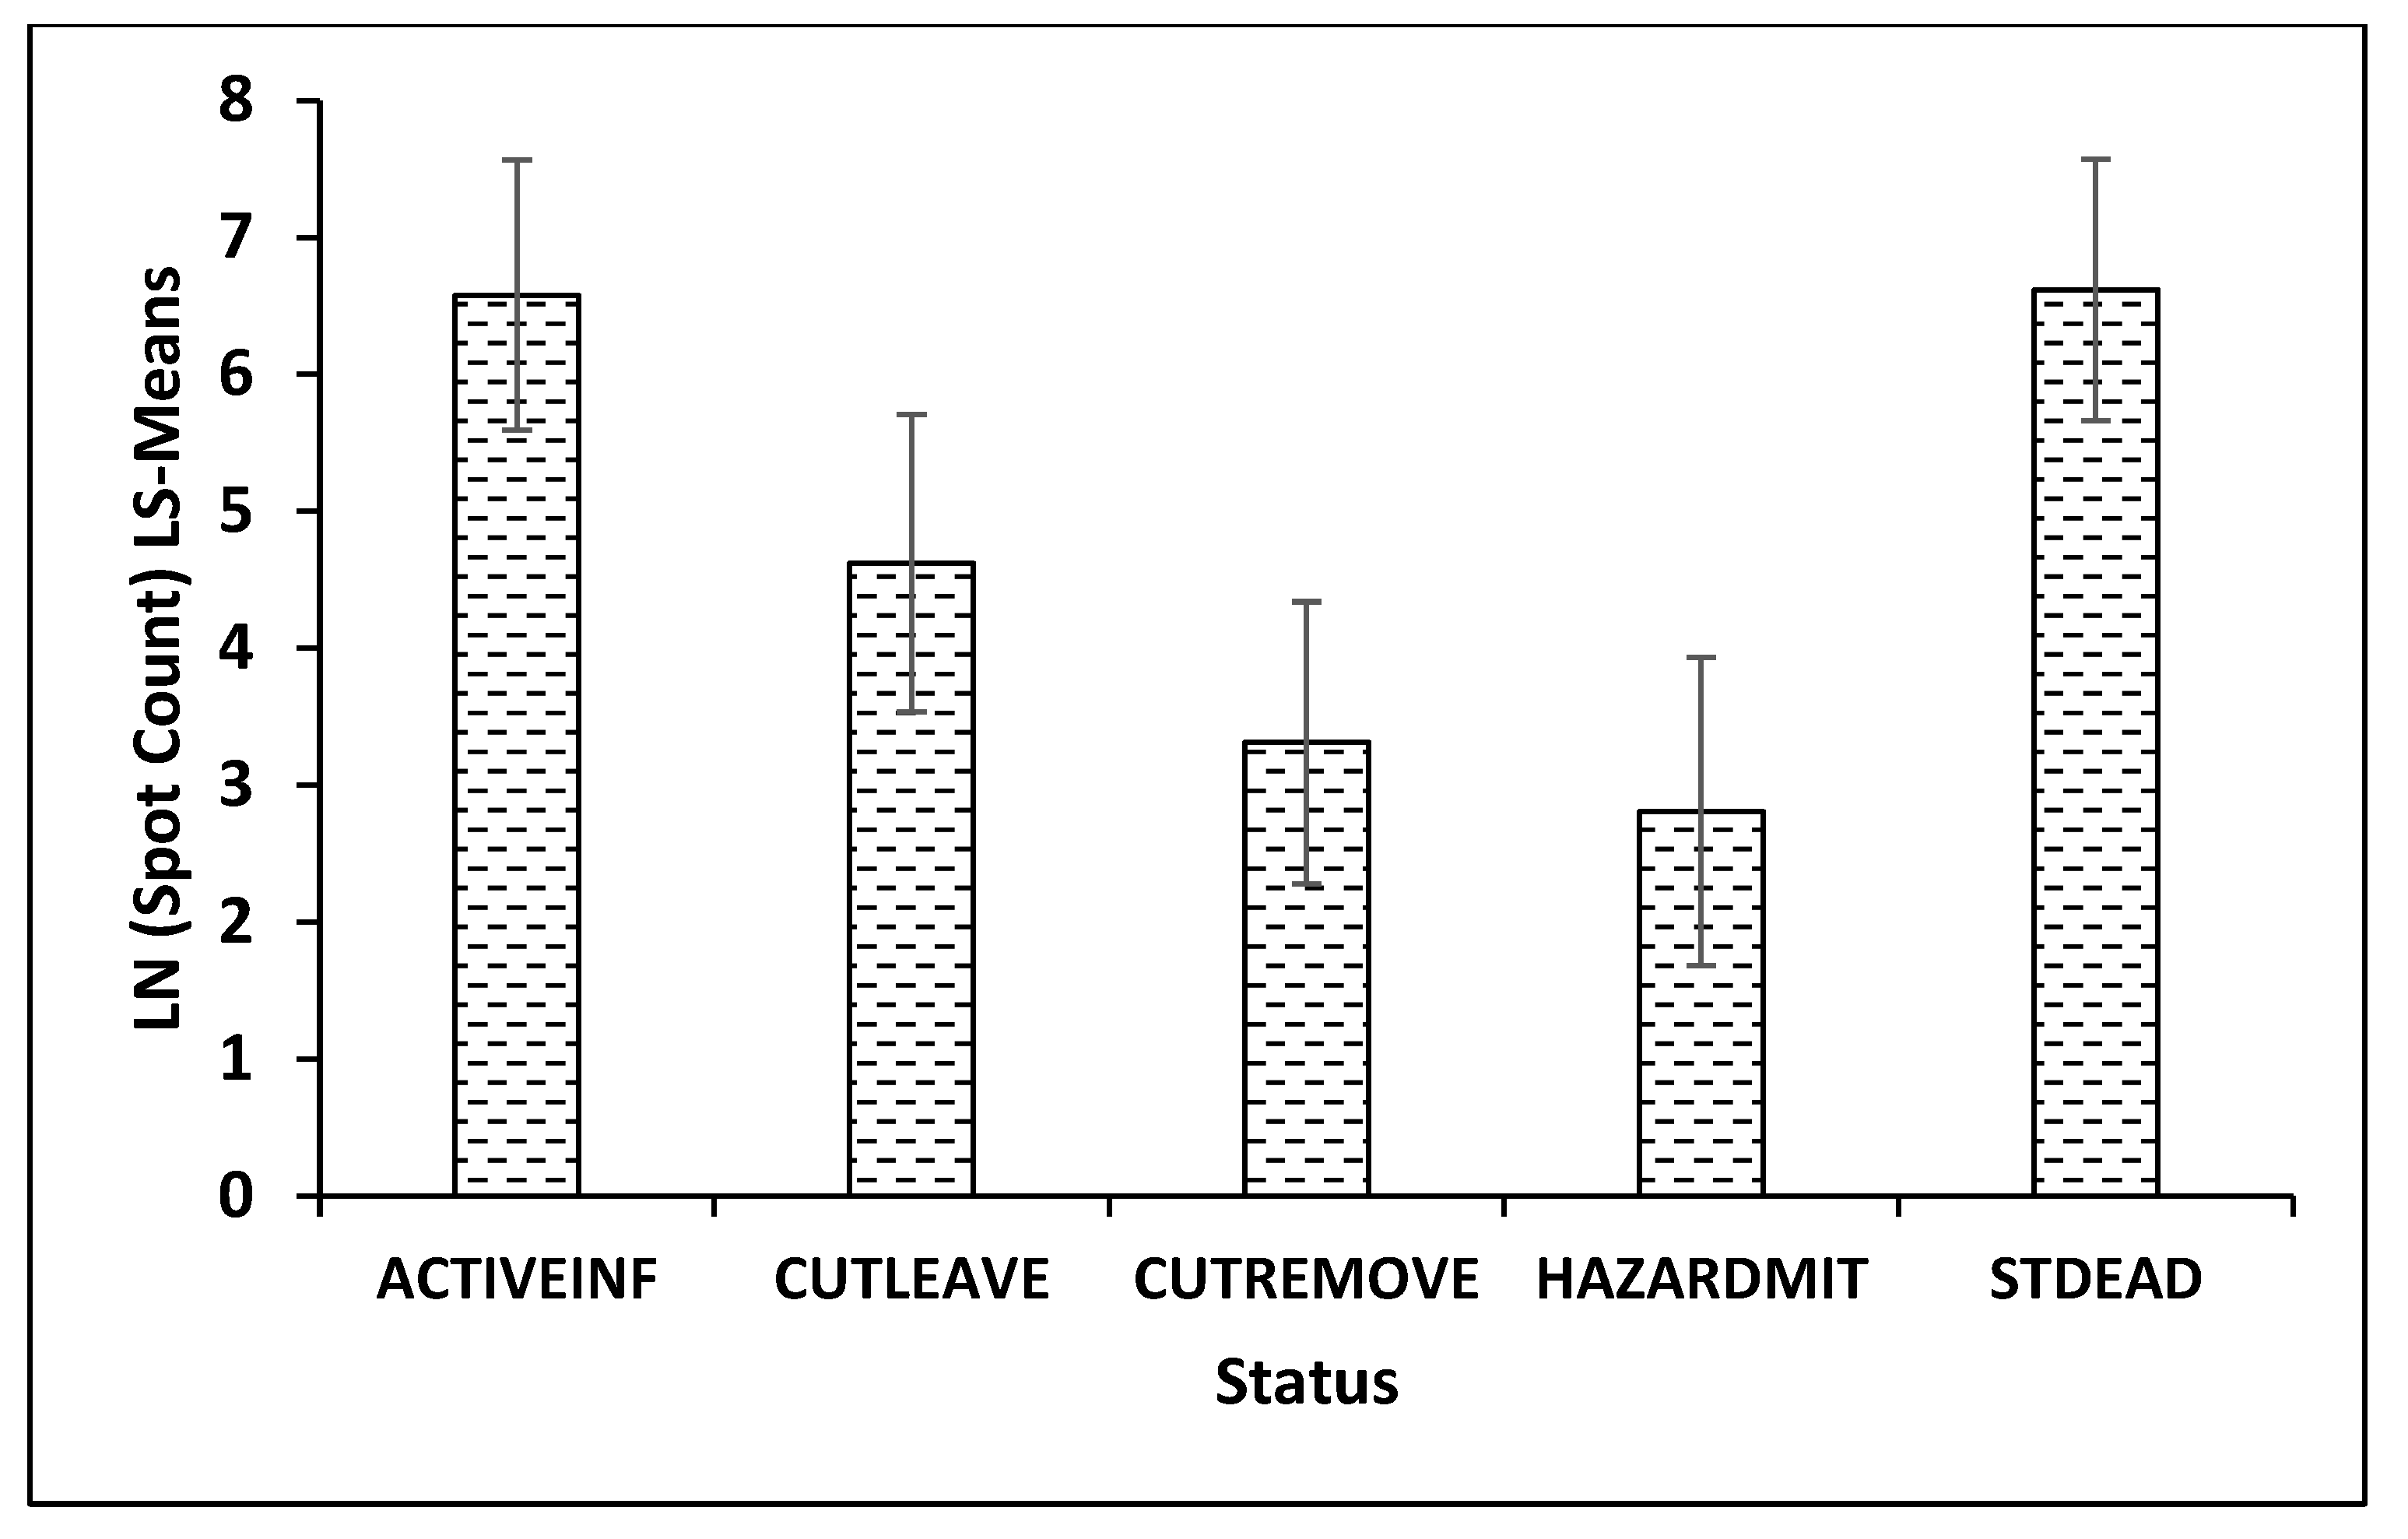
| Status | Estimate | Difference from ACTIVEINF | Incident Rate Ratio |
| ACTIVEINF | 6.5790 | ---- | 1.0000 |
| CUTLEAVE | 4.6211 | −1.9579 | 0.1412 |
| CUTREMOVE | 3.3095 | −3.2695 | 0.0380 |
| HAZARDMIT | 2.8080 | −3.771 | 0.0230 |
| STDEAD | 6.6159 | 0.0368 | 1.0375 |
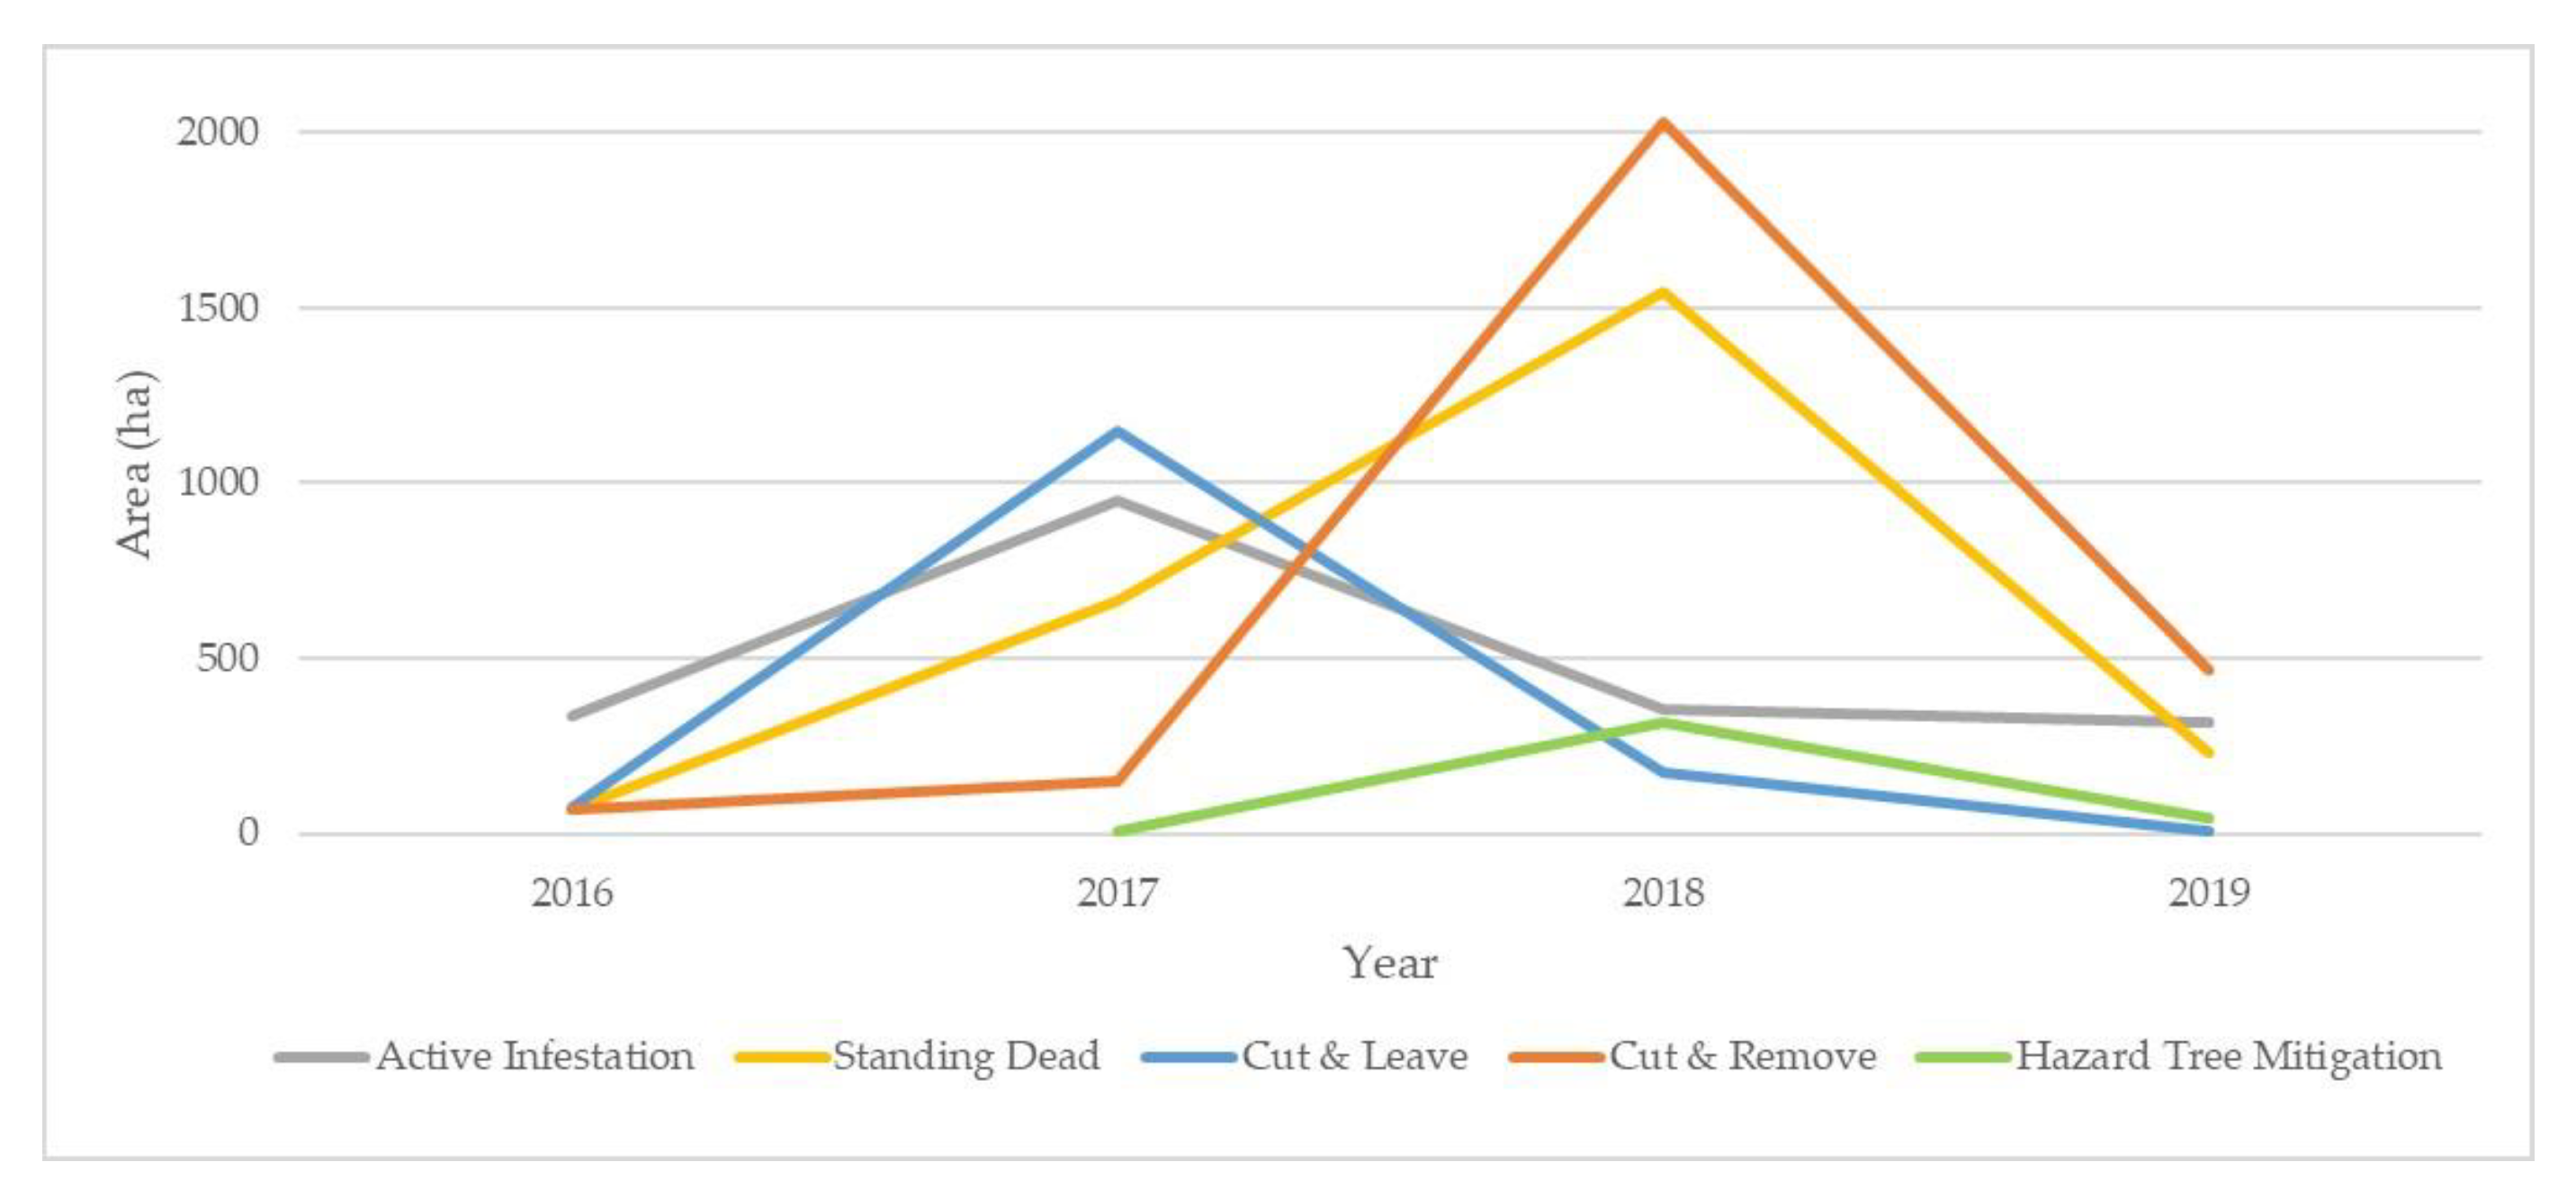
| Year | Class/Treatment | # Events | Area (ha) | Total/Year |
|---|---|---|---|---|
| 2016 | Active Infestation | 607 | 337.10 | 547.37 |
| Standing Dead | 476 | 66.36 | ||
| Cut & Leave | 63 | 75.38 | ||
| Cut & Remove | 2 | 68.53 | ||
| 2017 | Active Infestation | 485 | 952.79 | 2921.86 |
| Standing Dead | 574 | 665.66 | ||
| Cut & Leave | 176 | 1149.26 | ||
| Cut & Remove | 7 | 149.27 | ||
| Hazard Tree Mitigation | 1 | 4.88 | ||
| 2018 | Active Infestation | 487 | 355.52 | 4422.47 |
| Standing Dead | 1087 | 1546.97 | ||
| Cut & Leave | 60 | 173.26 | ||
| Cut & Remove | 166 | 2027.96 | ||
| Hazard Tree Mitigation | 164 | 318.77 | ||
| 2019 | Active Infestation | 607 | 315.53 | 1063.67 |
| Standing Dead | 700 | 227.35 | ||
| Cut & Leave | 4 | 8.62 | ||
| Cut & Remove | 41 | 467.70 | ||
| Hazard Tree Mitigation | 15 | 44.48 | ||
| Total | 8955.38 |
Disclaimer/Publisher’s Note: The statements, opinions and data contained in all publications are solely those of the individual author(s) and contributor(s) and not of MDPI and/or the editor(s). MDPI and/or the editor(s) disclaim responsibility for any injury to people or property resulting from any ideas, methods, instructions or products referred to in the content. |
© 2022 by the authors. Licensee MDPI, Basel, Switzerland. This article is an open access article distributed under the terms and conditions of the Creative Commons Attribution (CC BY) license (https://creativecommons.org/licenses/by/4.0/).
Share and Cite
Crosby, M.K.; McConnell, T.E.; Holderieath, J.J.; Meeker, J.R.; Steiner, C.A.; Strom, B.L.; Johnson, C. Tracking the Extent and Impacts of a Southern Pine Beetle (Dendroctonus frontalis) Outbreak in the Bienville National Forest. Forests 2023, 14, 22. https://doi.org/10.3390/f14010022
Crosby MK, McConnell TE, Holderieath JJ, Meeker JR, Steiner CA, Strom BL, Johnson C. Tracking the Extent and Impacts of a Southern Pine Beetle (Dendroctonus frontalis) Outbreak in the Bienville National Forest. Forests. 2023; 14(1):22. https://doi.org/10.3390/f14010022
Chicago/Turabian StyleCrosby, Michael K., T. Eric McConnell, Jason J. Holderieath, James R. Meeker, Chris A. Steiner, Brian L. Strom, and Crawford (Wood) Johnson. 2023. "Tracking the Extent and Impacts of a Southern Pine Beetle (Dendroctonus frontalis) Outbreak in the Bienville National Forest" Forests 14, no. 1: 22. https://doi.org/10.3390/f14010022