Article

Chlorophyll Pigment and Leaf Macronutrient Trait Variation of Four Salix Species in Elevated CO2, under Soil Moisture Stress and Fertilization Treatments

Natural Resources Canada, Canadian Forest Service—Atlantic Forestry Centre, 1350 Regent St., Fredericton, NB E3B 5P7, Canada
*
Author to whom correspondence should be addressed.
Forests 2023, 14(1), 42; https://doi.org/10.3390/f14010042
Submission received: 28 October 2022 / Revised: 14 December 2022 / Accepted: 20 December 2022 / Published: 26 December 2022

Abstract

:
Leaf chlorophyll pigment and macronutrient concentrations were quantified for four willow species (Salix cordata (COR), S. discolor (DIS), S. eriocephala (ERI) and S. interior (INT)) while growing under 2 × 2 factorial of ambient and elevated CO2 and well-watered and drought-stressed soil moisture treatments (Expt. 1). After the first year, we saw no difference in stem biomass between CO2 treatments. In the following year, a second experiment was conducted on a subset of well-watered willows as a 2 × 2 factorial of atmospheric CO2 and soil fertilization (FERT). For both years of Expt. 1, chlorophyll a, b, a + b (TCC) and carotenoids (CAR) significantly downregulated in response to elevated CO2 (eCO2) and upregulated in response to drought (DRT). In Expt. 2, FERT mitigated CO2 downregulation of TCC and CAR, and upregulated TCC and CAR. Across species, ERI had the greatest pigment concentrations followed by either COR or DIS. Except for one case, INT had the lowest pigment concentrations. A significant species x FERT interaction was due to magnitude effects. The CHLa:b ratio was not affected by CO2 or DRT but did increase in response to FERT. INT had the greatest CHLa:b ratio followed by DIS, then either ERI or COR. In the second year, TCC:CAR ratio decreased in response to eCO2 and increased in response to DRT and FERT. In Expt. 1, leaf N was the only nutrient to significantly downregulate in response to eCO2; whereas all other nutrient levels remained unchanged. In response to DRT, leaf N and Mg upregulated; whereas leaf P, K, and Ca were downregulated. In response to eCO2 in Expt. 2, again only leaf N downregulated; whereas all other nutrients remained unchanged. All leaf nutrients upregulated in response to FERT. Of the four species, INT had the greatest leaf N and K, and the lowest Ca. Species variation was important, but so to was clonal variation in response to change. Indeed, INT leaf chlorophyll and macronutrients are significantly different or segregated from the other three willow species and this may be related to the evolutionary origins of INT, and other species of the taxonomic section Longifoliae, in the arid southwest USA and Mexico. Furthermore, under low nutrient conditions, it may be necessary to fertilize the plants to see a biomass response to eCO2.

1. Introduction

Chlorophyll is a defining photosynthetic pigment of plants and varies widely among species, environment, and leaf age [1,2,3,4]. Lower chlorophyll amounts intercept less light by the plant, thereby decreasing photosynthesis and growth [4,5]. Multiple stresses alter the pigment composition and ratios of plants, often resulting in changes or loss of chlorophyll [3,6]. We know that the short-term response to an increase in atmospheric CO2 stimulates photosynthesis [7,8]. However, downregulation of the photosynthetic apparatus (e.g., chlorophyll and biochemical efficiency traits) can occur in response to elevated CO2 (eCO2) and can result in the reduction in carboxylation efficiencies and maximum assimilation, along with other related traits [9,10,11,12]. Studies have shown that photosynthetic apparatus downregulation generally ranges from no downregulation to complete downregulation (when A is the same under eCO2 as it is under ambient levels), depending on species and study [13,14]. With climate warming, frequency and severity of drought have been predicted to increase [15]. Water is a predominant factor in determining the geographic and landscape distribution of vegetation, and drought tolerance is an important factor in plant growth and mortality [16]. Physiologically, water stress and heat often reduce photosynthesis, increase photo-oxidative stress resulting in leaf abscission, and decrease leaf and plant growth rate [17,18]. Tree physiological responses to water availability vary among and within species [17,19].
Nitrogen (N) is an essential nutrient for the components of chlorophyll, enzymes, proteins and other organic compounds, and N levels control growth [20]. Nitrogen has been positively associated with chlorophyll pigment content [21], photosynthesis [10], and overall productivity [22]. Other macronutrients, such as phosphorus (P), potassium (K), calcium (Ca), and magnesium (Mg), are essential elements in various plant physiological functions, and as structural components of DNA and RNA, osmotic potential generation for growth, cell wall constituents, and chlorophyll constituents [20]. Many studies have noted variation in species requirements for each of these elements [23,24]. In a review of tree nutrition, [25] postulated that although tree nutrition has not been the primary focus of climate change studies, there are likely to be changes to nutritional status and growth rates due to the effects from eCO2.
Salix cordata Michaux (COR), S. discolor Muhl. (DIS), S. eriocephala Michx. (ERI), and S. interior Rowlee (INT) are shrub willows native to eastern and central Canada and each of these species appear promising as fast-growing sources of woody biomass production [26,27]. Salix cordata, also known as sand dune willow, occurs in dune landscapes associated with the North American Great Lakes, but also occurs on riverbanks, and lakeshores in sandy, silty or gravelly soils. Salix interior is also widespread in western North America, ranging from Mexico to Alaska and has been observed to be comparatively saline tolerant [28,29]. Salix discolor is commonly found in wet areas on a wide variety of disturbed sites, whereas ERI and INT are more commonly associated with fast-flowing streams and rivers.
The predicted doubling of CO2 this century could affect drought responses and comparative fitness among plant species. There are few, if any, climate change response studies on willow chlorophyll pigments and the leaf macronutrients involved in photosynthesis. Photosynthesis can be downregulated in response to eCO2 [30,31], but some willow species have shown increased photosynthesis in response to eCO2 [32,33]. Our goal was to examine and compare chlorophyll pigment and leaf macronutrients in four willow species under the interactive effect of atmospheric CO2 and soil moisture treatments and atmospheric CO2 and soil fertilization. We hypothesized that eCO2, soil moisture stress, and fertilization responses would differ among willows. Our specific objectives were to (1) quantify genetic variation in chlorophyll pigment and leaf macronutrient traits of four willow species; COR, DIS, ERI and INT, (2) examine their physiological responses and interactions to eCO2 and soil moisture stress treatments, and (3) further examine their physiological responses and interactions to eCO2 and soil fertilization treatments.

2. Materials and Methods

This greenhouse study exposed rooted willow cuttings to different CO2 and soil moisture treatments over two growing seasons (2017 and 2018). The above-ground biomass was harvested after the first year, and the plants were then allowed to coppice (resprout) and grow for a second year of CO2 and soil moisture treatments. In the second year a sub-set of plants grown under well-watered conditions were given different levels of fertilizer.

3. Plant Material, Growing Conditions and Treatment Delivery

Sixteen genotypes (clones), four clones from each of four willow species, COR, DIS, ERI, and INT were selected for this study (see clone Table 1). Cuttings approximately 20 cm long were collected either in the field in April 2017 and kept frozen (−8 °C), or in early May 2017 and kept cool at 4 °C, in sealed plastic bags until 7 June 2017, when all cuttings were moved to a common 4 °C cooler. Cuttings were placed in water at room temperature for two days, prior to planting in the greenhouse on 13 June 2017. CO2 treatments were ambient (aCO2—no CO2 added, approximately 400 ppm) and elevated (eCO2—target of 800 ppm), with eCO2 treatment maintained by a delivery system based on the opening or closing of solenoid valves to control CO2 into the outside air stream. Irrigation treatments were well-watered (WW, volumetric water content target of 20–25%) and drought (DRT, VWC 10–15%). Irrigation levels were controlled by manually powered valves delivering water as needed to maintain treatment VWC target levels. On 19 July 2018, sixteen plants from each of the four well-watered (W) greenhouse chambers were randomly selected, two ramets from each of two clones (genotypes) from each of the four species. Paired ramets in each chamber were selected to be of similar in size. For the remainder of the experiment, no fertilizer (NOFERT) plants received the same watering regime as all other W plants via spigots, while fertilized (FERT) plants were hand-watered with an equal volume of water (typically 1 L two times per week) containing fertilizer (Plant Prod “Forestry Special” 20:8:20 delivered at 100 ppm N). Please see Section 2.1 in [31] for detailed growing conditions of treatment delivery. Eight bulk soil samples (one bulked from FERT and one from NONFERT pots for each chamber) were collected in early September 2018 from NONFERT and FERT treatments and sent to the University of New Brunswick nutrient laboratory for analyses. The soil analysis procedure was the same used previously [34].

4. Chlorophyll Determinations—2017 and 2018

On 24–25 October 2017 (Day 118–119 of treatments), two leaves were collected from each of 128 plants (four species × four clones × four treatments × two blocks = 128) for pigment determinations. Leaves were collected in the early morning, kept cool and dark, and samples were prepared immediately that day in the laboratory. The following procedure was repeated twice: four leaf disks (0.75 cm diameter), two from each leaf, taken mid-blade, were weighed fresh to the nearest 0.00001 g, sealed in 1.5 mL microcentrifuge tubes and immediately placed in the dark at −80 °C. In addition, some empty tubes were included as blanks. Working quickly, leaf material was exposed to the light for less than 3 min prior to freezing. The fresh weight was taken from remaining leaf material, then reweighed following 48 h at 65 °C, for determining fresh and dry mass ratio.
Chlorophyll a and b, and total carotenoids were extracted and measured in N-N-Dimethyl-formamide (DMF) [29,35], following two weeks in the freezer. Each sample received 1500 µL of DMF (D1194, Fisher Scientific, Lot 172209) Microcentrifuge tubes were then resealed and shaken at 125 rpm (Innova 2000 platform shaker, New Brunswick Scientific, Edison, NJ, USA) for 23 h at room temperature while covered with aluminum foil. Each extract was then well-mixed by inversion, and 750 µL drawn off and diluted 1:1 with DMF in a 2 mL microcentrifuge tube. Absorbance values were measured at 480, 647, and 664 nm in matched quartz cuvettes on a spectrophotometer (Ultrospec 2100 pro, Biochrom Ltd., Holliston, MA, USA). “Extracts” from empty tubes measured approximately every 15–20 samples had absorbances at all three wavelengths of 0.000–0.003, so no blank correction was applied. Concentrations (ug·mL−1) of chlorophyll a and chlorophyll b, total chlorophyll (chlorophyll a + b) and total carotenoids were calculated according to the equations and absorbance coefficients for DMF with resolution of 1–4 nm, published by [36]. Pigment concentrations were calculated on fresh weight (ug·g−1) of punched samples (0.0001). Pigment concentrations for a given plant were taken as the mean of the two replicated subsamples for that plant.
In 2018, we followed the same procedures as 2017. Leaf samples were collected on 8 August 2018. The 128 samples for the CO2 × watering study in 2018 included all 32 NO FERT plants. In addition, all 32 FERT plants were sampled, thus yielding an overall total of 160 chlorophyll samples.

5. Leaf Nutrient Analyses—2017 and 2018

Dried leaf material from the 31 October 2017 harvest for the 64 plants sampled for gas exchange was ground and analyzed for elemental macronutrient levels. Clones used for leaf analyses in each year, see Table 1. The Laboratory for Forest Soils and Environmental Quality at the University of New Brunswick used standard protocols (e.g., Method numbers TP-SSMA 15.3.1, 15.3.3, and 15.4 [37], for foliage analysis of P, K, Ca, Mg and Na). Total N was determined for each sample using an elemental analyzer (CNS-2000, LECO Corporation, St. Joseph, MI, USA). Details of nutrient analysis methods are found in Section 2 [38]. Note that we also analyzed for leaf Na as we have found a willow species effect in a previous study [28]. The same methods were used for foliar analyses of the 64 plants in the 2018 CO2 x fertilizer sub-study.

6. Statistical Analysis

This study was established as a completely randomized block experimental design. For the chlorophyll pigment analysis for the CO2 × water treatment experiment (1) there were 128 samples. Willow species, CO2, soil water treatments and genotype nested within species were considered as fixed effects. The data were subjected to analyses of variance (ANOVA) using the following ANOVA model:
Yijklmn = μ + Bi + Sj +Ck + Wl + SCjk + SWjl + CWkl + SCWjkl +Gm(j) + CGkm(j) + WGlm(j) + CWGklm(j) + eijklmn
where Yijklmn is the dependent seedling trait of the ith greenhouse block, of the jth willow species, of the kth CO2 treatment, of the lth water treatment, of the mth genotype, nth seedling, and μ is the overall mean. Bi is the effect of the ith greenhouse block (i = 1, 2), Sj is the effect of the jth species (j = 1, 2, 3, 4), Ck is the effect of the kth CO2 treatment (k = 1, 2), Wl is the effect of the lth water treatment (l = 1, 2), SCjk is the interaction effect of the jth willow species and the kth CO2 treatment, SWjl is the interaction effect of the jth willow species and lth water treatment, CWkl is the interaction effect of the kth CO2 treatment and the lth water treatment, SCWjkl is the interaction effect of the jth willow species, kth CO2 treatment and lth water treatment, Gm(j) is the effect of the mth genotype nested within the jth willow species, CGkm(j) is the interaction of the kth CO2 treatment and mth genotype nested within the jth willow species, WGlm(j) is the interaction of the lth water treatment and mth genotype nested within the jth willow species, CWGklm(j) is the interaction of the kth CO2 treatment, lth water treatment and mth genotype nested within the jth willow species, and eijklmn is the random error component. Effects were considered statistically significant at the p = 0.05 level, although individual p values are provided so that readers can make their own interpretations. The data satisfied normality and equality of variance assumptions. The general linear model from Systat (Chicago, IL) was used for analysis. Species were tested using Tukey’s mean separation test (p = 0.05). The variance component analysis was conducted using the sum of squares as outlined by ([39] pp. 55–57) Genotype is nested within species, but when we discuss genotype (species) we will refer to this as the clone effect.
For the 2018 FERT x CO2 chlorophyll pigment experiment, (2) and the macronutrient analysis there were 64 samples. The 2017 macronutrient analysis was on 64 samples using the same model substituting water for FERT treatments. Willow species, CO2 and soil FERT treatments were all considered as fixed effects. The data were subjected to analyses of variance (ANOVA) using the following ANOVA model:
Yijklm = μ + Bi + Sj +Ck + Fl + SCjk + SFjl + CFkl + SCFjkl + eijklm
where Yijklm is the dependent seedling trait of the ith greenhouse block, of the jth willow species, of the kth CO2 treatment, of the lth FERT treatment, of the mth seedling, and μ is the overall mean. Bi is the effect of the ith greenhouse block (i = 1, 2), Sj is the effect of the jth species (j = 1, 2, 3, 4), Ck is the effect of the kth CO2 treatment (k = 1, 2), Fl is the effect of the lth FERT treatment (l = 1, 2), SCjk is the interaction effect of the jth willow species and the kth CO2 treatment, SFjl is the interaction effect of the jth willow species and lth FERT treatment, CFkl is the interaction effect of the kth CO2 treatment and the lth FERT treatment, SCFjkl is the interaction effect of the jth willow species, kth CO2 treatment and lth FERT treatment. and eijklm is the random error component.
We examined the relationship between TCC and maximum carboxylation efficiency (Vcmax) from 31 to leaf N under CO2, soil moisture stress and fertilizer treatments. To assist interpretation, covariate analysis was used to evaluate relationships among TCC, Vcmax in relations to leaf N concentration. The Covariate methodology is described previously [38]. Results were considered statistically significant at p = 0.10 due to fewer (8) data points, although individual p values are provided for all traits so that readers can make their own interpretations of significance.

7. Results

There were no soil nutrient differences between FERT and NOFERT for organic matter, C, N, CN ratio, Ca, Na, and S (Table 2). FERT soil nutrient traits were greater than NOFERT for K, Mg, and P. NOFERT had higher pH than FERT with 6.8 and 6.2, respectively. The 2017 CO2 × water stress treatments ANOVA results for chlorophyll a, b and TCC appear in (Table 3). The three traits followed the same trend and thus only TCC findings are presented below. The 2018 CO2 × water stress treatments ANOVA results are similar to the 2017 findings and are found in supplementary section (Table S1). There were often significant clone effects, but no significant clone × CO2, clone × water or clone × CO2 × water interactions. The significant species clonal results are presented in a separate section below, rather than repeat results for each parameter.

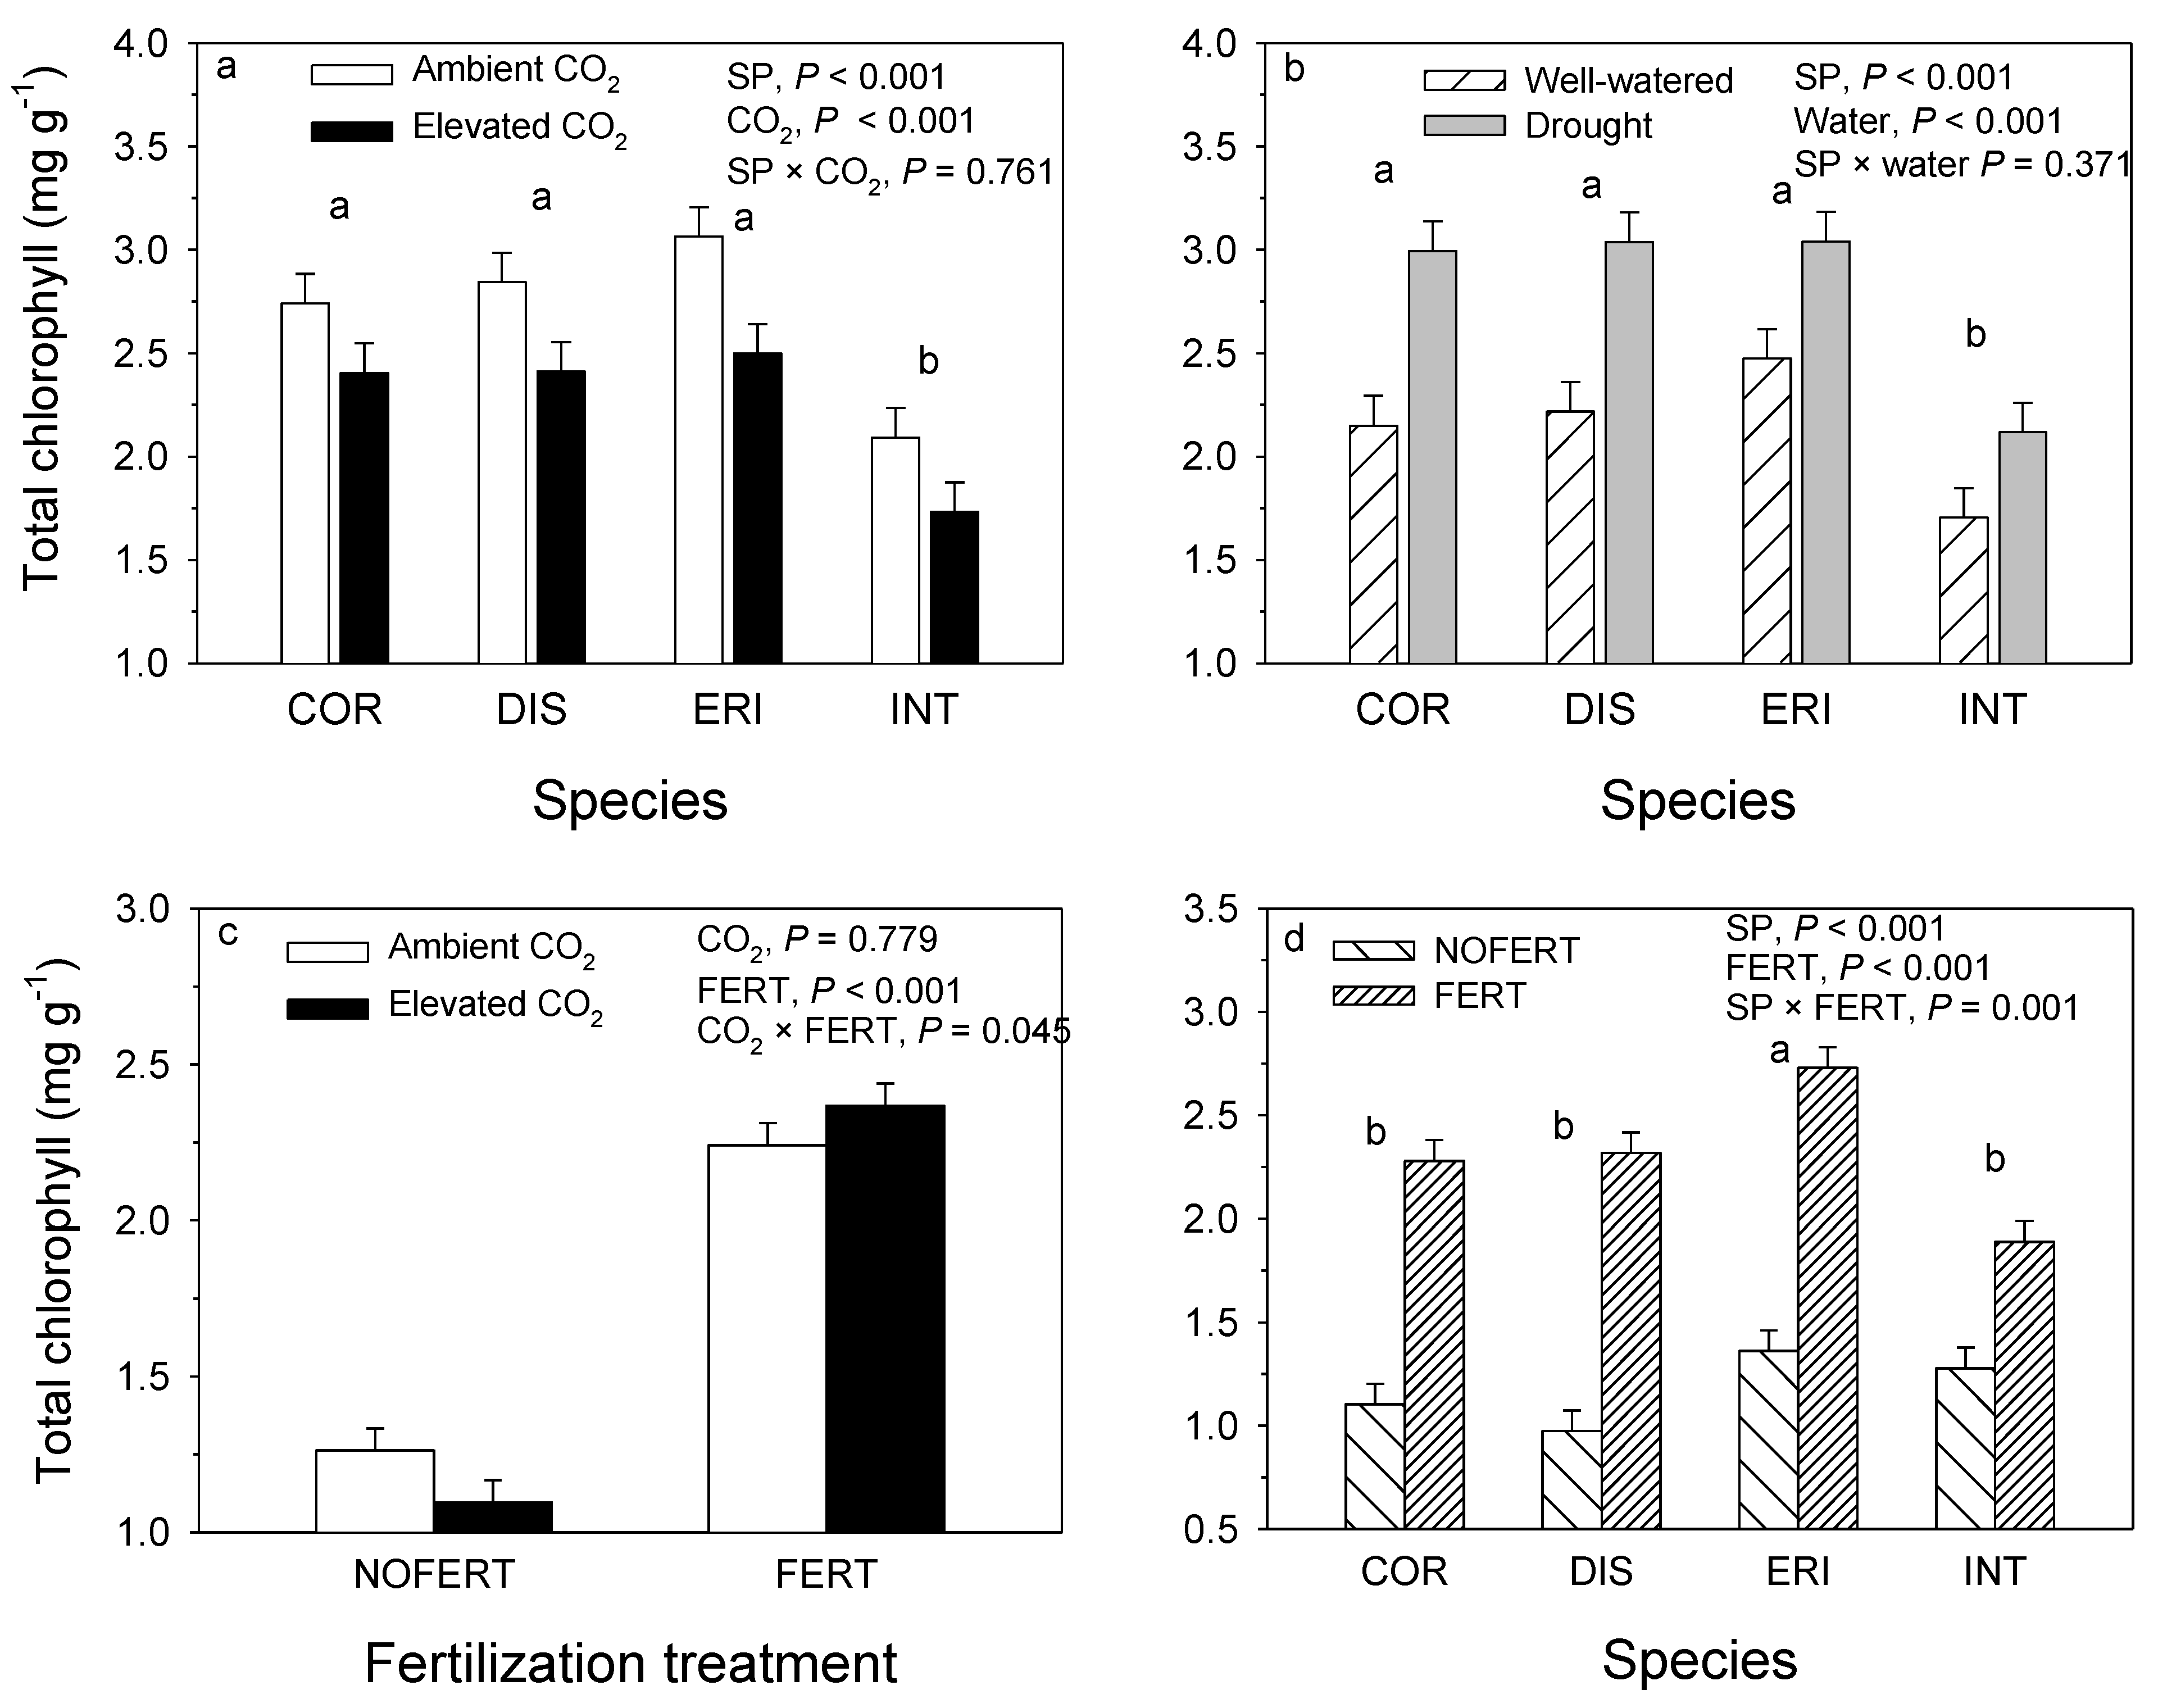
8. Chlorophyll and Carotenoid Content

From the 2017 CO2 x water experiment, there were significant differences in TCC, for the effects of species, CO2, water, clones and the water x CO2 interaction which accounted for 17.9, 7.9, 18.2 and 8.6% of the total variation (Table 3), respectively. Overall, COR, DIS and ERI were not significantly different with an average of 2.65 versus INT, which was the lowest at 1.91 mg g−1, 28% less in TCC. All four species downregulated TCC under eCO2 with an average decrease in 16% (Figure 1a). Drought increased TCC for all species on average by 31% (Figure 1b). The water x CO2 interaction was a result eCO2 mitigating the drought effect.
In the 2018 CO2 × FERT experiment, variation in TCC was significant for species and FERT effects and the species × FERT, CO2 × FERT and species × FERT × CO2 interactions (Table 4). In the three-way interaction, INT did not respond to the FERT × CO2 interaction in the same way as the other three species (Figure 1c). The species × FERT interaction as seen in Figure 1d, were a magnitude effect, TCC responded less to FERT in INT than it did in the other species to FERT. The CO2 × FERT interaction was a rank change; under no FERT, TCC decreased in response to eCO2 (Figure 1c), whereas, under FERT, TCC increased in response to eCO2. Overall, there was a strong and significant increase in TCC in response to FERT from 1.24 to 2.39 mg g−1 or a 92% increase (Figure 1d).

9. Carotenoid Content

In CAR content from the 2017 CO2 x water experiment, species, CO2, water and clone effects and water x CO2 interaction were significant accounting for 21.2, 8.2, 21.0 and 3.2% of the total variation (Table 3). Overall, species CAR were quite different: ERI had the greatest CAR, followed by DIS, then COR, followed by INT with the lowest CAR at 370, 337, 316 and 254 ug g−1, respectively (Figure 2a). All four species showed CAR downregulation in response to eCO2 with an average decrease in 15%. Drought increased CAR for all species an average of 30% (Figure 2b). The water x CO2 interaction resulted from eCO2 mitigating the drought effect.
In the 2018 CO2 × FERT experiment, variation in CAR was significant for species and FERT effects and for the interactions of species × FERT, CO2 × FERT and species x FERT x CO2 (Table 4). The CO2 × FERT was a rank change interaction, similar to that described above and seen in Figure 1c. The species × FERT interaction as seen in Figure 2c is a magnitude effect: in INT, the CAR response is lower than in the other species to FERT. Overall, there was a significant increase in CAR in response to FERT from 177 to 277 ug g−1 or a 56% increase.

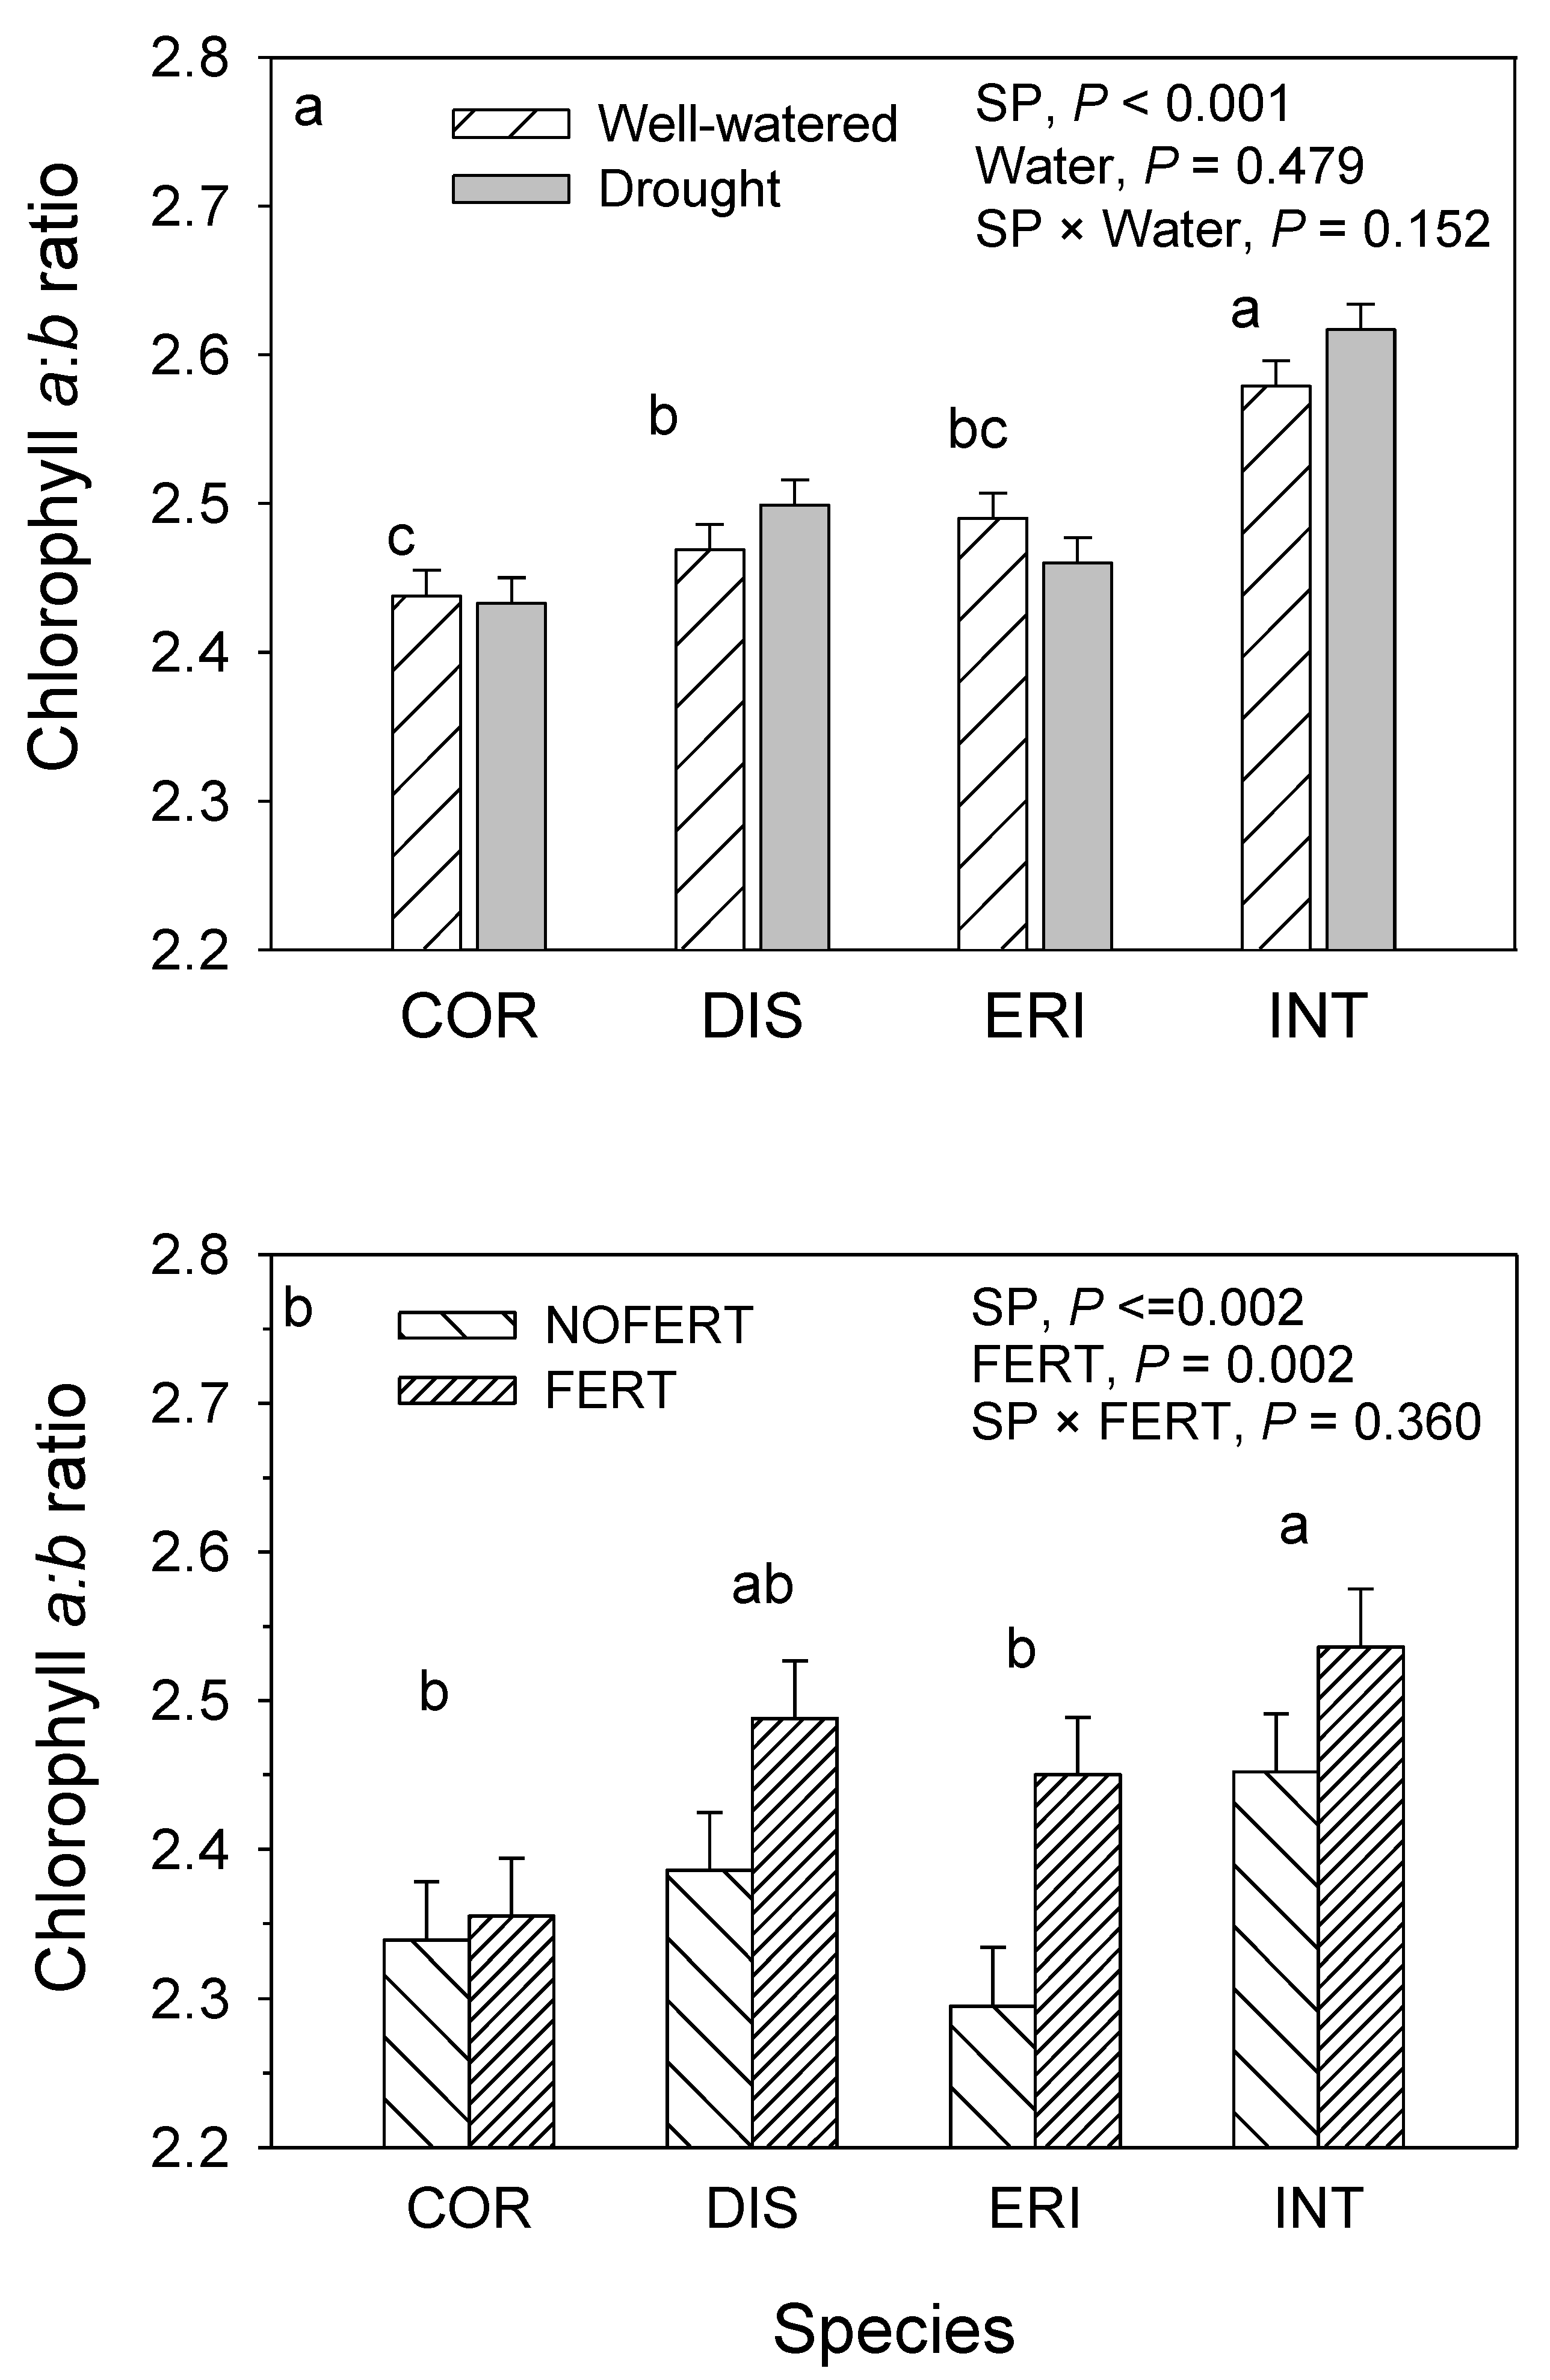
10. Chlorophyll a:b and Chlorophyll to Carotenoid Ratio

From the 2017 CO2 × water experiment, CHLa:b was significant for species and clonal effects accounting for 36.3 and 24.5% of the total variation (Table 3). INT had the greatest CHLa:b ratio at 2.60 compared with DIS and ERI which were similar at 2.48 (Figure 3a). COR had the lowest ratio with 2.43. There were no consistent CO2 or drought effects on CHLa:b ratio. From the 2018 CO2 × FERT experiment, CHLa:b was significant for species and FERT accounting for 20.5 and 12.4% of the total variation (Table 4). INT had the greatest CHLa:b ratio at 2.59, followed by DIS, and then by COR and ERI (Figure 3b).
For the TCC:CAR ratio in the 2017 CO2 x water experiment, species differences had a significant effect as did the CO2 x water interaction accounting for 20.5 and 3.4 % of the total variation (Table 3). COR had the greatest TCC:CAR ratio with 8.2, followed by DIS with 7.8, then ERI and INT with on average 7.4 (Figure 4a). From the 2018 CO2 × FERT experiment, CO2 and FERT effects were significant, accounting for 6.2 and 68.7% of the total variation (Table 4). Elevated CO2 decreased the TCC:CAR ratio (Figure 4b), whereas FERT increased the ratio (Figure 4c).

11. Clonal Variation

In the 2017 CO2 × water experiment, clonal variation of chlorophyll pigments accounted for approximately 8.5% of the total variation (Table 3). There was some variation among clones within each species: for example, DIS clones 3 and 4 (order in Table 1 had greater chlorophyll levels than clones 1 and 2. In COR, Clones 1 and 2 were greater than clones 3 and 4; in ERI, clone 4 was lower than the other three clones. For CHLa:b ratio clonal variation accounted for 24.5% of the total variation (Table 3).

12. Leaf Macronutrients

From the 2017 CO2 × DRT experiment, species, CO2 and water main effects were significant for leaf N accounting for 14.7, 13.1 and 20.6% of the total variation (Table 5). INT had significantly greater leaf N than the other three species, by on average 22% (Figure 5a). All willow species showed a significant leaf N downregulation in response to eCO2, which averaged 15.8%. All willow species showed on average a 24% leaf N upregulation in response to DRT (Figure 5b). From the 2018 CO2 x FERT experiment, species, CO2 and FERT main effects were significant for leaf N accounting for 2.6, 0.6 and 89.6% of the total variation (Table 6). INT had significantly greater leaf N than the other three species, by on average 20% (Figure 5c). All willow species showed a significant leaf N downregulation in response to eCO2, which averaged 8.4%. All willow species showed on average a 326% leaf N upregulation in response to FERT (Figure 5d).
From the 2017 CO2 × DRT experiment, leaf K was significant for species and DRT accounting for 19.2 and 36.4% of the total variation (Table 5). INT had significantly greater K than the other three species, by on average 27.6%. Leaf K declined for all species on average by 27.8 in response to DRT. From the 2018 CO2 × FERT experiment, species and FERT effects and the species × FERT and CO2 × FERT interactions were significant, accounting for 43.9, 7.3, 6.7 and 3.7% of the total variation (Table 6). Overall, INT and COR, with 2.11 and 1.95%, had greater K than DIS and ERI with 1.47 and 1.43% K, respectively. The species × FERT effect was a result of COR, DIS and ERI showing an increase in K in response to FERT, but INT showed no change. Overall, FERT and NO FERT treatments had1.86 and 1.62% K, respectively. The CO2 × FERT interaction was the result of FERT mitigating the eCO2 downregulation under NO FERT.
From the 2017 CO2 × DRT experiment, leaf Ca was significant for water and CO2 × water interaction accounting for 7.7 and 6.7% of the total variation (Table 5). Leaf Ca decreased under DRT by 9.6%. The CO2 × water interaction was the result of increase in leaf Ca in response to DRT under eCO2, but unchanged under aCO2. From the 2018 CO2 × FERT experiment, species and FERT accounted for 22.8 and 28.1% of the total variation (Table 6). COR and DIS were greater than ERI and INT with 2.04, 2.05, 1.76 and 1.52, respectively. FERT increased leaf Ca by 30.6%.
From the 2017 CO2 × experiment, leaf Mg was significant for species and water effects accounting for 59.5 and 5.5% of the total variation (Table 5). COR had the greatest leaf Mg followed by ERI and INT and DIS with the lowest values at 0.376, 0.308, 0.245 and 0.240, respectively (Figure 6a). DRT increased leaf Mg for all species on average by 12.4% (Figure 6b). From the 2018 CO2 × FERT experiment, species and FERT effects and the species x FERT interaction were significant (Table 6). Overall, COR had the greatest leaf Mg followed by INT and ERI and with DIS at the lowest with 0.283, 0.203, 0.188, 0.150%, respectively (Figure 6c). The species x FERT interaction was the result of an increase in leaf Mg for DIS and ERI, but unchanged for COR and INT (Figure 6d). Overall FERT and NOFERT treatments had 1.86 and 1.62% Mg, respectively.
From the 2017 CO2 × DRT experiment, leaf Na was only significant for species accounting for 21% of the total variation (Table 5). INT was significantly greater than the other three willows with 0.016 and 0.005% Na, respectively. From the 2018 CO2 × FERT experiment, species and the CO2 × FERT interaction were significant, accounting for 25.3 and 3.8% of the total variation (Table 6). INT was significantly greater than the other three willows with 0.012 and 0.004% Na, respectively.

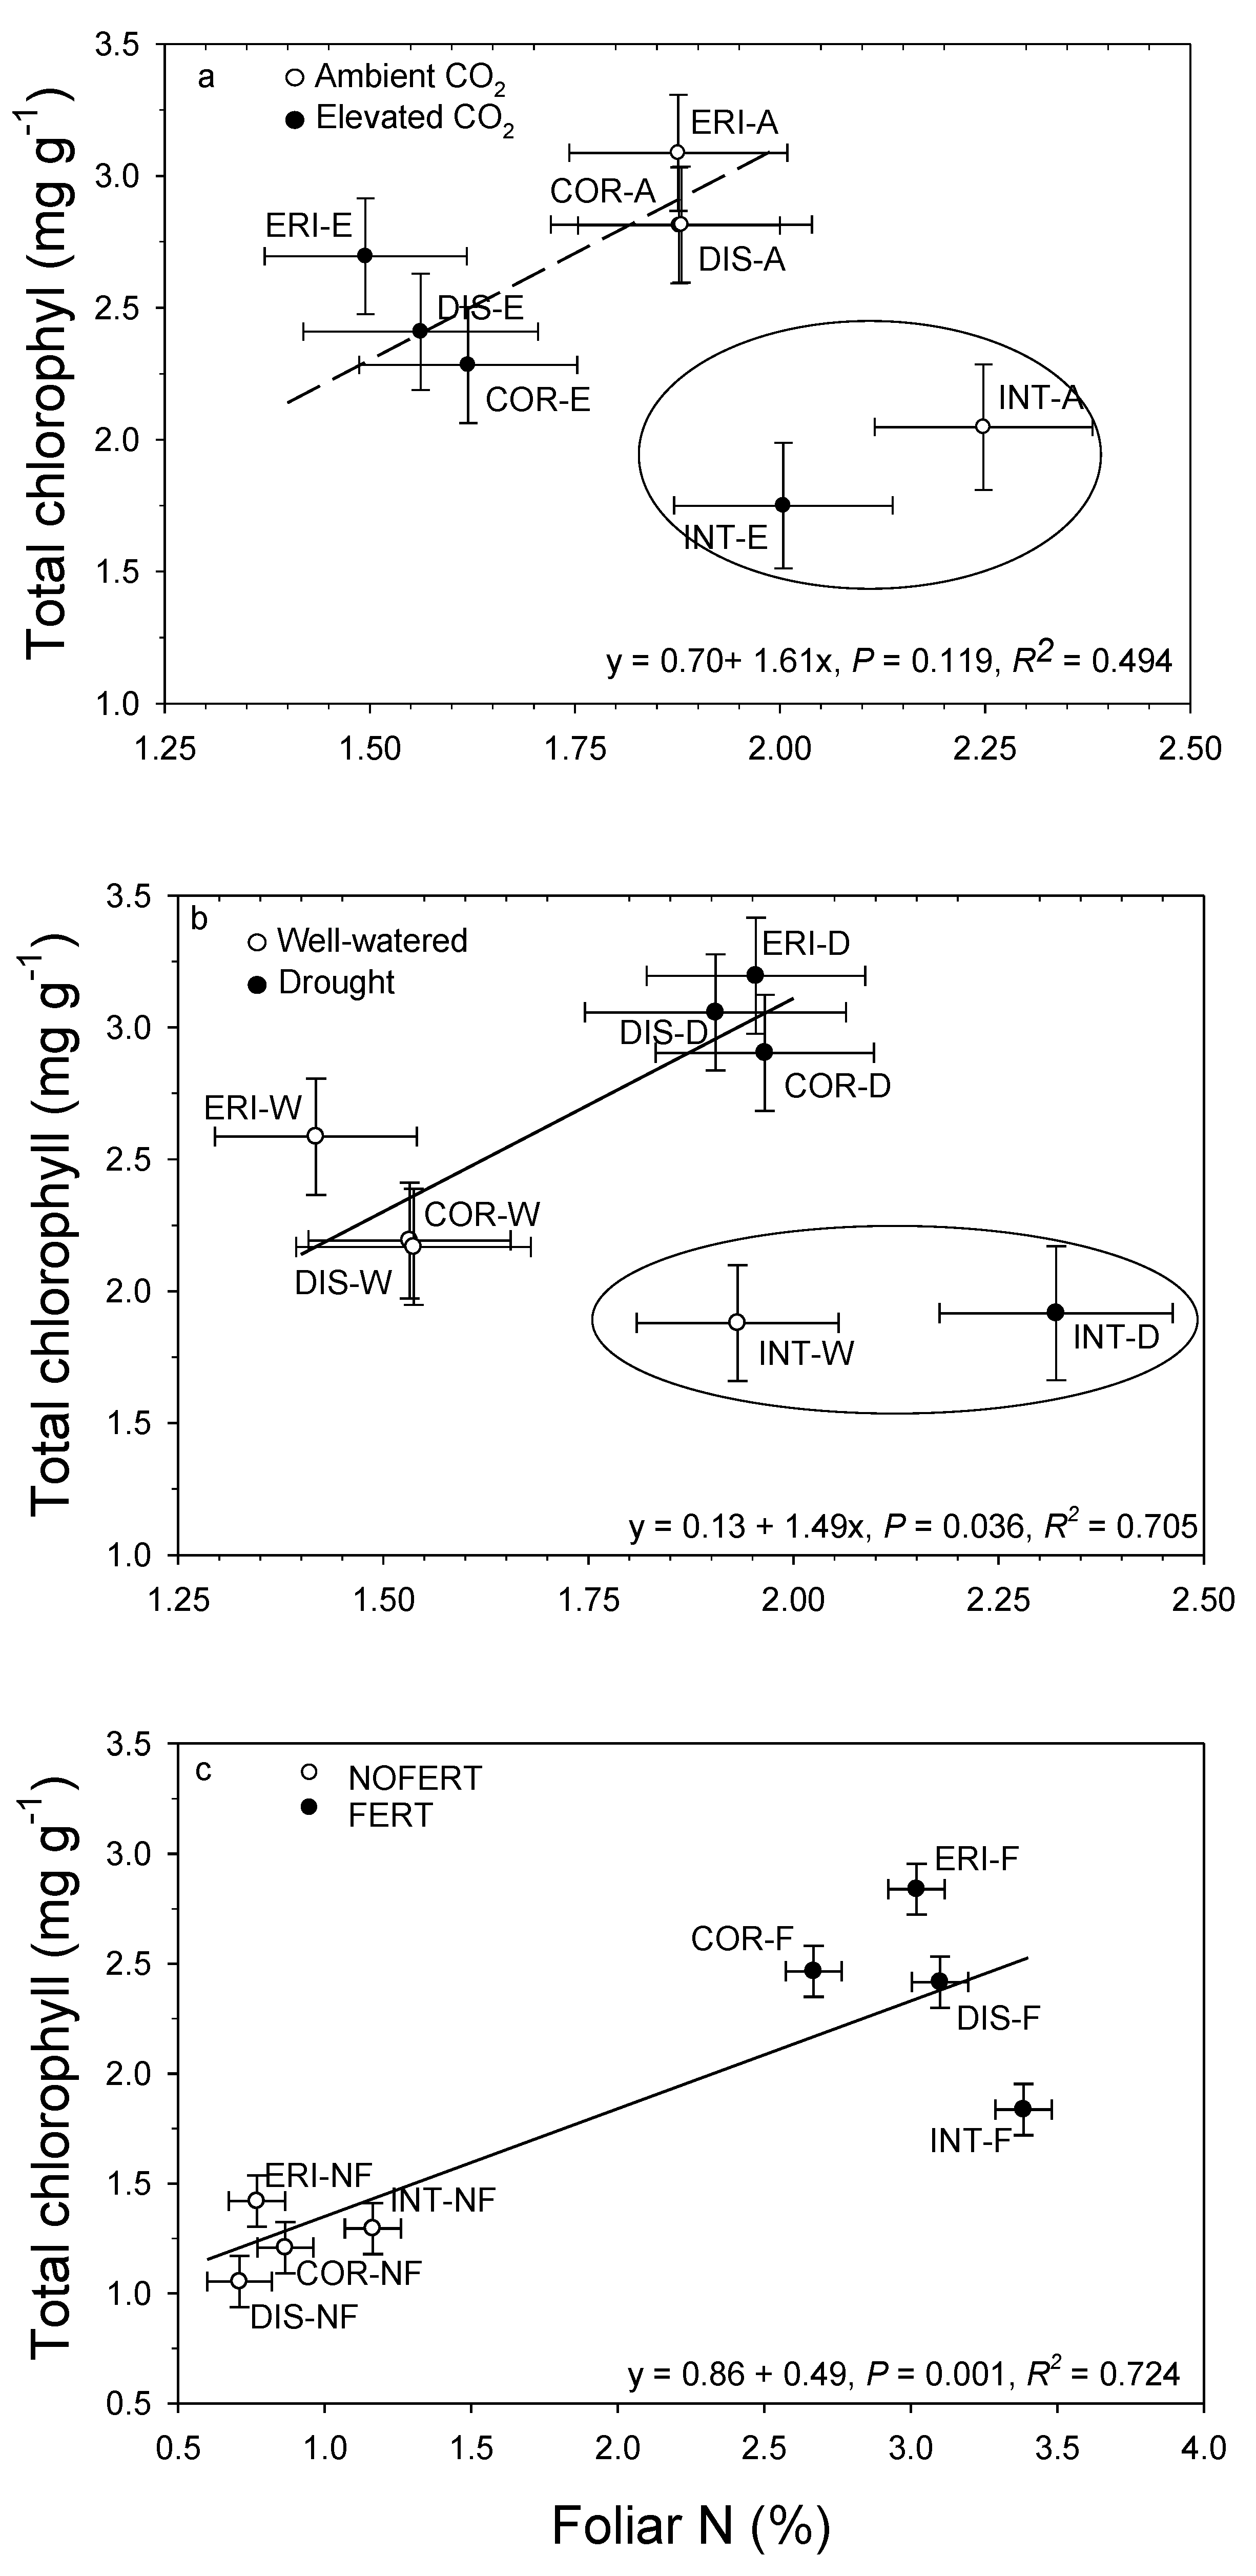
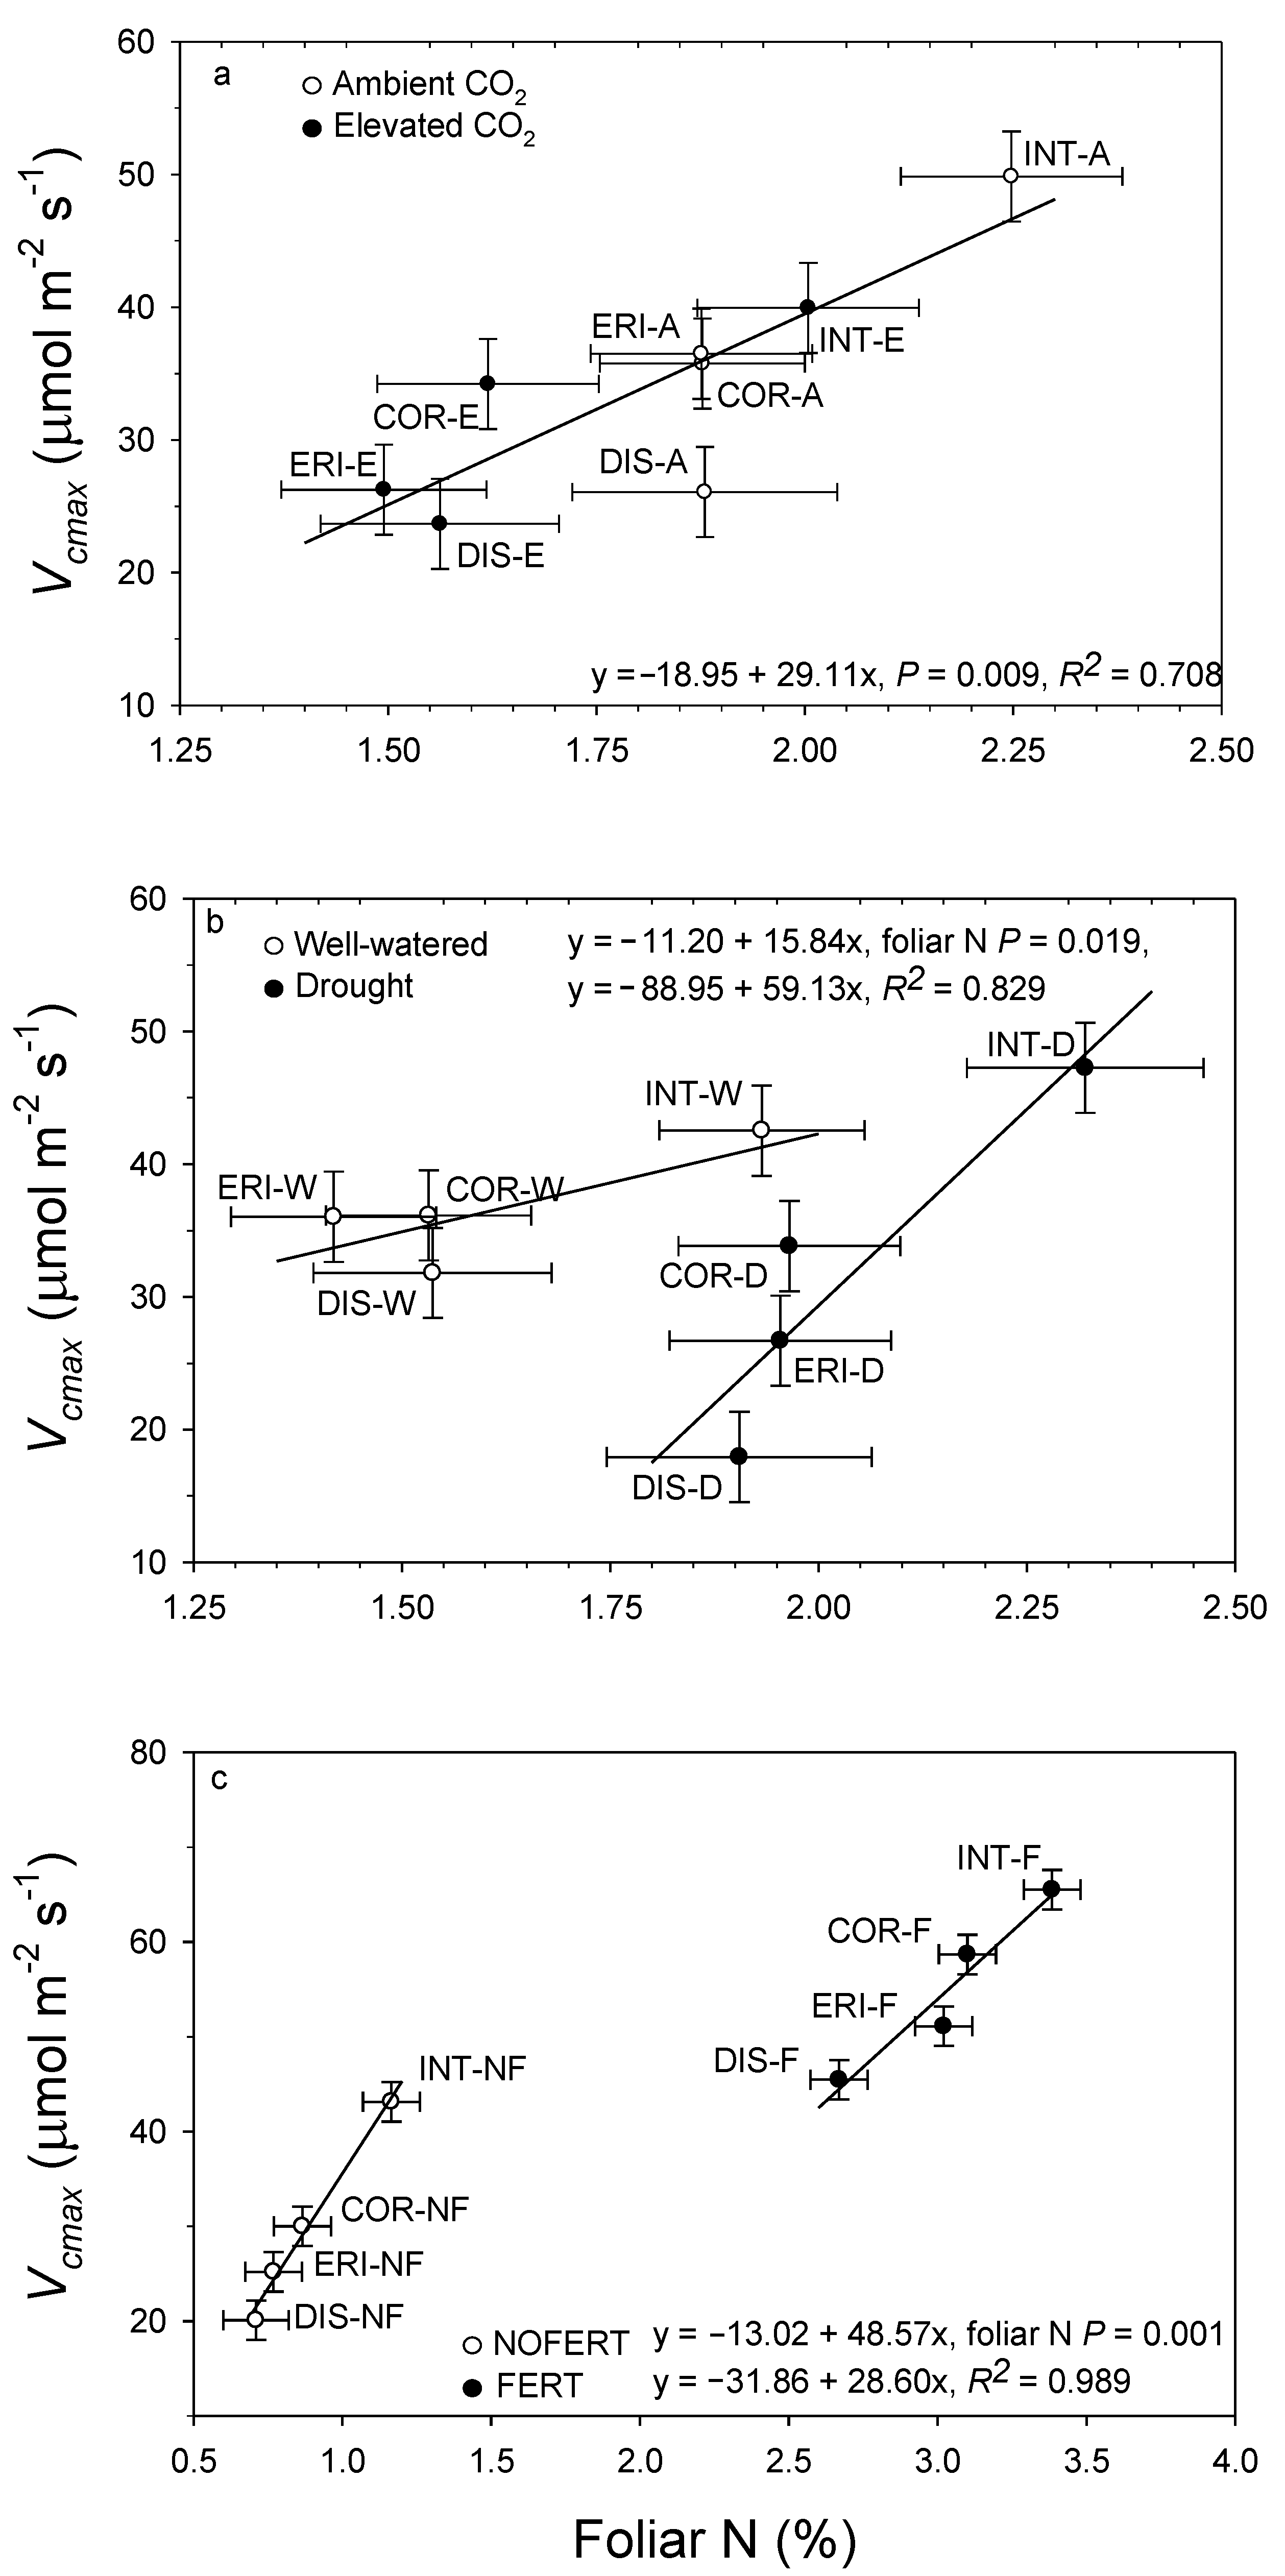
13. Interrelationships

Mean willow species TCC to leaf N for CO2 treatments appear in Figure 7a. There is a substantial INT separation (circled) from the other three willow species. The regression line for the other three willow species is not significant (broken line) but shows the CO2 treatment downregulation trend. Mean willow species TCC to leaf N for soil moisture treatments also show a substantial INT separation from the other three willow species (Figure 7b). There is a significant soil-moisture regression line showing the upregulation of both in response to drought. Mean willow species TCC to leaf N for NOFERT and FERT treatments show two groupings based on FERT treatments (Figure 7c). There is a significant regression line showing an upregulation of both traits in response to FERT.
Covariate analysis of 2017 Vcmax in relation to leaf N for CO2 treatments showed no significant CO2 × leaf N interaction (p = 0.455) nor CO2 effect (p = 0.371). As a result, there is one single positive line (Figure 8a). Covariate analysis of 2017 Vcmax in relation to leaf N for soil moisture treatments showed a significant soil moisture x leaf N interaction (p = 0.092), significant soil moisture effect (p = 0.053) and leaf N (p = 0.019), thus there are two separate lines for soil moisture treatments with different slopes (Figure 8b). Covariate analysis of 2018 Vcmax in relation to leaf N for FERT treatments showed a significant FERT × leaf N interaction (p = 0.062). As a result, there are two separate lines with different slopes (Figure 8c).

14. Discussion

There are several consistent findings for chlorophyll pigment and macronutrient parameters between the two years and two experiments. First, chlorophyll pigments and leaf N downregulated in response to eCO2 in both years for all four willow species. After an extensive review, there is not much in the scientific literature on willow regarding chlorophyll pigment and leaf N responses to eCO2 ([30]: used a European cross/genotype Salix x dasyclados under CO2 and N treatments). There are however, some publications on willow responses to eCO2: biochemical efficiencies [31] and gas exchange [30,31,32,33]. Photosynthesis appears to be downregulated in response to eCO2 [30,31], but [32,33] reported increased photosynthesis in response to eCO2. This discrepancy in the literature is probably related to a measurement date effect. We know that the short-term response to an increase in CO2 stimulates assimilation (A) [7,40]. However, there can also be a corresponding assimilation downregulation (Adr), expressed as a decrease in photosynthesis and related traits in response to eCO2 with time [9,10,11,12]. We found that all four willows downregulate from the maximum rate of carboxylation (Vcmax) and assimilation at 600 ppm (A600) [31], consistent with chlorophyll pigment downregulation. The chlorophyll downregulation is underlying the performance based Vcmax downregulation.
The corresponding leaf N downregulation, the only macronutrient to downregulate in eCO2, reflects the chlorophyll pigment downregulation. However, there is a strong species component for both traits reflected by the large component of variance for these traits. This is primarily due to differential INT response compared to the other three willow species for chlorophyll pigment and leaf N concentrations (Figure 1, Figure 5 and Figure 7). At first, these results may appear contradictory; INT has greater leaf N, but a lower chlorophyll pigment concentration than the other three willows. However, this may simply indicate a unique species response (more on this later). In a similar study illustrating leaf N levels with a strong species effect, despite large plant size differences, equal amounts of fertilizer demonstrated that red pine (Pinus resinosa) and pitch pine (P. rigida) had similar needle N concentrations while being at the opposite ends of the biomass size scale [38]. Red pine was the smallest pine and the second smallest of the eight pine and spruce species tested, whereas pitch pine was overall the largest of these eight species.
TCC appears negatively related to leaf N within a treatment (Figure 7), but this is not consistent with the literature [38,41]. In fact, INT has shown a number of unique and differential species responses under saline and drought stress [28,38]. In a saline stress experiment under control (CTL) and medium and high salinity treatments (MST and HST, target EC = 1.5 and 3.0 mS cm−1, respectively), all DIS and ERI plants expired under HST, but 33% of INT plants survived [34]. For DIS and ERI, total aboveground (AG) dry mass decreased from CTL to MST, whereas AG dry mass for INT increased slightly in MST and increased further in HST. In addition, INT had greater Vcmax than DIS and ERI and increased Vcmax under saline stress treatments [29]. In a drought response test, Vcmax was lower under DRT for COR, DIS and ERI, but 16.5% greater for INT under DRT compared to WW [31]. Drought response has a similar physiological effect as saline response in that both conditions induce moisture stress in plants, and both require cellular osmotic adjustment to withstand the stress. The greater drought and saline tolerance of INT may reflect its evolutionary origins in the arid Southwest USA and Mexico [42,43,44] where high evapotranspiration may increase drought and soil salinity (see [45] and references therein) and result in a natural selection for increased drought and saline tolerance. The exact cause of the greater INT drought tolerance could be due to changes to the hydraulic architecture of the xylem and thus greater hydraulic conductivity [46] or as a result of greater osmotic adjustment [47,48].
The TCC and leaf N downregulation in response to eCO2 is a response to a greater supply of a resource (CO2). The TCC downregulation and the thus the leaf N downregulation is probably in response to the accumulation of nonstructural carbohydrates in an eCO2 environment. This is often associated with, and commonly interpreted as, evidence of a lack of sink activity [49] This supports the theory of sink regulation (biomass growth or lack thereof) of photosynthetic traits, in this case TCC [38,49].
Our preliminary biomass data showed no CO2 effect on willow total aboveground dry mass after the first year of growth in 2017 (p = 0.214, Major and Mosseler unpublished). [50] found that fertilization of eCO2 plots restored eCO2 growth in forest species, and [10] found fertilization reversed photosynthetic downregulation. Thus, we decided to add a fertilizer x CO2 experimental component in 2018 on a subset of fully irrigated treatments to see if we could observe a CO2 effect under FERT. This change resulted in a mitigation of the biochemical downregulation found in 2017 in response to eCO2 [31]. This was doubtless driven by the FERT effect on biomass accumulation which resulted in a significant (p = 0.049) increase in stem dry mass and CO2 x fertilizer interaction (Major and Mosseler unpublished). As in 2017, there was no stem dry mass difference between aCO2 and eCO2 under NOFERT in 2018 with 11.8 and 10.7 g, respectively. However, under the FERT treatment, stem dry mass was 20.0 and 25.3 g under aCO2 and eCO2, respectively. Thus, nutrient limitation caused the lack of eCO2 effect on willow growth in 2017.
TCC and leaf N increased, in response to FERT by 92 and 326%, respectively, for all four willow species. Note that the soil nutrients were the same or just slightly higher under FERT compared to UNFERT, hence most newly available nutrients were absorbed by the willows. In a companion study, FERT increased Vcmax, A600, by 86 and 91%, respectively [31]. This seems to be a direct reflection of the increase in TCC. As found for Phoebe boumei seedlings FERT alleviates photosynthetic decline in response to eCO2 [12].
Chlorophyll pigments, leaf N and Mg increased (the only macronutrients to increase) in response to drought for all four willow species. Each chlorophyll a and b molecule require four N and one Mg. There was a greater slope of TCC to needle N than Mg which reflects the four to one ratio difference in the chlorophyll requirement [38]. In a multi-species, inter-specific, study of shrub willows under drought treatment, leaf Soil Plant Analysis Development (SPAD) measurements, which measures chlorophyll as a proxy for leaf N, the willows were unaffected by water stress treatments [51]. Using 200 willow genotypes, ref. [52] found that greater leaf N in response to drought was frequently observed in drought-exposed plants and may be seen as an acclimation to water stress [53,54,55]. This acclimation enables plants to make better use of the available N resources when leaf area and stomatal conductance are greatly reduced [55,56]. Contrary to the above, Salix nigra in response to periodic soil moisture stress had a significant reduction in leaf chlorophyll content by 15%, which was not as severe as the photosynthetic and stomatal conductance reduction with 32 and 55% reduction, respectively, observed by [57]. In conifers, it appears that chlorophyll pigments either remain the same or decline depending on the severity of drought [38,58,59].
For green mass and stem number for seven willow species including two willow tree species, species effect accounted for 30 and 39% of the variation, and clone accounted for 12 and 11% of the variation, respectively [60]. In addition, population accounted for 12 and 8% of the variation for green mass and stem number, respectively. For chlorophyll and leaf nutrient, species was almost always significant accounting for a large part of the total variation However, clonal nested within species had about the same or less amount of total variation as morphological traits but was not always significant. Note, in Expt. 1, species and clones were the only significant sources of variation for CHLa:b ratio, accounting for just over 60% of variation, demonstrating a very strong genetic control. INT had the greatest CHLa:b ratio compared to the other three willow species. There were no water or CO2 treatment effects. In experiment 2, species and FERT had significant effects, with INT once again having the greatest CHLa:b ratio. There have been reports that in response to eCO2 spruces show a decline in CHLa:b ratio [38,61]. All four willows showed a decline in TCC:CAR ratio in response to eCO2; a result of a greater TCC decline than CAR decline in response to eCO2. TCC:CAR ratio increased in response to DRT and FERT due to a greater increase in TCC than in CAR.
Similar to our findings, needle nutrient analyses of Pinus sylvestris showed that N significantly declined in response to eCO2 while K, Ca and Mg remained the same [62]. As discussed above, TCC, leaf N and Mg upregulated in response to DRT. In addition, leaf P, K and Ca downregulated in response to DRT. This often happens with these macronutrients as feedback to water shortage and leads to stomatal regulation and reduction in the transpiration—driven water flow required for most nutrient uptake [63]. These macronutrient responses to DRT can be very genus or species dependent [38,63,64]. Interestingly, leaf Na uptake was greater in INT than the other three willow species. This was also found in another salinity study compared with only DIS and ERI [28]. In a review of the physiological mechanism of saline tolerance, the absorption of Na+ into cellular vacuoles may increase osmotic potential in a saline environment [65]. The subsequent soil analysis showed very low levels of nutrients under NOFERT. In addition, soil analysis of the FERT treatments in 2018 showed no difference between FERT and NOFERT, particularly for soil N. Thus, everything supplied by the FERT treatment was taken up by the fertilized willows.

15. Application

Shrub willow species show rapid early growth, particularly after coppicing, and have become a promising group of species for biomass production and as energy crops [26,27,66]. Some willows do have a symbiotic relationship with diazotrophic endophytes in the stem that provide N to the plant in exchange for carbohydrates [67,68]. In the present study, we provided only two pulses of fertilizer early in the first year, assuming that endophytic bacteria would be present under both CO2 treatments. However, it is now apparent that N fixation was either too low or that not enough other essential soil nutrients were present to allow the plants to take advantage of the eCO2 treatment. With increasing atmospheric CO2, if a site is nutrient-poor, or that plants lack the necessary endophyte associations, the addition of soil nutrients or endophytes can result in a synergistic effect to sequester more available carbon dioxide due to the effects of N limitation.
In addition, INT appears to be more drought and saline tolerant compared to the three other willows. INT and its closest relatives in the taxonomic section Longifoliae (6 or 7 species) are also unique among willow species for their ability to easily form new stems via stem sprouts from a network of shallow roots, resulting in multi-stemmed colonies [27,69]. The rapid growth, high biomass yields, and ease of vegetative (clonal) propagation of INT from unrooted stem sections may also be of interest for establishing biomass feedstock for bioenergy, chemicals, and materials industries, especially on marginal land with salinity issues or prone to periods of drought.

Supplementary Materials

The following supporting information can be downloaded at: https://www.mdpi.com/article/10.3390/f14010042/s1, Table S1. 2018 CO2 x soil moisture experiment: chlorophyll trait variance components and ANOVAs including source of variation, degrees of freedom (df), mean square values (MS), variance component (VC), p values, and coefficient of determination (R2). p values < 0.05 are in bold print.

Author Contributions

J.E.M. designed the experiment and was lead author; A.M. contributed to the analyses and writing of the manuscript; and J.W.M. contributed by managing the experiment, analyses and writing of the manuscript. All authors have read and agreed to the published version of the manuscript.

Funding

This research received no external funding.

Conflicts of Interest

The authors declare no conflict of interest.

References

  1. Jach, M.E.; Ceulemans, R. Effects of season, needle age and elevated atmospheric CO2 on photosynthesis in Scots pine (Pinus sylvestris). Tree Physiol. 2000, 20, 145–157. [Google Scholar] [CrossRef] [PubMed] [Green Version]
  2. Barsi, D.C.; Major, J.E.; Mosseler, A.; Campbell, M. Genetic variation and control of chloroplast pigment concentrations and related needle-level traits in Picea rubens, Picea mariana, and their hybrids: Moisture and light environmental effects. Trees 2009, 23, 555–571. [Google Scholar] [CrossRef]
  3. Minocha, R.; Martinez, G.; Lyons, B.; Long, S. Development of a standardized methodology for quantifying total chlorophyll and carotenoids from foliage of hardwoods and conifer tree species. Can. J. For. Res. 2009, 39, 849–861. [Google Scholar] [CrossRef]
  4. Li, Y.; He, N.; Hou, J.; Xu, L.; Liu, C.; Zhang, J.; Wang, Q.; Zhang, X.; Wu, X. Factors influencing leaf chlorophyll content in natural forests at the biome scale. Front. Ecol. Evol. 2018, 6, 64. [Google Scholar] [CrossRef] [Green Version]
  5. Malavasi, U.C.; Malavasi, M.M. Leaf characteristics and chlorophyll concentration of Schyzolobium parahybum and Hymenaea stilbocarpa seedlings grown in different light regimes. Tree Physiol. 2001, 21, 701–703. [Google Scholar] [CrossRef] [Green Version]
  6. Behera, R.; Mishra, P.C.; Choudhury, N.K. High irradiance and water stress induce alterations in pigment composition and chloroplast activities of primary wheat leaves. J. Plant Physiol. 2002, 159, 967–973. [Google Scholar] [CrossRef]
  7. Wertin, T.M.; McGuire, M.A.; Teskey, R.O. The influence of elevated temperature, elevated atmospheric CO2 concentration and water stress on net photosynthesis of loblolly pine (Pinus taeda L.) at northern, central and southern sites in its native range. Glob. Chang. Biol. 2010, 16, 2089–2103. [Google Scholar] [CrossRef]
  8. Ellsworth, D.S.; Thomas, R.; Crous, K.Y.; Palroth, S.; Ward, E.; Maier, C.; Delucia, E.; Oren, R. Elevated CO2 affects photosynthetic responses in canopy pine and subcanopy deciduous trees over 10 years: A synthesis from Duke FACE. Glob. Chang. Biol. 2012, 18, 223–242. [Google Scholar] [CrossRef]
  9. Ellsworth, D.S.; Reich, P.B.; Nauburg, E.S.; Koch, G.W.; Kubiske, M.E.; Smith, S.D. Photosynthesis, carboxylation and leaf nitrogen responses of 16 species to elevated pCO2 across four free-air CO2 enrichment experiments in forest, grassland and desert. Glob. Chang. Biol. 2004, 10, 2121–2138. [Google Scholar] [CrossRef] [Green Version]
  10. Crous, K.Y.; Walters, M.B.; Ellsworth, D.S. Elevated CO2 concentration affects leaf photosynthesis—Nitrogen relationships in Pinus teada over nine years in FACE. Tree Physiol. 2008, 28, 607–614. [Google Scholar] [CrossRef]
  11. Major, J.E.; Mosseler, A.; Malcolm, J.W. Genetic variation among pines and spruces in assimilation efficiencies and photosynthetic regulation under elevated CO2. Trees Struct. Funct. 2018, 32, 215–229. [Google Scholar] [CrossRef]
  12. Wang, X.; Wei, X.; Wu, G.; Chen, S. High Nitrate or Ammonium Applications Alleviated Photosynthetic Decline of Phoebe bournei Seedlings under Elevated Carbon Dioxide. Forests 2020, 11, 293. [Google Scholar] [CrossRef] [Green Version]
  13. Luomala, E.M.; Laitinen, K.; Kellomaki, S.; Vapavuori, E. Variable photosynthetic acclimation in consecutive cohorts of Scots pine needles during 3 years of growth at elevated CO2 and elevated temperature. Plant Cell Environ. 2003, 26, 645–660. [Google Scholar] [CrossRef]
  14. Zhou, Y.-M.; Wang, C.-G.; Han, S.-J.; Cheng, X.-B.; Li, M.-H.; Fan, A.-N.; Wang, X.-X. Species-specific and needle age-related responses of photosynthesis in two Pinus species to long-term exposure to elevated CO2 concentration. Trees 2011, 25, 163–173. [Google Scholar] [CrossRef] [Green Version]
  15. Trenberth, K.E.; Dai, A.; van der Schreir, G.; Jones, P.D.; Barichivich, J.; Briffa, K.R.; Sheffield, J. Global warming and changes in drought. Nat. Clim. Chang. 2014, 4, 17–22. [Google Scholar] [CrossRef]
  16. Allen, C.D.; Breshears, D.D.; McDowell, N.G. On underestimation of global vulnerability to tree mortality and forest die-off from hotter drought in the Anthropocene. Ecosphere 2015, 6, 1–55. [Google Scholar] [CrossRef]
  17. Attia, Z.; Domec, J.-C.; Oren, R.; Way, D.A.; Moshelion, M. Growth and physiological responses of isohydric and anisohydric poplars to drought. J. Expt. Bot. 2015, 66, 4373–4381. [Google Scholar] [CrossRef] [Green Version]
  18. Teskey, R.O.; Wertin, T.; Bauweraerts, I.; Ameye, M.; McGuire, M.A.; Steppe, K. Responses of tree species to heat waves and extreme heat events. Plant Cell Environ. 2015, 38, 1699–1712. [Google Scholar] [CrossRef]
  19. Duan, H.; O’Grady, A.P.; Duursma, R.A.; Choat, B. Drought responses of two gymnosperm with contrasting stomatal regulation under elevated CO2 and temperature. Tree Physiol. 2015, 35, 756–770. [Google Scholar] [CrossRef] [Green Version]
  20. Maathuis, F.J.M. Physiological functions of mineral macronutrients. Curr. Opin. Plant Biol. 2009, 12, 250–258. [Google Scholar] [CrossRef]
  21. Major, J.E.; Barsi, D.C.; Mosseler, A.; Campbell, M. Genetic variation and control of chloroplast pigment content in Picea rubens, Picea mariana, and their hybrids. I. Under ambient and elevated CO2 environments. Tree Physiol. 2007, 27, 353–364. [Google Scholar] [CrossRef] [PubMed] [Green Version]
  22. Finzi, A.C.; Borby, R.J.; Calfapietra, C. Increases in nitrogen uptake rather than nitrogen-use efficiency support higher rates of temperate forest productivity under elevated CO2. Proc. Natl. Acad. Sci. USA 2007, 104, 14014–14019. [Google Scholar] [CrossRef] [PubMed] [Green Version]
  23. Major, J.E.; Mosseler, A.; Barsi, D.C.; Campbell, M. Comparative nutrient economy, stable isotopes, and related adaptive traits in Picea rubens, Picea mariana, and their hybrids. Trees 2007, 21, 677–692. [Google Scholar] [CrossRef]
  24. Mellert, K.H.; Gottlein, A. Comparison of new foliar nutrient thresholds derived from van den Burg’s literature compilation with established central European references. Eur. J. For. Res. 2012, 131, 1461–1472. [Google Scholar] [CrossRef]
  25. Lukac, M.; Calfapietra, C.; Lagomarsino, A.; Loreto, F. Global climate change and tree nutrition: Effects of elevated CO2 and temperature. Tree Physiol. 2010, 30, 1209–1220. [Google Scholar] [CrossRef] [PubMed] [Green Version]
  26. Mosseler, A.; Zsuffa, L.; Stoehr, M.U.; Kenney, W.A. Variation in biomass production, moisture content, and specific gravity in some North American willows (Salix L.). Can. J. For. Res. 1988, 18, 1535–1540. [Google Scholar] [CrossRef]
  27. Mosseler, A.; Major, J.E. Clonal variation in coppiced and uncoppiced growth, root sprout stem formation, and biomass partitioning in Salix interior on two highly disturbed site types. Can. J. For. Res. 2022, 52, 148–157. [Google Scholar] [CrossRef]
  28. Major, J.E.; Mosseler, A.; Malcolm, J.W. Salix species variation in gas exchange, leaf sodium and nutrient parameters at three levels of salinity. Can. J. For. Res. 2017, 47, 1045–1055. [Google Scholar] [CrossRef]
  29. Major, J.E.; Mosseler, A.; Malcolm, J.W.; Heartz, S. Salinity tolerance of three Salix species: Survival, biomass yield and allocation, and biochemical efficiencies. Biomass Bioenergy 2017, 105, 10–22. [Google Scholar] [CrossRef]
  30. Silvola, J.; Ahlholm, U. Photosynthesis in willows (Salix x dasyclados) grown at different CO2 concentrations and fertilization levels. Oecologia 1992, 91, 208–213. [Google Scholar] [CrossRef]
  31. Major, J.E.; Mosseler, A.; Malcolm, J.W. Assimilation efficiencies and gas exchange responses of four Salix species in elevated CO2, under soil moisture stress and fertilization treatments. Forests 2022, 13, 776. [Google Scholar] [CrossRef]
  32. Johnson, J.D.; Tognetti, R.; Paris, P. Water relations and gas exchange in poplar and willow under water stress and elevated atmospheric CO2. Physiol. Plant 2002, 115, 93–100. [Google Scholar] [CrossRef] [PubMed]
  33. Guo, B.; Dai, S.; Wang, R.; Guo, J.; Ding, Y.; Xu, Y. Combined effects of elevated CO2 and Cd-contaminated soil on the growth, gas exchange, antioxidant defense and Cd accumulation of poplars and willows. Environ. Expt. Bot. 2015, 115, 1–10. [Google Scholar] [CrossRef]
  34. Mosseler, A.; Major, J.E. Phytoremediation efficacy of Salix discolor and S. eriocephella on adjacent acidic clay and shale overburden on a former mine site: Growth, soil and foliage traits. Forests 2017, 8, 475. [Google Scholar] [CrossRef] [Green Version]
  35. Moran, R.; Porath, D. Chlorophyll determination in intact tissues using N,N-Dimethylformamide. Plant Physiol. 1980, 65, 478–479. [Google Scholar] [CrossRef] [PubMed] [Green Version]
  36. Wellburn, A.R. The spectral determination of chlorophyll a and b, as well as total carotenoids, using various solvents with spectrophotometers of different resolution. J. Plant Physiol. 1994, 144, 307–313. [Google Scholar] [CrossRef]
  37. McKeague, J.A. (Ed.) Manual on Soil Sampling and Methods of Analysis, 2nd ed.; Canadian Society of Soil Science: Ottawa, ON, Canada, 1978; 212p. [Google Scholar]
  38. Major, J.E.; Mosseler, A. Chlorophyll pigment and needle macronutrient responses and interactions to soil moisture and atmospheric CO2 treatments of eight pine and spruce species. Trees Struct. Funct. 2021, 35, 2069–2085. [Google Scholar] [CrossRef]
  39. Hicks, C.R. Fundamental Concepts in Design of Experiments, 3rd ed.; Hold, Reinhart and Winston: New York, NY, USA, 1982. [Google Scholar]
  40. Teskey, R.O. Combined effects of elevated CO2 and air temperature on carbon assimilation of Pinus taeda trees. Plant Cell Environ. 1997, 20, 373–380. [Google Scholar] [CrossRef]
  41. Mandre, M.; Lukjanova, A.; Parn, H.; Koresaar, K. State of Scots pine (Pinus sylvestris L.) under nutrient and water deficit on coastal dunes of the Baltic Sea. Trees 2010, 24, 1073–1085. [Google Scholar] [CrossRef]
  42. Dorn, R.D. A synopsis of American Salix. Can. J. Bot. 1976, 54, 2769–2789. [Google Scholar] [CrossRef]
  43. Brunsfeld, S.J.; Soltis, D.E.; Soltis, P.S. Patterns of genetic variation in Salix section Longifoliae (Salicaceae). Am. J. Bot. 1991, 78, 855–869. [Google Scholar] [CrossRef]
  44. Brunsfeld, S.J.; Soltis, D.E.; Soltis, P.S. Evolutionary patterns and processes in Salix sect. Longifoliae: Evidence from chloroplast DNA. Syst. Bot. 1992, 17, 239–256. [Google Scholar] [CrossRef]
  45. Briggs, M. Riparian Ecosystem Recovery in Arid Lands: Strategies and References; University of Arizona Press: Tucson, AZ, USA, 1996. [Google Scholar]
  46. Bhusal, N.; Han, S.-G.; Yoon, T.-M. Impact of drought stress on photosynthetic response, leaf water potential, and stem sap flow in two cultivars of bi-leader apple trees (Malus x domestica Borkh.). Sci. Hort. 2019, 246, 535–543. [Google Scholar] [CrossRef]
  47. Major, J.E.; Johnsen, K.H. Shoot water relations of mature black spruce families displaying a genotype x environment interaction in growth rate. II. Temporal trends and response to varying soil water conditions. Tree Physiol. 1999, 19, 375–382. [Google Scholar] [CrossRef] [PubMed] [Green Version]
  48. Limousin, J.M.; Roussel, A.; Rodríguez-Calcerrada, J.; Torres-Ruiz, J.M.; Moreno, M.; de Jalon, L.G.; Ourcival, J.-M.; Simioni, G.; Cochard, H.H.; Martin-St Paul, N. Drought acclimation of Quercus ilex leaves improves tolerance to moderate drought but not resistance to severe water stress. Plant Cell Environ. 2022, 45, 1967–1984. [Google Scholar] [CrossRef]
  49. Ainsworth, E.A.; Rogers, A.; Nelson, R.; Long, S.P. Testing the “source-sink” hypothesis of down-regulation of photosynthesis in elevated CO2 in the field with single gene substitutions in Glycinie max. Agric. For. Meteorol. 2004, 122, 85–94. [Google Scholar] [CrossRef]
  50. Oren, R.; Ellsworth, D.S.; Johnsen, K.H.; Phillips, N.; Ewers, B.E.; Maier, C.; Schäfer, K.V.; McCarthy, H.; Hendrey, G.; Katul, G.G.; et al. Soil fertility limits carbon sequestration by forest ecosystems in a CO2-enriched atmosphere. Nature 2001, 411, 469–472. [Google Scholar] [CrossRef] [Green Version]
  51. Fabio, E.S.; Leary, C.J.; Smart, L.b. Tolerance of novel inter-specific shrub willow hybrids to water stress. Trees 2019, 33, 1015–1026. [Google Scholar] [CrossRef]
  52. Weih, M.; Bonosi, L.; Ghelardini, L.; Ronnberg-Wastljung, A.C. Optimizing nitrogen economy under drought: Increased leaf nitrogen is an acclimation to water stress in willow (Salix spp.). Ann. Bot. 2011, 108, 1347–1353. [Google Scholar] [CrossRef] [Green Version]
  53. Hirose, T. Nitrogen use efficiency in growth of Polygonum cuspidatum Sieb. et Zucc. Ann. Bot. 1984, 54, 695–704. [Google Scholar] [CrossRef]
  54. Schieving, F. Plato’s Plant: On the Mathematical Structure of Simple Plants and Canopies; Backhuys Publishers: Leiden, The Netherlands, 1998. [Google Scholar]
  55. Farquhar, G.D.; Buckley, T.N.; Miller, J.M. Optimal stomatal control in relation to leaf area and nitrogen content. Silva Fenn. 2002, 36, 625–637. [Google Scholar] [CrossRef] [Green Version]
  56. Wright, I.J.; Reich, P.B.; Westoby, M. Least-cost input mixtures of water and nitrogen for photosynthesis. Am. Nat. 2003, 161, 98–111. [Google Scholar] [CrossRef] [PubMed]
  57. Li, S.; Pezeshki, S.R.; Goodwin, S.; Shields, F.D., Jr. Physiological responses of black willow (Salix nigra) cuttings to a range of soil moisture regimes. Photosynthetica 2004, 42, 585–590. [Google Scholar] [CrossRef]
  58. Ditmarova, L.; Kurjak, D.; Palmroth, S.; Kmet, J.; Strelcova, K. Physiological responses of Norway spruce (Picea abies) seedlings to drought stress. Tree Physiol. 2009, 30, 205–213. [Google Scholar] [CrossRef] [Green Version]
  59. Suvorova, G.G.; Oskorbina, M.V.; Kopytova, L.D.; Yan’kova, L.S.; Popova, E.V. Seasonal changes in photosynthetic activity and chlorophylls in Scots pine and Siberian spruce with optimal or insufficient moistening. Contemp. Probl. Ecol. 2011, 4, 626–633. [Google Scholar] [CrossRef]
  60. Mosseler, A.; Major, J.E.; Ostaff, D. Distribution of genetic variation in five coppice growth traits among natural populations of seven North American willow (Salix) species. Can. J. For. Res. 2017, 47, 36–46. [Google Scholar] [CrossRef]
  61. Bigras, F.J.; Bertrand, A. Responses of Picea mariana to elevated CO2 concentration during growth, cold hardening: Phenology, cold tolerance, photosynthesis and growth. Tree Physiol. 2006, 26, 875–888. [Google Scholar] [CrossRef] [Green Version]
  62. Luomala, E.M.; Laitinen, K.; Sutinen, S.; Kellomaki, S.; Vapavuori, E. Stomatal density, anatomy and nutrient concentrations of Scots pine needles are affected by elevated CO2 and temperature. Plant Cell Environ. 2005, 28, 733–749. [Google Scholar] [CrossRef]
  63. Salazar-Tortosa, D.; Castro, J.; Villar-Salvador, P.; Binegla, B.; Matias, L.; Michelsen, A.; Rubio de Casas, R.; Querejeta, J. The “isohydric trap”: A proposed feedback between water shortage, stomatal regulation, and nutrient acquisition drives differential growth and survival of European pines under climatic dryness. Glob. Change Biol. 2018, 24, 4069–4083. [Google Scholar] [CrossRef]
  64. Jose, S.; Merritt, S.; Ramsey, C.L. Growth nutrition, photosynthesis and transpiration responses of longleaf pine seedlings to light, water and nitrogen. For. Ecol. Manag. 2003, 180, 335–344. [Google Scholar] [CrossRef]
  65. Munns, R.; Tester, M. Mechanisms of salinity tolerance. Annu. Rev. Plant Biol. 2008, 59, 651–681. [Google Scholar] [CrossRef] [Green Version]
  66. Mosseler, A.; Major, J.E.; Labrecque, M. Genetic by environment interactions of two North American Salix species assessed for coppice yield and components of growth on three sites of varying quality. Trees Struct. Funct. 2014, 28, 1401–1411. [Google Scholar] [CrossRef]
  67. Doty, S.L.; Oakley, B.; Xin, G.; Kang, J.W.; Singleton, G.; Khan, Z.; Vajzovic, A.; Staley, J.T. Diazotrophic endophytes of native black cottonwood and willow. Symbiosis 2009, 47, 23–33. [Google Scholar] [CrossRef]
  68. Kandel, S.L.; Firrincieli, A.; Joubert, P.M.; Okubara, P.A.; Leston, N.D.; McGeorge, K.M.; Mugnozza, G.S.; Harfouche, A.; Kim, S.-H.; Doty, S.L. An In vitro Study of Bio-Control and Plant Growth Promotion Potential of Salicaceae Endophytes. Front. Microbiol. 2017, 8, 386. [Google Scholar] [CrossRef] [Green Version]
  69. Mosseler, A.; Major, J.E. Biomass and root stem production of a colony-forming willow (Salix interior) on highly disturbed, low fertility sites. Biomass Bioenergy 2015, 74, 202–212. [Google Scholar] [CrossRef]
Figure 1. (a) Total chlorophyll (mean ± SE) by willow species and CO2 treatments, 2017, (b) by willow species and soil moisture stress treatments, 2017, (c) by fertilization × CO2 treatments, 2018 and (d) by willow species and fertilization treatments, 2018. Species abbreviations COR, DIS, ERI and INT are for Salix cordata, S. discolor, S. eriocephala and S. interior, respectively. Species with no matching letters are significantly different using Tukey mean separation test (p = 0.05).
Forests 14 00042 g001
Figure 2. (a) Total carotenoids (mean ± SE) by willow species and CO2 treatments, 2017, (b) by willow species and soil moisture stress treatments, 2017, and (c) by willow species and fertilization treatments, 2018. Species with no matching letters are significantly different using Tukey mean separation test (p = 0.05). Species abbreviations appear in Figure 1 caption.
Forests 14 00042 g002
Figure 3. (a) Chlorophyll a:b ratio (mean ± SE) by willow species and CO2 treatments, 2017 and (b) by willow species and fertilization treatments, 2018. Species with no matching letters are significantly different using Tukey mean separation test (p = 0.05). Species abbreviations appear in Figure 1 caption.
Forests 14 00042 g003
Figure 4. (a) Chlorophyll: carotenoids ratio (mean ± SE) by willow species and soil moisture stress treatments, 2017, (b) by willow species and CO2 treatments, 2018 and (c) by willow species and fertilization treatments, 2018. Species with no matching letters are significantly different using Tukey mean separation test (p = 0.05). Species abbreviations appear in Figure 1 caption.
Forests 14 00042 g004
Figure 5. (a) Foliar N (mean ± SE) by willow species and CO2 treatments, 2017, (b) by willow species and soil moisture stress treatments, 2017, (c) by willow species and CO2 treatments, 2018 and (d) by willow species and fertilization treatments, 2018. Species with no matching letters are significantly different using Tukey mean separation test (p = 0.05). Species abbreviations appear in Figure 1 caption.
Forests 14 00042 g005
Figure 6. (a) Foliar Mg (mean ± SE) by willow species and CO2 treatments, 2017, (b) by willow species and soil moisture stress treatments, 2017, (c) by willow species and CO2 treatments, 2018 and (d) by willow species and fertilization treatments, 2018. Species with no matching letters are significantly different using Tukey mean separation test (p = 0.05). Species abbreviations appear in Figure 1 caption.
Forests 14 00042 g006
Figure 7. Relationship of total chlorophyll (mean ± SE) to (a) foliar N by willow species and CO2 treatments, 2017, ambient (A) and elevated (E) CO2 (b) foliar N by willow species and soil moisture stress treatments, 2017, well-watered (W) and drought (D) treatments (c) foliar N by willow species and fertilizer treatments, 2018, NOFERT (NF) and FERT (F). Species abbreviations appear in Figure 1 caption. Circles are around INT species.
Forests 14 00042 g007
Figure 8. Relationship of maximum rate of carboxylation (Vcmax) (mean ± SE) to (a) foliar N by willow species and CO2 treatments, 2017, ambient (A) and elevated (E) CO2 (b) foliar N by willow species and soil moisture stress treatments, 2017, well-watered (W) and drought (D) treatments (c) foliar N by willow species and fertilizer treatments, 2018, NOFERT (NF) and FERT (F). Species abbreviations appear in Figure 1 caption.
Forests 14 00042 g008
Table 1. Species and clones of Salix used in 2017 CO2 × soil moisture and 2018 CO2 × fertilization experiments.
20172018
SpeciesClone IDProvenanceLat-LongChlorophyllNutrientsChlorophyllNutrients
S. cordataBIG-C4mBig Sandy Bay, ON44°06′ N–77°43′ WXXX
BIG-C5fBig Sandy Bay, ON44°06′ N–77°43′ WX X
NOR-C4fNorth Beach Park, ON43°56′ N–77°31′ WXXXX
OUT-C1mOutlet Beach, ON43°53′ N–77°13′ WX XX
S. discolorHAW-D4mHawkesbury, ON45°36′ N–74°36′ WXXX
HAW-D5fHawkesbury, ON45°36′ N–74°36′ WX XX
MON-D1fMontmagny, QC 46o58′ N–70o33′ W X X X X
RIC-D2mRichmond Fen, ON45°07′ N–75°42′ WX X
S. eriocephalaALL-E2mAllumette Island, QC 45°54′ N–77°06′ W X X X
FRE-E1fFredericton, NB45°57′ N–66°38′ WX XX
GRE-E1fGreen River, NB47°34′ N–68°19′ WXXXX
WAI-E1mWainfleet, ON 42°55′ N–79°20′ W X X
S. interiorLAF-I2fOttawa, ON45°25′ N–75°41′ WXXXX
LAF-I12mOttawa, ON45°25′ N–75°41′ WX X
WAI-I1mWainfleet, ON 42°55′ N–79°20′ W X X X
WAI-I2fWainfleet, ON 42°55′ N–79°20′ W X X X
Table 2. Soil properties (mean ± SE) during the 2018 NOFERT and FERT treatments. Treatments with different letters are significantly different using ANOVA test, α = 0.05.
TreatmentOrganic
Matter (%)
Carbon
(%)
Nitrogen
(%)
Potassium
(meq/100 g)
Calcium
(meq/100 g)
Magnesium
(meq/100 g)
Phosphorus
(ppm)
NOFERT0.67 ± 0.40 a0.39± 0.02 a0.085 ± 0.009 a0.04 ± 0.01 b1.21 ± 0.08 a0.050 ± 0.004 b6.50 ± 0.50 b
FERT0.63 ± 0.40 a0.37 ± 0.02 a0.090 ± 0.009 a0.16 ± 0.01 a1.08 ± 0.08 a0.068 ± 0.004 a9.50 ± 0.50 a
TreatmentSodium
(%)
Sulfur
(%)
pHC:N ratio
NOFERT0.11 ± 0.01 a0.020 ± 0.007 a6.8 ± 0.1 a4.7 ± 0.2 a
FERT0.11 ± 0.01 a0.013 ± 0.007 a6.2 ± 0.1 b3.9 ± 0.2 a
Table 3. 2017 CO2 × soil moisture experiment: chlorophyll trait variance components and ANOVAs including source of variation, degrees of freedom (df), mean square values (MS), variance component (VC), p values, and coefficient of determination (R2). p values < 0.05 are in bold print.
Source of VariationdfChlorophyll a
(mg·g−1)
Chlorophyll b
(mg·g−1)
Carotenoids
(mg·g−1)
MSVC (%)p-ValueMSVC (%)p-ValueMSVC (%)p-Value
Block10.150.40.3430.0230.40.3650.0080.70.165
SP 132.16517.0<0.0010.44920.1<0.0010.07621.2<0.001
CO213.0498.0<0.0010.5167.7<0.0010.0898.2<0.001
Water17.14918.7<0.0011.13517.0<0.0010.22721.0<0.001
SP × CO230.0670.50.7500.0100.50.7770.0010.20.927
SP × Water30.1691.30.3870.0321.40.3340.0051.30.323
Water × CO211.7864.70.0020.3314.90.0010.0343.20.005
SP × Water × CO230.2101.60.2900.0371.60.2770.0061.70.215
Clone(SP)120.2798.70.0890.0478.40.0900.0088.40.047
Clone(SP) × CO2120.1454.50.5710.0254.40.5640.0044.40.444
Clone(SP) × water120.1223.80.7070.0213.70.6980.0033.20.708
Clone(SP) × water * CO2120.1203.80.7170.0213.70.7070.0033.60.621
Error630.16427.0 0.02826.1 0.00422.9
R2 0.731 0.740 0.772
Source of variationdfTotal chlorophyll
(mg·g−1)
Chlorophyll a:b
ratio
Chlorophyll: carotenoids
ratio
MSVC (%)p-valueMSVC (%)p-valueMSVC (%)p-value
Block10.2910.40.3480.000<0.10.9050.0340.10.769
SP34.58117.9<0.0010.15636.3<0.0013.88720.5<0.001
CO216.0757.9<0.0010.0020.20.5000.0910.20.630
Water113.98218.2<0.0010.0020.20.4790.0300.10.782
SP × CO230.1270.50.7610.0061.30.2880.5562.90.242
SP × Water30.3471.40.3710.0081.90.1520.1881.00.695
Water × CO213.6544.80.0010.0120.90.1011.9463.40.029
SP × Water × CO230.4201.60.2870.0051.20.3470.2351.240.614
Clone(SP)120.5488.60.0930.02624.5<0.0010.61112.90.123
Clone(SP) × CO2120.2884.50.5680.0043.80.5410.2445.20.810
Clone(SP) × water120.2423.80.7050.0065.80.1940.4058.50.422
Clone(SP) × water × CO2120.2393.70.7140.0022.00.9210.0551.21.000
Error630.32626.8 0.00522.0 0.38843.0
R2 0.733 0.781 0.571
1 Species.
Table 4. 2018 CO2 x fertilizer experiment: chlorophyll trait variance components and ANOVAs including source of variation, degrees of freedom (df), mean square values (MS), variance component (VC), p values, and coefficient of determination (R2). p values < 0.05 are in bold print.
Source of VariationdfChlorophyll a
(mg·g−1)
Chlorophyll b
(mg·g−1)
Carotenoids
(mg·g−1)
MSVC (%)p-ValueMSVC (%)p-ValueMSVC (%)p-Value
Block10.4302.80.0020.0893.60.0010.0072.90.008
SP 130.3266.4<0.0010.0688.2<0.0010.00810.3<0.001
CO210.0020.00.8420.0020.10.6390.0010.40.247
FERT2110.41868.0<0.0011.61364.7<0.0010.13455.1<0.001
SP × CO230.0390.80.4120.0070.80.3970.0011.20.328
SP × FERT30.2524.90.0010.0425.10.0020.0056.60.001
CO2 × FERT10.1871.20.0370.0230.90.0760.0052.10.024
SP × CO2 × FERT30.1793.50.0080.0283.40.0140.0044.90.005
Error470.04012.4 0.00713.3 0.00116.5
R2 0.876 0.867 0.835
Source of variationdfTotal chlorophyll
(mg·g−1)
Chlorophyll a:b
ratio
Chlorophyll: carotenoids
ratio
MSVC (%)p-valueMSVC (%)p-valueMSVC (%)p-value
Block10.9123.00.0020.0141.40.2833.2543.90.002
SP30.6876.8<0.0010.07020.50.0020.461.70.205
CO210.0060.00.7790.0020.20.6695.136.2<0.001
FERT120.22867.2<0.0010.12712.40.00256.88668.7<0.001
SP × CO230.0800.80.4050.0082.40.5540.090.30.817
SP × FERT30.4985.00.0010.0133.90.3600.271.00.433
CO2 × FERT10.3431.10.0450.0232.20.1740.3570.40.272
SP × CO2 × FERT30.3483.50.0090.0061.80.6870.3551.30.310
Error470.08112.6 0.01255.2 0.28916.4
R2 0.874 0.449 0.836
1 Species, 2 Fertilizer treatment.
Table 5. 2017 CO2 × soil moisture experiment: leaf macronutrients variance components and ANOVAs including source of variation, degrees of freedom (df), mean square values (MS), variance component (VC), p values, and coefficient of determination (R2). p values < 0.05 are in bold print.
Source of VariationdfLeaf Nitrogen
(%)
Leaf Phosphorus
(%)
Leaf Potassium
(%)
MSVC (%)p-ValueMSVC (%)p-ValueMSVC (%)p-Value
Block10.8076.90.0080.0165.80.0450.0400.20.602
SP 130.57114.70.0030.0022.20.6861.19419.2<0.001
CO211.52613.1<0.0010.0031.10.3520.0190.10.718
Water12.39420.6<0.0010.03713.30.0036.78836.5<0.001
CO2 × SP30.0130.30.9420.0044.30.3640.0440.70.824
Water × SP30.0411.10.7560.0044.30.3920.3034.90.116
Water × CO210.0030.00.8720.0041.40.2930.2161.20.231
Water × CO2 × SP30.0511.30.6910.0032.90.5440.0220.40.928
Error470.10441.9 0.00464.8 0.14636.9
R2 0.596 0.349 0.632
Source of variationdfLeaf calcium
(%)
Leaf magnesium
(%)
Leaf sodium
(%)
MSVC (%)p-valueMSVC (%)p-valueMSVC (%)p-value
Block10.1111.40.3030.0185.50.0020.000091.40.338
SP30.26010.20.0670.06559.5<0.0010.0004621.00.006
CO210.1662.20.2090.0041.20.1100.000020.30.653
Water10.5887.70.0200.0185.50.0020.000010.20.701
CO2 × SP30.1034.00.3980.0011.20.4800.000010.50.963
Water × SP30.1094.30.3740.0011.20.5050.000083.80.471
Water × CO210.5176.80.0290.0020.60.2850.000071.10.419
Water × CO2 × SP30.0160.60.9220.0011.20.5220.000010.60.935
Error470.10262.8 0.00223.9 0.0001071.2
R2 0.373 0.763 0.293
1 Species.
Table 6. 2018 CO2 x fertilizer experiment: leaf macronutrient variance components and ANOVAs including source of variation, degrees of freedom (df), mean square values (MS), variance component (VC), p values, and coefficient of determination (R2). p values < 0.05 are in bold print.
Source of VariationdfLeaf Nitrogen
%
Leaf Phosphorus
%
Leaf Potassium
%
MSVC (%)p-ValueMSVC (%)p-ValueMSVC (%)p-Value
Block10.3530.40.0590.00080.30.6170.5224.00.020
SP 130.6782.6<0.0010.00182.20.6201.91343.9<0.001
CO210.4810.60.0280.00020.10.8200.1070.80.280
FERT 2171.33989.6<0.0010.071629.4<0.0010.9567.30.002
CO2 × SP30.0190.10.8920.00202.40.5800.0090.20.960
FERT × SP30.2440.90.0630.00455.60.2220.2916.70.030
CO2 × FERT10.0660.10.4080.00040.20.7160.4803.70.025
CO2 × FERT × SP30.0540.20.6360.00182.20.6220.0491.10.651
Error470.0945.6 0.00357.6 0.09032.3
R2 0.945 0.424 0.677
Source of variationdfLeaf calcium
(%)
Leaf Magnesium
(%)
Leaf sodium
(%)
MSVC (%)p-valueMSVC (%)p-valueMSVC (%)p-value
Block10.0750.50.4120.000190.10.5980.00056417.0<0.001
SP31.04522.8<0.0010.0431868.3<0.0010.00028125.3<0.001
CO210.0370.30.5660.000690.40.3160.000002<0.10.824
FERT13.86628.1<0.0010.013517.1<0.0010.0000391.20.268
CO2 × SP30.2485.40.0930.000130.20.9040.0000141.30.717
FERT × SP30.2164.70.1310.003445.40.0040.0000020.10.985
CO2 × FERT10.0660.50.4430.001500.80.1410.0001273.80.049
CO2 × FERT × SP30.0100.20.9660.000661.10.4060.0000817.30.063
Error470.11037.4 0.0006716.6 0.00003144.0
R2 0.626 0.834 0.560
1 Species, 2 Fertilizer treatment.
Disclaimer/Publisher’s Note: The statements, opinions and data contained in all publications are solely those of the individual author(s) and contributor(s) and not of MDPI and/or the editor(s). MDPI and/or the editor(s) disclaim responsibility for any injury to people or property resulting from any ideas, methods, instructions or products referred to in the content.

