
Long-Term Responses to Competing Vegetation Management for Pinus radiata

Abstract
:1. Introduction
2. Materials and Methods
2.1. Site Description
2.2. Experimental Design and Treatments
2.3. Competing Vegetation Biomass Measurements
2.4. Data Analysis
3. Results
3.1. Competing Vegetation Biomass Production
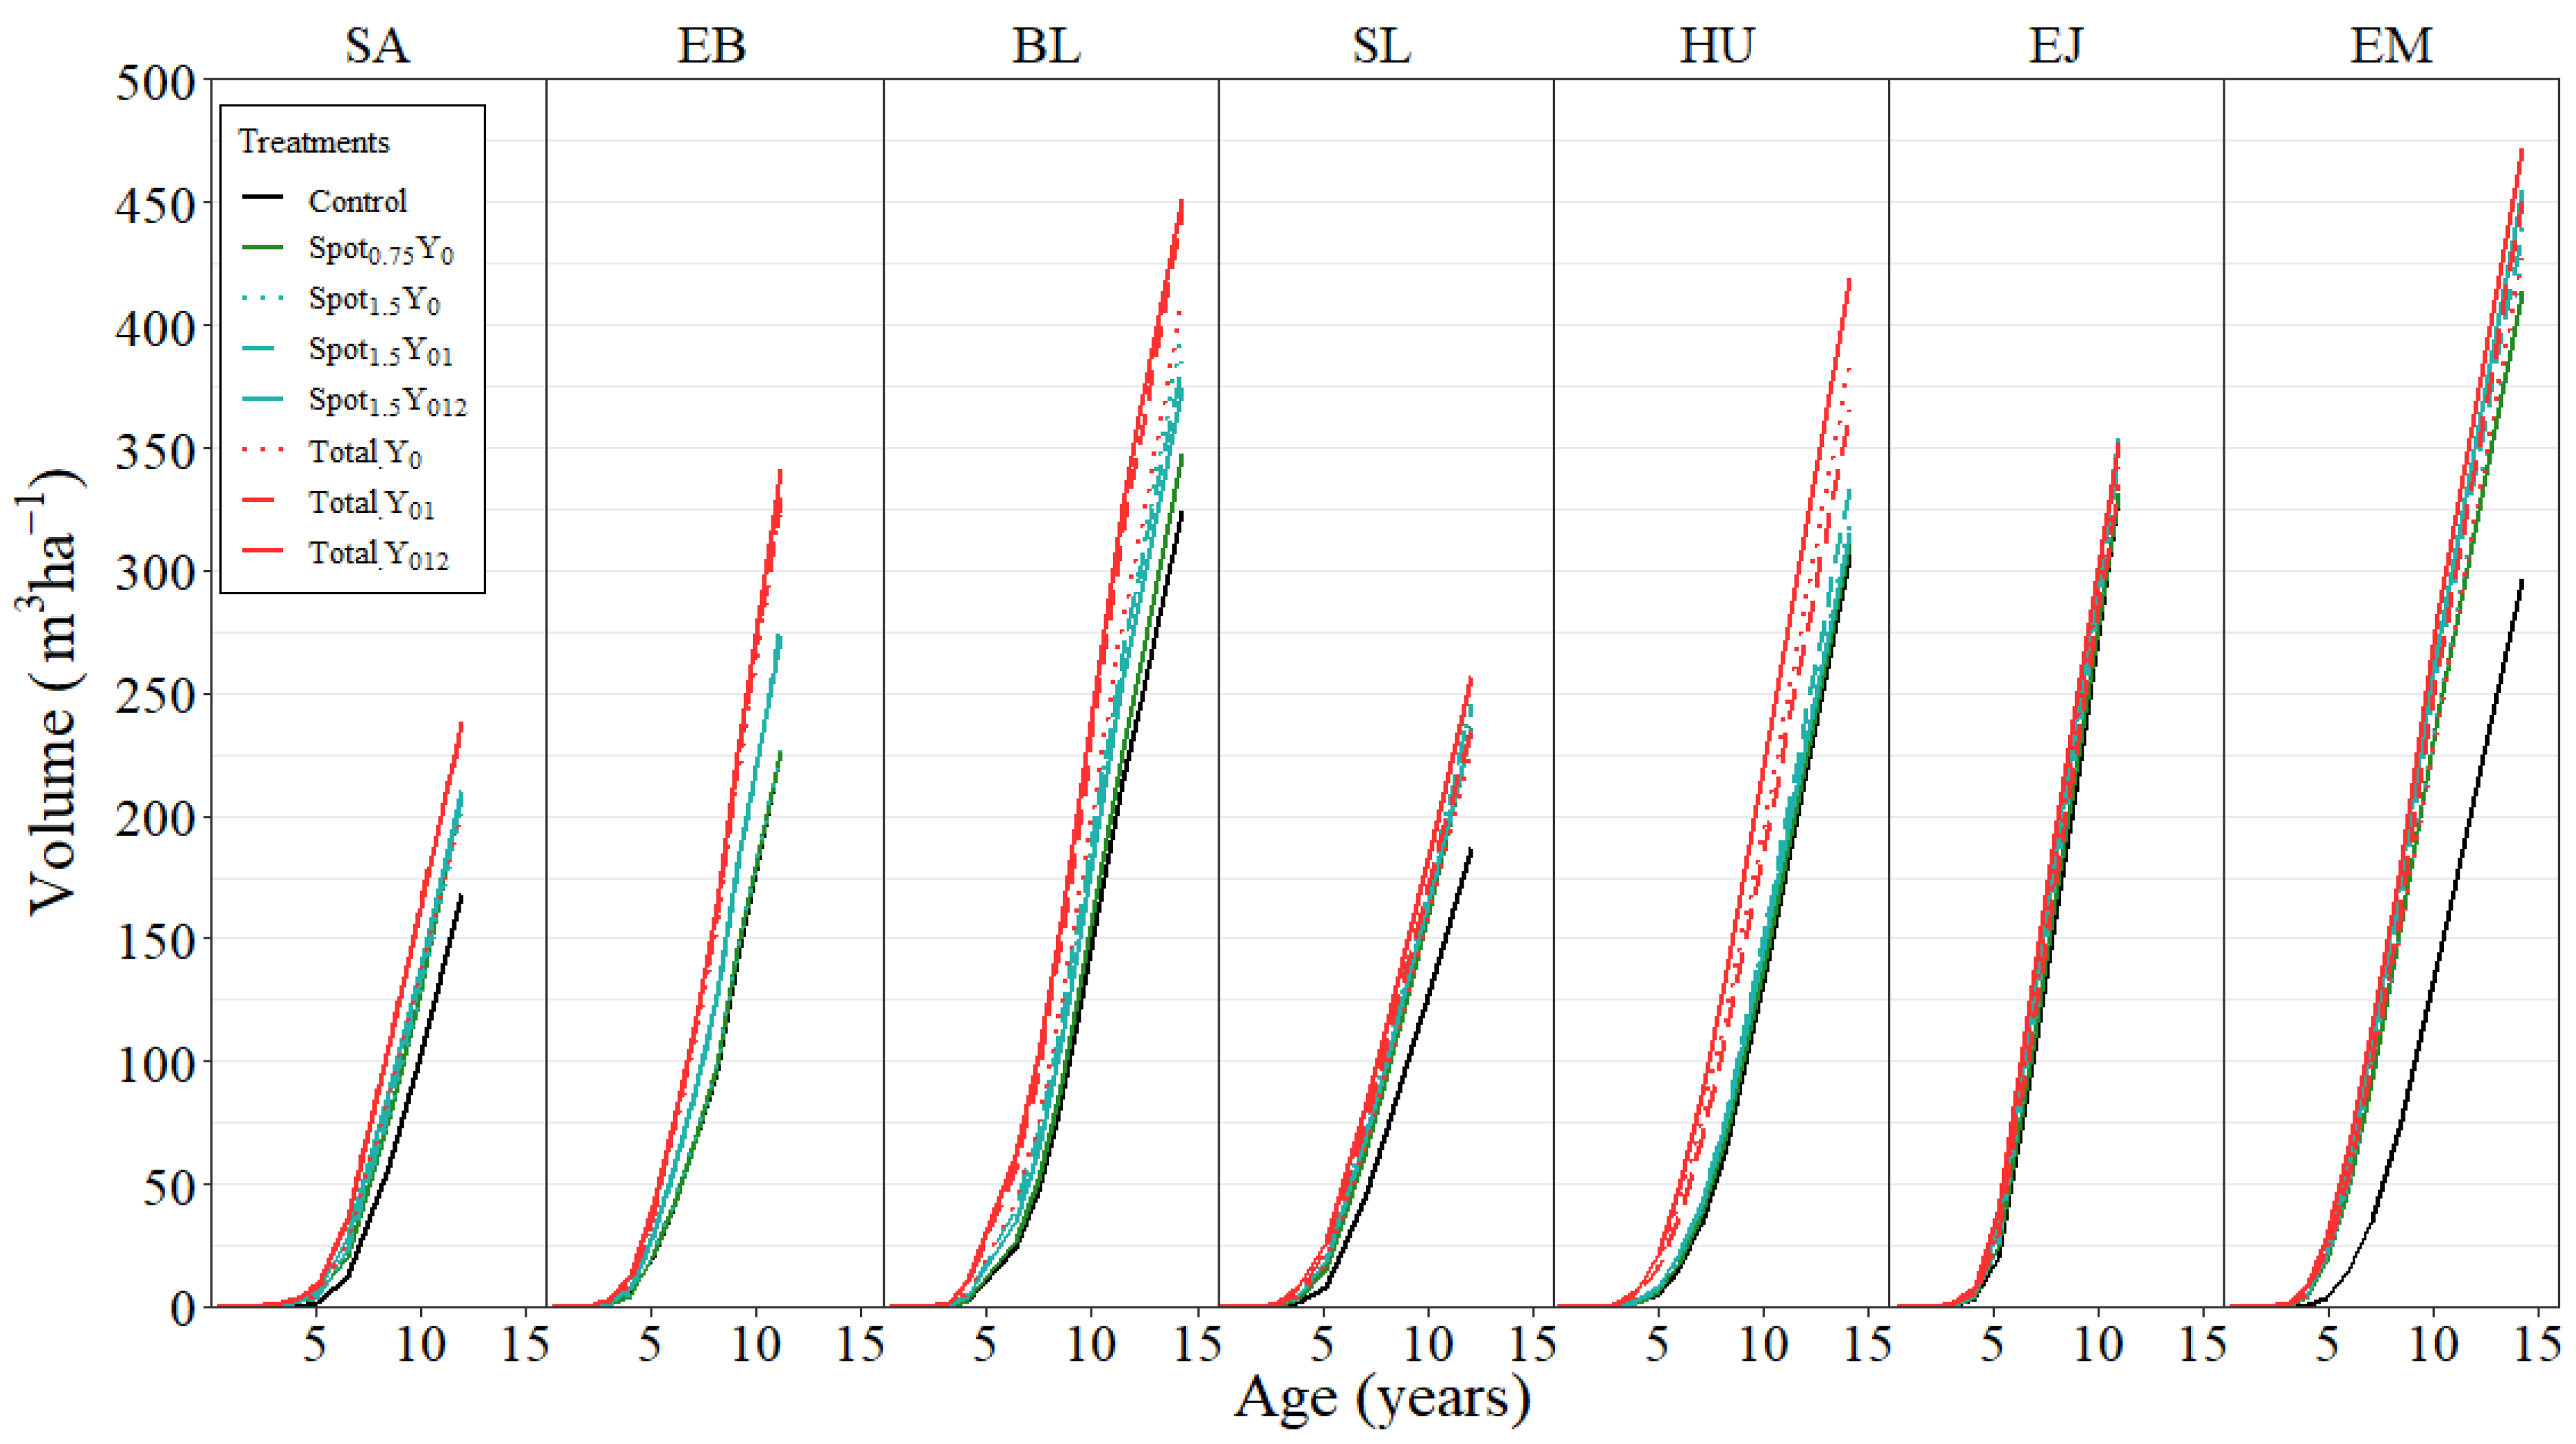
3.2. Stand Yield
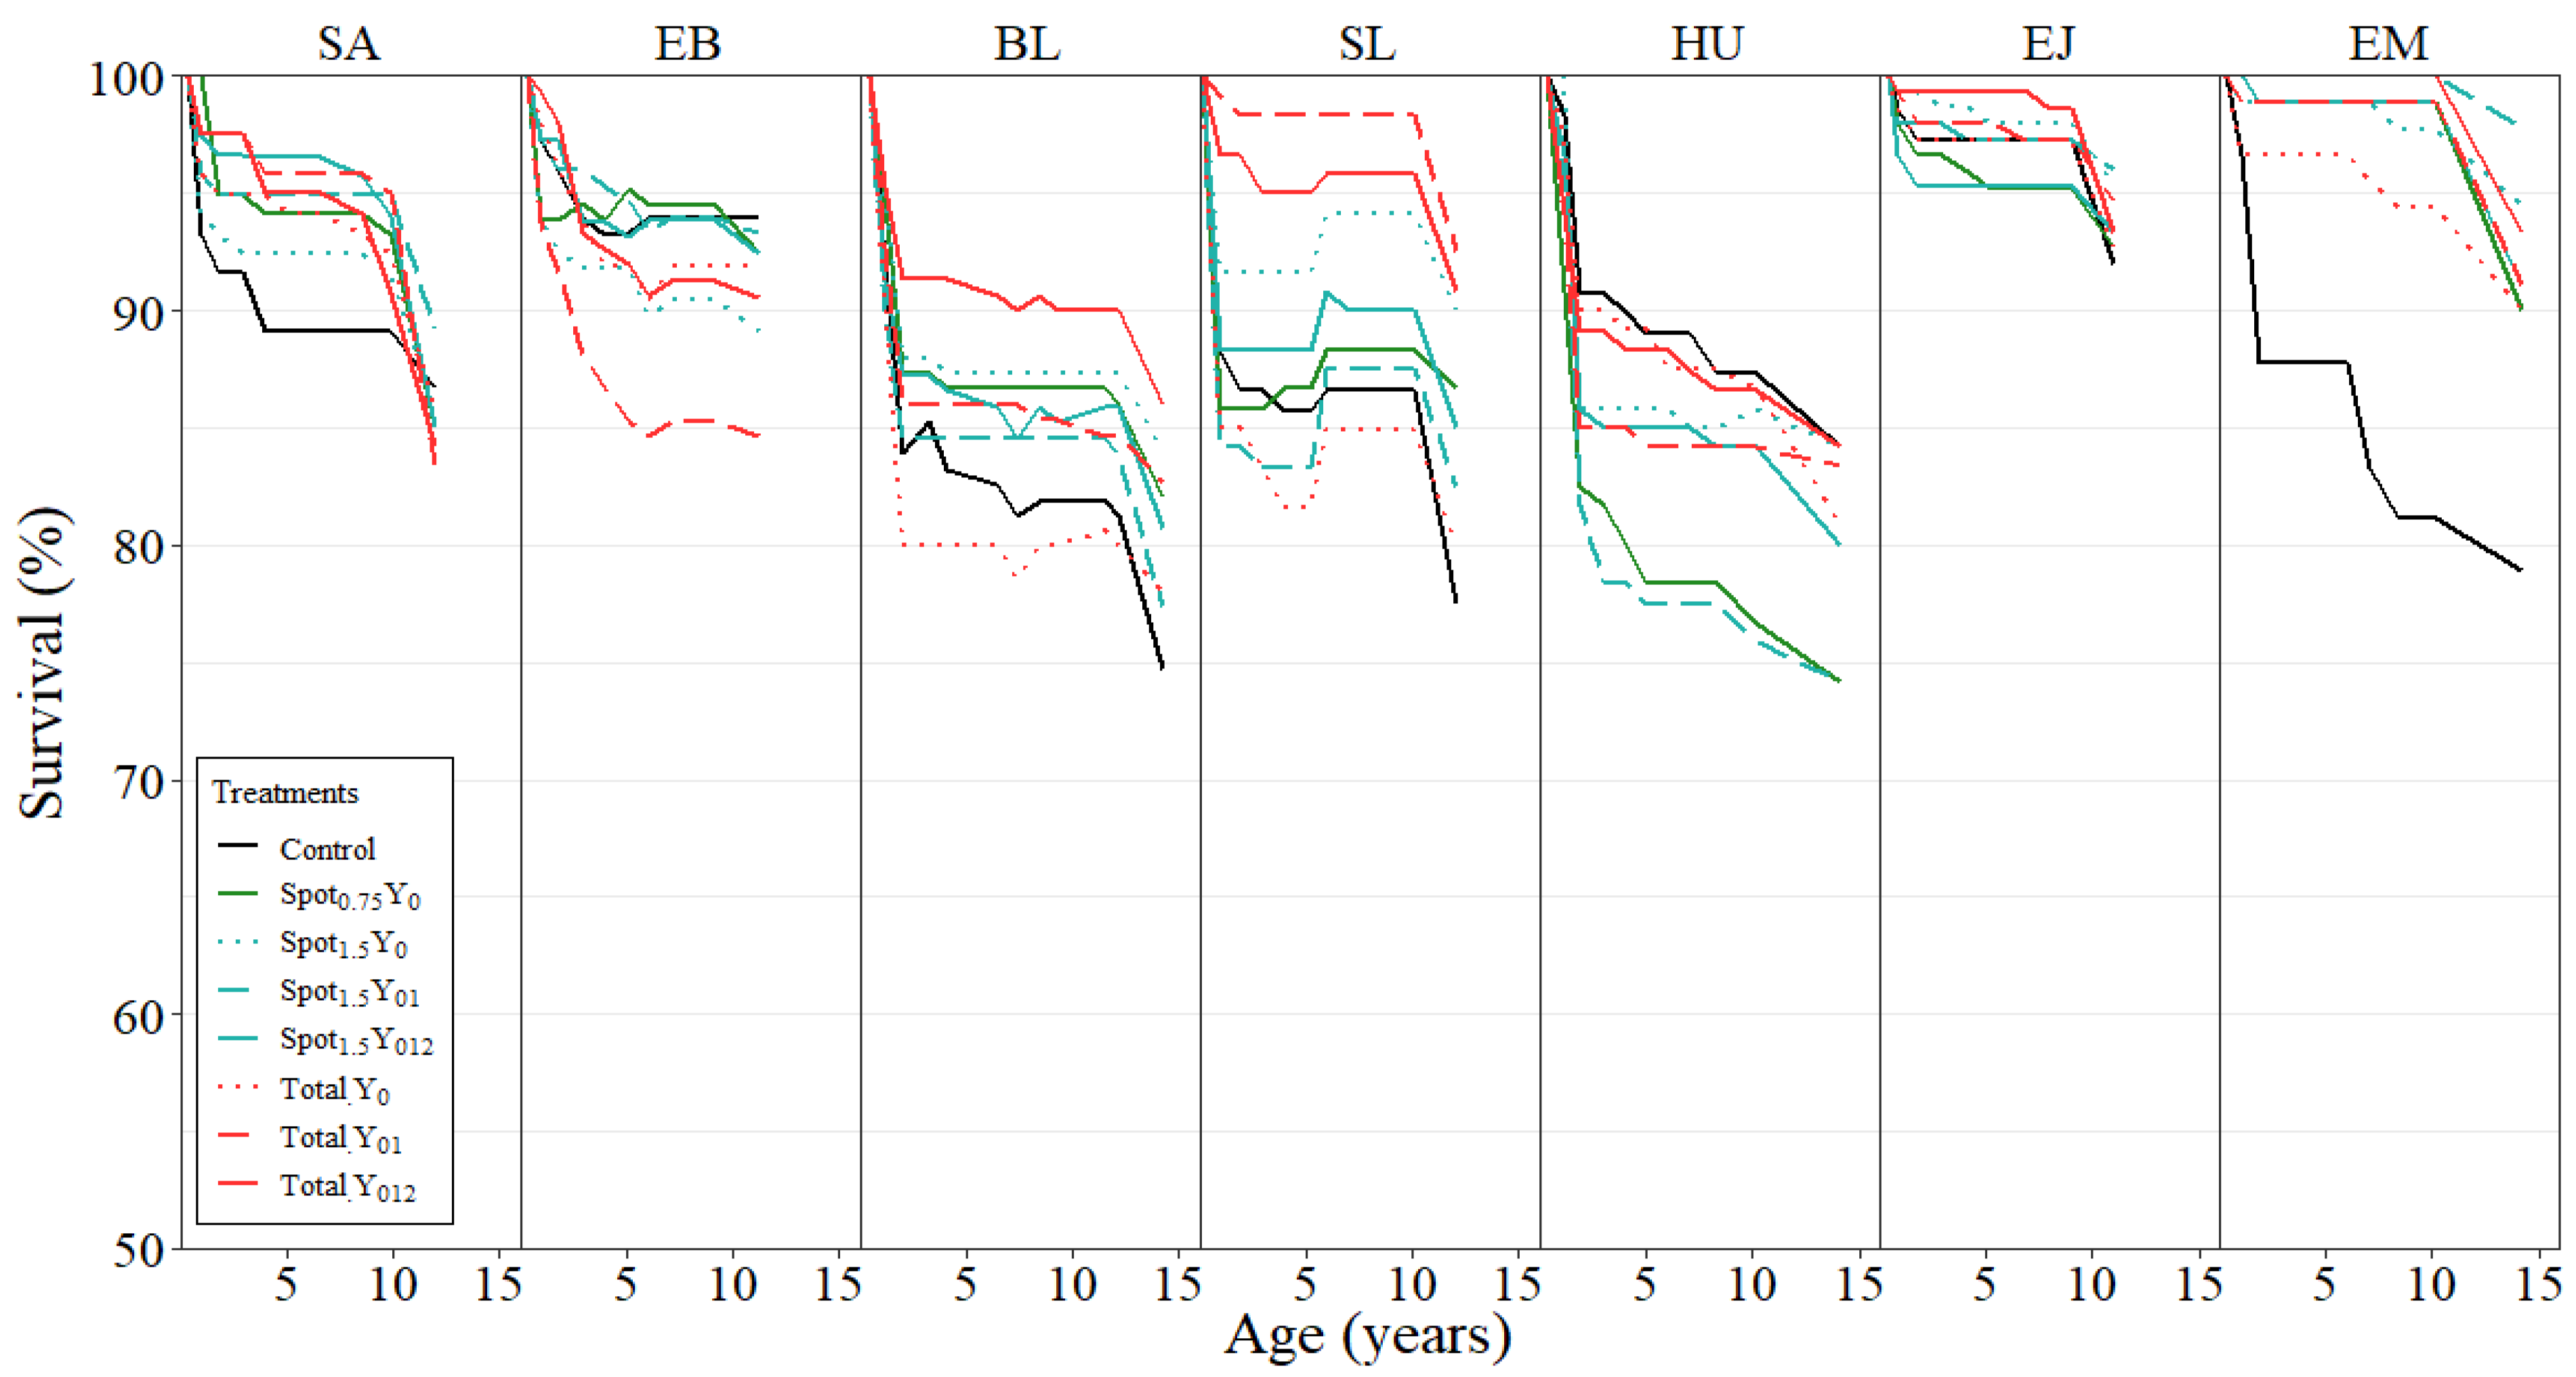
3.3. Tree Survival
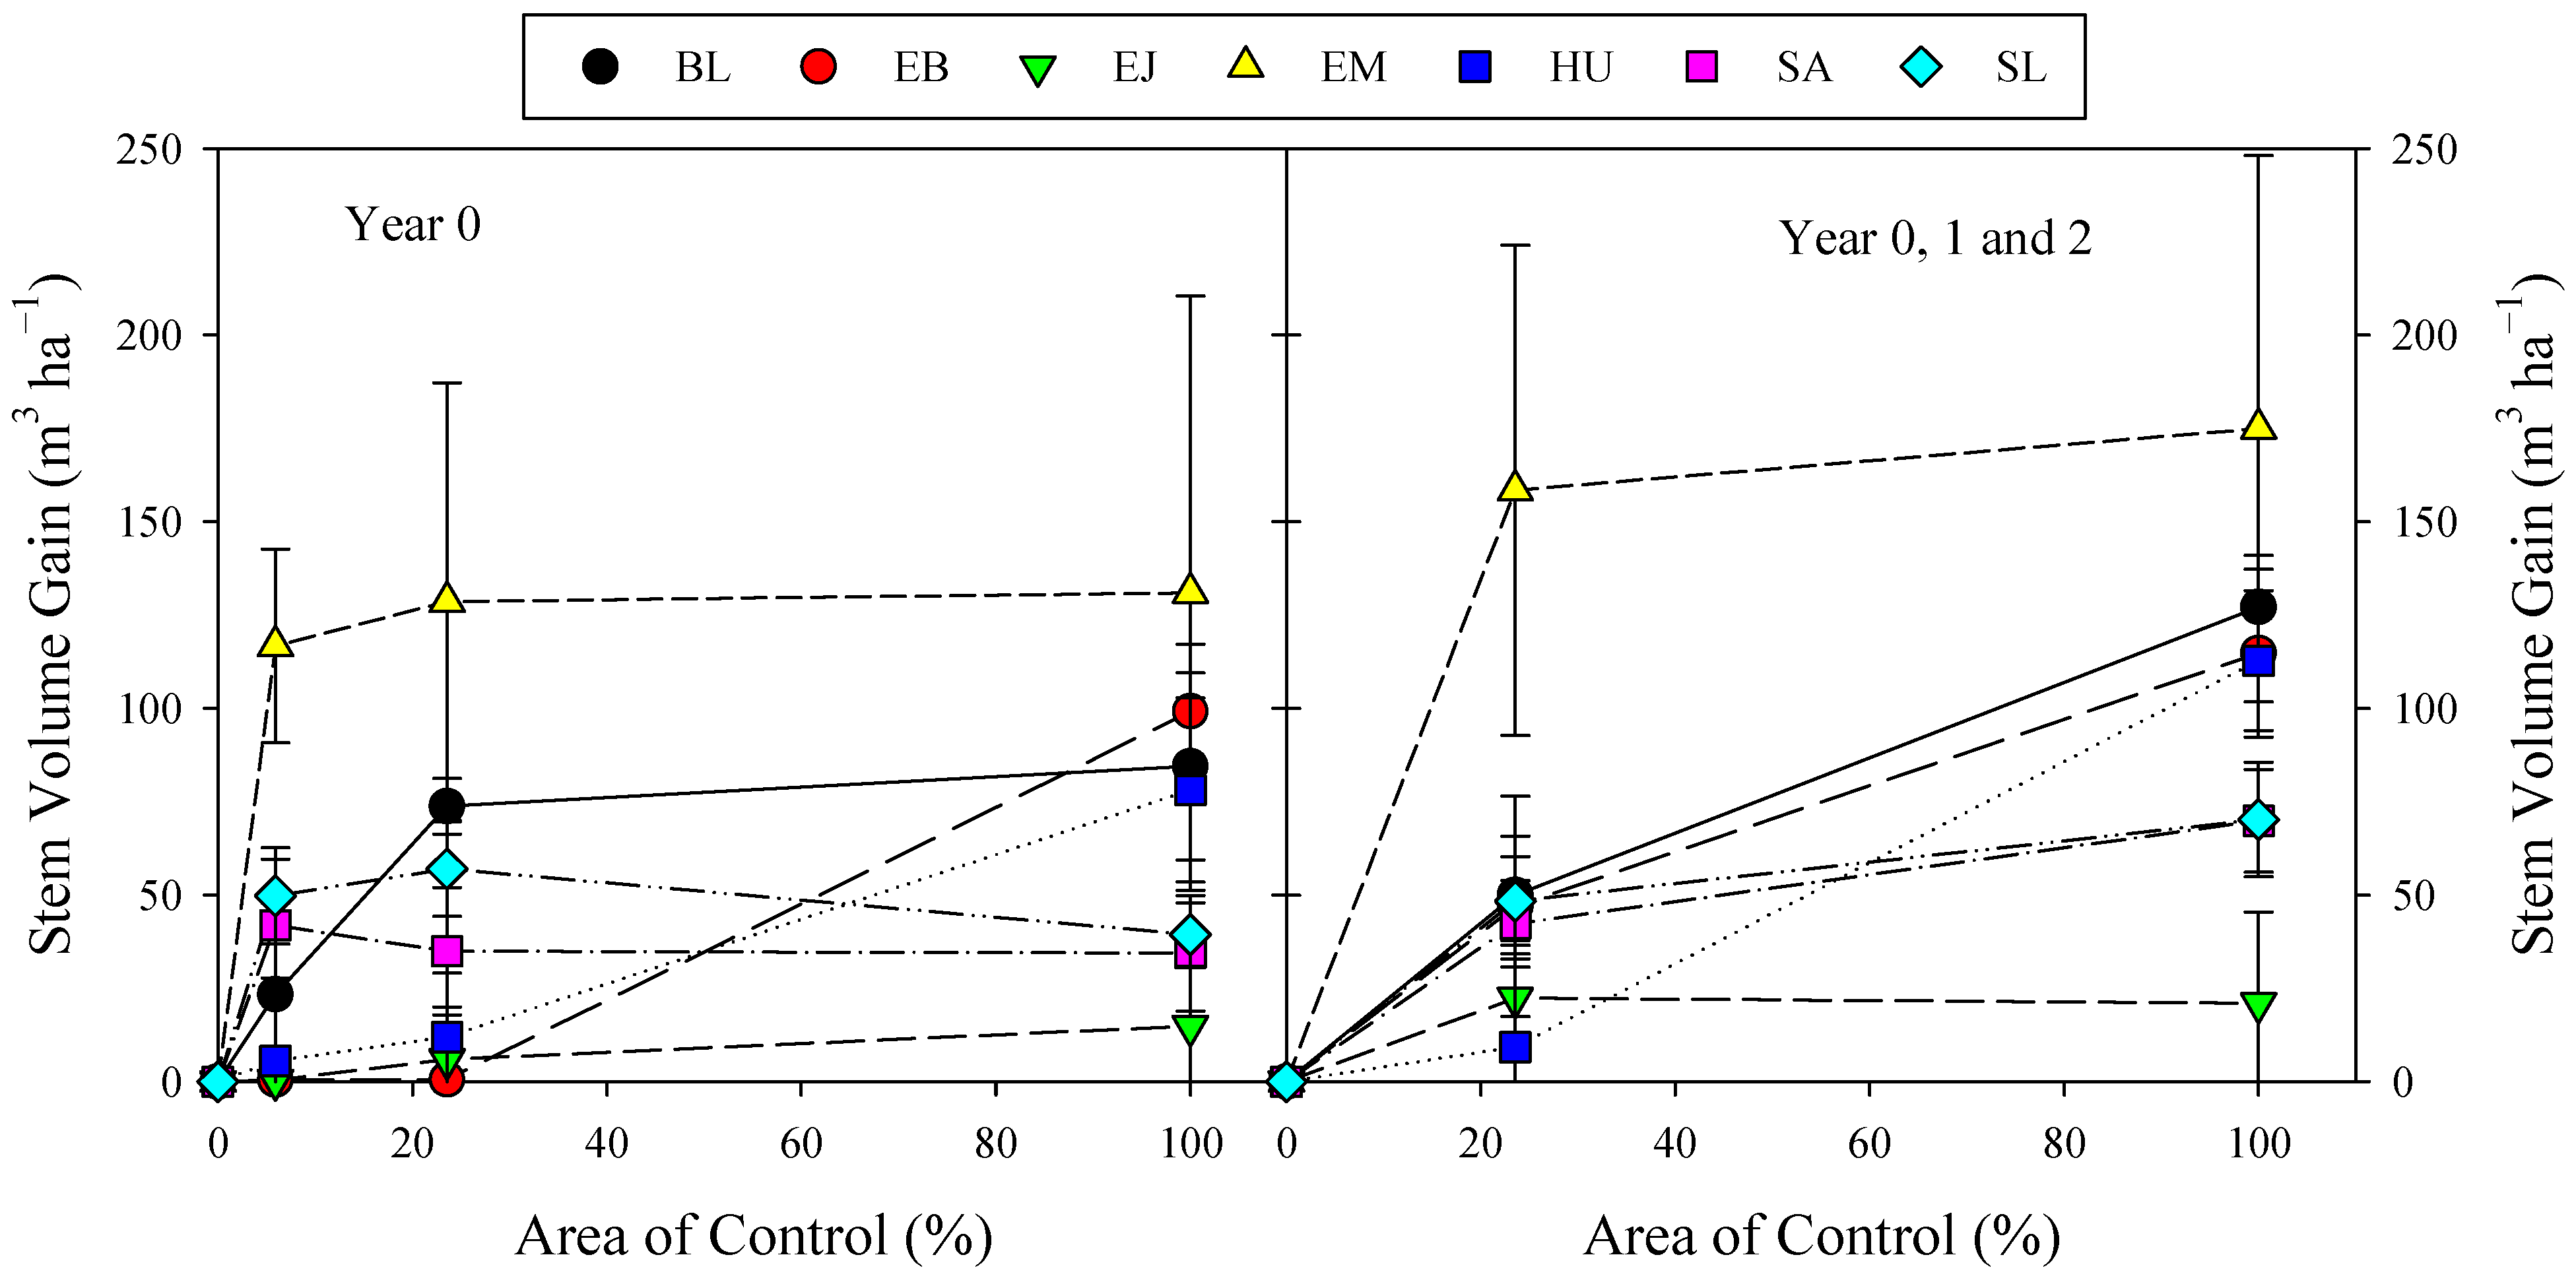
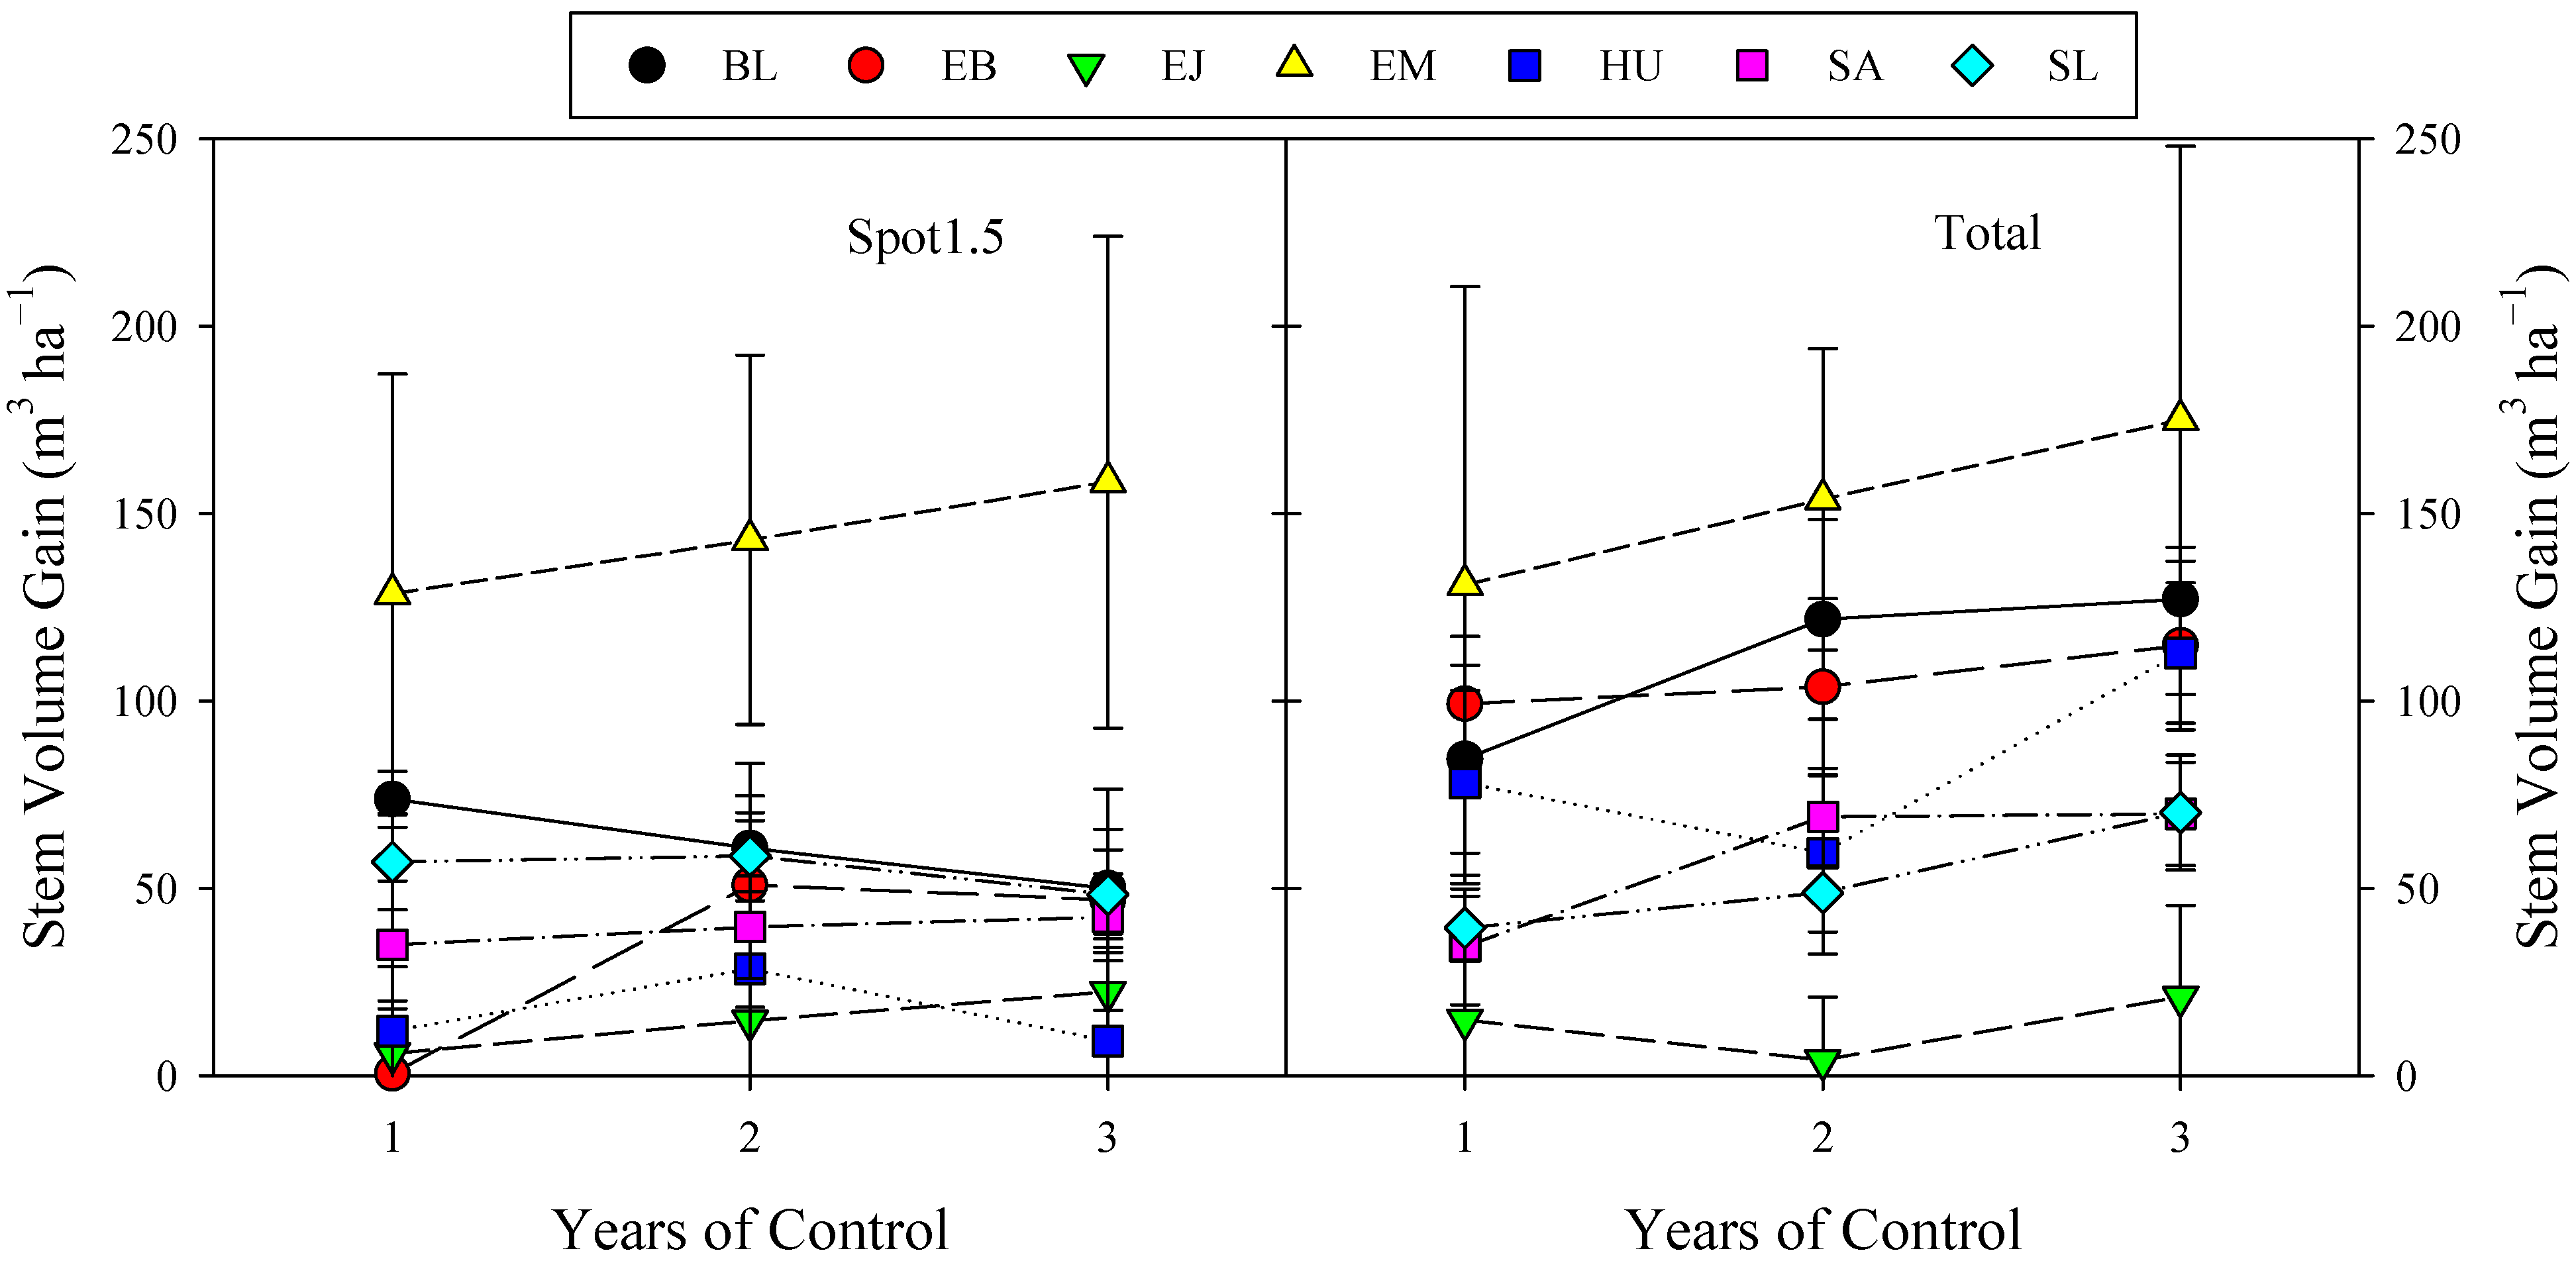
3.4. Effect of Area and Years of Control
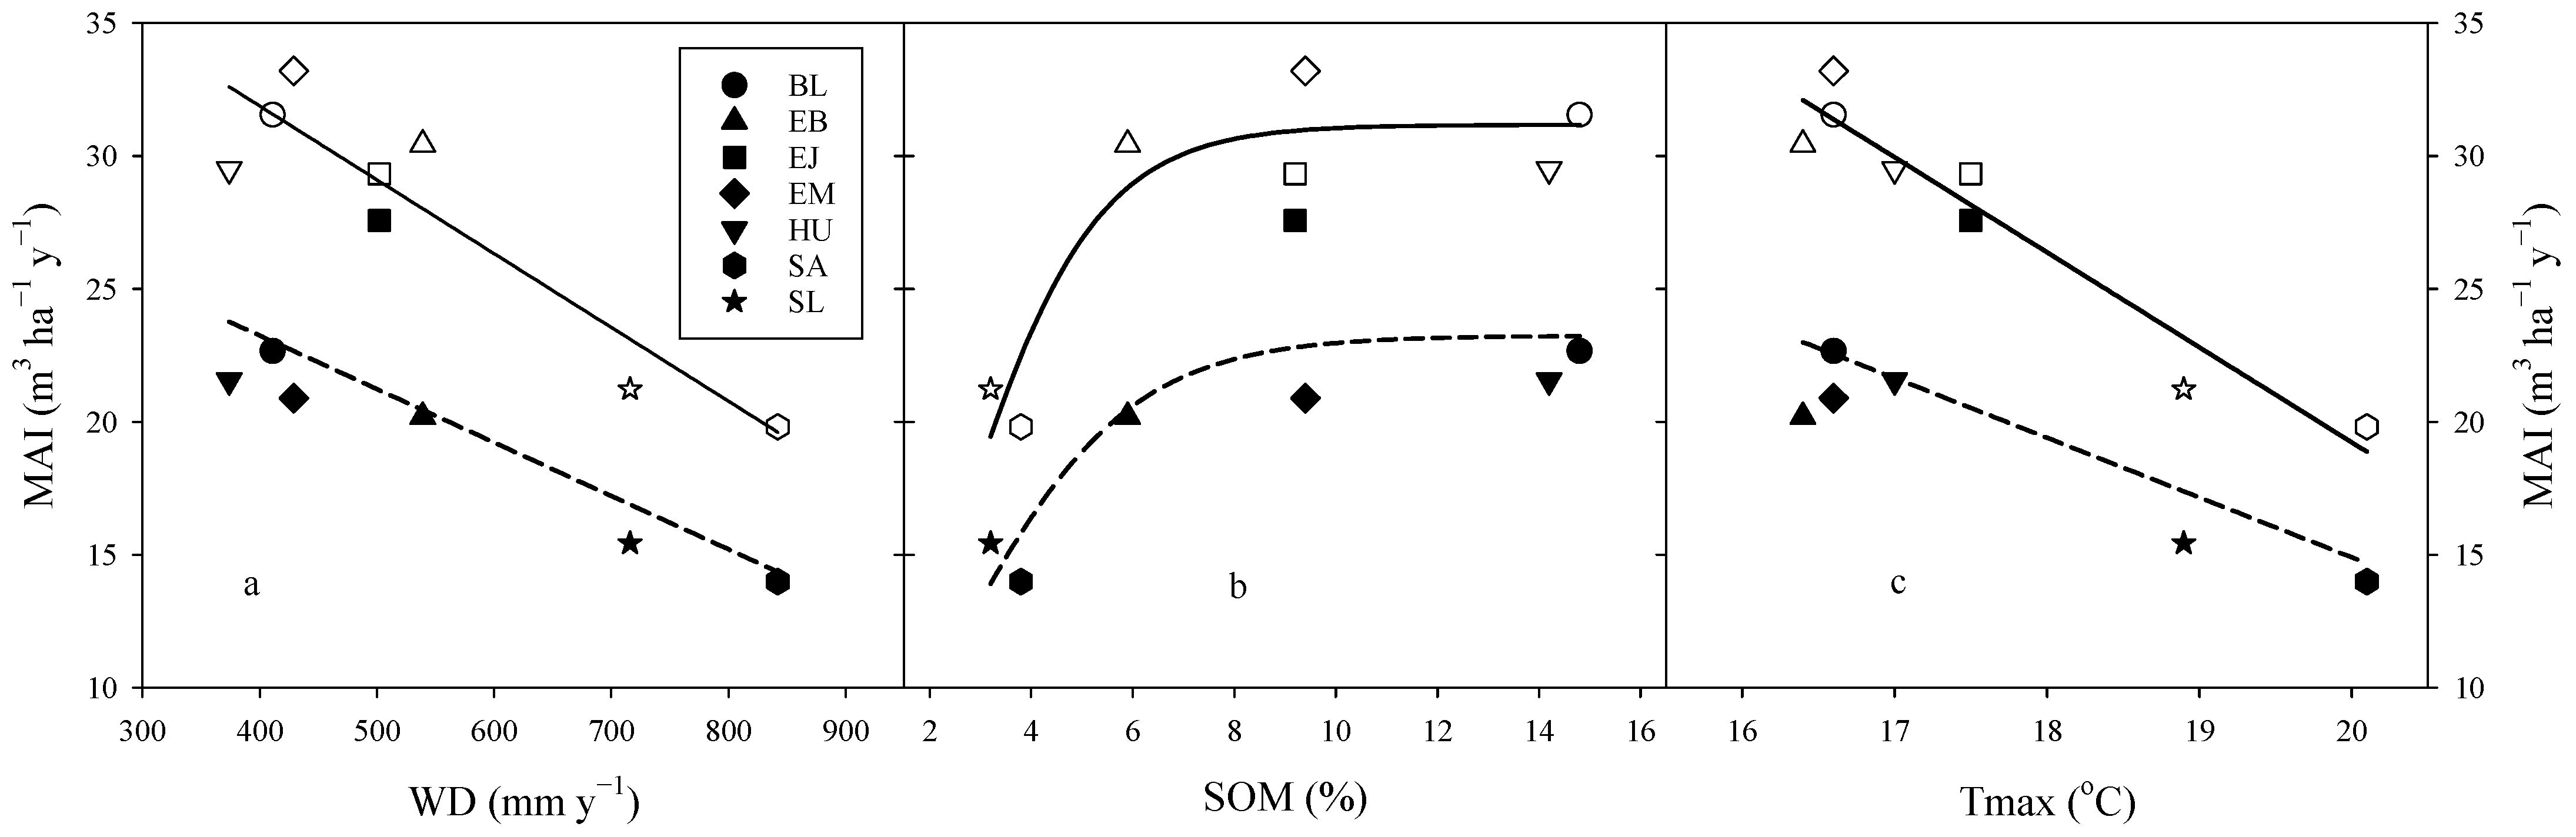
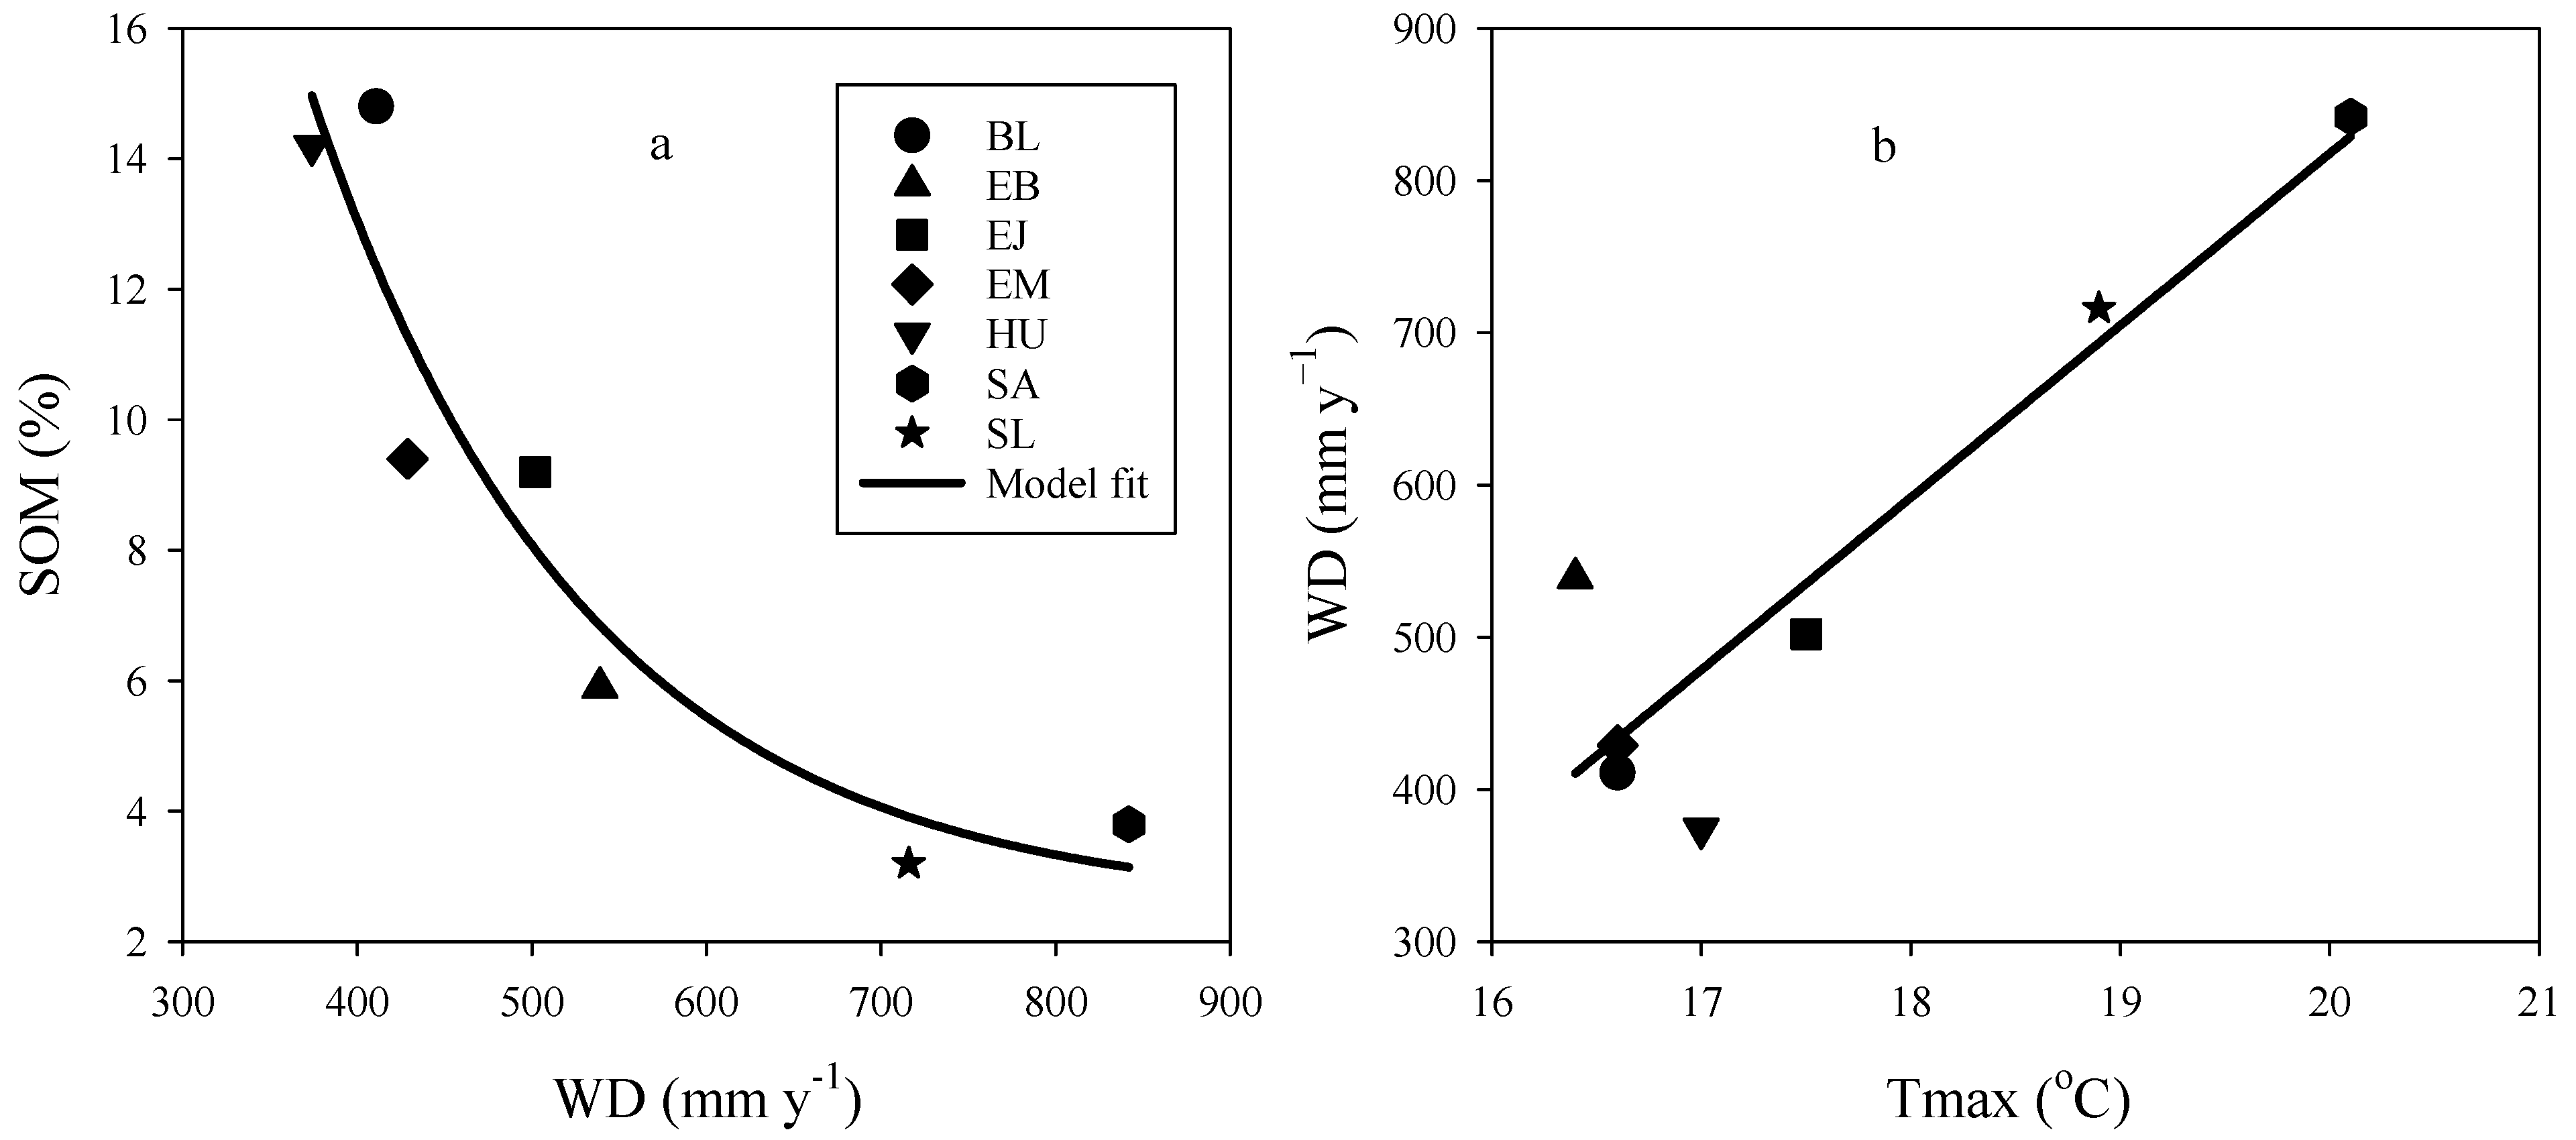
3.5. Relationship between Environmental Conditions and Stand Productivity
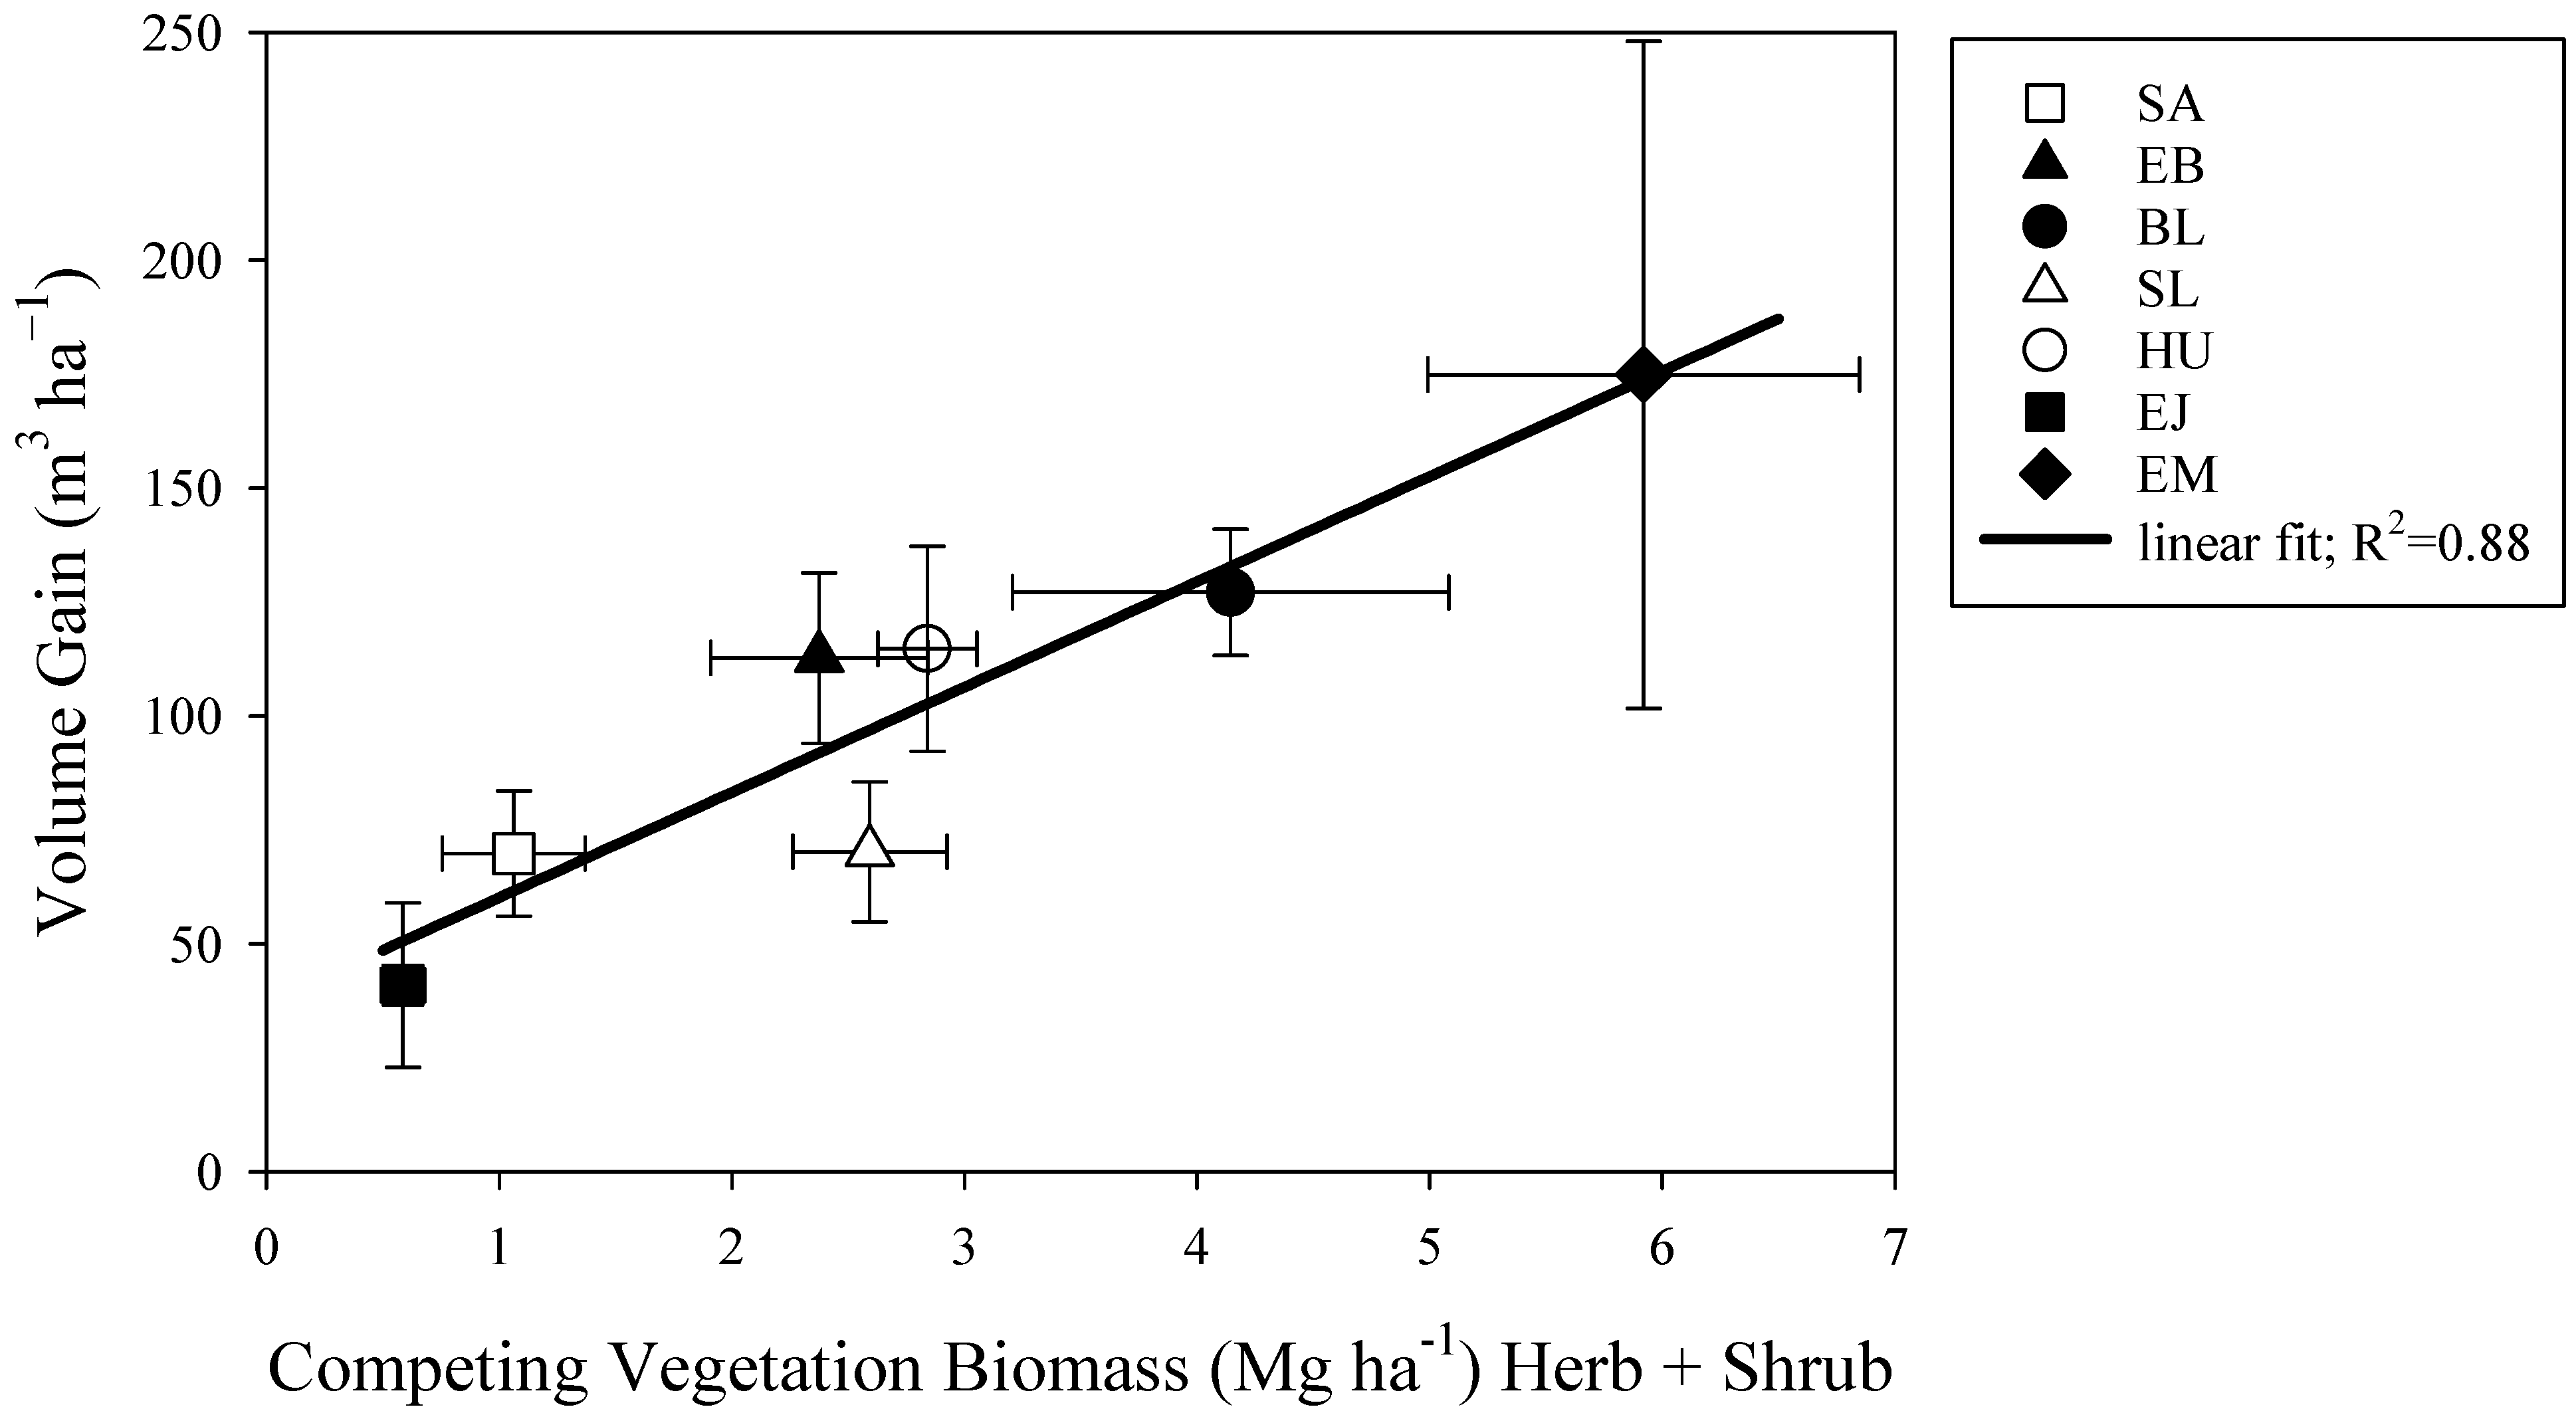
3.6. Relationship between Volume Response and Competing Vegetation Biomass
4. Discussion
5. Conclusions
Author Contributions
Funding
Data Availability Statement
Acknowledgments
Conflicts of Interest
References
- FAO. Global Forest Resources Assessment 2010; FAO Technical Paper; Food and Agriculture Organization of the United Nations: Rome, Italy, 2013. [Google Scholar]
- INFOR. Anuario Forestal 2021 Análisis de los Factores que Están Incidiendo en la Oferta de la Madera de Plantaciones Forestales en los Últimos Años. Documento de Divulgación N° 60; Instituto Forestal: Santiago, Chile, 2021. [Google Scholar]
- Harmon, M. Carbon sequestration in forests: Addressing the scale question. J. For. 2001, 99, 24–29. [Google Scholar]
- Bauhus, J.; Van Der Mer, P.; Kanninen, M. Ecosystem Goods and Services from Plantation Forests; Earthscan: London, UK, 2010; 208p. [Google Scholar]
- Balandier, P.; Collet, C.; Miller, J.; Reynolds, P.; Zedaker, S. Designing Forest vegetation management strategies based on the mechanisms and dynamics of plantation tree competition by neighboring vegetation. Forestry 2006, 79, 3–27. [Google Scholar] [CrossRef] [Green Version]
- Wagner, R.; Little, K.; Richardson, B.; McNabb, K. The role of vegetation management for enhancing productivity of the world’s forests. Forestry 2006, 79, 57–79. [Google Scholar] [CrossRef]
- Albaugh, T.; Alvarez, J.; Rubilar, R.; Fox, T.; Allen, L.; Stape, J.; Mardones, O. Long-term Pinus radiata productivity gains from tillage, vegetation control, and fertilization. For. Sci. 2015, 61, 800–808. [Google Scholar] [CrossRef] [Green Version]
- Gonzalez-Benecke, C.A.; Flamenco, H.; Wightman, M. Effect of Vegetation Management and Site Conditions on Volume, Biomass and Leaf Area Allometry of Four Coniferous Species in the Pacific Northwest United States. Forests 2018, 9, 581. [Google Scholar] [CrossRef] [Green Version]
- Vargas, F.; Rubilar, R.; Gonzalez-Benecke, C.; Sanchez-Olate, M.; Aracena, P. Long-term response to area of competition control in Eucalyptus globulus plantations. New For. 2018, 49, 383–398. [Google Scholar] [CrossRef]
- Richardson, B.; Vanner, A.; Ray, J.; Davenhill, N.; Coker, G. Mechanisms of Pinus radiata growth suppression by some common forest weed species. N. Z. J. For. Sci. 1996, 26, 265–275. [Google Scholar]
- Little, K.; Rolando, C. The impact of vegetation control on the establishment of pine at four sites in the summer rainfall region of South Africa. S. Afr. For. J. 2001, 2001, 192. [Google Scholar] [CrossRef]
- Watt, M.; Kimberley, M.; Richardson, B.; Whitehead, D.; Mason, E. Testing a juvenile tree growth model sensitive to competition from weeds, using Pinus radiata at two contrasting sites in New Zealand. Can. J. For. Res. 2004, 34, 1985–1992. [Google Scholar] [CrossRef]
- Rose, R.; Rosner, L.; Scott, J. Twelfth-year response of Douglas-fir to area of weed control and herbaceous versus woody weed control treatments. Can. J. For. Res. 2006, 36, 2464–2473. [Google Scholar] [CrossRef] [Green Version]
- Flamenco, H.; Gonzalez-Benecke, C.; Wightman, M. Long-term effects of vegetation management on biomass stock of four coniferous species in the Pacific Northwest United States. For. Ecol. Manag. 2019, 432, 276–285. [Google Scholar] [CrossRef]
- Richardson, B.; Davenhill, N.; Coker, G.; Ray, J.; Vanner, A.; Kimberly, M. Optimising spot weed control regimes for Pinus radiata. Can. J. For. Res. 2019, 49, 759–766. [Google Scholar] [CrossRef]
- Zutter, B.; Miller, J. Eleventh-year response of loblolly pine and competing vegetation to woody and herbaceous control on a Georgia flatwoods site. South. J. Appl. For. 1998, 22, 88–95. [Google Scholar] [CrossRef] [Green Version]
- Kogan, M.; Figueroa, R.; Gilabert, H. Weed control intensity effects on young radiata pine growth. Plant. Prot. 2002, 21, 253–257. [Google Scholar] [CrossRef]
- Rolando, C.; Watt, M.; Todoroki, C.; Henley, D.; Leckie, A. Herbicide options for managing competitive vegetation during the establishment of Pinus radiata and Pseudotsuga menziesii var. menziesii in Southland, New Zealand. N. Z. J. For. Sci. 2017, 47, 1. [Google Scholar] [CrossRef] [Green Version]
- Dougherty, P.; Lowery, R. Spot-size of herbaceous control impacts loblolly pine seedling survival and growth. South. J. Appl. For. 1991, 15, 193–199. [Google Scholar] [CrossRef]
- Adams, P.; Beadle, C.; Mendham, N.; Smethurst, P. The impact of timing and duration of grass control on the growth of a young Eucalyptus globulus Labill plantation. New For. 2003, 26, 147–165. [Google Scholar] [CrossRef]
- Wagner, R.; Petersen, T.; Ross, D.; Radosevich, S. Competition thresholds for the survival and growth of ponderosa pine seedlings associated with woody and herbaceous vegetation. New For. 1989, 3, 151–170. [Google Scholar] [CrossRef]
- Henkel-Johnson, D.; Macdonald, S.; Bork, E.; Thomas, B. Influence of weed composition, abundance, and spatial proximity on growth in young hybrid poplar plantations. For. Ecol. Manag. 2016, 362, 55–68. [Google Scholar] [CrossRef]
- Rose, R.; Rosner, L. Eighth-year response of Douglas-fir seedlings to area of weed control and herbaceous versus woody weed control. Ann. For. Sci. 2005, 62, 481–492. [Google Scholar] [CrossRef]
- Little, K.; Rolando, C. Regional vegetation management standards for commercial Eucalyptus plantations in South Africa. South. For. 2008, 70, 87–97. [Google Scholar] [CrossRef]
- Dinger, E.; Rose, R. Integration of soil moisture, xylem water potential, and fall–spring herbicide treatments to achieve the maximum growth response in newly planted Douglas-Fir seedlings. Can. J. For. 2009, 39, 1401–1414. [Google Scholar] [CrossRef]
- Coffré, W. Modelos Fustales. Tesis de Ingeniería Forestal, Valdivia, Universidad Austral de Chile, Facultad de Ingeniería Forestal, Valdivia, Chile, 1983. [Google Scholar]
- Wagner, R. Competition and critical period thresholds for vegetation management decisions in young conifer stands. For. Chron. 2000, 76, 961–968. [Google Scholar] [CrossRef] [Green Version]
- Nambiar, E.K.S.; Sands, R. Competition for water and nutrients in forests. Can. J. For. Res. 1993, 23, 1955–1968. [Google Scholar] [CrossRef]
- Herrick, J.; Maherali, H.; Thomas, R. Reduced stomatal conductance in sweetgum (Liquidambar styraciflua) sustained over long-term CO2 enrichment. New Phytol. 2004, 162, 387–396. [Google Scholar] [CrossRef]
- Alvarez, J.; Allen, L.; Albaugh, T.; Stape, J.; Bullock, B.; Song, C. Factors influencing the growth of radiata pine plantations in Chile. Forestry 2012, 86, 13–26. [Google Scholar] [CrossRef] [Green Version]
- Sands, P.; Landsberg, J. Parameterisation of 3-PG for plantation grown Eucalyptus globulus. For. Ecol. Manag. 2002, 63, 273–292. [Google Scholar] [CrossRef]
- Zutter, B.; Mitchell, R.; Glover, G.; Gjerstad, D. Root length and biomass in mixtures of broom sedge with loblolly pine and sweetgum. Can. J. For. Res. 1999, 29, 92. [Google Scholar] [CrossRef]
- Balandier, P.; Rapey, H.; Ruchaud, F.; De Montard, F. Agroforesterie en Europe de l’Ouest: Pratiques t experimentations sylvopastorales des montagnes de la zone tempérée. Cah. Agric. 2002, 11, 103–113. [Google Scholar]
- Casper, B.; Jackson, R. Plant competition underground. Annu. Rev. Ecol. Syst. 1997, 28, 545–570. [Google Scholar] [CrossRef] [Green Version]
- Goncalves, J.; Stape, J.; Laclau, J.; Smethurst, P.; Gava, J. Silvicultural effects on the productivity and wood quality of eucalypt plantations. For. Ecol. Manag. 2004, 193, 45–61. [Google Scholar] [CrossRef]
- Little, K.; Schumann, A. A new systematic trial design for the optimization of interspecific weed control. In Proceedings of the 11th Australian Weeds Conference, Melbourne, Australia, 30 September–3 October 1996; Weed Science Society of Victoria Frankston: Melbourne, Australia, 1996; pp. 440–444. [Google Scholar]
- Nambiar, S.; Zed, P. Influence of weeds on the water potential, nutrient content and growth of young radiata pine. Aust. For. Res. 1980, 10, 279–288. [Google Scholar]
- Little, K.; Van Staden, J. Interspecific competition affects early growth of a Eucalyptus grandis x E. camaldulensis hybrid clone in Zululand. S. Afr. J. Bot. 2003, 69, 505–513. [Google Scholar] [CrossRef] [Green Version]
- Garau, A.; Lemcoff, J.; Ghersa, C.; Beadle, C. Water stress tolerance in Eucalyptus globulus Labill subsp. maidenii (F. Muell.) saplings induced by water restrictions imposed by weeds. For. Ecol. Manag. 2008, 255, 2811–2819. [Google Scholar] [CrossRef]
- Gonzalez-Benecke, C.A.; Dinger, E.J. Use of water stress integral to evaluate relationships between soil moisture, plant water stress and stand productivity in young Douglas-fir trees. New For. 2018, 49, 775–789. [Google Scholar] [CrossRef]
- George, B.; Brennan, P. Herbicides are more cost-effective than alternative weed control methods for increasing early growth of Eucalyptus dunnii and Eucalyptus saligna. New For. 2002, 24, 147–163. [Google Scholar] [CrossRef]
- Coll, L.; Balandier, P.; Picon-Cochard, C. Morphological and physiological responses of beech (Fagus sylvatica) seedlings to grass-induced belowground competition. Tree Physiol. 2004, 24, 45–54. [Google Scholar] [CrossRef] [Green Version]
- Harper, G.; Comeau, P.; Biring, B. A comparison of herbicide and mulch mat treatments for reducing grass, herb, and shrub competition in the BC Interior Douglas-Fir zone—Ten years results. West. J. Appl. For. 2005, 20, 167–176. [Google Scholar] [CrossRef] [Green Version]
- Garau, A.; Ghersa, C.; Lemcoff, J.; Barañao, J. Weeds in Eucalyptus globulus subsp. maidenii (F. Muell) establishment: Effects of competition on sapling growth and survivorship. New For. 2009, 37, 251–264. [Google Scholar] [CrossRef]


| Site | Latitude (South) | Longitude (West) | Altitude (m) | Rain (mm y−1) | PET (mm y−1) | WD (mm y−1) | Tmax (°C) | Tmin (°C) | SD (m) | Clay (%) | Soil Texture | SOM (%) |
|---|---|---|---|---|---|---|---|---|---|---|---|---|
| SA | 36°3′ | 71°7′ | 268 | 966 | 1380 | −842 | 20.1 | 6.9 | 2.2 | 44.7 | Clay | 3.8 |
| EB | 37°7′ | 73°4′ | 255 | 1467 | 1002 | −539 | 16.4 | 8.0 | 2.8 | 45.4 | Clay | 5.9 |
| BL | 38°1′ | 71°9′ | 753 | 2255 | 1157 | −411 | 16.6 | 5.0 | 2.9 | 17.2 | Loam | 14.8 |
| SL | 38°1′ | 72°7′ | 197 | 991 | 1217 | −716 | 18.9 | 6.9 | 2.9 | 41.1 | Clay | 3.2 |
| HU | 40°1′ | 73°0′ | 202 | 1739 | 1112 | −374 | 17.0 | 6.1 | 2.4 | 25.1 | Loam | 14.2 |
| EJ | 40°3′ | 73°1′ | 93 | 1299 | 1131 | −502 | 17.5 | 6.5 | 2.5 | 33.2 | Clay loam | 9.2 |
| EM | 40°7′ | 73°3′ | 52 | 1367 | 1047 | −429 | 16.6 | 6.7 | 2.1 | 42.5 | Clay loam | 9.4 |
| Treatments | Spot Diameter (m) | Timing of Control (Years) | Area of Control (%) |
|---|---|---|---|
| Control | No herbicide | - | 0 |
| Spot0.75Y0 | 0.75 | 0 | 6 |
| Spot1.5Y0 | 1.5 | 0 | 28 |
| Spot1.5Y01 | 1.5 | 0 and 1 | 28 |
| Spot1.5Y012 | 1.5 | 0, 1, and 2 | 28 |
| TotalY0 | Weed-free | 0 | 100 |
| TotalY01 | Weed-free | 0 and 1 | 100 |
| TotalY012 | Weed-free | 0, 1, and 2 | 100 |
| Site | Treatment | BA (m2 ha−1) | DBH (cm) | H (m) | VOL (m3 ha−1) | Survival (%) | |||||
|---|---|---|---|---|---|---|---|---|---|---|---|
| SA | Control | 29.6 | a | 17.7 | a | 16.5 | a | 167.8 | a | 86.7 | a |
| (12.0) | Spot0.75 Y0 | 34.7 | a | 19.5 | ab | 17.8 | a | 209.7 | ab | 85.0 | a |
| Spot1.5 Y0 | 35.0 | a | 19.5 | ab | 16.9 | a | 202.7 | ab | 85.9 | a | |
| Spot1.5 Y01 | 35.3 | a | 19.2 | ab | 17.4 | a | 207.5 | ab | 89.2 | a | |
| Spot1.5 Y012 | 35.5 | a | 19.7 | b | 17.5 | a | 210.1 | ab | 85.0 | a | |
| Total Y0 | 34.6 | a | 19.2 | ab | 17.2 | a | 202.2 | ab | 85.9 | a | |
| Total Y01 | 37.0 | a | 20.0 | b | 18.0 | a | 236.9 | b | 83.4 | a | |
| Total Y012 | 38.8 | a | 20.7 | b | 18.0 | a | 237.7 | b | 84.2 | a | |
| EB | Control | 36.3 | a | 18.9 | a | 18.1 | a | 226.1 | a | 94.0 | a |
| (11.2) | Spot0.75 Y0 | 35.8 | a | 18.8 | a | 18.1 | a | 226.5 | a | 92.5 | a |
| Spot1.5 Y0 | 34.4 | ab | 18.4 | a | 18.1 | a | 226.6 | a | 89.1 | a | |
| Spot1.5 Y01 | 43.4 | abc | 20.6 | ab | 18.7 | a | 276.9 | ab | 93.3 | a | |
| Spot1.5 Y012 | 42.0 | abc | 20.6 | ab | 18.9 | a | 273.0 | ab | 92.4 | a | |
| Total Y0 | 50.4 | b | 22.9 | b | 19.1 | a | 325.2 | b | 91.9 | a | |
| Total Y01 | 50.9 | c | 24.3 | b | 19.2 | a | 329.8 | b | 84.6 | a | |
| Total Y012 | 52.9 | c | 23.8 | b | 19.1 | a | 340.8 | b | 90.6 | a | |
| BL | Control | 42.1 | a | 22.7 | a | 22.3 | a | 324.0 | a | 74.7 | a |
| (14.3) | Spot0.75 Y0 | 45.4 | ab | 22.6 | a | 22.2 | a | 347.3 | ab | 82.0 | a |
| Spot1.5 Y0 | 51.5 | b | 23.9 | ab | 22.8 | a | 397.8 | ab | 84.0 | a | |
| Spot1.5 Y01 | 48.9 | a | 24.2 | ab | 23.0 | a | 384.7 | ab | 77.4 | a | |
| Spot1.5 Y012 | 48.8 | a | 23.6 | ab | 22.6 | a | 374.0 | ab | 80.7 | a | |
| Total Y0 | 51.3 | b | 24.9 | b | 23.3 | a | 408.5 | bc | 78.0 | a | |
| Total Y01 | 55.6 | c | 25.0 | b | 23.7 | a | 445.8 | c | 82.7 | a | |
| Total Y012 | 57.4 | c | 25.0 | b | 22.8 | a | 451.1 | c | 86.0 | a | |
| SL | Control | 33.0 | a | 19.9 | a | 16.7 | a | 186.7 | a | 77.5 | a |
| (12.1) | Spot0.75 Y0 | 40.3 | ab | 20.9 | a | 17.4 | ab | 236.4 | a | 86.7 | a |
| Spot1.5 Y0 | 41.2 | ab | 20.7 | a | 17.5 | ab | 243.6 | a | 90.0 | a | |
| Spot1.5 Y01 | 40.4 | ab | 21.6 | a | 18.0 | bc | 245.2 | a | 82.5 | a | |
| Spot1.5 Y012 | 40.4 | ab | 21.2 | a | 17.2 | bc | 235.0 | a | 85.0 | a | |
| Total Y0 | 38.3 | ab | 21.4 | a | 17.5 | bc | 226.1 | a | 80.0 | a | |
| Total Y01 | 40.3 | bc | 20.2 | a | 17.4 | bc | 235.5 | a | 92.5 | a | |
| Total Y012 | 42.6 | bc | 20.9 | a | 17.8 | bc | 256.8 | b | 90.9 | a | |
| HU | Control | 43.5 | a | 21.2 | a | 19.6 | a | 306.1 | a | 84.2 | a |
| (14.2) | Spot0.75 Y0 | 43.0 | ab | 22.8 | ab | 20.6 | ab | 311.6 | ab | 74.2 | a |
| Spot1.5 Y0 | 43.8 | ab | 21.3 | ab | 20.3 | ab | 318.0 | ab | 84.2 | a | |
| Spot1.5 Y01 | 46.1 | ab | 23.5 | ab | 20.7 | ab | 334.6 | ab | 74.2 | a | |
| Spot1.5 Y012 | 44.1 | ab | 22.1 | ab | 20.2 | ab | 315.4 | ab | 80.0 | a | |
| Total Y0 | 52.5 | ab | 24.2 | ab | 21.0 | ab | 384.3 | ab | 80.9 | a | |
| Total Y01 | 50.6 | ab | 23.3 | ab | 20.5 | ab | 365.5 | ab | 83.4 | a | |
| Total Y012 | 57.0 | b | 25.0 | b | 21.5 | b | 418.9 | b | 84.2 | a | |
| EJ | Control | 57.0 | a | 24.0 | a | 17.0 | a | 330.9 | a | 92.0 | a |
| (11.0) | Spot0.75 Y0 | 56.8 | a | 23.9 | a | 17.1 | a | 331.2 | a | 92.7 | a |
| Spot1.5 Y0 | 58.2 | a | 23.8 | a | 16.9 | a | 336.7 | a | 95.4 | a | |
| Spot1.5 Y01 | 59.0 | a | 23.9 | a | 17.1 | a | 345.5 | a | 96.0 | a | |
| Spot1.5 Y012 | 60.1 | a | 24.5 | a | 17.3 | a | 353.2 | a | 93.4 | a | |
| Total Y0 | 58.7 | a | 24.3 | a | 17.3 | a | 345.7 | a | 92.7 | a | |
| Total Y01 | 57.7 | a | 23.8 | a | 17.0 | a | 334.9 | a | 94.7 | a | |
| Total Y012 | 59.9 | a | 24.4 | a | 17.3 | a | 351.9 | a | 93.4 | a | |
| EM | Control | 42.1 | a | 21.2 | a | 19.3 | a | 296.6 | a | 78.9 | a |
| (14.2) | Spot0.75 Y0 | 55.5 | b | 23.7 | ab | 21.6 | ab | 413.2 | b | 90.0 | a |
| Spot1.5 Y0 | 55.0 | b | 22.8 | ab | 21.8 | ab | 425.1 | b | 94.5 | a | |
| Spot1.5 Y01 | 59.3 | b | 23.2 | ab | 20.4 | ab | 439.5 | b | 97.8 | a | |
| Spot1.5 Y012 | 60.2 | b | 24.6 | ab | 21.1 | ab | 454.9 | b | 91.1 | a | |
| Total Y0 | 55.8 | b | 23.7 | ab | 21.9 | b | 427.4 | b | 90.0 | a | |
| Total Y01 | 58.5 | b | 24.1 | ab | 22.0 | b | 450.3 | b | 91.1 | a | |
| Total Y012 | 62.9 | b | 25.1 | b | 22.6 | b | 471.4 | c | 93.4 | a |
| Site | Age 4 Years | Age 8 Years | ||||||||
|---|---|---|---|---|---|---|---|---|---|---|
| BA | DBH | H | VOL | Survival | BA | DBH | H | VOL | Survival | |
| SA | 0.012 | 0.005 | 0.053 | 0.035 | 0.720 | 0.015 | 0.032 | 0.234 | 0.013 | 0.720 |
| EB | <0.001 | <0.001 | 0.004 | <0.001 | 0.417 | <0.001 | < 0.001 | 0.049 | <0.001 | 0.573 |
| BL | <0.001 | <0.001 | <0.001 | <0.001 | 0.293 | <0.001 | <0.001 | <0.001 | < 0.001 | 0.338 |
| SL | <0.001 | <0.001 | <0.001 | <0.001 | 0.110 | 0.025 | 0.183 | 0.004 | 0.017 | 0.649 |
| HU | <0.001 | <0.001 | <0.001 | <0.001 | 0.482 | <0.001 | <0.001 | <0.001 | <0.001 | 0.546 |
| EJ | 0.044 | 0.041 | 0.037 | 0.048 | 0.731 | 0.196 | 0.145 | 0.425 | 0.243 | 0.972 |
| EM | <0.001 | <0.001 | <0.001 | 0.012 | 0.130 | 0.004 | 0.002 | 0.001 | 0.004 | 0.102 |
| Site | BA | DBH | H | VOL | Survival |
|---|---|---|---|---|---|
| SA | 0.061 | 0.003 | 0.449 | 0.030 | 0.785 |
| EB | 0.001 | <0.001 | 0.425 | 0.001 | 0.840 |
| BL | 0.001 | 0.003 | 0.057 | <0.001 | 0.491 |
| SL | 0.078 | 0.604 | 0.410 | 0.089 | 0.356 |
| HU | 0.032 | 0.023 | 0.172 | 0.048 | 0.678 |
| EJ | 0.823 | 0.6020 | 0.946 | 0.914 | 0.497 |
| EM | 0.089 | 0.0244 | 0.011 | 0.042 | 0.106 |
| Treatment | Model | Parameter | Parameter Estimate | SE | Adj-R2 | RMSE | CV |
|---|---|---|---|---|---|---|---|
| Control | MAI = a + b·WD + c·Bv | a | 40.8652 | 5.03535 | 0.831 | 2.97 | 11.27 |
| b | −0.0295 | 0.00668 | |||||
| c | −1.5747 | 0.65616 | |||||
| Total Y0,1,2 | MAI = a + b·Tmax | a | 90.7169 | 8.06461 | 0.924 | 1.57 | 5.62 |
| b | −3.5742 | 0.45735 | |||||
| Total Y0,1,2 | VOL gain = a + b·Bv | a | 32.0637 | 9.35898 | 0.880 | 12.37 | 12.19 |
| b | 24.5400 | 2.86556 | |||||
| SOM = a + b· | a | 2.5186 | 1.3437 | 0.884 | 1.56 | 18.04 | |
| b | 136.3 | 40.873 | |||||
| c | 0.0064 | 0.00189 | |||||
| WD = a + b·Tmax | a | −1444.3916 | 396.3589 | 0.835 | 77.05 | 14.14 | |
| b | 113.1091 | 22.47778 |
Disclaimer/Publisher’s Note: The statements, opinions and data contained in all publications are solely those of the individual author(s) and contributor(s) and not of MDPI and/or the editor(s). MDPI and/or the editor(s) disclaim responsibility for any injury to people or property resulting from any ideas, methods, instructions or products referred to in the content. |
© 2022 by the authors. Licensee MDPI, Basel, Switzerland. This article is an open access article distributed under the terms and conditions of the Creative Commons Attribution (CC BY) license (https://creativecommons.org/licenses/by/4.0/).
Share and Cite
Vargas, F.; Gonzalez-Benecke, C.A.; Ahumada, R. Long-Term Responses to Competing Vegetation Management for Pinus radiata. Forests 2023, 14, 55. https://doi.org/10.3390/f14010055
Vargas F, Gonzalez-Benecke CA, Ahumada R. Long-Term Responses to Competing Vegetation Management for Pinus radiata. Forests. 2023; 14(1):55. https://doi.org/10.3390/f14010055
Chicago/Turabian StyleVargas, Felipe, Carlos A. Gonzalez-Benecke, and Rodrigo Ahumada. 2023. "Long-Term Responses to Competing Vegetation Management for Pinus radiata" Forests 14, no. 1: 55. https://doi.org/10.3390/f14010055