Article

Transcriptome Analysis Reveals the Molecular Mechanisms Associated with Flower Color Formation in Camellia japonica ‘Joy Kendrick’

1
School of Marine Sciences, Ningbo University, Ningbo 315800, China
2
Key Laboratory of Tree Breeding of Zhejiang Province, Research Institute of Subtropical Forestry, Chinese Academy of Forestry, Hangzhou 311400, China
*
Authors to whom correspondence should be addressed.
Forests 2023, 14(1), 69; https://doi.org/10.3390/f14010069
Submission received: 18 November 2022 / Revised: 27 December 2022 / Accepted: 28 December 2022 / Published: 30 December 2022
(This article belongs to the Special Issue Genetic Regulation of Growth and Development of Woody Plants)

Abstract

:
Camellia japonica is a woody flower with high ornamental and economic value used for landscaping and as a pot plant. Floral colors are among the most important ornamental traits of flower plants, particularly multicolored flowers. The C. japonica cultivar ‘Joy Kendrick’ has multicolored flowers; the corolla is pink with darker red stripes, but the molecular mechanism underlying this trait is unknown. Here, pigment analysis showed that there are more anthocyanins accumulate in red petal regions than in pink areas, which may be key to formation of red stripes. Furthermore, transcriptome analysis revealed that anthocyanin biosynthesis, modification, and transporter genes are highly expressed in red stripes, consistent with the observed anthocyanin accumulation. In addition, many plant hormone signal transduction genes, particularly auxin, may contribute to the regulation of red stripe formation. This study provides broad insights into pigment accumulation and the regulatory mechanisms underlying floral color formation in C. japonica, and lays a foundation for breeding new C. japonica varieties.

1. Introduction

Flower color is among the most important traits of ornamental plants, and a consistent focus of biological research. Anthocyanins are flavonoids that form the pigment basis of flower color, and generate a wide variety of colors in plants, including red, pink, purple, and blue [1]. Further, anthocyanins act as efficient sunscreens, protecting plants from high-light stress, and behave as reactive oxygen species (ROS) scavengers that help to neutralize the ROS formed under stress conditions [2,3]. Moreover, anthocyanins exert a positive effect on human health [4,5], acting as potent antioxidants with beneficial effects on cardiovascular disease, cancer, and other chronic diseases [6,7,8].
Anthocyanins are formed from a flavylium cation backbone, derived from the flavonoid pathway, and hydroxylated in different positions [9]. Phenylalanine is the precursor for anthocyanin formation, which forms cinnamic acid via phenylalanine ammonia lyase (PAL) catalysis [10]. Subsequently, with the help of cinnamic acid 4-hydroxylase (C4H) and 4-coumaroyl: Co A ligase (4CL), cinnamic acid is converted to malonyl-CoA. Then, chalcone synthase (CHS) catalyzes the formation of tetrahydroxychalcone from one molecule of coumaric acid and three molecules of malonyl-CoA. Tetrahydroxychalcone is the substrate for chalcone isomerase (CHI), and CHI can cyclize tetrahydroxychalcone to generate naringenin, which is a key branch point for production of isoflavonoids, flavonols, flavanones, and anthocyanins. During the synthesis of anthocyanins, naringenin is hydroxylated by flavanone 3-hydroxylase (F3H) to generate dihydrokaempferol. Next, dihydrokaempferol is converted to leucocyanidin for anthocyanin biosynthesis by dihydroflavonol 4-reductase (DFR) [11]. Finally, anthocyanidin synthase (ANS) catalyzes the formation of colored anthocyanidins [12,13], which are covalently modified by glycosylation, methylation, and acylation, to form anthocyanins, which are more stable in structure and deeper in color. In addition, anthocyanins are transported into vacuoles, and ATP-binding cassette (ABC), multidrug and toxic compound extrusion transporter, and glutathione S-transferase (GST) family proteins are important for this process [14,15].
The formation of floral pigment patterns is caused by differences in pigment in epidermal cells, and impacts the behavior of pollinators and the ornamental value of flowers [16,17,18]. Bumblebees have an instinctive preference for two-colored flowers over single-colored flowers [19], and significantly favor radial over concentric patterns and non-patterned discs [20]. Flower blotches are mainly caused by accumulation of anthocyanins. Red blotches in Oncidium are comprised of cyanidin and peonidin [21], while cyanidin-based glycosides accumulation cause formation of cyanic blotches in the petals of the tree peony [22].
Plant hormones are a class of small molecules that regulate a wide range of physiological responses and developmental processes of plants [23], such as stress adaptation [24], seed germination [25], and flowering [26], and are important regulators modulating anthocyanin accumulation. Abscisic acid (ABA) treatment induces the expression of genes involved in anthocyanin biosynthesis in grapevine [27], while auxin tends to exert an opposite effect [28]. Ethylene and jasmonic acid are combined via the MdERF1B-MdMYC2 module to control the production of anthocyanins in apple [29].
Transcription factors (TFs), and particularly MYB TFs, control the expression of structural genes involved in anthocyanin biosynthesis at the level of transcription. In sweet cherry, PavMYB10.1 is involved in anthocyanin biosynthesis and participates in fruit skin color formation [30]. Further, MYB6 promotes anthocyanin and proanthocyanidin biosynthesis in Populus tomentosa [31], while CsMYB78 and CsMYB33 contribute to anthocyanin biosynthesis activation in Cannabis sativa [32]. Numerous studies have shown that MYB TFs interact with basic helix-loop-helix (bHLH) and WD-repeat proteins (WDR) TFs to form the MBW (MYB–bHLH–WDR) complex, which orchestrates anthocyanin biosynthesis. The MYB5–TT8–TTG1 complex contributes to control of DFR, leucoanthocyanidin dioxygenase (LDOX), and transparent testa 12 expression, whereas TT2–EGL3/GL3–TTG1 complexes are functional regulators involved in regulation of LDOX, banyuls (anthocyanidin reductase), autoinhibited H+-ATPase isoform 10, and DFR transcription [33,34].
Camellia japonica is a well-known ornamental plant, popular for its colorful and multiform petals, which attracts considerable attention from horticultural researchers. Contrasting flower color patterns are often considered as signals that facilitate communication between plants and pollinators [17,35], and this phenomenon has been studied extensively [36,37]. The C. japonica cultivar, ‘Joy Kendrick’ has beautiful flowers with darker red stripes on the petals; however, the molecular mechanism underlying this phenotype is unclear, and the lack of knowledge has limited the breeding of new C. japonica cultivars with more desirable flowering traits. In this study, we sampled red and pink regions from ‘Joy Kendrick’ petals separately and conducted transcriptome sequencing to elucidate the mechanism underlying flower color formation.

2. Materials and Methods

2.1. Plant Materials and Sample Collection

‘Joy Kendrick’ petals were obtained from the Germplasm Resource Center of the Institute of Subtropical Forestry, Chinese Academy of Forestry (Daqiao Road, Hangzhou City, China). Petals from plants in full-flower were separated into two parts: pink (P) and red (R). All samples were snap-frozen in liquid nitrogen and stored at −80 °C.

2.2. Determination of Anthocyanin Content

Anthocyanin content in fresh pink and red flower samples was determined using a Plant Anthocyanin Content Detection Kit BC1385 (Solarbio, Beijing, China).

2.3. Transcriptome Analysis

All samples were ground in liquid nitrogen, and a plant RNA extraction kit DP441 (TIANGEN, Beijing, China) was used to purify RNA. Three biological replicates were included for each sample. RNA quality was examined using NanoDrop1000 (ThermoFisher, Waltham, MA, USA) and Agilent 2100 (Agilent Technologies, Santa Clara, CA, USA) instruments. Poly-T oligo-attached magnetic beads were used to purify mRNA from total RNA, first strand cDNA synthesis was performed using random hexamer primers and M-MuLV Reverse Transcriptase, and second strand synthesis using DNA Polymerase I and dNTPs. Finally, RNA sequencing was performed on the Illumina NovaSeq 6000 platform (Illumina, San Diego, CA, USA).

2.4. De Novo Assembly and Functional Annotation of Unigenes

Clean data were obtained by eliminating adapter reads and low-quality reads from raw data. Then Q20, Q30, and GC values were calculated to assess the clean data. Trinity software (v2.6.6) was used for de novo assembly of clean reads, with min-kmer-cov set to 2 and default parameters for other options. Gene function annotation was performed based on the following databases: NCBI non-redundant protein sequences (Nr), NCBI non-redundant nucleotide sequences (Nt), Protein family (Pfam), Clusters of Orthologous Groups of proteins (KOG/COG), Swiss-Prot (a manually annotated and reviewed protein sequence database), Kyoto Encyclopedia of Genes and Genomes (KEGG), and Gene Ontology (GO). Plant TFs were predicted using iTAK software and the Plant Transcription Factor Database (http://planttfdb.gao-lab.org/index.php, accessed on 27 October 2022). Coding sequence prediction was performed using Nr, Swiss-Prot, and TransDecoder (3.0.1). Transcript abundance was evaluated using RSEM and is presented as Fragments Per Kilobase of transcript per Million mapped reads (FPKM) values. Pearson correlations between biological replicates were calculated using the OMICSHARE cloud platform (https://www.omicshare.com/, accessed on 24 October 2022) based on FPKM values.

2.5. Differential Expression Analysis

Analysis of differential expression between two samples was assessed based on FPKM using the DESeq2 R package (1.20.0) with threshold values of p < 0.05 and |log2(fold change)| ≥ 0. GOseq and KOBAS were used to perform GO and KEGG enrichment analysis of differentially expressed genes (DEGs). Gene set enrichment analysis (GSEA) was performed using GSEA software (v3.0), with gene sets defined according to KEGG pathways. Detailed information on gene sets is provided in Table S1. Heatmap was constructed using the TBtools software (v1.106), [38]. A protein-protein interaction (PPI) network was constructed using the String database (https://cn.string-db.org/, accessed on 15 December 2022), and networks were visualized using Cytoscape 3.9.1 with the CytoHubba plugin.

2.6. Quantitative Real-Time PCR (qRT-PCR)

To verify the reliability and accuracy of transcriptome data, DEGs associated with the flavonoid pathway and plant hormone signal transduction were randomly selected for qRT-PCR analysis. The RNA samples were reverse transcribed to cDNA using a PrimeScript RT Mater Mix (Takara, Dalian, China). Gene-specific primers were designed using the Primer3Plus website (Table S2) and qRT-PCR was performed using the ABI 7500 Fast Real-Time PCR System (ABI, Oyster Bay, NY, USA) with TB Green® Premix Ex Taq II (Takara, Dalian, China). Relative gene expression was quantified using the 2−ΔΔCt method.

2.7. Statistical Analysis

Statistical analyses were conducted using GraphPad Prism 9 (Graphpad, San Diego, CA, USA). Results are presented as mean ± SE of three independent experiments. Statistical significance was determined using the Student’s t-test (* p < 0.05 and ** p < 0.01, respectively).

3. Results

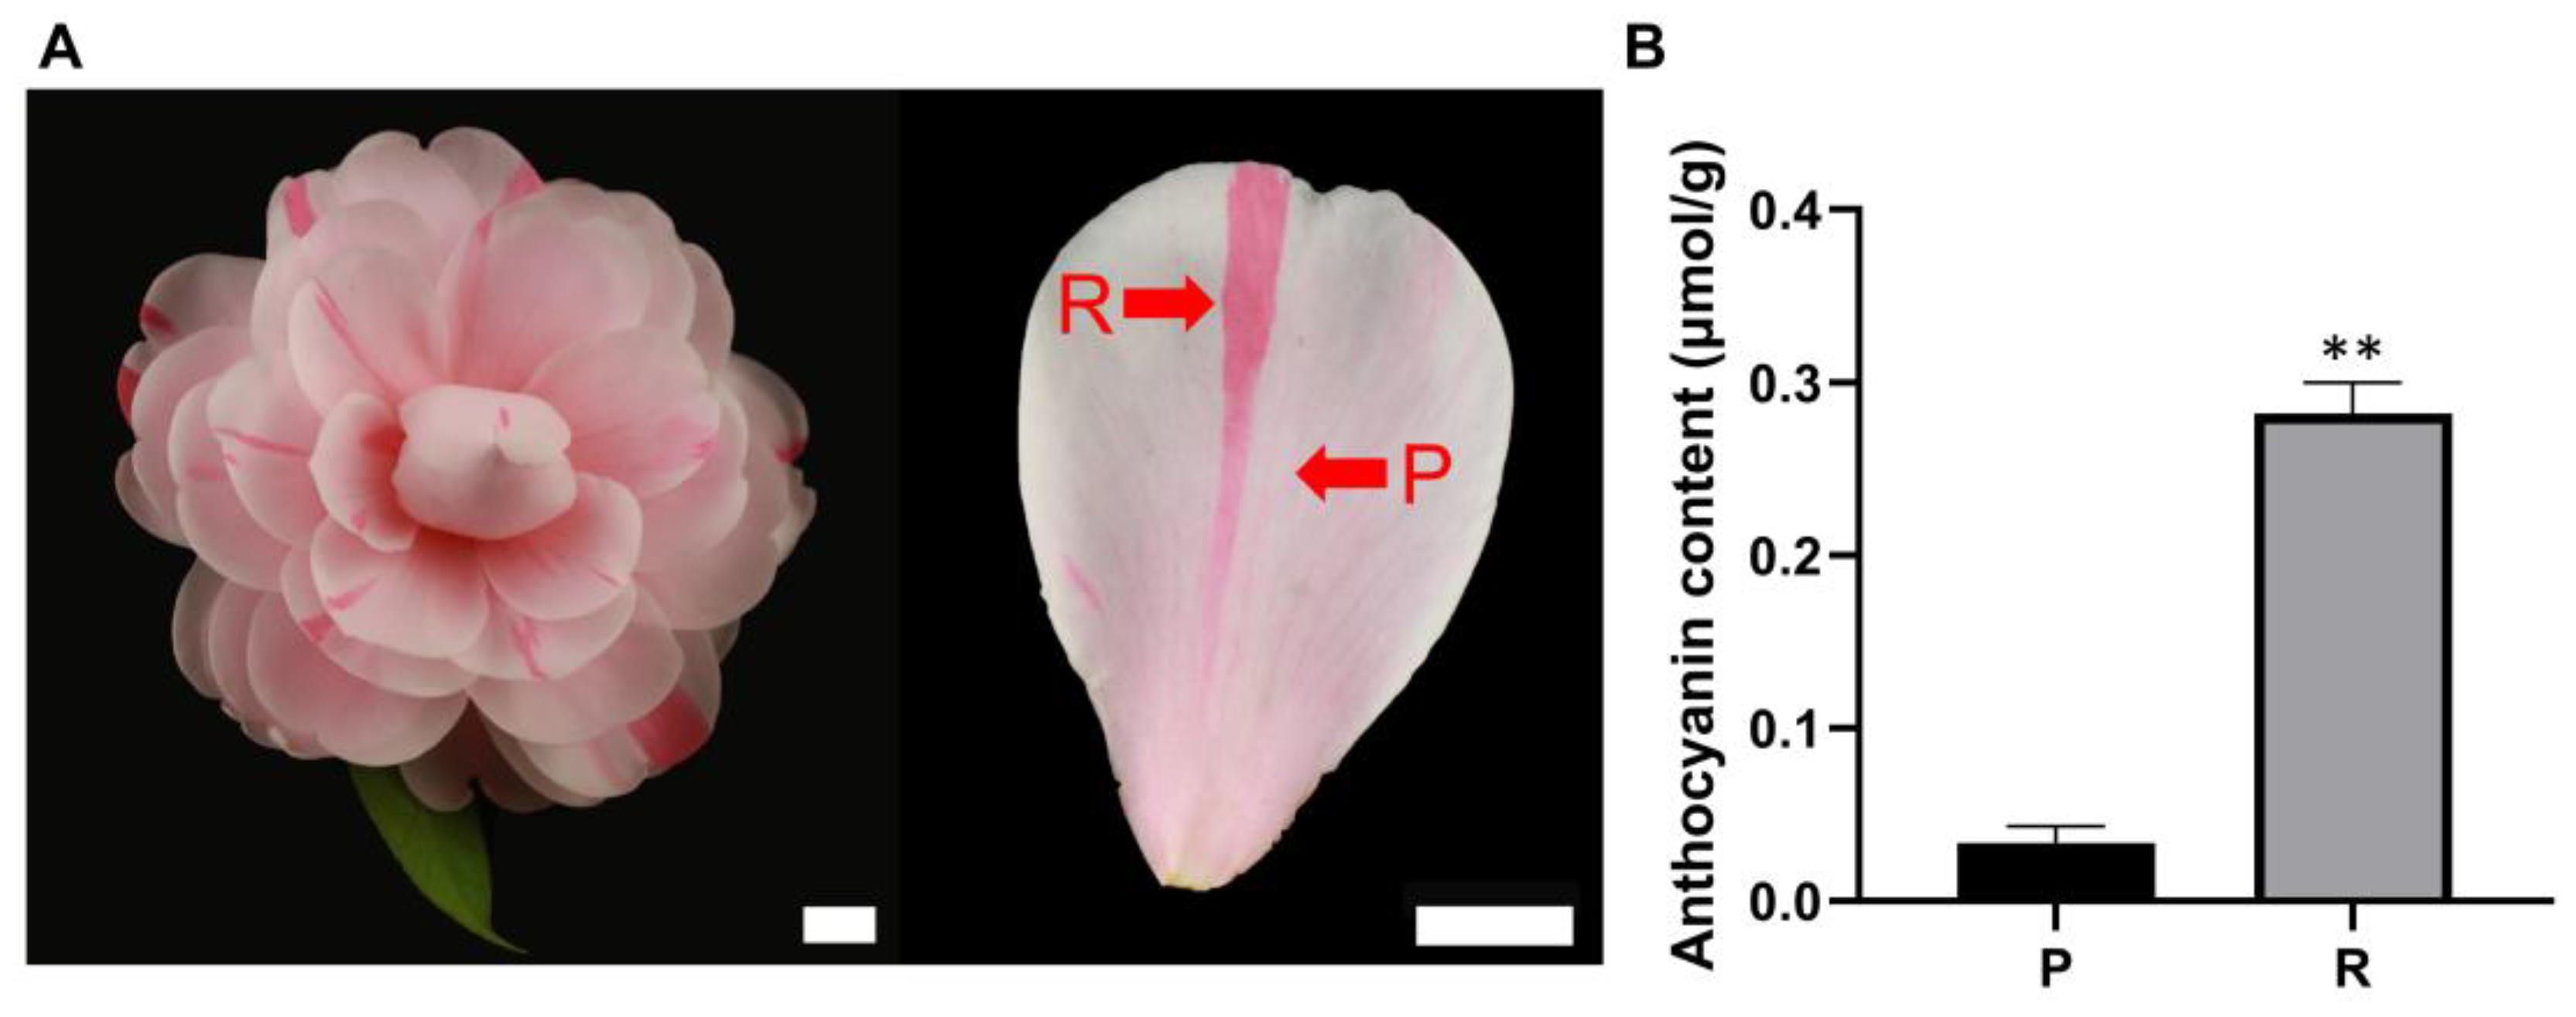
3.1. Phenotypic Characteristics and Anthocyanin Analysis of ‘Joy Kendrick’

‘Joy Kendrick’ petals comprise two regions; the majority is pink and there are randomly distributed red stripes (Figure 1A). The main pigment component of C. japonica petals is anthocyanins [39,40]. To explore pigment differences in ‘Joy Kendrick’ multicolor petals, anthocyanin content was analyzed. Compared with levels in pink samples (0.034 µmol/g), anthocyanin content was significantly enhanced in red samples (0.28 µmol/g), representing approximately 8-fold higher anthocyanin content in red areas, and suggesting that anthocyanin accumulation is responsible for red stripe formation.

3.2. Transcriptome Data Overview

To investigate the molecular mechanisms underlying formation of multicolored flowers in ‘Joy Kendrick’, two samples (P and R) with three replicates each were used for RNA sequencing, the RIN values ranged from 9.2 to 9.8 indicating high quality of RNA samples (Table S3). The raw RNA-seq data have been uploaded to the National Center for Biotechnology Information (PRJNA913600). After removing the low-quality and adaptor sequences, 39.5 Gb clean reads were obtained. The average Q30 ratio was 89.32%, and average GC content was 44.42% (Table S4). After sequence assembly, gene expression levels were obtained by align the sequences to the reference transcript sequences. And pearson correlation coefficient values were calculated to assess the repeatability of data among the three biological replicates per sample, and were in the range 0.986–0.998, indicating high data reproducibility (Figure 2A).

3.3. Identification and Enrichment of DEGs

To better understand the differences between the R and P groups, DEGs were selected using screening parameters of |log2(foldchange)| ≥ 0 and p < 0.05. A total of 3641 DEGs were obtained; 2002 DEGs were upregulated and 1639 were downregulated in red petal areas (Figure 2B). To provide functional insights, we conducted a detailed investigation of DEGs by GO and KEGG enrichment analyses. GO enrichment analysis showed that upregulated DEGs were mainly enriched in the “oxidoreductase activity”, “ribosome”, and “structural constituent of ribosome”, while downregulated DEGs were predominantly enriched in “cell wall”, “external encapsulating structure”, and “transmembrane transporter activity” (Figure 2C). KEGG enrichment analysis indicated that secondary metabolites may undergo significant changes. Notably, up-regulated DEGs were significantly enriched in “flavonoid biosynthesis”, and “phenylpropanoid biosynthesis” (Figure 2D), which are high associated with anthocyanin biosynthesis.

3.4. Gene Set Enrichment Analysis

To fully understand the expression patterns of specific genes associated with flavonoid synthesis, we next conducted GSEA (Figure 2E,F). Normalized enrichment scores for the phenylpropanoid biosynthesis and flavonoid biosynthesis gene sets were 1.68 and 1.44, respectively. False discovery rate values for all gene sets were <0.25. These results demonstrate that genes involved in flavonoid and phenylpropanoid biosynthesis meet globally upregulated in red petal regions.

3.5. Identification of Candidate Genes Involved in Anthocyanin Biosynthesis

Functional enrichment analysis of DEGs identified numerous genes involved in anthocyanin biosynthesis. Consistent with their known roles in variation of flower pigmentation, PAL, C4H, CHS, CHI, and DFR were highly expressed in red petal regions, relative to samples from pink areas (Figure 3). Further, two genes encoding anthocyanidin 3-O-glucosyltransferases (3GTs) and two encoding O-methyltransferases (OMTs), which are responsible for anthocyanin glycosylation and methylation, respectively, were upregulated in red petal regions (Figure 3). Moreover, two ATB binding cassette C family (ABCC) genes, which encode anthocyanin transporters, were highly expressed in red, relative to pink, petal regions (Figure 3). GSTs serve as ligands in the transport of glutathione-conjugated anthocyanins to the tonoplast, and eight GST genes exhibited a trend toward being expressed at higher levels in red, relative to pink petal regions (Figure 3).

3.6. Plant Hormone Signal Transduction

Plant development and growth depend heavily on phytohormones, and numerous DEGs associated with plant hormone signal transduction were identified, especially genes engaged in auxin signaling: 1TAR, 1YUCCA,1 PIN3, 3 ARF, 2 GH3, 7 IAA, 4 SAUR, and 1 TIR1 (Figure 4A). Interestingly, the majority of these genes were downregulated in red petal region samples; for example, two Indole-3-acetic acid (IAA) genes were upregulated in red regions, whereas five IAA genes showed a trend toward downregulation. Expression levels of TIR1, a gene encoding an auxin receptor, were decreased in red samples. Further, SAUR genes, which encode auxin-inducible factors, all exhibited a trend toward downregulation in red region samples, and similar results were detected for auxin response factor (ARF) genes. These results indicate that auxin signaling was inhibited in red petal regions. No patterns in changes of DEG levels were observed in the brassinosteroid or cytokinin signaling pathways (Figure S1). Moreover, ERF1 and EIN3 in the ethylene signaling pathway, NPR salicylic acid receptors, and GAI1 in the gibberellin pathway showed an increasing trend (Figure S1).

3.7. Identification of Transcription Factors Regulating Color Formation in ‘Joy Kendrick’

TFs have key roles in regulation of anthocyanin biosynthesis. To obtain insight into the mechanisms regulating flower pigment formation, we identified differentially expressed TFs. Among differentially expressed TFs, the HB and MYB families were most highly represented, with 24 members identified (Figure 4B). Consistent with plant hormone signal transduction, genes related to AUX/IAA and the AP2/ERF TF family showed substantial differences in expression levels. The MYB and bHLH TFs have crucial roles in control of anthocyanin biosynthesis; therefore, we performed a focused analysis on these TFs. Compared with pink samples, 9 MYBs and 6 bHLHs were upregulated, whereas 15 MYBs and 5 bHLHs were downregulated in red region samples (Figure 4C). A PPI network of TFs and proteins involved in flavonoid synthesis was generated (Figure 4D), indicated that 8 MYB and 6 bHLH TFs may participate in regulation of anthocyanin biosynthesis-related structural genes, within a complex regulatory network.

3.8. Validation of Candidate Genes by Quantitative Real-Time PCR

To further validate the above results, 12 genes related to flavonoid pathway and plant hormone signal transduction were selected for qRT-PCR analysis. To confirm primer specificity, the qPCR product was analysed by agarose gel electrophoresis, only single bands observed, indicating good specificity for the primers (Figure S2). Strong concordance between the transcriptome data and qRT-PCR results was observed (Figure 5), indicating the reliability of the transcriptome analysis results.

4. Discussion

The most significant characteristic of ornamental plants is their flower color. C. japonica is celebrated as an ornamental flower on account of its colorful flowers and abundant flower types. ‘Joy Kendrick’ is a C. japonica cultivar with beautiful red stripes on the petal, but the molecular mechanisms underlying its pigmentation are not well understood. Anthocyanins, carotenoids, and chlorophyll are the major pigments of flowers [41,42]. Anthocyanins provide a wide range of colors, ranging from orange/red to violet/blue, while carotenoids play a significant role in the yellow to red coloration of flowers. Numerous studies have shown that anthocyanins are the main flower pigments in C. japonica [39,40]. In this study, the anthocyanin content of samples was measured and analyzed, and found to be significantly enhanced in the red striped areas of petals. This result suggests that anthocyanins have essential functions in the color formation of petal stripes. In the tree peony, petal anthocyanin distribution is responsible for blotch formation [17]. Further, in pansy, cyanidin and delphinidin were detected in cyanic blotches [16], while malvidin-3-O-galactoside, peonidin-3-O-glucoside, delphinidin-3-O-glucoside, and cyanidin-3-O-glucoside are involved in red coloration of floral tissues in Oncidium [43].
Changes in transcripts levels of genes related to anthocyanin biosynthesis is the leading cause of alterations in anthocyanin content. In the petals of ‘Joy Kendrick’ flowers, PAL, C4H, 4CL, CHS, CHI, and DFR transcript levels were elevated in the red areas, more anthocyanidins are produced as a result of upregulation of these genes. Transcriptome analysis of tree peony revealed that PsCHS, PsF3H, PsDFR, and PsANS were expressed at substantially higher levels in purple spots than in white non-spot areas [37]. Higher levels of VwF3′5′H, VwDFR, and VwANS transcription were detected in the cyanic blotches of pansy [16]. To produce stable anthocyanins, the generated anthocyanidins must undergo a series of methylation, glycosylation, and acylation processes. In this study, two 3GTs and two OMTs showed higher expression in red petal areas than in pink samples. Thus, the intensity of anthocyanin colors in red samples may be increased via glycosylation and methylation. Heterologous expression of St3GT in tobacco plant can greatly elevate anthocyanin content [44], while in Freesia hybrida, Fh3GT1 expression is related to the accumulation of anthocyanins and flavonols [45]. Methylation is crucial for anthocyanin accumulation in plants, and may impact anthocyanin water solubility and stability. PpAOMT2 can contribute to O-methylation of peach anthocyanins at the 3′ position [46]. Anthocyanins are transported into vacuoles after synthesis in the cytosol, where they are stored and carry out their significant functions, such as floral pigmentation. GST-mediated transport, membrane transporter-mediated transport, and vesicle trafficking are the three mechanisms suggested to be involved in anthocyanin transport [15,47]. A GST mutant in maize leads to cyanidin-3-glucoside accumulation in the cytoplasm, giving tissues a bronze hue [48]. In Arabidopsis, transparent testa 19 was identified as a glutathione S-transferase that functions as a carrier to transport cyanidin to the tonoplast [49]. Similar results were also reported in petunia [50], carnation [51], and strawberry [52]. In our study, nine GSTs were identified as DEGs and almost all GSTs tended to exhibit higher expression levels in samples from red petal areas. These genes likely have important functions in anthocyanin transport and warrant intensive study. ABCC transporters are thought to contribute to anthocyanin accumulation through transport of flavonoids conjugated with glutathione [14]. In Arabidopsis, cyanidin-3-O-glucoside is transported by AtABCC2, depending on co-transport of glutathione (GSH) [53]. Similarly, in grape, ABCC1 transports malvidin 3-O-glucoside in the presence of GSH [54]. Two ABCC genes in ‘Joy Kendrick’ are proposed to be involved in anthocyanin transport. Overall, the cooperative activities of genes related to the synthesis, modification, and transport of anthocyanins are likely responsible for red stripe formation.
A number of phytohormones are also involved in anthocyanin production. There is a significant positive correlation between ABA levels and anthocyanin content in Lycium fruit, and exogenous application of ABA increased anthocyanin content [55]. MdbZIP44, an apple transcription factor activated by ABA, can interact with MdMYB1 to encourage anthocyanin accumulation [56]. In this study, we found that protein phosphatase 2C (a negative regulator of the ABA signaling pathway) was expressed at low levels in red samples, while two ABA receptors (pyrobactin resistance-like) showed high expression levels (Figure S1). These results indicate that ABA may positively influence anthocyanin biosynthesis in red petal stripes. Moreover, auxin-associated DEGs showed a global downward trend in red samples, and were negatively correlated with anthocyanin content in the two samples. Auxin is known to inhibit anthocyanin production [55], 2,4-dichlorophenoxyacetic acid and 1-naphthaleneacetic acid suppressed anthocyanin biosynthesis in red-fleshed apple callus [57]. A study on red raspberry reached the same conclusion [58]; IAA-treated fruit had less anthocyanin content than the control group. ARF genes play important roles in auxin-mediated signaling [59] and negatively regulate anthocyanin by directly suppressing anthocyanin biosynthesis genes. In apple, MdARF13 suppresses MdDFR expression, thereby decreasing anthocyanin accumulation [60], while MdARF2 functions as a transcriptional repressor of anthocyanin biosynthesis [61]. Further, MdARF19 inhibits anthocyanin accumulation in the callus via strengthening MdLOB52 activation [62]. In our study, 3 ARF genes were downregulated in red samples (Figure 4A). Additionally, genes involved in ethylene and salicylic acid signaling were upregulated in red samples (Figure S1), consistent with previous reports that ethylene and salicylic acid treatment can increase plant anthocyanin levels [63,64]. Various plant hormones interact to constitute a complex anthocyanin regulation network, and crosstalk among ABA, IAA, and gibberellin is known to regulate anthocyanin biosynthesis in sweet cherry [65]. Exogenous ABA increased the contents of auxin and cytokinins in grape, with consequent impact on fruit quality [66]. Based on our findings, we propose that abscisic acid, auxin, ethylene, and salicylic acid coordinately regulate anthocyanin biosynthesis in ‘Joy Kendrick’, and more in-depth research is warranted.

5. Conclusions

In this study, we performed transcriptome and pigment analyses to study the molecular mechanisms of flower color formation in C. japonica cultivar ‘Joy Kendrick’. ‘Joy Kendrick’ has multicolored flowers, and there are more anthocyanins accumulate in red petal regions than in pink areas. Our results suggested that the cooperative activities of genes related to the synthesis, modification, and transport of anthocyanins are likely responsible for red stripe formation. Importantly, auxin-associated DEGs showed a global downward trend in red samples, indicating that auxin perhaps negatively regulate the anthocyanin accumulation in ‘Joy Kendrick’. This study could lay a theoretical foundation for breeding new C. japonica varieties.

Supplementary Materials

The following supporting information can be downloaded at: https://www.mdpi.com/article/10.3390/f14010069/s1, Table S1: Gene sets for gene set enrichment analysis; Table S2: Sequences of primers used for qRT-PCR; Table S3: RNA integrity number (RIN) value of RNA samples; Table S4: Summary of RNA-seq data from pink sample (P) and red sample (R); Figure S1: DEGs involved in plant hormone transduction; Figure S2: Agarose gel electrophoresis image of qRT-PCR product.

Author Contributions

S.Y. wrote the manuscript, critically reviewed, and corrected the manuscript, with contributions from W.L., S.Y., S.N. and J.L. All authors have read and agreed to the published version of the manuscript.

Funding

This work was funded by Zhejiang Science and Technology Major Program on Agricultural New Variety Breeding (2021C02071-2, 2021–2025) from Science and Technology Department of Zhejiang Province and National Key R&D Program of China (2020YFD1000500, 2019–2022) from Ministry of Science and Technology of the People’s Republic of China.

Data Availability Statement

Not applicable.

Conflicts of Interest

The authors declare no conflict of interest.

References

  1. Sasaki, N.; Nakayama, T. Achievements and Perspectives in Biochemistry Concerning Anthocyanin Modification for Blue Flower Coloration. Plant Cell Physiol. 2015, 56, 28–40. [Google Scholar] [CrossRef] [PubMed]
  2. Xu, Z.; Mahmood, K.; Rothstein, S.J. ROS induces anthocyanin production via late biosynthetic genes and anthocyanin deficiency confers the hypersensitivity to ROS-generating stresses in Arabidopsis. Plant Cell Physiol. 2017, 58, 1364–1377. [Google Scholar] [CrossRef] [Green Version]
  3. Moustaka, J.; Panteris, E.; Adamakis, I.-D.S.; Tanou, G.; Giannakoula, A.; Eleftheriou, E.P.; Moustakas, M. High anthocyanin accumulation in poinsettia leaves is accompanied by thylakoid membrane unstacking, acting as a photoprotective mechanism, to prevent ROS formation. Environ. Exp. Bot. 2018, 154, 44–55. [Google Scholar] [CrossRef]
  4. Zhu, Y.; Ling, W.; Guo, H.; Song, F.; Ye, Q.; Zou, T.; Li, D.; Zhang, Y.; Li, G.; Xiao, Y. Anti-inflammatory effect of purified dietary anthocyanin in adults with hypercholesterolemia: A randomized controlled trial. Nutr. Metab. Cardiovasc. Dis. 2013, 23, 843–849. [Google Scholar] [CrossRef]
  5. Verediano, T.A.; Stampini Duarte Martino, H.; Dias Paes, M.C.; Tako, E. Effects of anthocyanin on intestinal health: A systematic review. Nutrients 2021, 13, 1331. [Google Scholar] [CrossRef]
  6. Sonia, D.P.-T.; Teresa, S.-B.M. Anthocyanins: From plant to health. Phytochem. Rev. 2008, 7, 281–299. [Google Scholar]
  7. Bowen-Forbes, C.S.; Zhang, Y.; Nair, M.G. Anthocyanin content, antioxidant, anti-inflammatory and anticancer properties of blackberry and raspberry fruits. J. Food Compos. Anal. 2010, 23, 554–560. [Google Scholar] [CrossRef]
  8. Panchal, S.K.; John, O.D.; Mathai, M.L.; Brown, L. Anthocyanins in Chronic Diseases: The Power of Purple. Nutrients 2022, 14, 2161. [Google Scholar] [CrossRef]
  9. Roberto, M.; Antonio, F.; Luciana, M.; Paula, S. Anthocyanins: A comprehensive review of their chemical properties and health effects on cardiovascular and neurodegenerative diseases. Molecules 2020, 25, 3809. [Google Scholar]
  10. Liu, W.; Feng, Y.; Yu, S.; Fan, Z. The Flavonoid Biosynthesis Network in Plants. Int. J. Mol. Sci. 2021, 22, 12824. [Google Scholar] [CrossRef]
  11. Shen, Y.; Sun, T.; Pan, Q.; Anupol, N.; Chen, H.; Shi, J.; Liu, F.; Deqiang, D.; Wang, C.; Zhao, J. Rr MYB 5-and Rr MYB 10-regulated flavonoid biosynthesis plays a pivotal role in feedback loop responding to wounding and oxidation in Rosa rugosa. Plant Biotechnol. J. 2019, 17, 2078–2095. [Google Scholar] [CrossRef] [Green Version]
  12. Mao, W.; Han, Y.; Chen, Y.; Sun, M.; Feng, Q.; Li, L.; Liu, L.; Zhang, K.; Wei, L.; Han, Z. Low temperature inhibits anthocyanin accumulation in strawberry fruit by activating FvMAPK3-induced phosphorylation of FvMYB10 and degradation of Chalcone Synthase 1. Plant Cell 2022, 34, 1226–1249. [Google Scholar] [CrossRef] [PubMed]
  13. Karppinen, K.; Lafferty, D.J.; Albert, N.W.; Mikkola, N.; McGhie, T.; Allan, A.C.; Afzal, B.M.; Häggman, H.; Espley, R.V.; Jaakola, L. MYBA and MYBPA transcription factors co-regulate anthocyanin biosynthesis in blue-coloured berries. New Phytol. 2021, 232, 1350–1367. [Google Scholar] [CrossRef] [PubMed]
  14. Kaur, S.; Sharma, N.; Kapoor, P.; Chunduri, V.; Pandey, A.K.; Garg, M. Spotlight on the overlapping routes and partners for anthocyanin transport in plants. Physiol. Plant. 2021, 171, 868–881. [Google Scholar] [CrossRef]
  15. Zhao, J. Flavonoid transport mechanisms: How to go, and with whom. Trends Plant Sci. 2015, 20, 576–585. [Google Scholar] [CrossRef]
  16. Li, Q.; Wang, J.; Sun, H.-Y.; Shang, X. Flower color patterning in pansy (Viola × wittrockiana Gams.) is caused by the differential expression of three genes from the anthocyanin pathway in acyanic and cyanic flower areas. Plant Physiol. Biochem. 2014, 84, 134–141. [Google Scholar] [CrossRef]
  17. Gu, Z.; Zhu, J.; Hao, Q.; Yuan, Y.-W.; Duan, Y.-W.; Men, S.; Wang, Q.; Hou, Q.; Liu, Z.-A.; Shu, Q. A novel R2R3-MYB transcription factor contributes to petal blotch formation by regulating organ-specific expression of PsCHS in tree peony (Paeonia suffruticosa). Plant Cell Physiol. 2019, 60, 599–611. [Google Scholar] [CrossRef]
  18. Shang, Y.; Venail, J.; Mackay, S.; Bailey, P.C.; Schwinn, K.E.; Jameson, P.E.; Martin, C.R.; Davies, K.M. The molecular basis for venation patterning of pigmentation and its effect on pollinator attraction in flowers of Antirrhinum. New Phytol. 2011, 189, 602–615. [Google Scholar] [CrossRef]
  19. Simonds, V.; Plowright, C. How do bumblebees first find flowers? Unlearned approach responses and habituation. Anim. Behav. 2004, 67, 379–386. [Google Scholar] [CrossRef]
  20. Heuschen, B.; Gumbert, A.; Lunau, K. A generalised mimicry system involving angiosperm flower colour, pollen and bumblebees’ innate colour preferences. Plant Syst. Evol. 2005, 252, 121–137. [Google Scholar] [CrossRef]
  21. Hieber, A.D.; Mudalige-Jayawickrama, R.G.; Kuehnle, A.R. Color genes in the orchid Oncidium Gower Ramsey: Identification, expression, and potential genetic instability in an interspecific cross. Planta 2006, 223, 521–531. [Google Scholar] [CrossRef] [PubMed]
  22. Zhang, J.; Wang, L.; Shu, Q.; Liu, Z.A.; Li, C.; Zhang, J.; Wei, X.; Tian, D. Comparison of anthocyanins in non-blotches and blotches of the petals of Xibei tree peony. Sci. Hortic. 2007, 114, 104–111. [Google Scholar] [CrossRef]
  23. Santner, A.; Estelle, M. Recent advances and emerging trends in plant hormone signalling. Nature 2009, 459, 1071–1078. [Google Scholar] [CrossRef] [PubMed]
  24. Waadt, R.; Seller, C.A.; Hsu, P.-K.; Takahashi, Y.; Munemasa, S.; Schroeder, J.I. Plant hormone regulation of abiotic stress responses. Nat. Rev. Mol. Cell Biol. 2022, 23, 680–694. [Google Scholar] [CrossRef] [PubMed]
  25. Nishimura, N.; Tsuchiya, W.; Moresco, J.J.; Hayashi, Y.; Satoh, K.; Kaiwa, N.; Irisa, T.; Kinoshita, T.; Schroeder, J.I.; Yates, J.R. Control of seed dormancy and germination by DOG1-AHG1 PP2C phosphatase complex via binding to heme. Nat. Commun. 2018, 9, 2132. [Google Scholar] [CrossRef] [Green Version]
  26. Clouse, S.D. The molecular intersection of brassinosteroid-regulated growth and flowering in Arabidopsis. Proc. Natl. Acad. Sci. USA 2008, 105, 7345–7346. [Google Scholar] [CrossRef] [Green Version]
  27. Sun, Y.; Liu, Q.; Xi, B.; Dai, H. Study on the regulation of anthocyanin biosynthesis by exogenous abscisic acid in grapevine. Sci. Hortic. 2019, 250, 294–301. [Google Scholar] [CrossRef]
  28. Gao, H.-N.; Jiang, H.; Cui, J.-Y.; You, C.-X.; Li, Y.-Y. The effects of hormones and environmental factors on anthocyanin biosynthesis in apple. Plant Sci. 2021, 312, 111024. [Google Scholar] [CrossRef]
  29. Wang, S.; Li, L.-X.; Fang, Y.; Li, D.; Mao, Z.; Zhu, Z.; Chen, X.-S.; Feng, S.-Q. MdERF1B–MdMYC2 module integrates ethylene and jasmonic acid to regulate the biosynthesis of anthocyanin in apple. Hortic. Res. 2022, 9, uhac142. [Google Scholar] [CrossRef]
  30. Jin, W.; Wang, H.; Li, M.; Wang, J.; Yang, Y.; Zhang, X.; Yan, G.; Zhang, H.; Liu, J.; Zhang, K. The R2R3 MYB transcription factor PavMYB10.1 involves in anthocyanin biosynthesis and determines fruit skin colour in sweet cherry (Prunus avium L.). Plant Biotechnol. J. 2016, 14, 2120–2133. [Google Scholar] [CrossRef] [Green Version]
  31. Wang, L.; Lu, W.; Ran, L.; Dou, L.; Yao, S.; Hu, J.; Fan, D.; Li, C.; Luo, K. R2R3-MYB transcription factor MYB 6 promotes anthocyanin and proanthocyanidin biosynthesis but inhibits secondary cell wall formation in Populus tomentosa. Plant J. 2019, 99, 733–751. [Google Scholar] [CrossRef]
  32. Kundan, M.; Gani, U.; Fayaz, M.; Angmo, T.; Kesari, R.; Rahul, V.P.; Gairola, S.; Misra, P. Two R2R3-MYB transcription factors, CsMYB33 and CsMYB78 are involved in the regulation of anthocyanin biosynthesis in Cannabis sativa L. Ind. Crops Prod. 2022, 188, 115546. [Google Scholar] [CrossRef]
  33. Xu, W.; Dubos, C.; Lepiniec, L. Transcriptional control of flavonoid biosynthesis by MYB–bHLH–WDR complexes. Trends Plant Sci. 2015, 20, 176–185. [Google Scholar] [CrossRef] [PubMed]
  34. Xu, W.; Grain, D.; Bobet, S.; Le Gourrierec, J.; Thévenin, J.; Kelemen, Z.; Lepiniec, L.; Dubos, C. Complexity and robustness of the flavonoid transcriptional regulatory network revealed by comprehensive analyses of MYB–b HLH–WDR complexes and their targets in Arabidopsis seed. New Phytol. 2014, 202, 132–144. [Google Scholar] [CrossRef] [PubMed]
  35. Yuan, Y.W.; Sagawa, J.M.; Frost, L.; Vela, J.P.; Bradshaw, H.D., Jr. Transcriptional control of floral anthocyanin pigmentation in monkeyflowers (Mimulus). New Phytol. 2014, 204, 1013–1027. [Google Scholar] [CrossRef] [PubMed] [Green Version]
  36. Thomas, M.M.; Rudall, P.J.; Ellis, A.G.; Savolainen, V.; Glover, B.J. Development of a complex floral trait: The pollinator-attracting petal spots of the beetle daisy, Gorteria diffusa (Asteraceae). Am. J. Bot. 2009, 96, 2184–2196. [Google Scholar] [CrossRef]
  37. Zhang, Y.; Cheng, Y.; Ya, H.; Xu, S.; Han, J. Transcriptome sequencing of purple petal spot region in tree peony reveals differentially expressed anthocyanin structural genes. Front. Plant Sci. 2015, 6, 964. [Google Scholar] [CrossRef] [Green Version]
  38. Chen, C.; Chen, H.; Zhang, Y.; Thomas, H.R.; Frank, M.H.; He, Y.; Xia, R. TBtools: An integrative toolkit developed for interactive analyses of big biological data. Mol. Plant 2020, 13, 1194–1202. [Google Scholar] [CrossRef]
  39. Fan, M.; Zhang, Y.; Yang, M.; Wu, S.; Yin, H.; Li, J.; Li, X. Transcriptomic and Chemical Analyses Reveal the Hub Regulators of Flower Color Variation from Camellia japonica Bud Sport. Horticulturae 2022, 8, 129. [Google Scholar] [CrossRef]
  40. Fu, M.; Yang, X.; Zheng, J.; Wang, L.; Yang, X.; Tu, Y.; Ye, J.; Zhang, W.; Liao, Y.; Cheng, S. Unraveling the regulatory mechanism of color diversity in camellia japonica petals by integrative transcriptome and metabolome analysis. Front. Plant Sci. 2021, 12, 1119. [Google Scholar] [CrossRef]
  41. Xing, Y.; Wang, K.; Huang, C.; Huang, J.; Zhao, Y.; Si, X.; Li, Y. Global Transcriptome Analysis Revealed the Molecular Regulation Mechanism of Pigment and Reactive Oxygen Species Metabolism During the Stigma Development of Carya cathayensis. Front. Plant Sci. 2022, 13, 881394. [Google Scholar] [CrossRef] [PubMed]
  42. Xia, Y.; Chen, W.; Xiang, W.; Wang, D.; Xue, B.; Liu, X.; Xing, L.; Wu, D.; Wang, S.; Guo, Q. Integrated metabolic profiling and transcriptome analysis of pigment accumulation in Lonicera japonica flower petals during colour-transition. BMC Plant Biol. 2021, 21, 98. [Google Scholar] [CrossRef] [PubMed]
  43. Chiou, C.-Y.; Yeh, K.-W. Differential expression of MYB gene (OgMYB1) determines color patterning in floral tissue of Oncidium Gower Ramsey. Plant Mol. Biol. 2008, 66, 379–388. [Google Scholar] [CrossRef] [PubMed]
  44. Wei, Q.; Wang, Q.-Y.; Feng, Z.-H.; Wang, B.; Zhang, Y.-F.; Yang, Q. Increased accumulation of anthocyanins in transgenic potato tubers by overexpressing the 3GT gene. Plant Biotechnol. Rep. 2012, 6, 69–75. [Google Scholar] [CrossRef]
  45. Sun, W.; Liang, L.; Meng, X.; Li, Y.; Gao, F.; Liu, X.; Wang, S.; Gao, X.; Wang, L. Biochemical and molecular characterization of a flavonoid 3-O-glycosyltransferase responsible for anthocyanins and flavonols biosynthesis in Freesia hybrida. Front. Plant Sci. 2016, 7, 410. [Google Scholar] [CrossRef] [PubMed] [Green Version]
  46. Cheng, J.; Wei, G.; Zhou, H.; Gu, C.; Vimolmangkang, S.; Liao, L.; Han, Y. Unraveling the mechanism underlying the glycosylation and methylation of anthocyanins in peach. Plant Physiol. 2014, 166, 1044–1058. [Google Scholar] [CrossRef] [PubMed] [Green Version]
  47. Zhao, Y.; Dong, W.; Zhu, Y.; Allan, A.C.; Lin-Wang, K.; Xu, C. PpGST1, an anthocyanin-related glutathione S-transferase gene, is essential for fruit coloration in peach. Plant Biotechnol. J. 2020, 18, 1284–1295. [Google Scholar] [CrossRef] [Green Version]
  48. Marrs, K.A.; Alfenito, M.R.; Lloyd, A.M.; Walbot, V. A glutathione S-transferase involved in vacuolar transfer encoded by the maize gene Bronze-2. Nature 1995, 375, 397–400. [Google Scholar] [CrossRef]
  49. Sun, Y.; Li, H.; Huang, J.-R. Arabidopsis TT19 functions as a carrier to transport anthocyanin from the cytosol to tonoplasts. Mol. Plant 2012, 5, 387–400. [Google Scholar] [CrossRef]
  50. Mueller, L.A.; Goodman, C.D.; Silady, R.A.; Walbot, V. AN9, a petunia glutathione S-transferase required for anthocyanin sequestration, is a flavonoid-binding protein. Plant Physiol. 2000, 123, 1561–1570. [Google Scholar] [CrossRef] [Green Version]
  51. Larsen, E.; Alfenito, M.; Briggs, W.; Walbot, V. A carnation anthocyanin mutant is complemented by the glutathione S-transferases encoded by maize Bz2 and petunia An9. Plant Cell Rep. 2003, 21, 900–904. [Google Scholar] [CrossRef] [PubMed]
  52. Luo, H.; Dai, C.; Li, Y.; Feng, J.; Liu, Z.; Kang, C. Reduced Anthocyanins in Petioles codes for a GST anthocyanin transporter that is essential for the foliage and fruit coloration in strawberry. J. Exp. Bot. 2018, 69, 2595–2608. [Google Scholar] [CrossRef] [PubMed]
  53. Behrens, C.E.; Smith, K.E.; Iancu, C.V.; Choe, J.-Y.; Dean, J.V. Transport of anthocyanins and other flavonoids by the Arabidopsis ATP-binding cassette transporter AtABCC2. Sci. Rep. 2019, 9, 437. [Google Scholar] [CrossRef] [PubMed] [Green Version]
  54. Francisco, R.M.; Regalado, A.; Ageorges, A.; Burla, B.J.; Bassin, B.; Eisenach, C.; Zarrouk, O.; Vialet, S.; Marlin, T.; Chaves, M.M. ABCC1, an ATP binding cassette protein from grape berry, transports anthocyanidin 3-O-glucosides. Plant Cell 2013, 25, 1840–1854. [Google Scholar] [CrossRef] [PubMed] [Green Version]
  55. Li, G.; Zhao, J.; Qin, B.; Yin, Y.; An, W.; Mu, Z.; Cao, Y. ABA mediates development-dependent anthocyanin biosynthesis and fruit coloration in Lycium plants. BMC Plant Biol. 2019, 19, 317. [Google Scholar] [CrossRef] [PubMed] [Green Version]
  56. An, J.P.; Yao, J.F.; Xu, R.R.; You, C.X.; Wang, X.F.; Hao, Y.J. Apple bZIP transcription factor MdbZIP44 regulates abscisic acid-promoted anthocyanin accumulation. Plant Cell Environ. 2018, 41, 2678–2692. [Google Scholar] [CrossRef]
  57. Ji, X.-H.; Zhang, R.; Wang, N.; Yang, L.; Chen, X.-S. Transcriptome profiling reveals auxin suppressed anthocyanin biosynthesis in red-fleshed apple callus (Malus sieversii f. niedzwetzkyana). Plant Cell Tissue Organ Cult. (PCTOC) 2015, 123, 389–404. [Google Scholar] [CrossRef]
  58. Moro, L.; Hassimotto, N.M.A.; Purgatto, E. Postharvest auxin and methyl jasmonate effect on anthocyanin biosynthesis in red raspberry (Rubus idaeus L.). J. Plant Growth Regul. 2017, 36, 773–782. [Google Scholar] [CrossRef]
  59. Chandler, J.W. Auxin response factors. Plant Cell Environ. 2016, 39, 1014–1028. [Google Scholar] [CrossRef] [Green Version]
  60. Wang, Y.-C.; Wang, N.; Xu, H.-F.; Jiang, S.-H.; Fang, H.-C.; Su, M.-Y.; Zhang, Z.-Y.; Zhang, T.-L.; Chen, X.-S. Auxin regulates anthocyanin biosynthesis through the Aux/IAA–ARF signaling pathway in apple. Hortic. Res. 2018, 5, 59. [Google Scholar] [CrossRef] [Green Version]
  61. Wang, C.-K.; Han, P.-L.; Zhao, Y.-W.; Yu, J.-Q.; You, C.-X.; Hu, D.-G.; Hao, Y.-J. Genome-wide analysis of auxin response factor (ARF) genes and functional identification of MdARF2 reveals the involvement in the regulation of anthocyanin accumulation in apple. N. Z. J. Crop Hortic. Sci. 2021, 49, 78–91. [Google Scholar] [CrossRef]
  62. Wang, Y.; Wang, N.; Xu, H.; Jiang, S.; Fang, H.; Zhang, T.; Su, M.; Xu, L.; Zhang, Z.; Chen, X. Nitrogen affects anthocyanin biosynthesis by regulating MdLOB52 downstream of MdARF19 in callus cultures of red-fleshed apple (Malus sieversii f. niedzwetzkyana). J. Plant Growth Regul. 2018, 37, 719–729. [Google Scholar] [CrossRef]
  63. Oraei, M.; Panahirad, S.; Zaare-Nahandi, F.; Gohari, G. Pre-véraison treatment of salicylic acid to enhance anthocyanin content of grape (Vitis vinifera L.) berries. J. Sci. Food Agric. 2019, 99, 5946–5952. [Google Scholar] [CrossRef] [PubMed]
  64. Cheng, Y.; Liu, L.; Yuan, C.; Guan, J. Molecular characterization of ethylene-regulated anthocyanin biosynthesis in plums during fruit ripening. Plant Mol. Biol. Report. 2016, 34, 777–785. [Google Scholar] [CrossRef]
  65. Tijero, V.; Teribia, N.; Munné-Bosch, S. Hormonal cross-talk in the regulation of ripening and over-ripening in sweet cherries. In Proceedings of the Conference: IX Simpósio Ibérico de Maturação e Pós-Colheita, Lisbon, Portugal, 2–4 November 2016; Volume: Actas Portuguesas de Horticultura nº 28. [Google Scholar]
  66. Li, J.; Liu, B.; Li, X.; Li, D.; Han, J.; Zhang, Y.; Ma, C.; Xu, W.; Wang, L.; Jiu, S. Exogenous abscisic acid mediates berry quality improvement by altered endogenous plant hormones level in “Ruiduhongyu” grapevine. Front. Plant Sci. 2021, 12, 739964. [Google Scholar] [CrossRef]
Figure 1. ‘Joy Kendrick’ petal phenotypes and pigmentation. (A) ‘Joy Kendrick’ petal in full-flower. R, red fractions; P, pink fractions. Bars = 1 cm. (B) Anthocyanin content of red (R) and pink (P) samples, and expressed in micromolar per gram fresh weight. Statistical significance was determined using Student’s t-test (** p < 0.01).
Forests 14 00069 g001
Figure 2. Differential expression analysis and enrichment analysis. (A) Results of Pearson correlation analysis among transcriptome samples. Red, relatively high correlation level; green, relatively low correlation level. (B) Volcano plot of differential gene expression analysis. Red, up-regulated genes in samples from red petal areas; green, down-regulated genes in samples from red petal areas. (C) GO enrichment analysis of DEGs. (D) KEGG enrichment analysis of DEGs. (E) Gene set enrichment analysis (GSEA) of phenylpropanoid biosynthesis pathway. (F) GSEA of flavonoid biosynthesis pathway. ES, enrichment score; NES, normalized enrichment score; FDR, false discovery rate.
Forests 14 00069 g002
Figure 3. Schematic of anthocyanin biosynthesis pathways. Red, up-regulated; blue, down-regulated. PAL, phenylalanine ammonia lyase; C4H, cinnamic acid 4-hydroxylase; 4CL, 4-coumaroyl: Co A ligase; CHS, chalcone synthase; CHI, chalcone isomerase; F3H, flavanone 3-hydroxylase; DFR, dihydroflavonol 4-reductase; ANS, anthocyanidin synthase; 3GT, anthocyanidin 3-O-glucosyltransferase; OMT, O-methyltransferase; ABC-C, ATB binding cassette C family; GST, glutathione S-transferase.
Forests 14 00069 g003
Figure 4. Differentially expressed genes (DEGs) involved in auxin signal transduction and differentially expressed transcription factors (TFs). (A) Heatmap of DEGs involved in auxin signal transduction. Red, up-regulated; blue, down-regulated. TAR, tryptophan aminotransferase-related protein; PIN3, PIN-FORMED3 (PIN3)-mediated auxin transport; TIR1, transport inhibitor response 1; SAUR, small auxin-up RNA; GH3, Gretchen Hagen 3; IAA, indole-3-acetic acid; ARF, auxin response factor. (B) Differentially expressed TFs in red and pink petal region samples. Red columns, up-regulated TFs; blue columns, down-regulated TFs. (C) Heatmap of differentially expressed MYB and bHLH TFs; each row was independently normalized according to FPKM value. Blue, low expression; red, high expression. (D) Protein-protein interaction network of genes involved in the MYB, bHLH, and flavonoid pathways; deeper color node indicates higher degree score.
Forests 14 00069 g004
Figure 5. qRT-PCR analysis of the expression levels of DEGs in samples from pink (P) and red (R) petal regions. Data are presented as mean ± SE of three independent replicates.
Forests 14 00069 g005
Disclaimer/Publisher’s Note: The statements, opinions and data contained in all publications are solely those of the individual author(s) and contributor(s) and not of MDPI and/or the editor(s). MDPI and/or the editor(s) disclaim responsibility for any injury to people or property resulting from any ideas, methods, instructions or products referred to in the content.

