Article

Construction of Rainbow-like Structural Color Coatings on Wood Surfaces Based on Polystyrene Microspheres

1
College of Furnishings and Industrial Design, Nanjing Forestry University, Nanjing 210037, China
2
Jiangsu Co-Innovation Center of Efficient Processing and Utilization of Forest Resources, Nanjing Forestry University, Nanjing 210037, China
3
Zhejiang Shenghuayunfeng New Material Co., Ltd., Huzhou 313220, China
*
Author to whom correspondence should be addressed.
Forests 2023, 14(1), 76; https://doi.org/10.3390/f14010076
Submission received: 24 November 2022 / Revised: 19 December 2022 / Accepted: 28 December 2022 / Published: 30 December 2022
(This article belongs to the Section Wood Science and Forest Products)

Abstract

:
Polystyrene (PSt) microspheres were used to construct rainbow-like, seven-colored structural color coatings on wood surfaces by analyzing how the amount of emulsifier SDBS and emulsion polymerization temperature affected the particle size and monodispersity of the microspheres. The influence of both the amount of self-assembled emulsion coating used and the temperature on the reflected spectrum and the color of the coatings was investigated. It was found that the most monodisperse PSt microspheres were obtained when using 175 mg SDBS and a reaction temperature of 70 °C. By adjusting these two factors, we regulated the particle size of the PSt microspheres. When PSt microspheres were self-assembled on a wood surface to form a structural color coating, the best optical effect was obtained with 40.8 × 10⁻³ mL/cm2 emulsion amount and 50 °C ambient temperature. Finally, by changing the SDBS amount and reaction temperature, microspheres with different particle sizes and good monodispersity were prepared. The structural color was used to form patterned decorations on the wood surface, providing a technical basis for forming other structural color coatings on wood surfaces.

1. Introduction

Since ancient times, wood has been widely used in human settlements. However, as a natural product, wood often has various defects that affect its commercial value [1,2,3,4]. The artificial modification of wood color to improve its visual characteristics and decorative properties is an important part of wood surface decoration technology. Wood color improvement technologies mainly include dyeing and induced discoloration [5,6,7,8], but these methods result in color fading or the uneven coloring of wood [9,10].
Wood that has been dyed with chemical dyes would produce a marked change in color when exposed to light. The main reason is that the chromophores in lignin, inclusions, and dyes in wood undergo photochemical reactions under the action of light radiation. If the color system has been destroyed, the wavelength and intensity of the absorbed light would change accordingly. Under xenon lamp aging tests, dyed wood would discolor after 100 h of irradiation [11]. After 20 h of exposure to ultraviolet light with a wavelength of 250 nm, the dyed wood showed obvious color changes [12].
Biological structural coloring in nature is an optical effect produced by the interaction of light with microstructures in which the microstructure does not change and thus the color remains unchanged [13]. Compared with chemical dyes, structural colors have bright colors, high saturation, high brightness, and never fade. Thus, they have broad application prospects [14,15,16].
Many methods have been reported to prepare artificial periodic microstructures to provide structural color [17,18], especially the three-dimensional photonic crystal structures with photonic band gap characteristics assembled by microspheres [19,20,21]. In three-dimensional photonic crystal structures, the voids formed by the orderly arrangement of the microspheres (and the microspheres themselves) have different refractive indexes. This gives photonic crystals periodic changes in their dielectric constant, i.e., a photonic band gap [22]. Light waves can then be modulated by the periodic potential field formed by the dielectric medium during propagation through this periodic structure, thus generating structural color. By adjusting the diameter of the microspheres, the lattice spacing of the photonic crystal structure can be changed to reflect visible light with different wavelengths to produce rainbow-like colors.
The construction units of photonic crystals can be divided into organic and inorganic types. The most common material of organic particles is polystyrene (PSt) [23,24], which has good stability, easy preparation and self-assembly [25,26,27]. PSt microspheres synthesized by emulsion polymerization can be made with a low monodispersity [28,29,30]. The particle size of the microspheres ranges from tens of nanometers to hundreds of nanometers. After assembly, they can form photonic crystals that produce structural color. Mastering the influence of different reaction conditions on the diameter and monodispersity of PSt microspheres during emulsion polymerization, and clarifying the main factors affecting the particle size of PSt microspheres, are crucial for controlling the technology of PSt microspheres to adjust the color generated by photonic crystals.
Researchers have begun to apply photonic crystals constructed by microspheres to wood surfaces to give wood brilliant structural colors [31]. In our previous research, we discussed the influence of reaction time and the amount of ammonium persulfate (APS) initiator added during emulsion polymerization [32]. Although these two factors affected the particle size and monodispersity of the microspheres, the particle size of the hydrated microspheres was between 180 nm and 195 nm. The photonic crystal structure color was violet, and it could not be controlled to form rainbow-like colors by changing the particle size of the microspheres.
Therefore, in this study, the influence of both the polymerization temperature and the amount of emulsifier sodium dodecylbenzene sulfonate (SDBS) on the diameter of the microspheres during emulsion polymerization was discussed to obtain a larger PSt microsphere size range. Then, the key factors of PSt emulsion coatings construction on wood surface were analyzed to determine the optimal coating amount of emulsion and microsphere self-assembly temperature, and seven rainbow-colored photonic crystal-modified layers were obtained. Finally, these rainbow-colored decorative layers were used to draw decorative patterns on the wood surface, laying an experimental foundation for the application of structural color decorative layers on wood surfaces.

2. Materials and Methods

2.1. Materials

Styrene monomer, APS initiator, SDBS emulsifier, and anhydrous ethanol were chemically pure (CP, Shanghai Lingfeng Chemical Reagent Co., Ltd., Shanghai, China). The above reagents were not purified before use. Deionized water was used during polymerization and was made in-house. The wood species in this study was Aspen (Populus tremuloides Michx.) from Alberta, Canada. The wood was cut into specimens with dimensions of 5 cm × 5 cm × 1 cm and 10 cm × 10 cm × 1 cm. The wood surface was sanded with 320 mesh sandpaper and purged with compressed air.

2.2. Synthesis of PSt Microspheres by Emulsion Polymerization

In order to understand the influence of emulsifier and reaction temperature on microspheres, single factor emulsion polymerization experiments were carried out. The addition amounts of emulsifier SDBS were set to 125, 150, 175, 200, and 225 mg, and polymerization temperature were set to 65, 70, 75, 80, and 90 °C. The emulsion polymerization was carried out in a three-mouth flask with a thermometer, an overhead agitator, and a spherical condenser tube. In turn, 100 mL deionized water, 40 mL absolute ethanol, 150 mg APS, and the different amounts of SDBS were added into the flask. The mechanical agitator was set to 400 r/min. The reaction system was heated to the specified temperature in an oil bath, 15 g of styrene was added to the reaction vessel.

2.3. Fabrication of Structural Color Coatings on Wood Surface

Single-factor experiments were used to analyze changes in both the reflected spectrum and the color of the coatings using the amount of emulsion coating and the self-assembly environment temperature. Finally, the self-assembly conditions of PSt microspheres that resulted in the best optical properties were determined within the factor level set.
A 35 mm × 35 mm wire frame was drawn on the sanded 50 mm × 50 mm Aspen wood specimen with a pencil before self-assembly. The emulsion drops were coated onto the wire frame substrate with a pipette gun and evenly covered. The wood sample covered with emulsion was put into an electrothermal oven for microsphere self-assembly. The drying time was determined according to the emulsion coating amount to ensure that the final coating was completely dry. The setting of single factor test variables in this part of the experiment is shown in Table 1.

2.4. Patterning Application of Rainbow Structural Color Coatings on a Wood Surface

PSt microspheres with different particle sizes were synthesized by changing the amount of emulsifier SDBS and the reaction temperature to construct rainbow-like structural color coatings on the wood surface. According to the single-factor results, when PSt microspheres were thermally-assisted gravity-deposited on the wood surface, the best coating amount was 40.8 × 10⁻³ mL/cm2 and the self-assembly temperature was 50 °C. Under these conditions, PSt microspheres were self-assembled on a 100 mm × 100 mm Aspen specimen to create a pattern.

2.5. Characterization of PSt Microspheres and Wood Surface Structural Color Coatings

In this study, the hydrodynamic diameter of PSt microspheres in an emulsion state was characterized by dynamic light scattering (DLS). The emulsion used for testing was diluted to solids with a content of no more than 1% by mass. The equipment used was a particle size potentiometer (Zetasizer Nano ZS, Malvern, UK).
The stable emulsion should be understood as a colloid system in which numerous polymer latex particles, each as a unit of Brownian motion, can be suspended in the medium for a long time. When the latex particles approach, they are pushed apart again due to the instant repulsive force caused by their double electric layers. This ensures the stability of the emulsion. The scattering of light occurs when the particles are illuminated by a laser. If the particles are completely stationary, the measured intensity of the scattered light is constant. Due to Brownian motion, scattered light intensity fluctuates with time in a dispersion. Such light intensity fluctuations are dynamic, and the detected scattered signal includes the light intensity fluctuations of the scattered light of all the measured particles. The fluctuation is caused by the interference of the scattered light of each particle. Also, the fluctuation rate of light intensity depends on the diffusion rate of the particle. The smaller the particle, the faster the diffusion, the faster the scattering light intensity fluctuation.
Due to the laser scattering by the microspheres, the Brownian motion of microspheres in the emulsion at 25 °C was tested, and the hydrodynamic diameter distribution, average particle size, and polydispersity index (PDI) of microspheres were calculated using the Stokes–Einstein relationship using the built-in software of the equipment. Through the autocorrelation equation fitted by the light intensity signal, the translation diffusion coefficient is calculated, and then the solution viscosity and temperature are input, because they will affect the diffusion rate of the particles. In the software, the “material” and “dispersan” to be tested can be selected as “polystyrene latex” and “water”. The equipment has built-in functions to measure the refractive index (1.59 for PSt) and viscosity of the dispersant (about 0.89 for water at 25 °C). The average particle size and PDI were obtained with 3 repeated measurements. PDI reflected the particle size distribution of microspheres in the emulsion. The smaller the PDI, the better the monodispersity of microspheres. It is generally believed that when the PDI is less than 0.08, the microspheres in the emulsion have good monodispersity [33,34].
Field emission scanning electron microscopy (FE-SEM, Quanta 400 FEG, FEI, Hillsboro, OR, USA) was used to characterize the structure of the coatings formed by the self-assembly of microspheres on the wood surface. The image processing software Image J was used to measure the particle size of 500 microspheres in different SEM images, and to calculate the coefficient of variation (ratio of the standard deviation of data to average value) to determine the average particle size of microspheres after drying in a vacuum. Ultraviolet-visible near-infrared spectrophotometry (Lambda 950, Perkin Elmer, Waltham, MS, USA) with an integrating sphere module was used to characterize the reflection spectra of the wood surface coating in the visible light region. A digital camera (Canon D9000) was used to take pictures of the structural color of the wood surface coatings under a vertical white light source. This camera was also used to record the patterning application of the rainbow structural color coatings on the wood surface.

3. Results and Discussion

3.1. Effect of Polymerization Conditions on the Diameter of PSt Microspheres

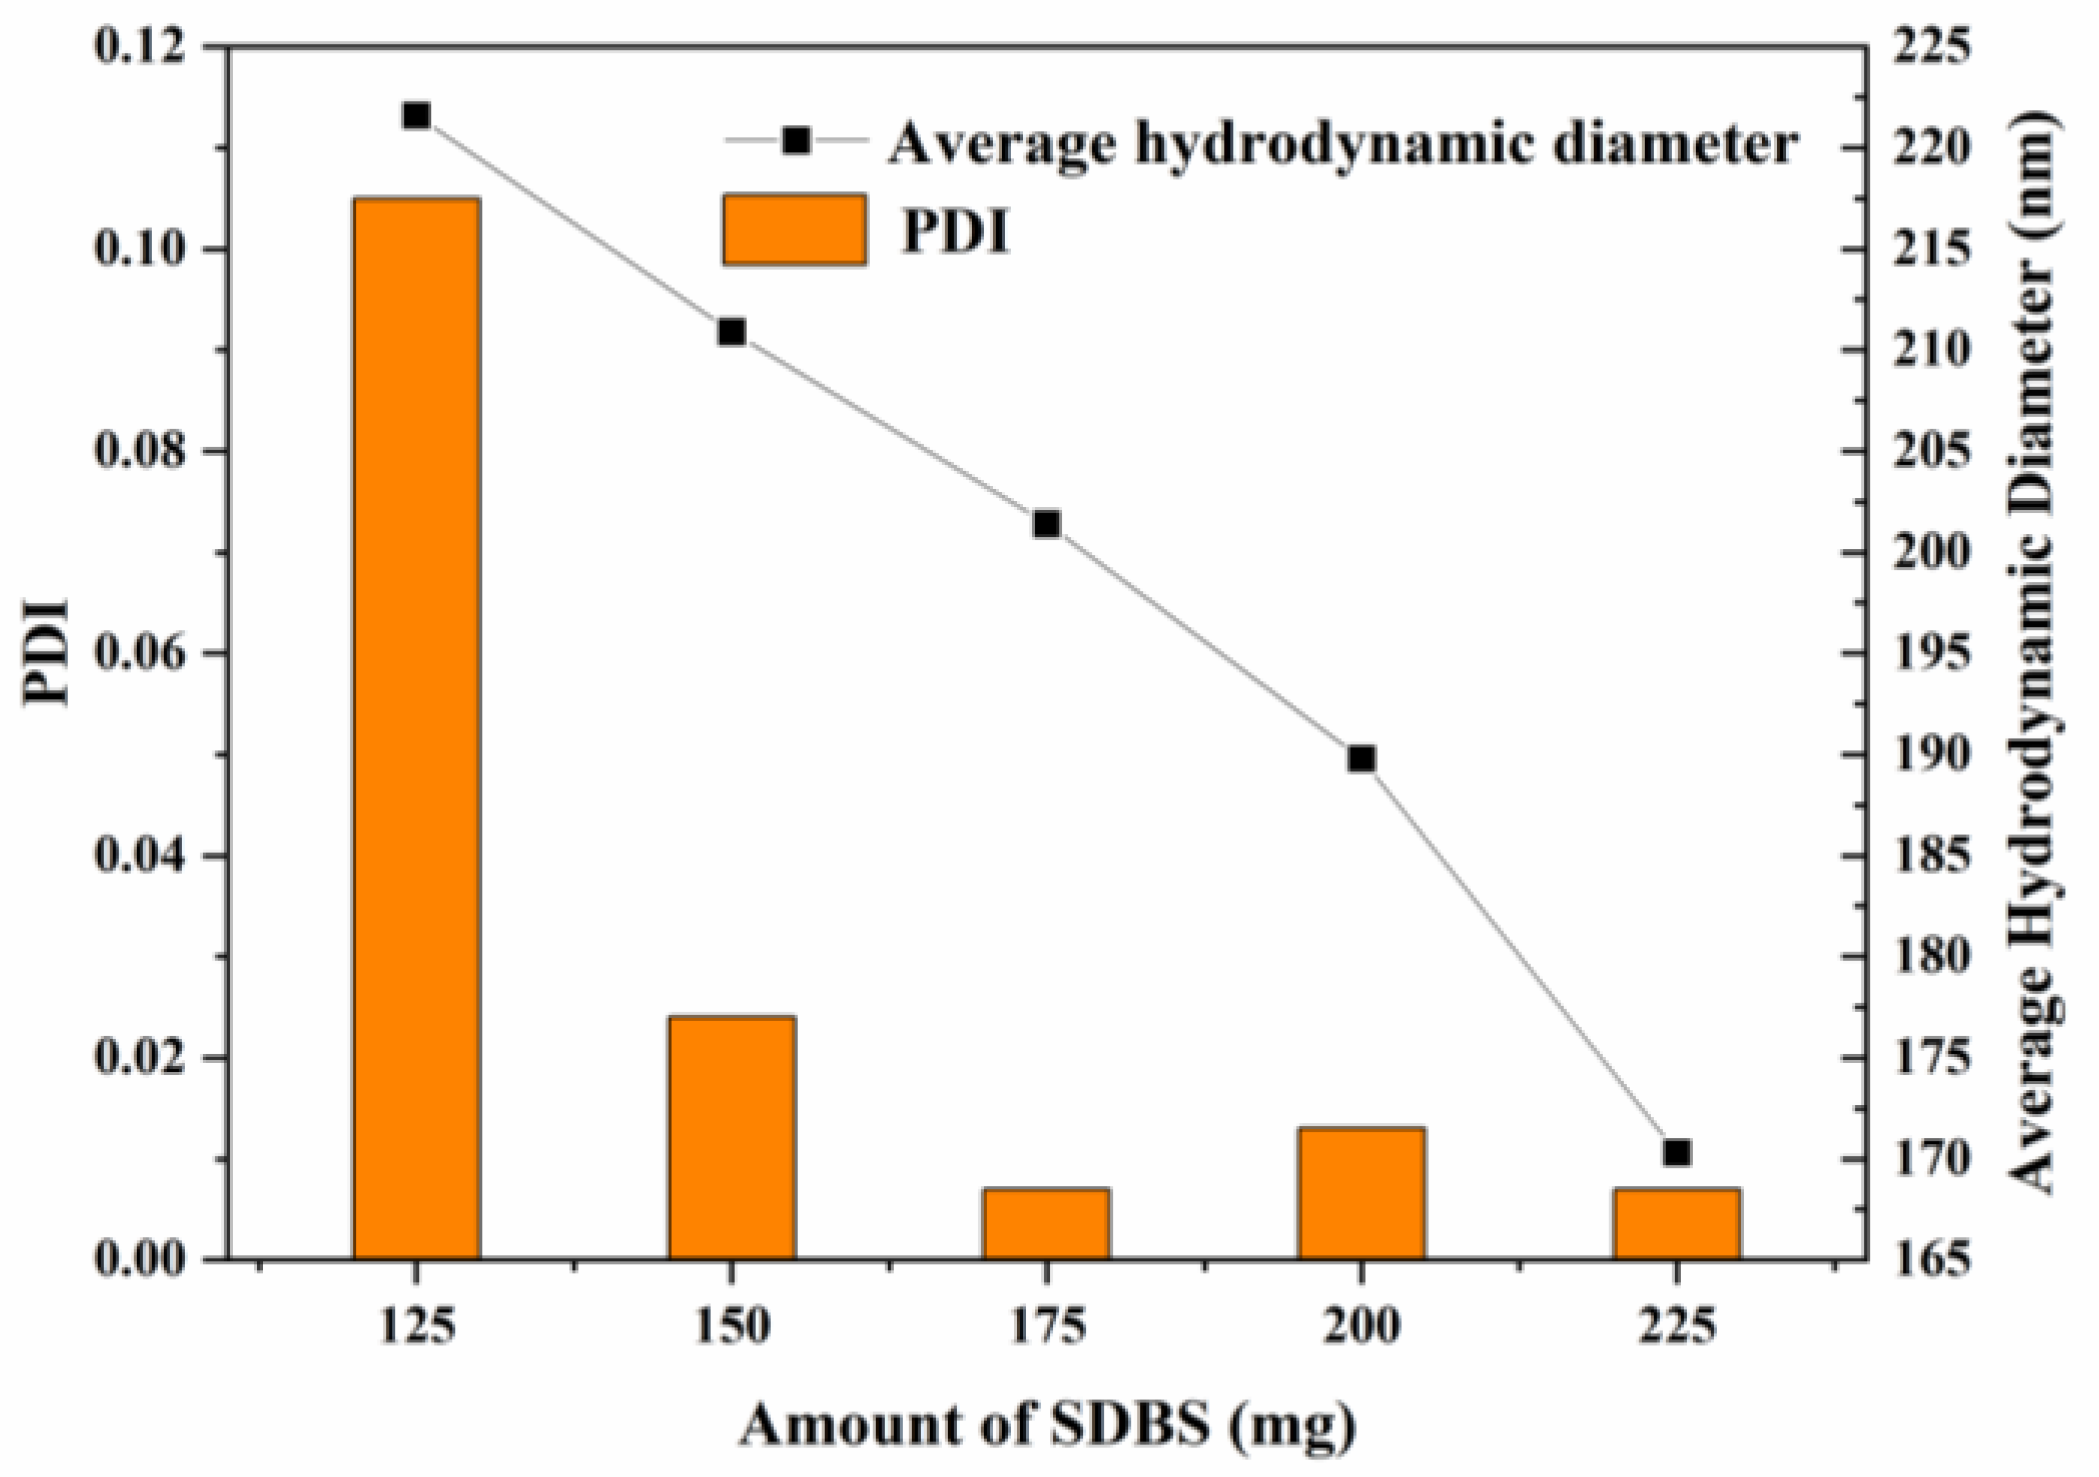
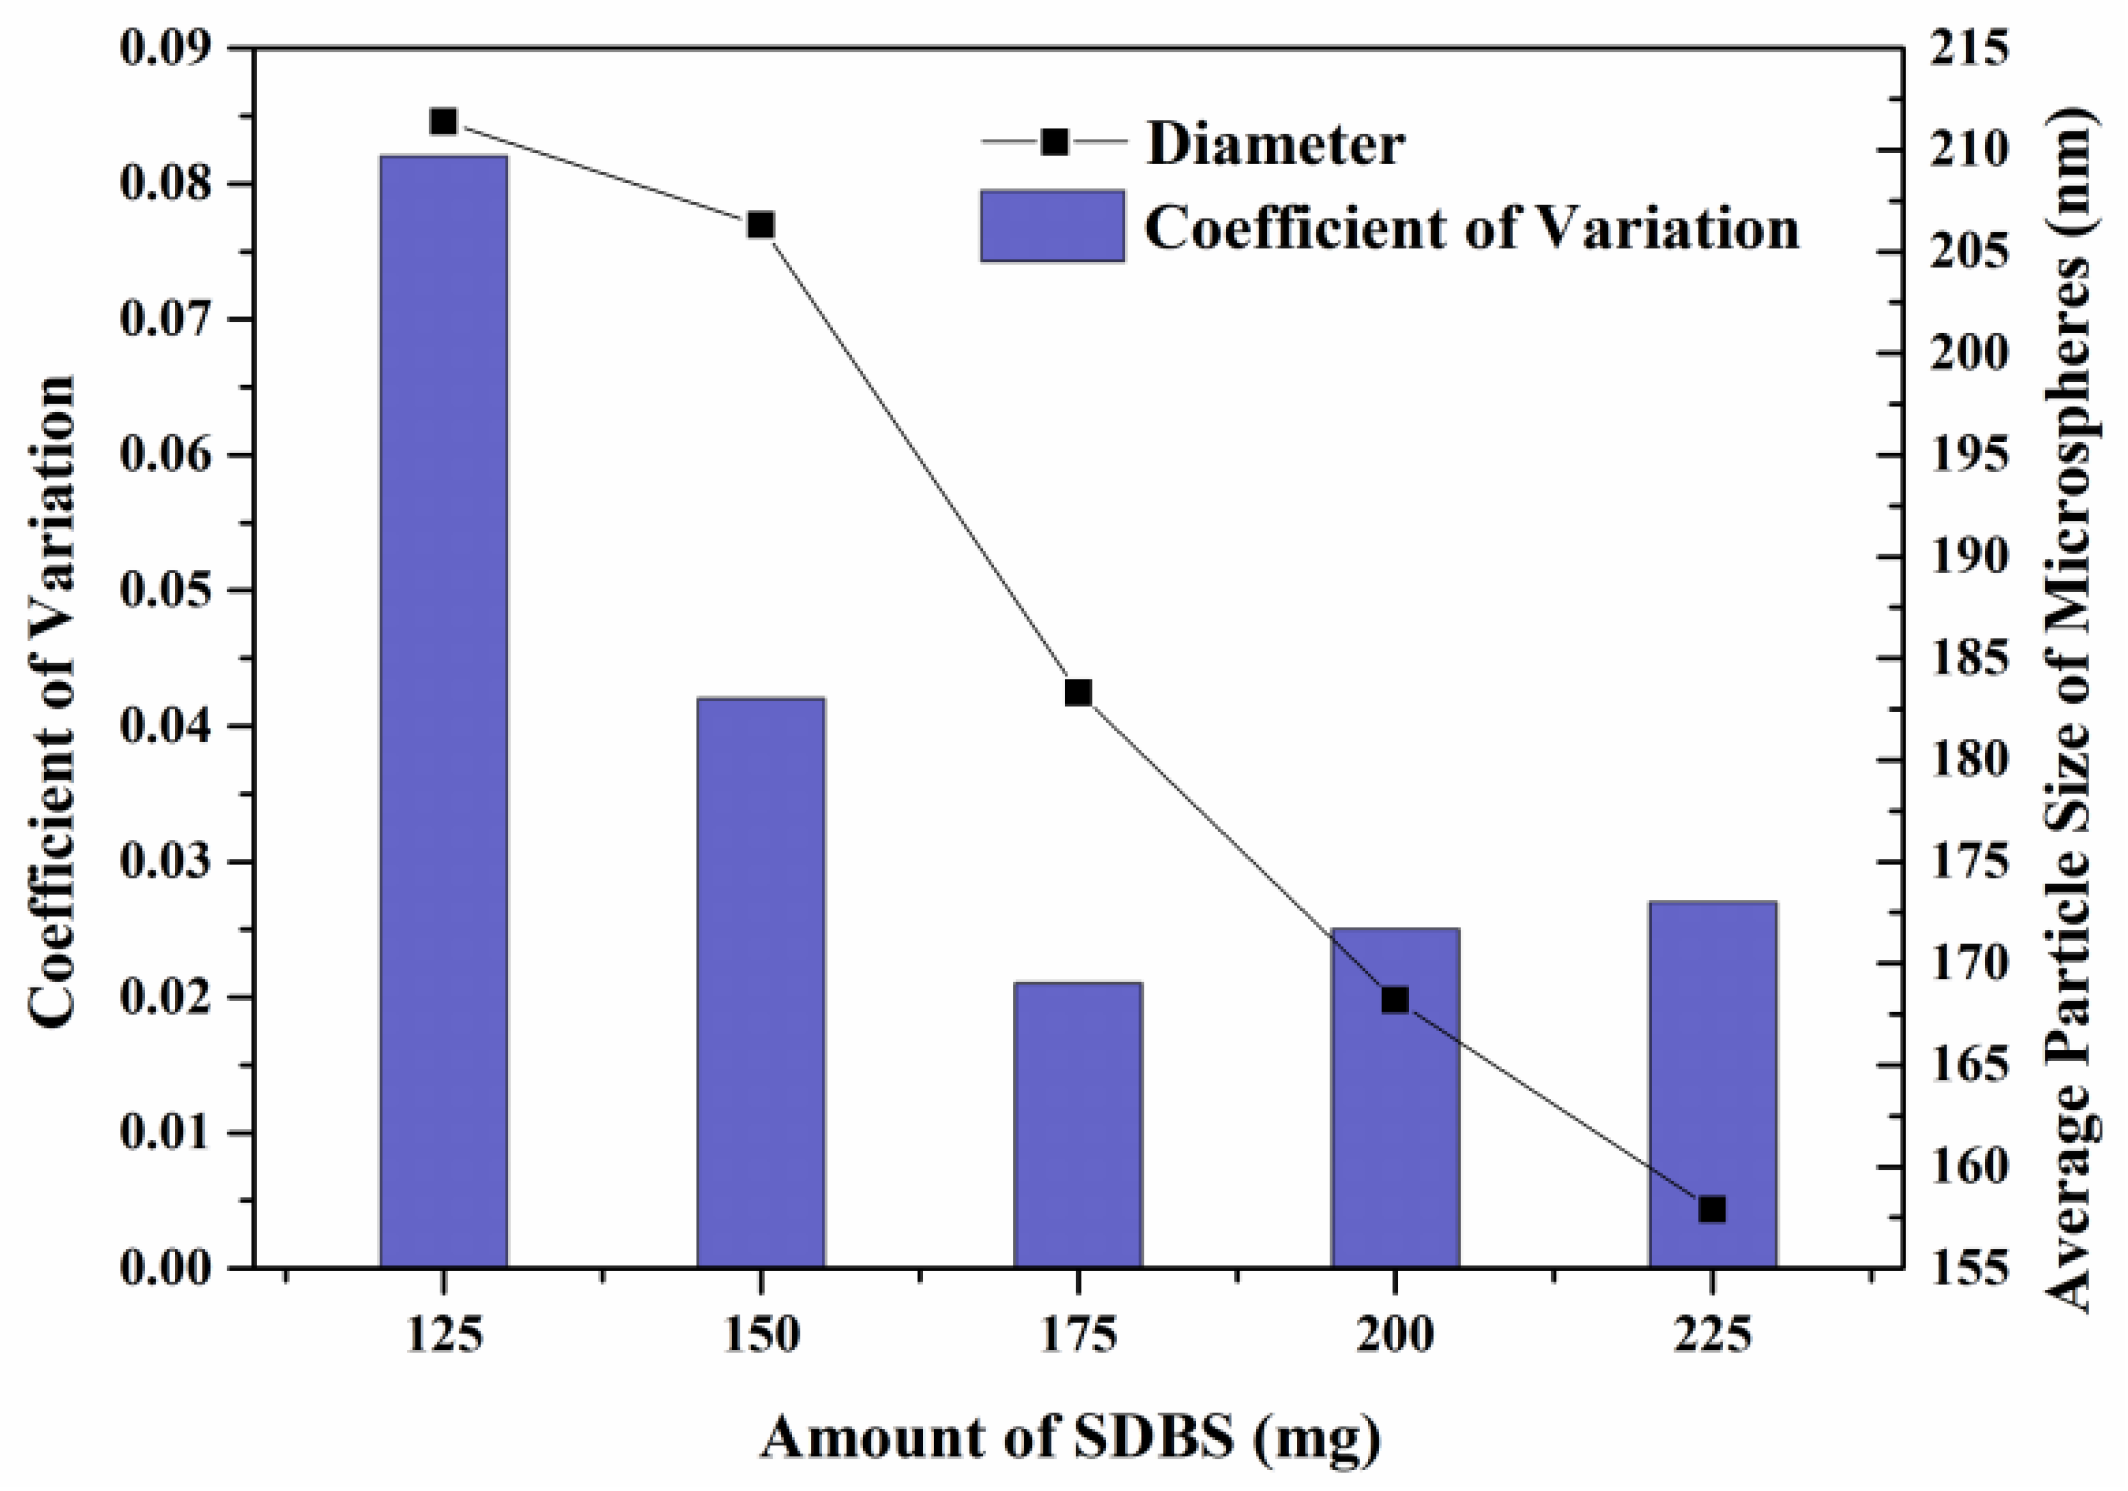
3.1.1. Effect of Emulsifier SDBS Dosage

Figure 1 shows the hydrodynamic diameter and PDI of the synthesized PSt microspheres when the amount of SDBS added during emulsion polymerization was used as a single-factor variable with the reaction temperature set at 70 °C. When the emulsifier SDBS amount was 125 mg, the PDI of the microspheres in the synthetic emulsion was 0.105, indicating poor monodispersity and uneven particle size. The PDI values of the microspheres were all below 0.025 at other SDBS dosages. When the emulsifier SDBS amount was 175 mg, the PDI of the microspheres was the lowest and the monodispersity was the best.
Figure 2 shows the FE-SEM image of PSt microspheres synthesized under different SDBS dosages, and the shape of the microspheres was relatively uniform. When 125 mg SDBS was added, as shown in Figure 2A, the PSt microspheres were disordered, showing some short-range order and a long-range disorder. The microspheres synthesized at other SDBS amounts were arranged in long-range order during drying, and the photonic crystal structure had some point and line defects, which may have been caused by steric hindrance between the ordered structures of small photonic crystals. Among them, when 175 mg SDBS was added, as shown in Figure 2C, the sample had the fewest morphological defects.
Figure 3 shows the average particle size and coefficient of variation of PSt microspheres synthesized under different SDBS dosages (obtained by manual measurement). Compared with Figure 1, changes in the average particle size of microspheres obtained by manual measurement and DLS characterization were consistent with increasing the SDBS dosage, i.e., the higher the SDBS dosage, the smaller the average particle size of microspheres. When the emulsifier SDBS amount was 125 mg, the coefficient of variation of the microsphere size was 0.085. This showed that the diameter of the microspheres was not uniform, which was also consistent with the failure of the microspheres to arrange in long-range order in the FE-SEM image. The coefficient of variation of microspheres obtained at other SDBS dosages was less than 0.045, which indicated good homogeneity. When emulsifier SDBS amount was 175 mg, the coefficient of variation of the particle size of microspheres was the lowest and thus the monodispersity was the best. This was consistent with the DLS characterization results.
The comparison between Figure 1 and Figure 3 shows that the average particle size (155–215 nm) of the microspheres measured manually was smaller than that obtained by DLS (170–225 nm). This was mainly because when the microspheres were analyzed by DLS, they existed in the emulsion in a dispersed and swollen state. However, the microspheres in the FM-SEM image had gone through sample preparation processes, such as self-assembly, gold spraying, and vacuum drying, so they were in an absolutely-dry state. As a result, the average particle size and coefficient of variation of the two were different.
When emulsion polymerization was carried out within a reasonable emulsifier addition range, increasing the emulsifier amount produced more micelles; thus, more emulsion particles were produced based on the mechanism of the micellar mechanism of emulsion polymerization. This meant that the number of microspheres increased, but the particle size decreased.
Figure 4 shows photos of dried PSt microsphere emulsions synthesized at different SDBS doses. Upon increasing the SDBS content, the color of the sample changed from yellow-green to blue-violet. According to the Bragg diffraction law [35,36], in the ordered arrangement of microspheres, the particle size of the microspheres affected the band gap of the photonic crystal structure. This meant that the diameter of microspheres became smaller, and the structural color underwent a blue shift. When the diameter of the microspheres became larger, the structural color was red-shifted. Therefore, color changes in the sample were consistent with the previous conclusion that showed that increasing the amount of SDBS decreased the particle size of the microspheres.
When the added amount of SDBS was 125 mg, as shown in Figure 4A, the dried microsphere sample was yellow-green with low brightness. Only the center of the sample had a bright color, and the edge was grayish-white. Combined with DLS and FE-SEM analysis, it could be seen that the main reason was the poor monodispersity of the microsphere size, and the formed structure showed only short-range order. Different from 125 mg SDBS, when 225 mg SDBS was added, as shown in Figure 4E, the sample was dark purple with a low brightness. Combined with DLS and FE-SEM analysis, this was caused by the small particle size of the microspheres. The band gap of the photonic crystal structure entered the ultraviolet region. When the added amount of SDBS was 150, 175, and 200 mg, as shown in Figure 4B–D, the dried samples were green, blue-violet, and violet, respectively. This showed that good monodispersity, ordered assembly, and a specific particle size range were the key to producing good structural color.
The above three kinds of dried samples with different SDBS doses had a good color rendering effect, but combined with DLS and FE-SEM analyses, 175 mg SDBS was the optimal dosage.

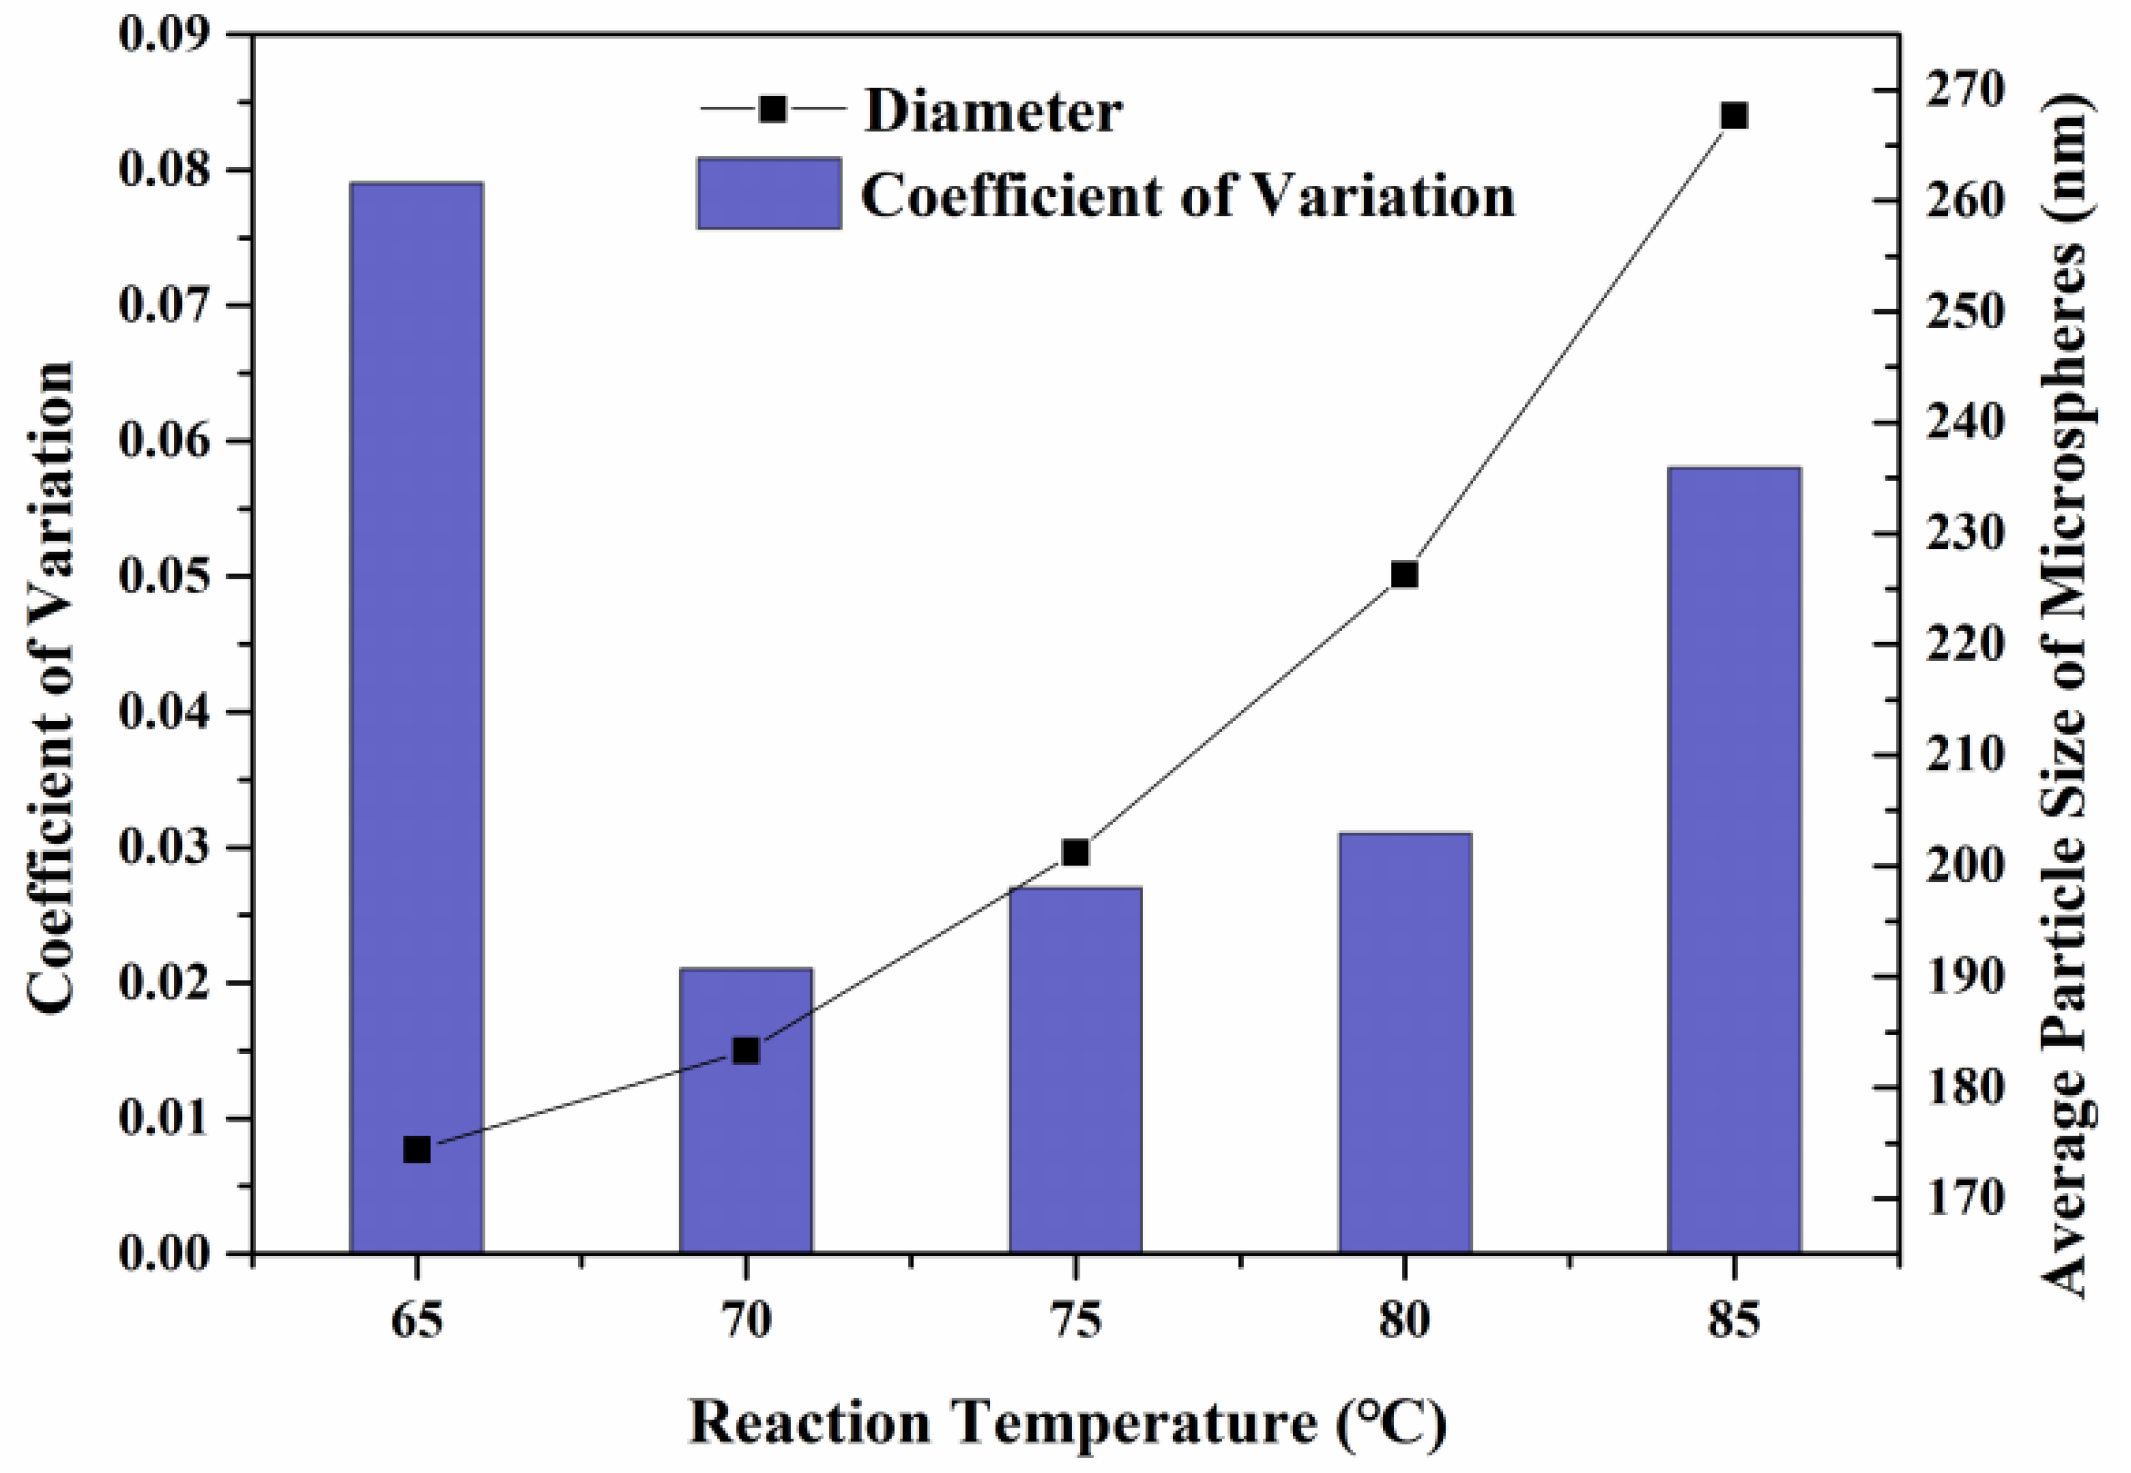
3.1.2. Effect of Polymerization Temperature

Based on the analysis of the results in Section 3.1.1, the amount of emulsifier SDBS in emulsion polymerization was set to 175 mg, and the reaction temperature was used as the variable. The hydrodynamic diameter and PDI of the synthesized PSt microspheres are shown in Figure 5. The average hydrodynamic diameter of PSt microspheres increased with the temperature. When the reaction temperature was 65 °C, the PDI was 0.103, which indicated that the monodispersity of the microspheres was poor and the particle size was uneven. When the temperature increased to 70 °C, the PDI was 0.007, indicating that the microspheres had the best monodispersity, and the average particle size was about 201.4 nm.
Figure 6 shows the FE-SEM image of PSt microspheres synthesized at different temperatures, in which the shape of the microspheres was relatively uniform. The diameters of colloidal microspheres increased significantly with the reaction temperature. When the reaction temperature was 65 °C, as shown in Figure 6A, many large microspheres were in a more disordered arrangement than other microspheres. This was consistent with the conclusion from DLS measurements in which the PDI was > 0.08, indicating poor particle size monodispersity. When the reaction temperature was 70 °C, as shown in Figure 6B, the sample had the fewest morphological defects.
Figure 7 shows the average particle size and its coefficient of variation of PSt microspheres synthesized at different reaction temperatures by manual measurement. Compared with Figure 5, the average particle size of microspheres obtained by manual measurement and DLS characterization showed the same trend with the temperature, i.e., increasing the polymerization temperature also increased the average particle size. When the reaction temperature was 65 °C, the coefficient of variation of the particle size of the microspheres was 0.08, which indicated that the microspheres had uneven sizes. This was consistent with the existence of large-diameter microspheres with a low degree of order in the FE-SEM images. The coefficients of variation of PSt microspheres synthesized at other reaction temperatures were all less than 0.06, indicating that the microspheres exhibited a homogeneous particle size. Overall, when the temperature increased, the coefficient of variation of microspheres increased, which was consistent with the DLS analysis. Specifically, when the temperature was 70 °C, the coefficient of variation of the microsphere size was the lowest (0.021), indicating the best monodispersity was obtained. At this time, the average particle size of the microspheres was about 183.3 nm.
Compared with Figure 5, Figure 7 shows that the average particle size (170–270 nm) of microspheres measured manually was smaller than that of DLS (195–305 nm) for similar reasons. During emulsion polymerization, the Brownian motion of microspheres was intensified at higher reaction temperatures. This promoted collisions between microspheres so that the free radical generation rate was high, and polymerization was promoted. Under the combined effect of these factors, the average particle size of the microspheres increased.
Figure 8 shows the photos of dried PSt microspheres synthesized at different reaction temperatures. When the reaction temperature increased, the color of the sample changed from blue-violet to violet-red, and a red shift occurred. According to the rules summarized above, the particle size of microspheres increased with the reaction temperature, and the color redshifted, which followed the Bragg diffraction law [35,36]. When the reaction temperature was 85 °C, as shown in Figure 8E, the dried microsphere sample appeared dark red with a low brightness. Only the center of the sample showed the corresponding color, while the edge position appeared gray-white. According to DLS and FE-SEM results, this was mainly because the particle size of the microspheres was too large, and the band gap of the photonic crystal structure soon entered the ultraviolet region. When the reaction temperature was 65 °C, as shown in Figure 8A, the color brightness of the edges of the dried microsphere sample was low, but the center still appeared bright purple. Combined with DLS and FE-SEM results, the main reason for this was the monodispersity of microsphere size and the low degree of long-range order of the formed structure. When the reaction temperature was 70, 75, and 80 °C, as shown in Figure 8B–D, the samples appeared blue, blue-green, and yellow-green, respectively.
The color rendering effect of the dried samples under the above three reaction temperatures was good. However, combined with the DLS and FE-SEM results, the reaction temperature of 70 °C was optimal.
Through single-factor experiments, combined with DLS and FE-SEM results, the experimental conditions for synthesizing the most monodisperse PSt microspheres were determined. The polymerization time was 10 h, the initiator APS was 150 mg, the emulsifier SDBS was 175 mg, and the polymerization temperature was 70 °C. The PDI of the obtained microspheres was 0.007, the average hydrodynamic diameter was 201.4 nm, the coefficient of variation was 0.021, and the average manually measured particle size was 183.3 nm.

3.2. Effect of Construction Conditions on Structural Color Coatings on a Wood Surface

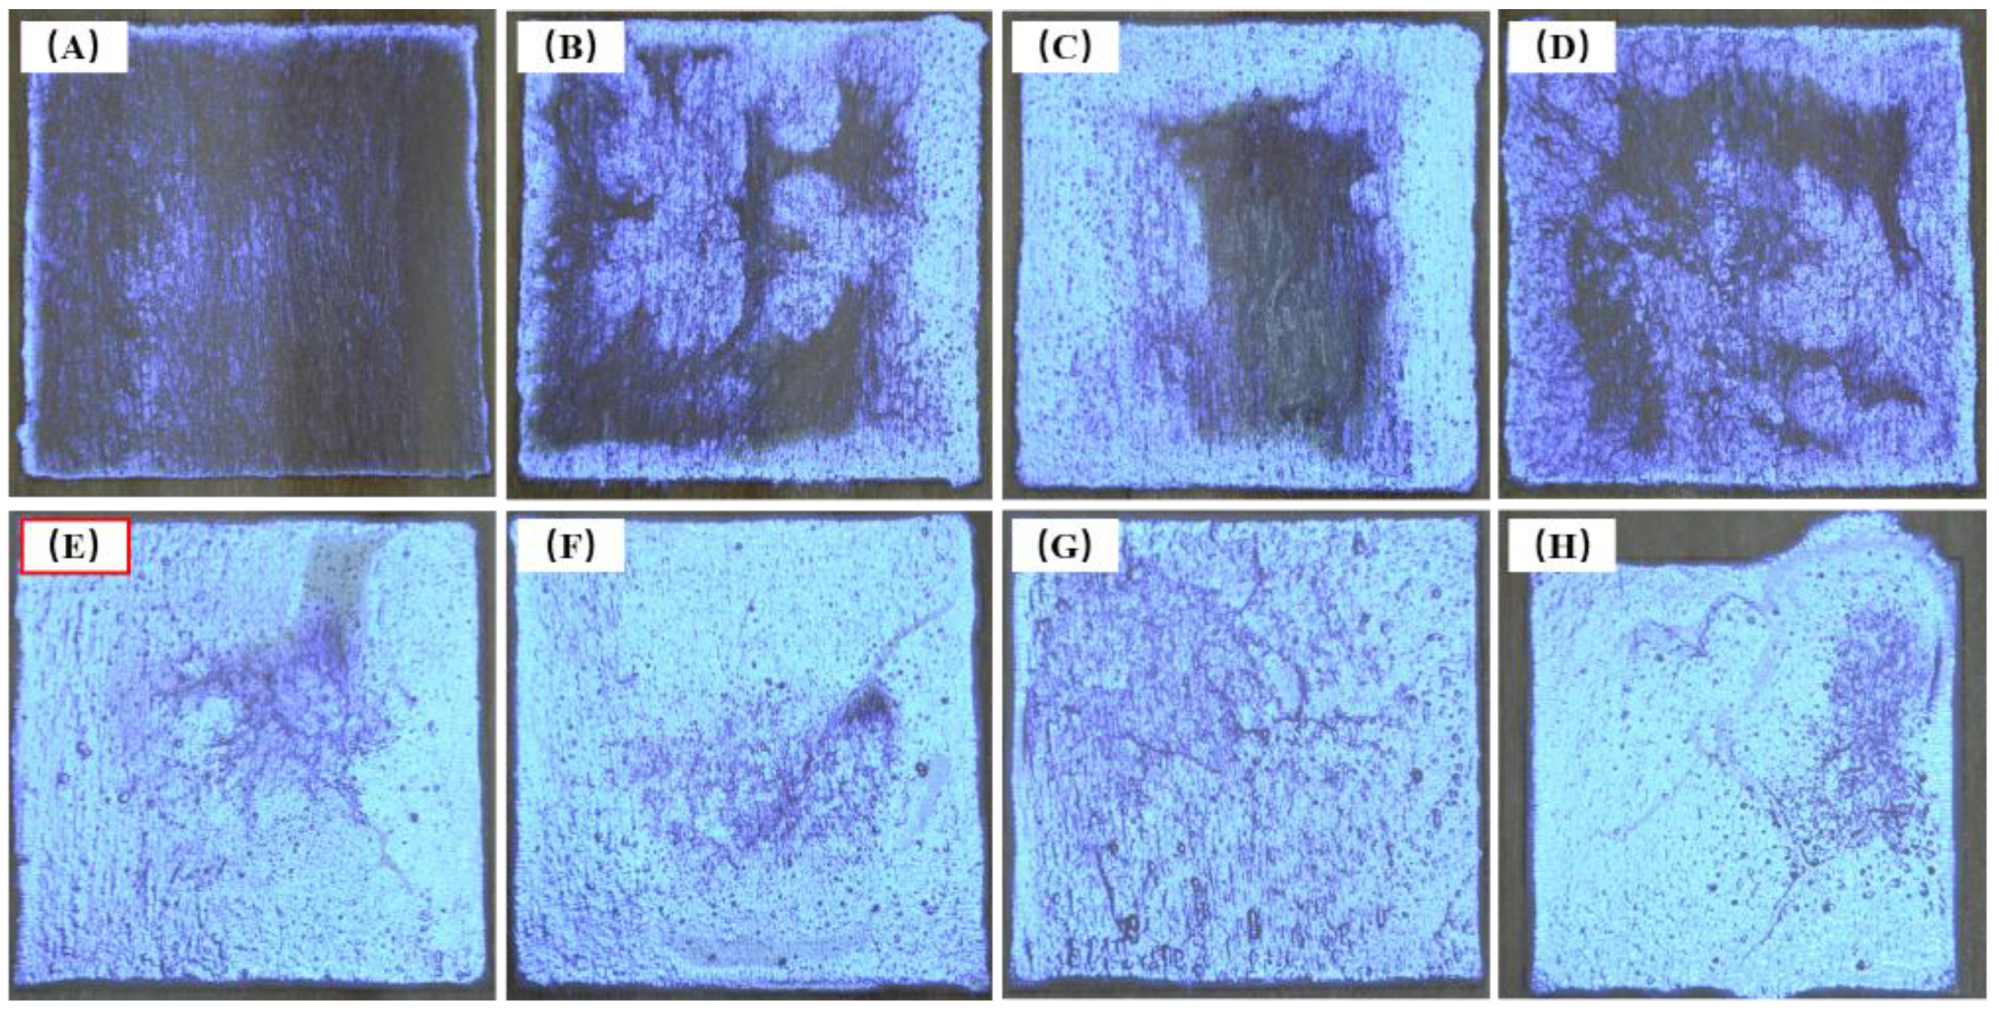
3.2.1. Effect of Emulsion Dosage

The solid content of PSt microsphere emulsion synthesized by the above optimal formula was about 9.65%. The emulsion was applied to a 35 mm × 35 mm wire frame on the surface of Aspen wood by thermally-assisted gravity deposition. Figure 9 shows the obtained coating photos when the emulsion dosage was taken as the single-factor variable, and the self-assembly temperature of PSt microspheres was set to 50 °C. When the emulsion coating amount was 100–400 μL, as shown in Figure 9A–D, respectively, the photonic crystal structure showed a blue-violet structural color. However, they did not completely cover the wood surfaces. When the coating amount was 100 μL, the structural color at the edges of the coated wire frame was more obvious. This was due to the non-uniform coating, in which the liquid surface thickness near the emulsion coating edge was the lowest, so the dispersant evaporated faster. This formed liquid flow, which drove the colloidal microspheres to move to the edge and gather together, preferentially forming an orderly photonic crystal structure, i.e., the coffee ring effect.
When the emulsion coating amount was 500–800 μL, as shown in Figure 9E–H, respectively, the photonic crystal structure completely covered the coating area. When the amount exceeded 800 μL, the emulsion overflowed the wire frame area; therefore, the upper limit was 800 μL. Due to the coffee ring effect, the surface of the photonic crystal structure coating formed near the edge was relatively flat, while the center of the coating after drying and assembly was slightly rough. This was mainly because, when the coating was self-assembled at the edge of the microspheres, the content of dispersant in the coated emulsion was sufficient. With the assistance of heat, sufficient microspheres were transported to the edge of the coating where they self-assembled and formed an ordered structure. However, when drying was carried out to the end, the content of dispersant in the emulsion decreased, and the amount of microspheres decreased relative to the initial self-assembly stage, so the coating formed at this time was slightly rougher than the edges of the coating in the digital photos.
By compared the coating effect of various emulsion coating amounts shown in Figure 9, one can conclude that when the coating amounts were 500 μL and 600 μL, the coating effect was relatively good.
Photonic crystal coatings on the wood surface were characterized by UV-visible reflection spectroscopy, as shown in Figure 10. The monotonic rising curve (at the bottom of the figure) without an obvious peak was the reflection spectrum of uncoated wood in the visible wavelength range. According to the Bragg diffraction equation and Snell’s law of refraction [33,37]:
λ max = 2 d hkl n eff 2 sin 2 β
where λmax is the wave crest of the reflected light wave of the photonic crystal structure color coating; dhkl is the lattice spacing of the photonic crystal (dhkl = 6 / 3 D , where D is the diameter of PSt microspheres); β is the light incidence angle (the angle between the incident light and the normal of the incident surface); and neff is the average effective refractive index (neff = 0.74nPSt + 0.26nair, where nPSt is the refractive index of PSt microspheres, and nair is the refractive index of air).
Based on the calculation results of microsphere particle size, the hydrodynamic diameter (201.4 nm) and manually-measured particle size (183.3 nm) of the microspheres were introduced into Formula (1). The wavelength range of the reflection peak of the photonic crystal coating composed of the microspheres was within the range of 431–474 nm, which is consistent with the blue-violet structural color shown in Figure 9.
When the coating amount of PSt emulsion was 100–500 μL, the spectra of coatings were similar. There was an obvious single peak at 443 nm. However, the half-width of the peak of each reflection spectrum curve was different. When the amount was 500 μL, the reflectivity was the highest, and the half-width of the peak was the smallest (~23 nm). This showed that the coating had the best effect at this wavelength. When the amount of PSt emulsion continued to increase, a new peak appeared at about 400 nm, which impacted the peak response of the photonic crystals. When the application amount was 600 μL and 700 μL, the peak position of the photonic crystal response moved to 436 nm. However, when the amount was increased to 800 μL, the two peaks of the reflection curve of the coating were superimposed, showing a flat peak with a range of 417–436 nm.
Based on the previous research from our research group, this new peak was due to the reflection generated by the response of PSt microspheres to light waves, which was more obvious upon increasing the amount of PSt microspheres [38]. Compared with the spectrum of uncoated wood, the spectra of the coatings formed using different coating amounts showed a monotonic increase in the range of 550–800 nm, which might have been affected by the reflection spectrum of wood.
Therefore, combined with the characterization results of the reflection spectrum, the coating amount of PSt microsphere emulsion was set to 500 μL over an area of 35 mm × 35 mm. The best effect was achieved when the coating amount per unit area was 40.8 × 10⁻³ mL/cm2.

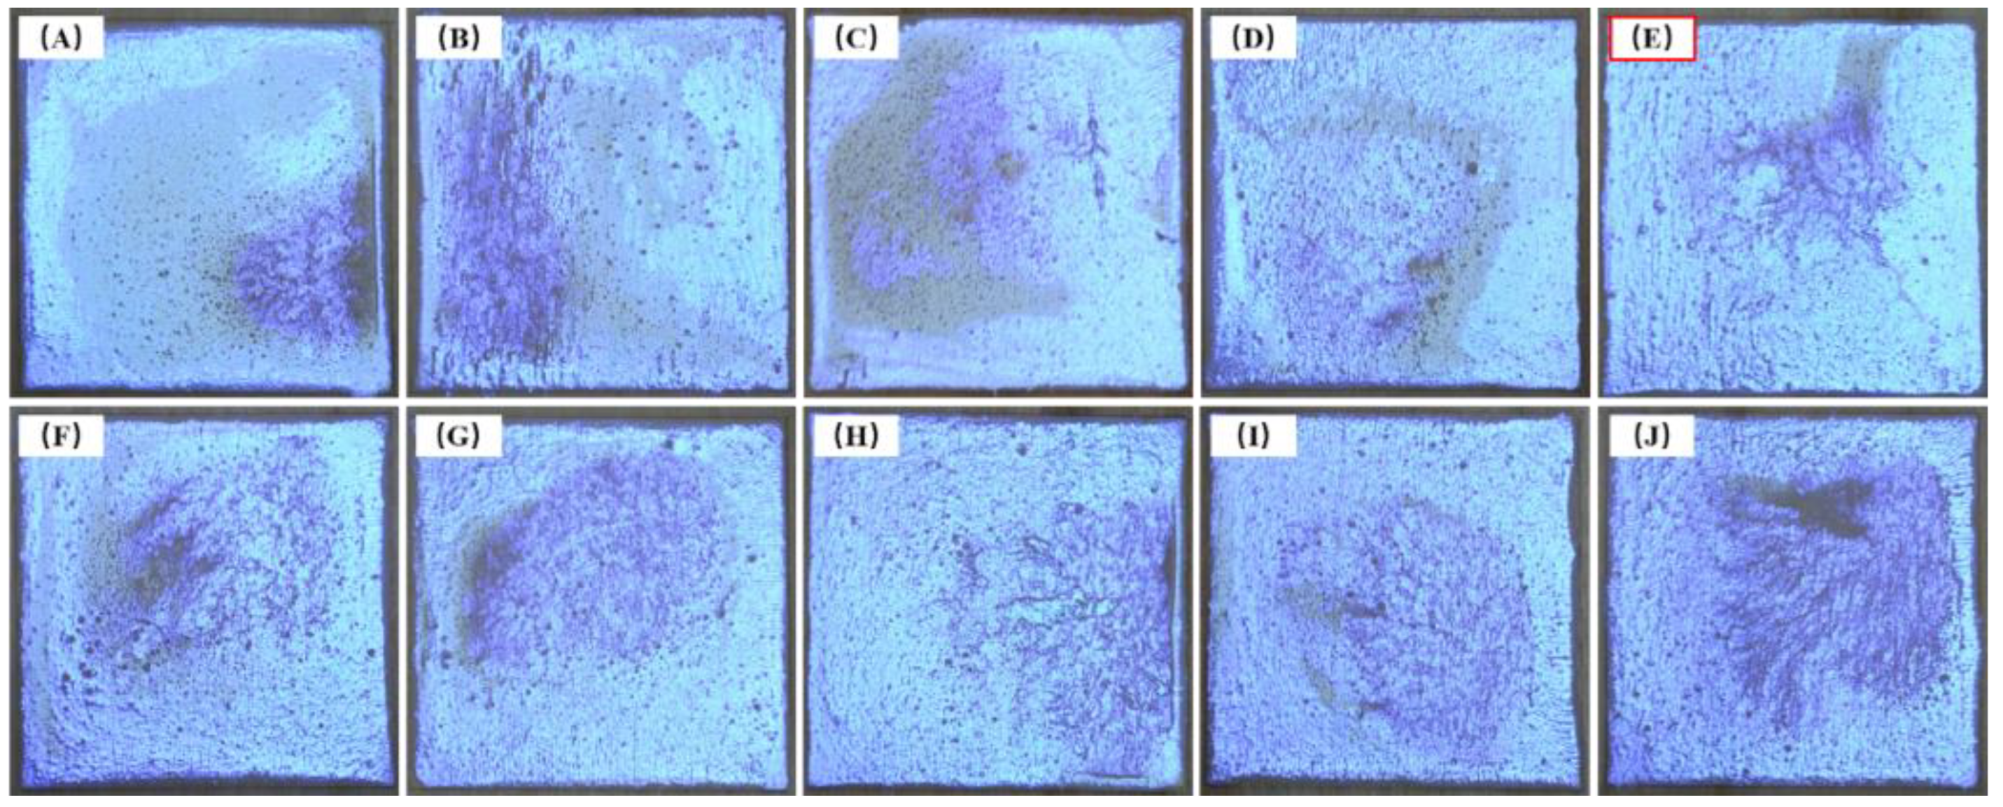
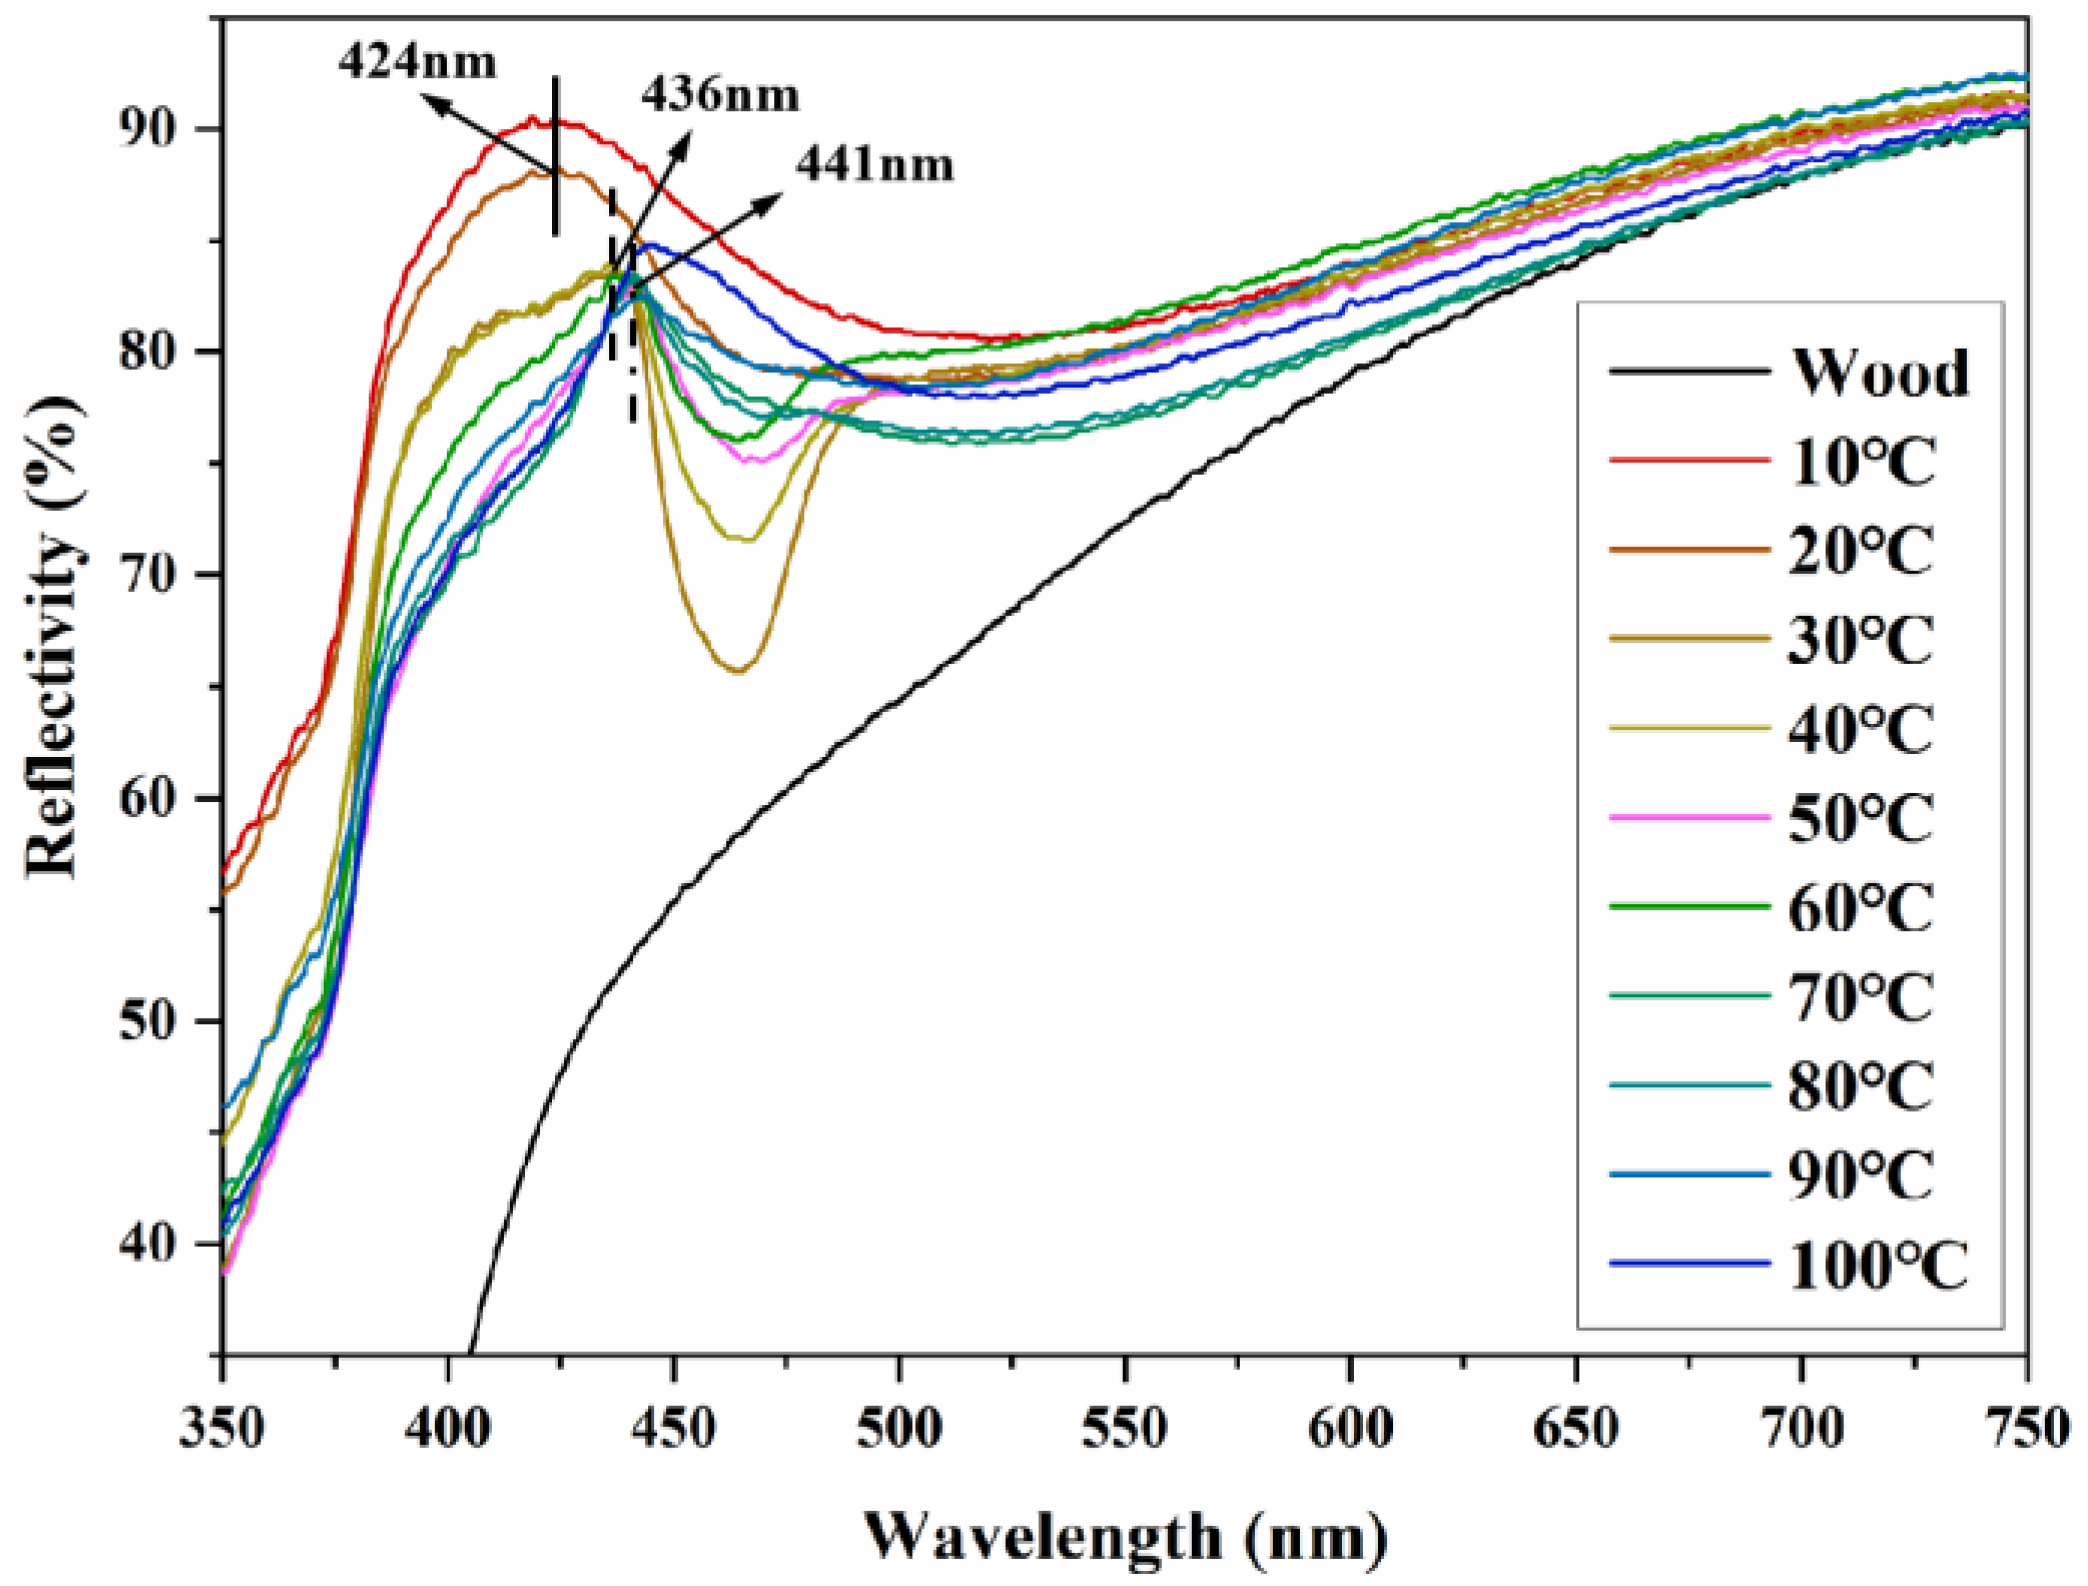
3.2.2. Effect of Self-Assembly Environment Temperature

The photos of PSt microspheres self-assembled on the wood surface to form structural color coatings are when the environment temperature was the single-factor variable are shown in Figure 11. The structural color coatings formed at different temperatures had different degrees of color unevenness. Based on the above analysis results, this was due to the coffee ring effect of PSt microspheres during self-assembly. The color of the coating edge was more uniform, which indicated that this part was the preferred self-assembly position. However, an uneven color and poor surface flatness occurred in the center of the coating or near certain edges because the dispersant in the emulsion evaporated during assembly in this area. Thus, fewer microspheres participated in self-assembly than at the preferred self-assembly position. Therefore, the formed coating was slightly rougher in the optical photos.
Upon increasing the self-assembly temperature, the coating surface gradually became more uniform. At 50 °C, as shown in Figure 11E, the uniformity and the smoothness of the coating was the largest and highest. As the self-assembly temperature continued to increase, the unevenness of the coating increased, and the brightness decreased. The self-assembly temperature was related to the evaporation rate of the dispersant in the emulsion. When the temperature was too low, the evaporation rate of the dispersant was slow, and the aggregation degree of the microspheres to the emulsion surface was not high. Therefore, there were fewer parts of the coating that showed a high brightness in Figure 11A–C. When the temperature was too high, the evaporation rate of the dispersant was fast, so there was insufficient time for the microspheres to self-assemble into an ordered photonic crystal structure. Thus, the brightness of the coating was also low, as shown in Figure 11I,J.
The reflection spectra of PSt microspheres self-assembled at different temperatures on the wood surface to form structural color coatings are shown in Figure 12. Upon increasing the self-assembly temperature, the wavelength position of the structural color coatings in response to different visible light wavelengths changed significantly. When the temperature was 10 °C and 20 °C, the reflection spectra displayed a single peak at 424 nm, with a wide half-peak width (62.5 nm and 46.5 nm). This peak was formed by the superposition of the structural color reflection peak and the PSt microspheres’ own reflection peak. Compared with the coatings formed at 10 °C and 20 °C, when the self-assembly temperature was raised to 30 °C and 40 °C, the peak value of the coatings moved to 436 nm, and the peak height became lower, the half-peak width became narrower (32.5 nm and 25 nm). This showed that the coating had a better band gap effect at the corresponding wavelength, and the self-reflection peak of PSt microspheres could still be observed. When the self-assembly temperature was 50–90 °C, the position of the reflective peak of the coatings was the same at 441 nm. This indicated that the response of the coating formed within this self-assembly temperature range to visible wavelengths was consistent. At the same time, the reflection peak of PSt microspheres had little effect on the structure color reflection peak. When the self-assembly temperature was 50 °C, the half-peak width of the reflectance spectrum was the smallest (23 nm), indicating that the coating had the best effect on the wavelength.
Therefore, in combination with the characterization results in Figure 9, Figure 10, Figure 11 and Figure 12, in subsequent experiments, the emulsion coating amount was set to 500 μL over an area of 35 mm × 35 mm, i.e., the coating amount per unit area was 40.8 × 10⁻³ mL/cm2, and the self-assembly temperature was set to 50 °C.

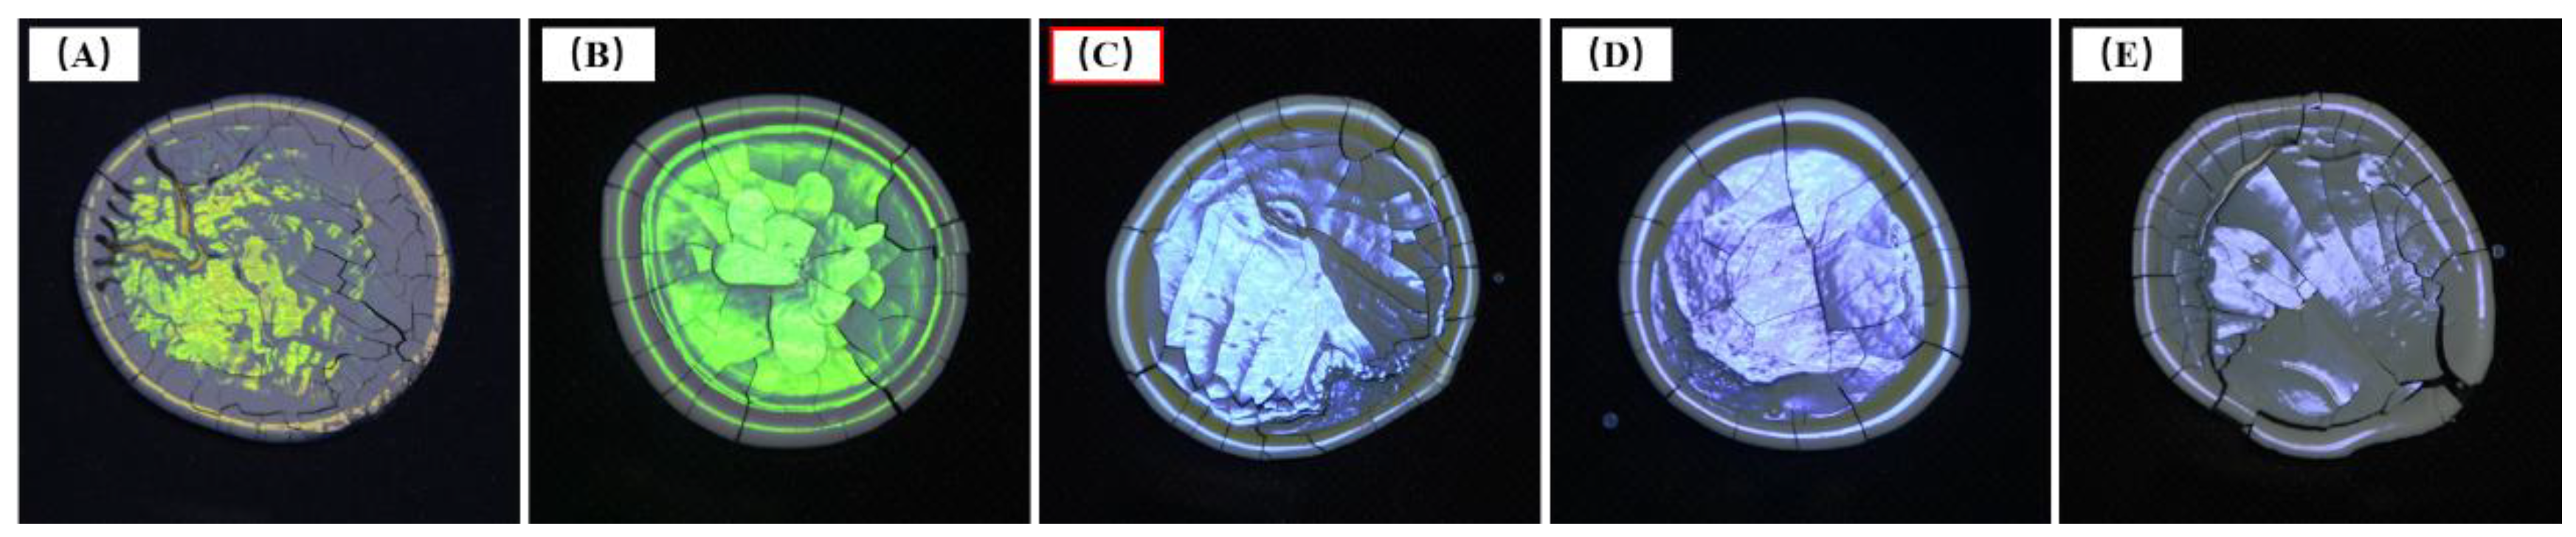
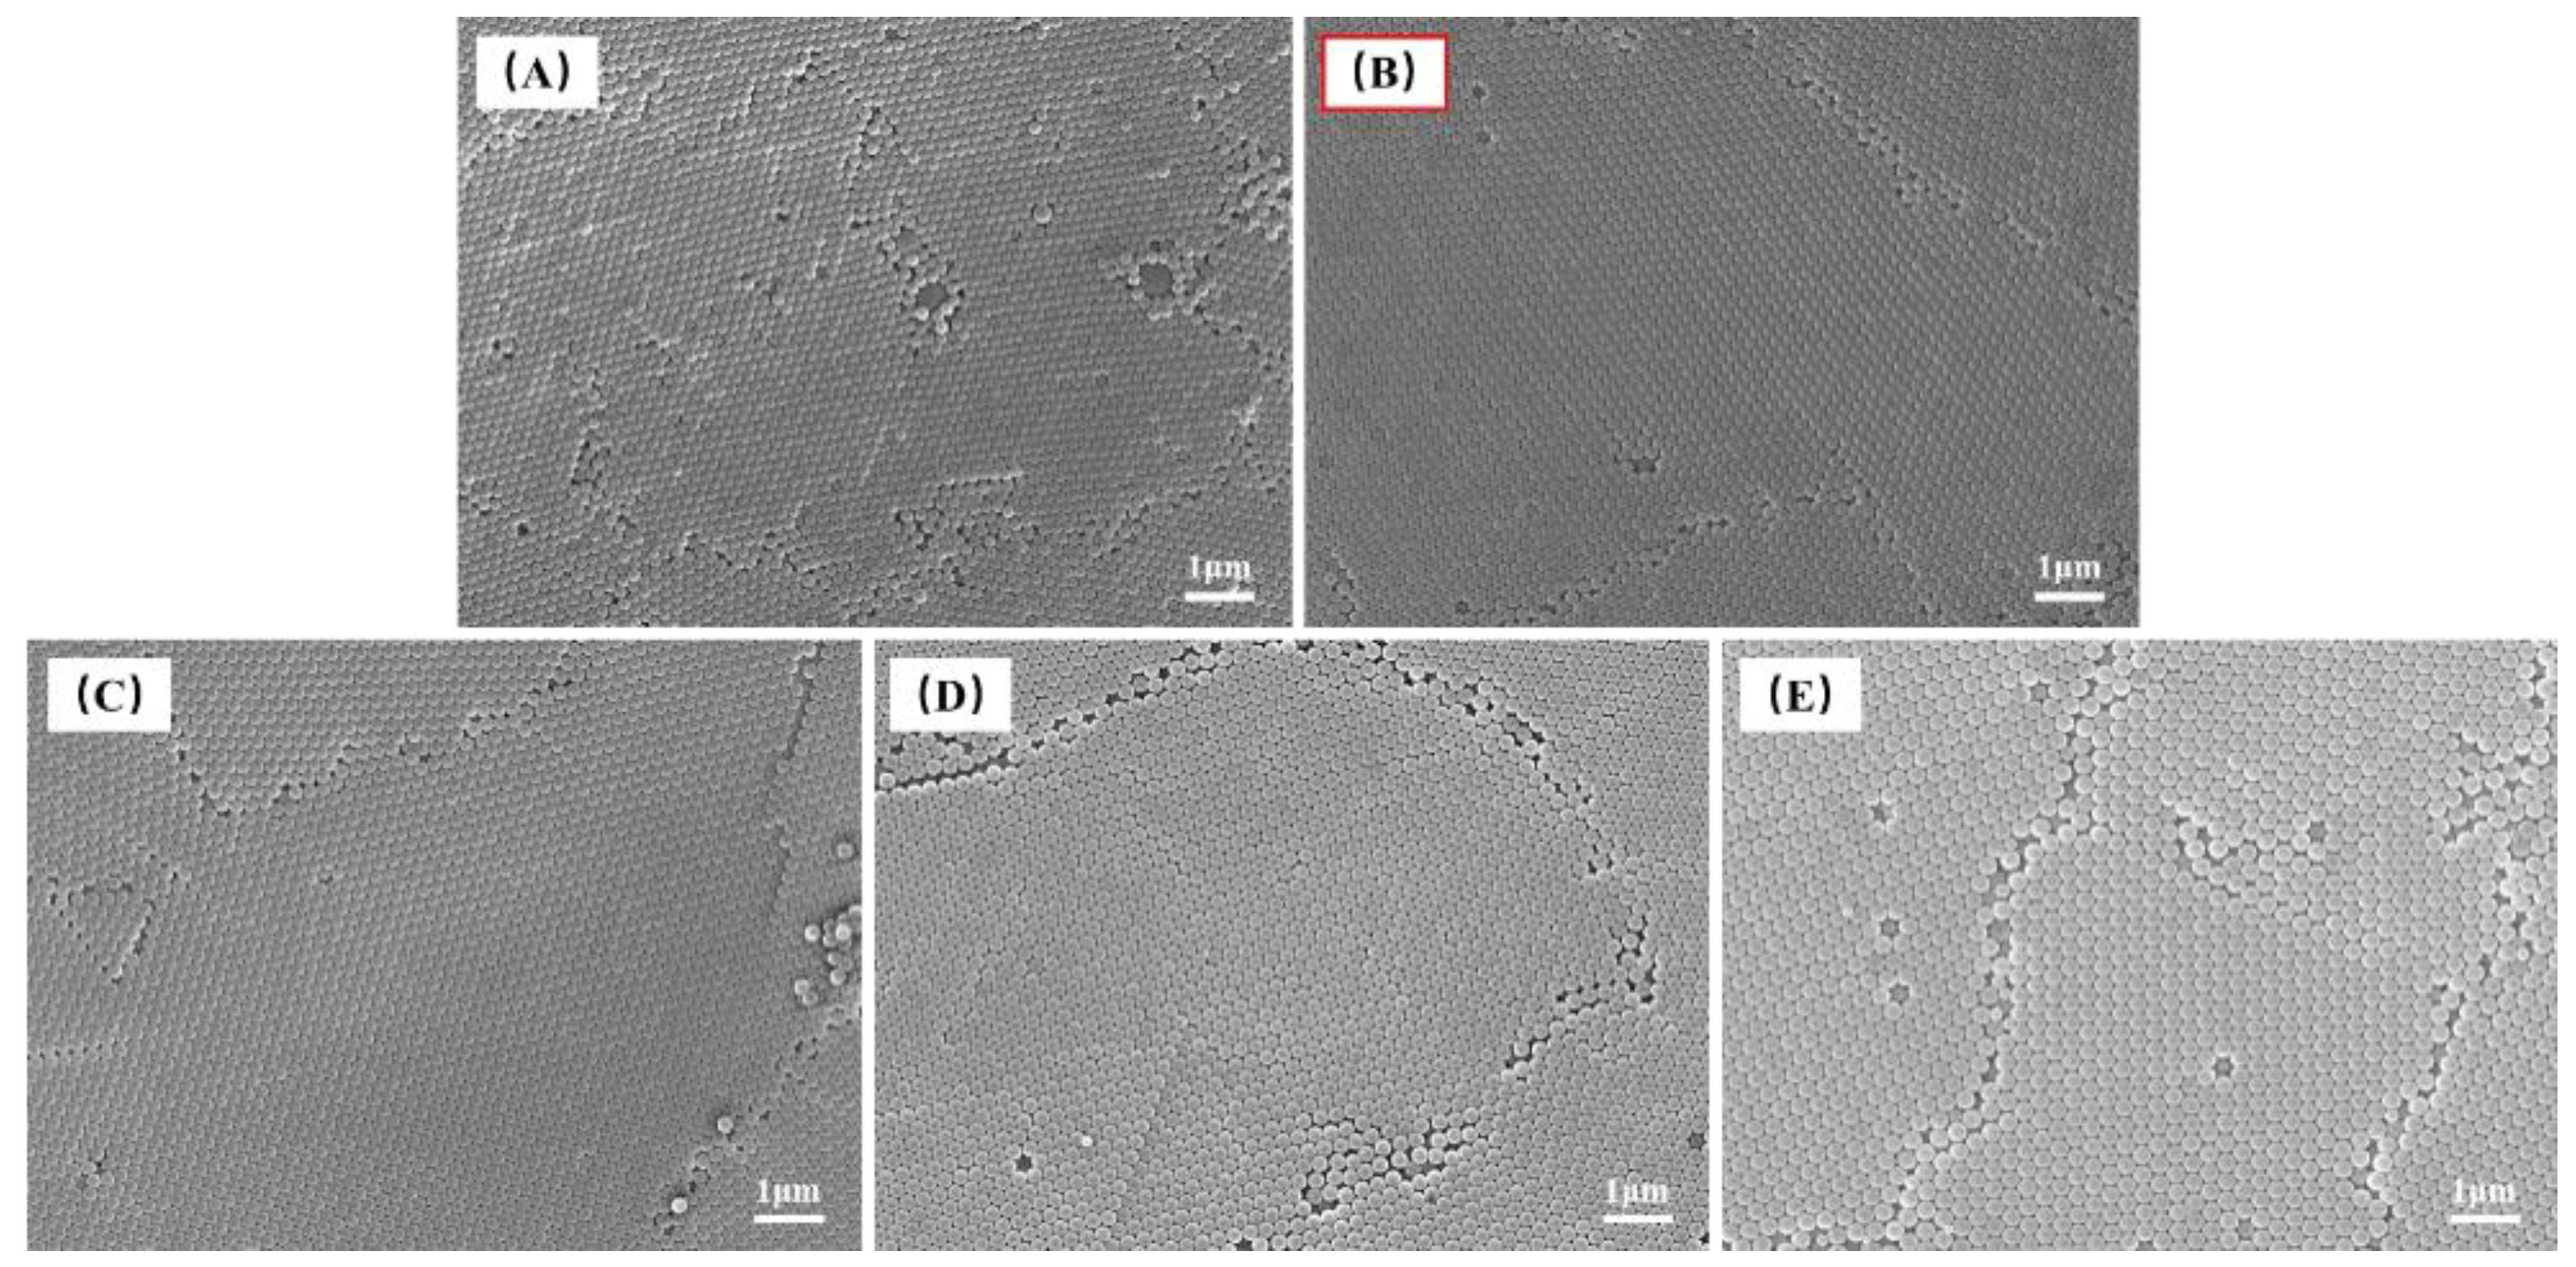
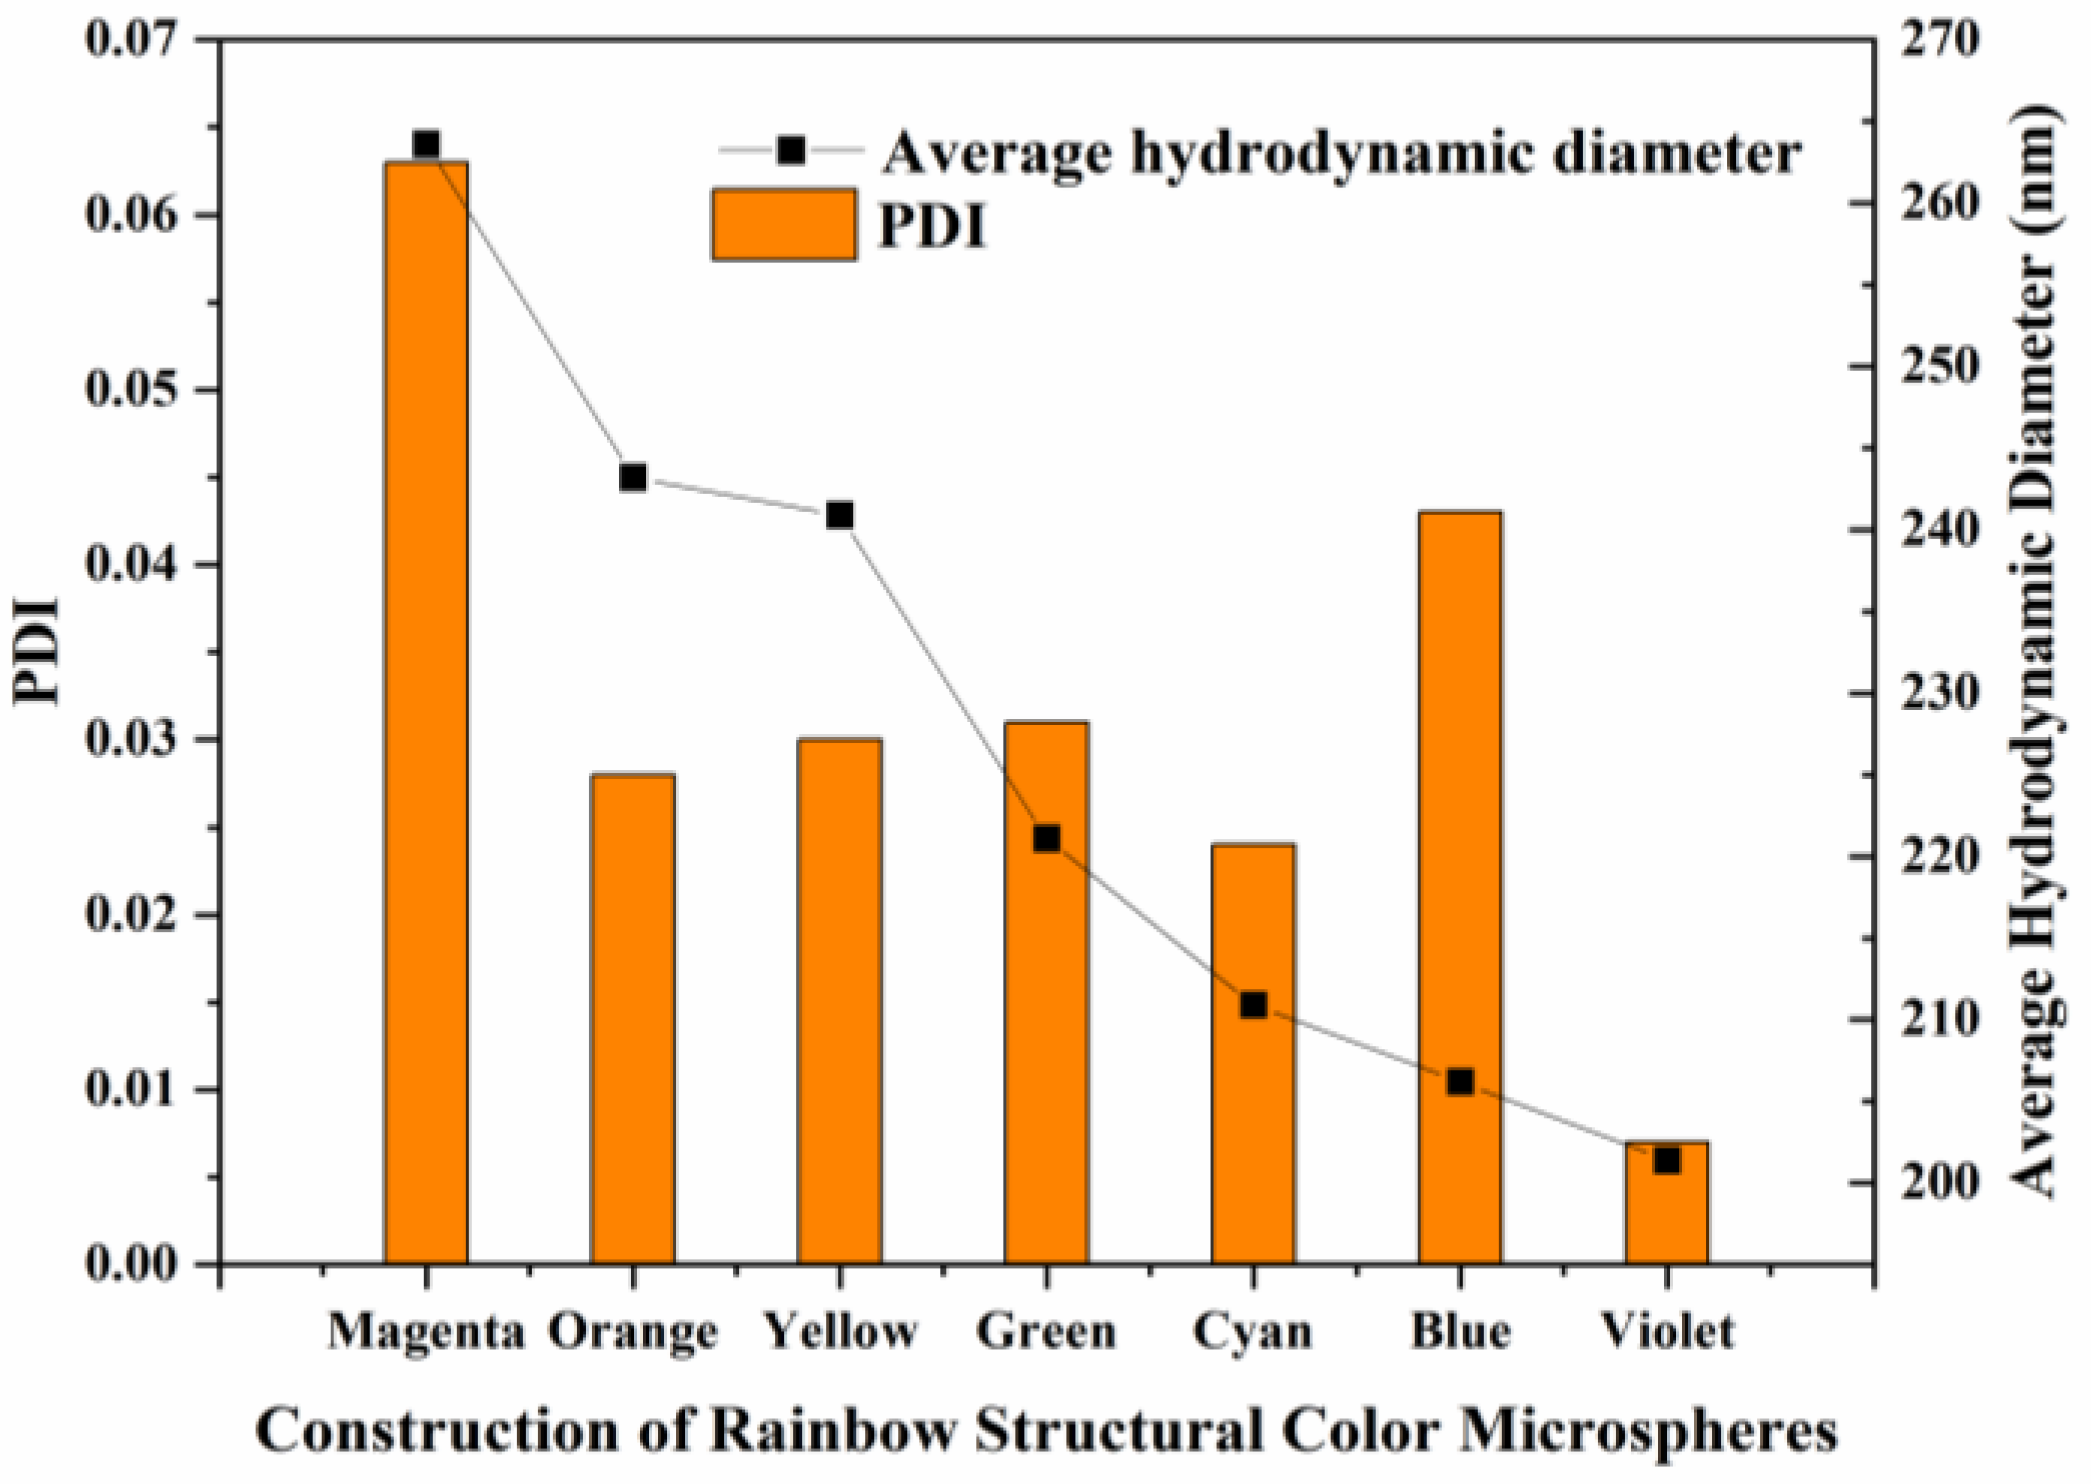
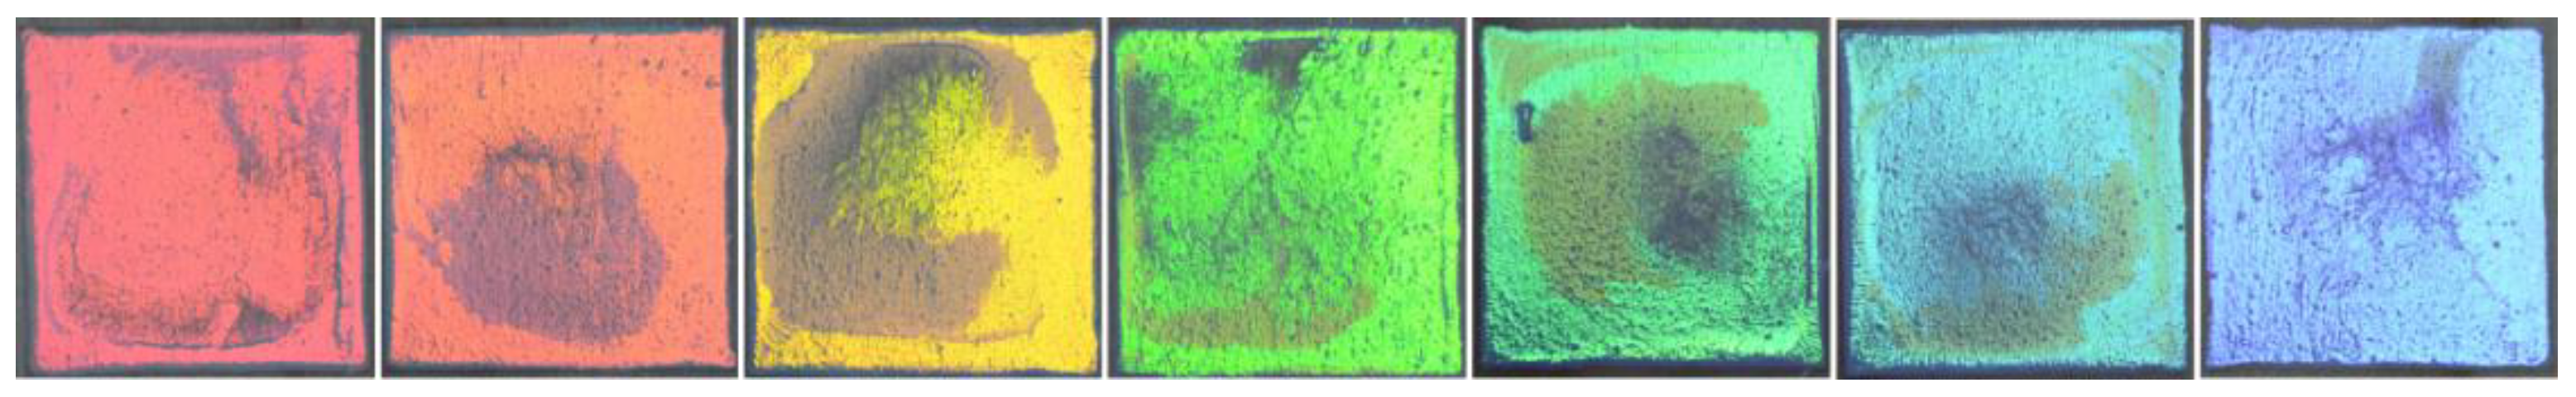
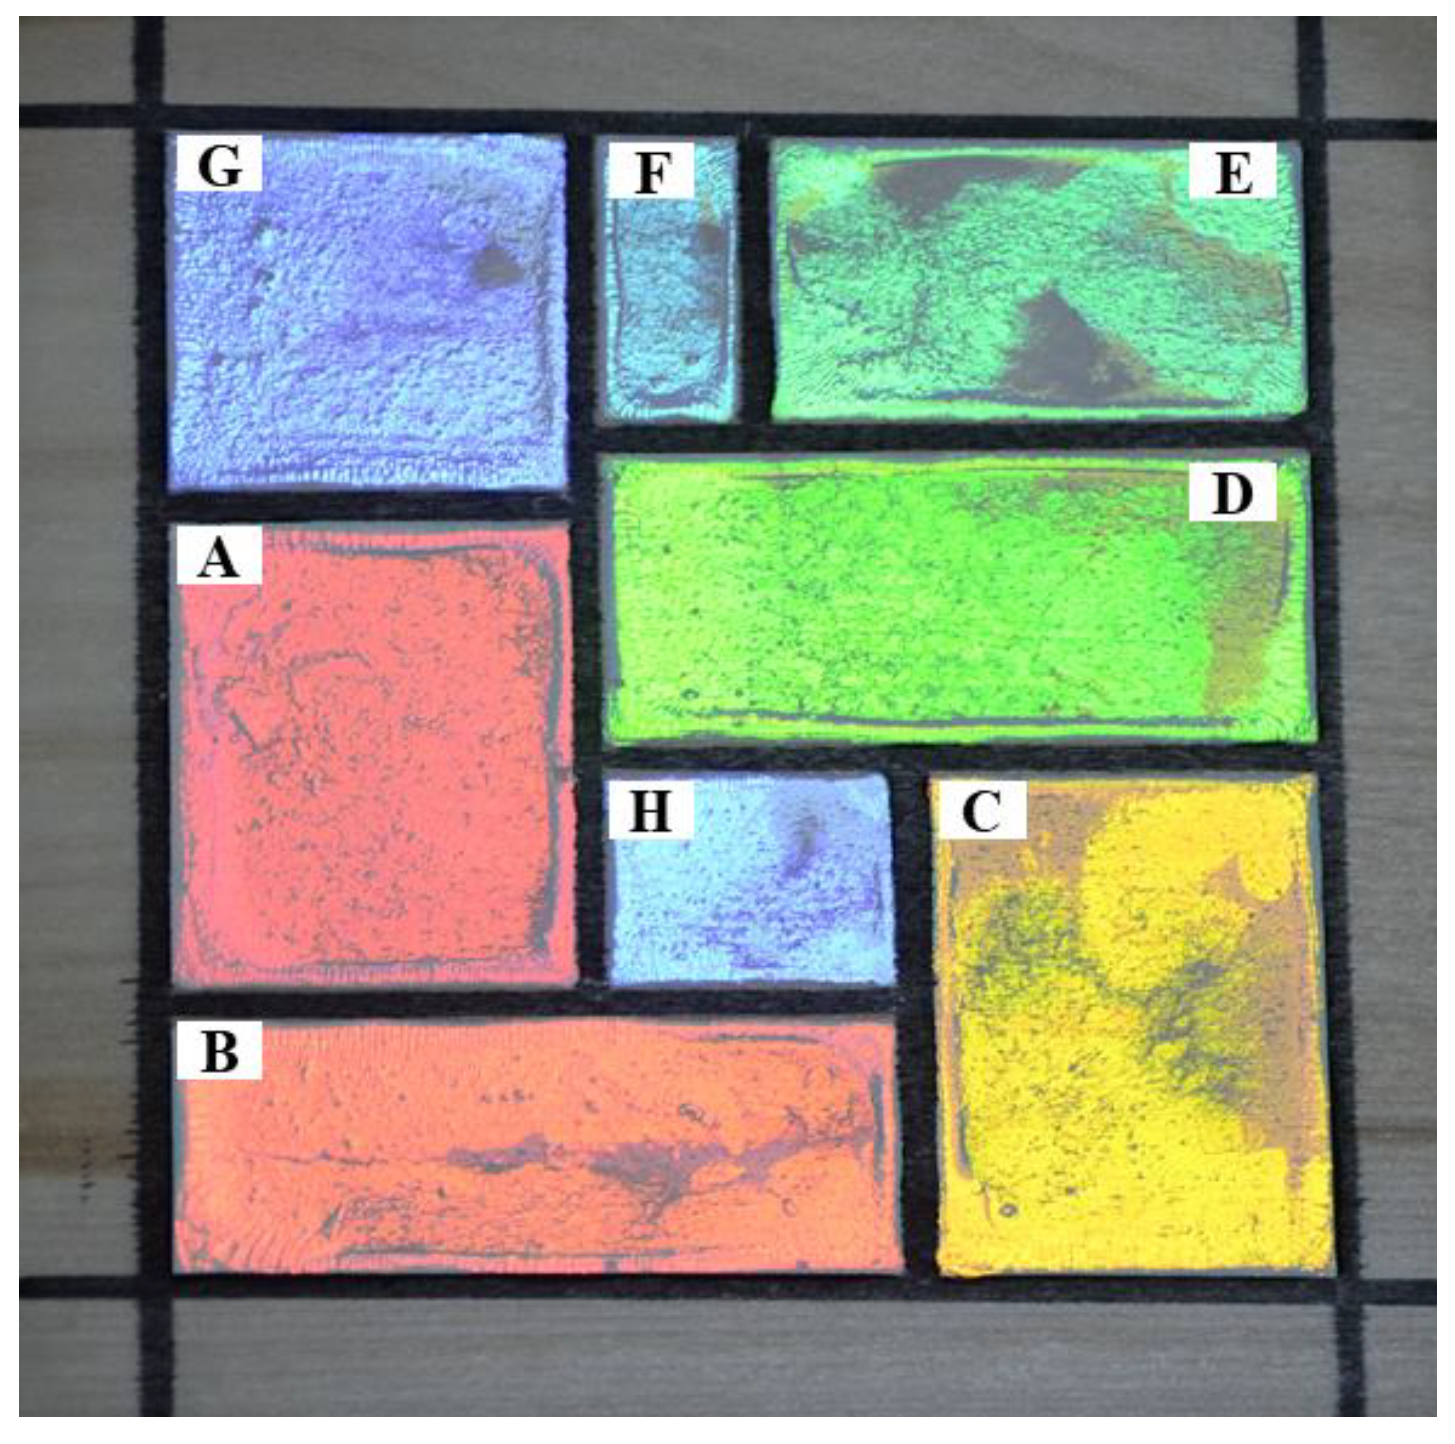
3.3. Construction and Application of Rainbow Structural Color Layer on Wood Surface

According to the Bragg diffraction equation, the effect range of three-dimensional photonic crystal structure on visible light wavelength varied with the lattice spacing of photonic crystal. The lattice spacing was directly related to the particle size of the microspheres constituting the photonic crystal structure [38]. Therefore, the diameter of microspheres directly affected the color change of the structural color coatings.
Following the single-factor experiments used in this study, it was determined that the average hydrodynamic diameter of the microspheres with good monodispersity was 201.4 nm, and the structural color coating was violet. According to the Bragg diffraction equation, to obtain other visible-light-responsive color coatings, larger PSt microspheres are required. According to the previous research results, reducing the amount of emulsifier SDBS and increasing the polymerization temperature could increase the particle size of microspheres.
Figure 13 shows the hydrodynamic diameter and PDI of the PSt microspheres used to construct rainbow structural color coatings. The hydrodynamic diameters of the microspheres were 263.6, 243.2, 240.9, 221.1, 210.9, 206.2, and 201.4 nm. By comparing the PDI of microspheres with different particle sizes, it could be found that reducing the amount of SDBS added and increasing the reaction temperature could be used to adjust the particle size of the microspheres. However, compared with the PDI of microspheres synthesized by the optimal set of experimental conditions, the PDI was improved. The PDI values of microspheres with different particle sizes in Figure 13 were less than 0.08, which indicated that they had good monodispersity and could be used to self-assemble photonic crystal structural color coatings on wood surfaces.
As shown in Figure 14, PSt microspheres with different particle sizes were used to deposit self-assembled rainbow structural color coatings on the wood surface by heat-assisted gravity deposition. Changing the average particle sizes of the self-assembled microspheres caused photonic crystals to produce band gap effects on visible light at different wavelengths, thus showing different structural colors. Compared with the photos in a previous article, the diameter of the microspheres could be changed by adjusting the SDBS amount and reaction temperature. However, the aggregation morphology and coating appearance of the microspheres on the wood surface did not change.
The photonic crystal structure formed by the self-assembly of PSt microspheres completely covered the emulsion coating area. Moreover, due to the coffee ring effect during the self-assembly of these microspheres, the surface near the edges of the structural color coatings formed was relatively flat and bright. The central position of the coatings and where the final assembly and drying were completed was slightly rough, and the color brightness was also lower. Therefore, the color of the coating was visually non-uniform.
Figure 15 shows the reflection spectra of the coatings formed on the wood surface by PSt microspheres with different particle sizes. Photonic crystal structure coatings composed of PSt microspheres with diameters of 263.6, 243.2, 240.9, 221.1, 210.9, 206.2, and 201.4 nm showed reflection peaks at 590, 580, 551, 517, 483, 461, and 441 nm, respectively. The positions of the reflection peaks of coatings of different colors corresponded to the wavelength ranges of different visible colors. Among them, the reflection peak of the violet coating had the smallest half-peak width, while the reflection peak of the cyan and blue coatings had a gentle hill shape.
In addition to the peak corresponding to a structural color, there was also a weaker peak in the reflection spectra of different coatings near 391 nm, which was the reflection peak of PSt microspheres. Moreover, upon decreasing the microsphere size and the blue shift of the coating color, the peak value gradually became less obvious, which should be caused by the superposition and influence with the photonic crystal reflection peak. The wood base material selected in this study was Populus tremulosa, and the structural color coating was constructed on the chord section of the wood. The wood had a light color, the chord section was off-white, and the core was light gray-brown, which might have affected the reflection spectra of the wood surface coatings. As we all know, the color of the substance is white, which is actually caused by its non-absorption of visible light waves. The white substrate might reduce the color concentration of the structural color of the photonic crystal coatings [39].
As shown in Figure 16, the emulsion containing PSt microspheres of different particle sizes was used to apply patterned rainbow structural color coatings on the wood surface to explore their use as wood decoration. Before coating the microsphere emulsion, a pencil was used to draw the wireframe, as in our previous study. The black lines of the two patterns on the edge of the structural color coatings were drawn with black pens after the coatings dried, mainly to make the composition more full.
The design inspiration came from the famous painting Red, Yellow, and Blue by the Dutch painter Mondrian. Color blocks A–H were magenta, orange, yellow, green, cyan, blue, violet, and violet, respectively. According to the best emulsion coating amount per unit area (40.8 × 10⁻³ mL/cm2) obtained previously, the amount of emulsion to be coated for each small piece was calculated to allow the microspheres to self-assemble on the wood surface. Finally, the coatings with colorful and rainbow-like structure colors were obtained, which had a good decorative effect on wood.

4. Conclusions

In this study, PSt microspheres with optimal monodispersity were synthesized using 175 mg SDBS as an emulsifier and a reaction temperature of 70 °C. The diameter of microspheres could be increased by reducing the amount of emulsifier SDBS or increasing the reaction temperature. Within the parameter range of this study, the optical effect of the formed coating was the best when PSt microspheres were self-assembled on the wood surface to form a structural color coating when the amount of emulsion coating was about 40.8 × 10⁻³ mL/cm2 and the self-assembly temperature was set at 50 °C. PSt microspheres with good monodispersity and different particle sizes were prepared by adjusting the amount of SDBS and reaction temperature. Rainbow-like structural color coatings were formed by self-assembly on the wood surface as a decoration.

Author Contributions

Conceptualization, Y.L., J.H., Z.W. and X.P.; methodology, Y.L., J.H., Z.W. and X.P.; data curation, Y.L.; writing—original draft preparation, Y.L. and J.H.; writing—review and editing, Y.L., J.H. and W.X.; visualization, J.H. All authors have read and agreed to the published version of the manuscript.

Funding

This work was supported by the Natural Science Foundation of the Jiangsu Higher Education Institutions of China (grant numbers 20KJB220012, Jiangsu education department), Postdoctoral research project of Zhejiang Province (271235, Zhejiang province human resources and social security department), Qing Lan Project (Jiangsu education department), the Youth Program of Science and Technology Innovation Fund of Nanjing Forestry University (grant numbers CX2019016, Nanjing Forestry University) and Scientific Research Foundation of Nanjing Forestry University (grant numbers GXL 2018022, Nanjing Forestry University).

Institutional Review Board Statement

Not applicable.

Informed Consent Statement

Not applicable.

Data Availability Statement

The raw and processed data required to reproduce these findings cannot be shared at this time as the data also forms part of an ongoing study.

Acknowledgments

The authors acknowledge the valuable support from Zhejiang Shenghuayunfeng New Material Co., Ltd.

Conflicts of Interest

The authors declare no conflict of interest.

References

  1. Bai, J.; Guan, H. Study on thermal comfort of wood tabletop materials. Wood Res. 2022, 67, 326–339. [Google Scholar]
  2. Fu, W.L.; Guan, H.Y. Numerical and theoretical analysis of the contact force of oval mortise and tenon joints concerning outdoor wooden furniture structure. Wood Sci. Technol. 2022, 56, 1205–1237. [Google Scholar] [CrossRef]
  3. Wu, X.; Zhu, J.; Wang, X. A Review on Carbon Reduction Analysis during the Design and Manufacture of Solid Wood Furniture. BioResources 2021, 16, 6212–6230. [Google Scholar] [CrossRef]
  4. Feng, X.; Yang, Z.; Wang, S.; Wu, Z. The reinforcing effect of lignin-containing cellulose nanofibrils in the methacrylate composites produced by stereolithography. Polym. Eng. Sci. 2022, 62, 2968–2976. [Google Scholar] [CrossRef]
  5. Liu, Y.; Yu, Z.; Zhang, Y.; Qi, C.; Tang, R.; Zhao, B.; Wang, H.; Han, Y. Microbial dyeing-infection behavior and influence of Lasiodiplodia theobromae in poplar veneer. Dye. Pigment. 2020, 173, 107988. [Google Scholar] [CrossRef]
  6. Sun, Y.; Wu, Y.; Yang, F.; Wu, X.; Ding, G. A novel waterborne polyurethane coating modified by highly dispersed nano-boron carbide particles. J. Appl. Polym. Sci. 2020, 138, 50214. [Google Scholar] [CrossRef]
  7. Qin, Y.; Yan, X. Effect of the addition of shellac self-healing and discoloration microcapsules on the performance of coatings applied on ebiara solid board. Coatings 2022, 12, 1627. [Google Scholar] [CrossRef]
  8. Wang, L.; Han, Y.; Yan, X. Effects of adding methods of fluorane microcapsules and shellac resin microcapsules on the preparation and properties of bifunctional waterborne coatings for basswood. Polymers 2022, 14, 3919. [Google Scholar] [CrossRef]
  9. He, R.; Qiu, J.; He, H.; Luo, B. Research status and progress trend of wood fungal staining. J. For. Eng. 2019, 4, 19–24. [Google Scholar]
  10. Cai, C.; Haapala, A.; Rahman, M.H.; Tiitta, M.; Tiitta, V.; Tomppo, L.; Lappalainen, R.; Heräjärvi, H. Effects of two-year weather exposure on thermally modified Picea abies, Pinus sylvestris, and Fraxinus excelsior wood. Can. J. For. Res. 2020, 50, 1160–1171. [Google Scholar] [CrossRef]
  11. Zhou, Y.; Wang, J.; Li, C. Studies on the lightfastness of dyed veneer of I-214 poplar. Sci. Silvae Sin. 2006, 42, 29–34. [Google Scholar]
  12. Liu, Y.; Shao, L.; Gao, J.; Guo, H.; Chen, Y.; Cheng, Q.; Via, B.K. Surface photo-discoloration and degradation of dyed wood veneer exposed to different wavelengths of artificial light. Appl. Surf. Sci. 2015, 331, 353–361. [Google Scholar] [CrossRef]
  13. Kinshita, S.; Yoshioka, S.; Miyazaki, J. Physics of structural colors. Rep. Prog. Phys. 2008, 71, 076401. [Google Scholar] [CrossRef]
  14. Zeng, Q.; Li, Q.S.; Yuan, W.; Zhou, N.; Zhang, K.Q. The mechanism and its application of amorphous photonic crystals with structural color. Mat. Rev. 2017, 1, 43–56. [Google Scholar]
  15. Prum, R.O.; Cole, J.A.; Torres, R.H. Blue integumentary structural colours in dragonflies (Odonata) are not produced by incoherent Tyndall scattering. J. Exp. Biol. 2004, 207, 3999–4009. [Google Scholar] [CrossRef] [PubMed] [Green Version]
  16. Lopez-Garcia, M.; Masters, N.; O’brien, H.E.; Lennon, J.; Atkinson, G.; Cryan, M.J.; Oulton, R.; Whitney, H.M. Light-induced dynamic structural color by intracellular 3D photonic crystals in brown algae. Sci. Adv. 2018, 4, eaan8917. [Google Scholar] [CrossRef] [Green Version]
  17. Cong, H.; Yu, B.; Tang, J.; Li, Z.; Liu, X. Current status and future developments in preparation and application of colloidal crystals. Chem. Soc. Rev. 2013, 42, 7774–7800. [Google Scholar] [CrossRef]
  18. Ge, J.; Lee, H.; He, L.; Kim, J.; Lu, Z.; Kim, H.; Goebl, J.; Kwon, S.; Yin, Y. Magnetochromatic microspheres: Rotating photonic crystals. J. Am. Chem. Soc. 2009, 131, 15687–15694. [Google Scholar] [CrossRef]
  19. Gu, M.; Jia, B.; Li, J.; Ventura, M.J. Fabrication of three-dimensional photonic crystals in quantum-dot-based materials. Laser Photonics Rev. 2010, 4, 414–431. [Google Scholar] [CrossRef]
  20. Braun, P.V.; Rinne, S.A.; García-Santamaría, F. Introducing defects in 3D photonic crystals: State of the art. Adv. Mater. 2006, 18, 2665–2678. [Google Scholar] [CrossRef]
  21. Jiang, Q.; Zhong, J.; Hu, X.; Song, F.; Ren, K.; Wei, H. Fabrication and optical properties of silica shell photonic crystals. Colloid Surf. A 2012, 415, 202–208. [Google Scholar] [CrossRef]
  22. Starczewska, A.; Kępińska, M.; Szperlich, P.; Duka, P.; Nowak, M. Influence of temperature on optical spectra of SbSI photonic crystals. Opt. Mater. 2020, 100, 109606. [Google Scholar] [CrossRef]
  23. You, B.; Wen, N.; Shi, L.; Wu, L.; Zi, J. Facile fabrication of a three-dimensional colloidal crystal film with large-area and robust mechanical properties. J. Mater. Chem. 2009, 19, 3594–3597. [Google Scholar] [CrossRef]
  24. Zhang, S.; Chen, J.; Taha, M. Synthesis of monodisperse styrene/methyl methacrylate/acrylic acid latex using surfactant-free emulsion copolymerization in air. J. Appl. Polym. Sci. 2009, 114, 1598–1605. [Google Scholar] [CrossRef]
  25. Meng, Y.; Tang, B.; Xiu, J.; Zheng, X.; Ma, W.; Ju, B.; Zhang, S. Simple fabrication of colloidal crystal structural color films with good mechanical stability and high hydrophobicity. Dye. Pigment. 2015, 123, 420–426. [Google Scholar] [CrossRef]
  26. Imura, Y.; Nakazawa, H.; Matsushita, E.; Morita, C.; Kondo, T.; Kawai, T. Characterization of colloidal crystal film of polystyrene particles at the air-suspension interface. J. Colloid Interface Sci. 2009, 336, 607–611. [Google Scholar] [CrossRef]
  27. Kawamura, A.; Kohri, M.; Morimoto, G.; Nannichi, Y.; Taniguchi, T.; Kishikawa, K. Full-color biomimetic photonic materials with iridescent and non-Iridescent structural colors. Sci. Rep. 2016, 6, 33984. [Google Scholar] [CrossRef]
  28. Lichti, G.; Hawkett, B.S.; Gilbert, R.G.; Napper, D.H.; Sangster, D.F. Styrene emulsion polymerization: Particle-size distributions. J. Polym. Sci. Polym. Chem. Ed. 1981, 19, 925–938. [Google Scholar] [CrossRef]
  29. Joumaa, N.; Lansalot, M.; Théretz, A.; Elaissari, A.; Sukhanova, A.; Artemyev, M.; Nabiev, I.; Cohen, J.H.M. Synthesis of quantum dot-tagged submicrometer polystyrene particles by miniemulsion polymerization. Langmuir 2014, 22, 1810–1816. [Google Scholar] [CrossRef] [PubMed]
  30. Chern, C.S. Emulsion polymerization mechanisms and kinetics. Prog. Polym. Sci. 2006, 31, 443–486. [Google Scholar] [CrossRef]
  31. Shen, Z.; Yang, Y.; Lu, F.; Bao, B.; You, B. Self-assembly of binary particles and application as structural colors. Polym. Chem. 2012, 3, 2495–2501. [Google Scholar] [CrossRef]
  32. Hu, J.; Liu, Y.; Wu, Z.; Pang, X. Construction of bionic structural color coating on wood surface based on polystyrene microspheres. J. For. Eng. 2021, 6, 35–42. [Google Scholar]
  33. Waterhouse, G.I.N.; Waterland, M.R. Opal and inverse opal photonic crystals: Fabrication and characterization. Polyhedron 2007, 26, 356–368. [Google Scholar] [CrossRef]
  34. Jiang, P.; Bertone, J.F.; Hwang, K.S.; Colvin, V.L. Single-crystal colloidal multilayers of controlled thickness. Chem. Mater. 1999, 11, 2132–2140. [Google Scholar] [CrossRef]
  35. Li, J.F.; Wang, J.; Wang, X.T.; Wang, X.G.; Li, Y.; Wang, C.W. Bandgap engineering of TiO2 nanotube photonic crystals for enhancement of photocatalytic capability. CrystEngComm 2020, 22, 1929–1938. [Google Scholar] [CrossRef]
  36. Xie, J.; Duan, M.; Bai, P.; Wang, H. Gas adsorption behavior of silica photonic crystals with different size of initial particles. J. Ceram. Soc. Jpn. 2020, 128, 19–23. [Google Scholar] [CrossRef] [Green Version]
  37. Sapour, G.; Lattuana, M. Bioinspired stimuli-responsive color-changing systems. Adv. Mater. 2018, 30, 1707069. [Google Scholar] [CrossRef]
  38. Liu, Y.; Hu, J.; Wu, Z. Fabrication of coatings with structural color on a wood surface. Coatings 2020, 10, 32. [Google Scholar] [CrossRef] [Green Version]
  39. Liu, G.; Zhou, L.; Wu, Y.; Wang, C.; Fan, Q.; Shao, J. Optical properties of three-dimensional P(St-MAA) photonic crystals on polyester fabrics. Opt. Mater. 2015, 42, 72–79. [Google Scholar] [CrossRef]
Figure 1. DLS characterization of the particle size of PSt microspheres synthesized with different amounts of SDBS.
Forests 14 00076 g001
Figure 2. FE-SEM images of PSt colloidal microspheres synthesized with the following amount of SDBS added: (A) 125 mg; (B) 150 mg; (C) 175 mg; (D) 200 mg; (E) 225 mg.
Forests 14 00076 g002
Figure 3. FE-SEM images were manually measured to characterize the average particle size of PSt microspheres synthesized with different amounts of SDBS.
Forests 14 00076 g003
Figure 4. Photos of dried test samples of PSt microspheres synthesized with different amounts of SDBS added: (A) 125 mg; (B) 150 mg; (C) 175 mg; (D) 200 mg; (E) 225 mg.
Forests 14 00076 g004
Figure 5. DLS characterization of PSt microspheres synthesized with different reaction temperatures.
Forests 14 00076 g005
Figure 6. FE-SEM images of PSt colloidal microspheres synthesized with different reaction temperature: (A) 65 °C; (B) 70 °C; (C) 75 °C (D) 80 °C; (E) 85 °C.
Forests 14 00076 g006
Figure 7. FE-SEM images were manually measured to characterize the average particle size of PSt microspheres synthesized at different temperatures.
Forests 14 00076 g007
Figure 8. Photos of dried test samples of PSt microspheres synthesized with different reaction temperature: (A) 65 °C; (B) 70 °C; (C) 75 °C; (D) 80 °C; (E) 85 °C.
Forests 14 00076 g008
Figure 9. Photos of coatings formed by PSt emulsion with different amounts on a 35 mm × 35 mm wood surface: (A) 100 μL; (B) 200 μL; (C) 300 μL; (D) 400 μL; (E) 500 μL; (F) 600 μL; (G) 700 μL; (H) 800 μL.
Forests 14 00076 g009
Figure 10. Reflection spectra of coatings formed by PSt emulsions with different amounts on a 35 mm × 35 mm wood surface.
Forests 14 00076 g010
Figure 11. Photos of coatings formed by the self-assembly of PSt microspheres at different temperatures: (A) 10 °C; (B) 20 °C; (C) 30 °C; (D) 40 °C; (E) 50 °C; (F) 60 °C; (G) 70 °C; (H) 80 °C; (I) 90 °C; (J) 100 °C.
Forests 14 00076 g011
Figure 12. Reflection spectra of coatings formed by the self-assembly of PSt microspheres at different temperatures.
Forests 14 00076 g012
Figure 13. DLS characterization of PSt microspheres for rainbow structural color coatings.
Forests 14 00076 g013
Figure 14. Photos of PSt microspheres self-assembled into coatings on wood surfaces.
Forests 14 00076 g014
Figure 15. Reflection spectra of PSt microspheres self-assembled into coatings with different structural colors.
Forests 14 00076 g015
Figure 16. Patterned application of self-assembled rainbow structural color coatings on a wood surface by PSt microspheres: (A) magenta; (B) orange; (C) yellow; (D) green; (E) cyan; (F) blue; (G) violet; (H) violet.
Forests 14 00076 g016
Table 1. Variable table for the single-factor experiment of PSt microspheres self-assembly on a wood surface.
Amount of Emulsion (μL)Temperature (°C)
100, 200, 300, 400, 500, 600, 700, 80050
50010, 20, 30, 40, 50, 60, 70, 80, 90, 100
Disclaimer/Publisher’s Note: The statements, opinions and data contained in all publications are solely those of the individual author(s) and contributor(s) and not of MDPI and/or the editor(s). MDPI and/or the editor(s) disclaim responsibility for any injury to people or property resulting from any ideas, methods, instructions or products referred to in the content.

