Article

Prediction of Native Seed Habitat Distribution According to SSP Scenario and Seed Transfer Zones: A Focus on Acer pictum subsp. mono and Quercus acuta

1
Department of Environmental Horticulture and Landscape Architecture, Dankook University, Cheonan 31116, Republic of Korea
2
Integrated Watershed Management Institute (IWMI), Seoul 04540, Republic of Korea
3
Department of Environment & Forest Resources, Chungnam National University, Daejeon 34134, Republic of Korea
*
Author to whom correspondence should be addressed.
Forests 2023, 14(1), 87; https://doi.org/10.3390/f14010087
Submission received: 6 December 2022 / Revised: 22 December 2022 / Accepted: 28 December 2022 / Published: 3 January 2023
(This article belongs to the Section Forest Ecology and Management)

Abstract

:
Acer pictum and Quercus acuta are native species recommended for restoration. To restore ecosystem functions and maintain natural ecosystems, it is suggested to deploy well-adapted and locally adapted plant material, and this notion is gaining interest. Studying how species change in response to climate change is an important part of forest restoration planning. Our method uses climate data to define the habitat range of species and to identify regions with relatively similar climates through Seed Transfer Zones (STZs). Potential habitat suitability changes of A. pictum and Q. acuta were identified under various environmental scenarios using seven climatic factors and five topographical factors. The MaxEnt algorithm was used to predict potential habitat suitability in current and future (1980–2100) climate change scenarios (SSP1-2.6, SSP2-4.5, SSP3-7.0, SSP5-8.5). STZs are maps of areas with comparable climates and have been used to determine the climates of potentially habitable areas. This helps to minimize the maladaptation of seed movement within the same area. As a result, A. pictum growth increased along the southern coastal area and drainage was the paramount factor influencing A. pictum distribution. By checking the climate of regions with high habitability in STZs (Winter Minimum Temperature (WMT) 15–20 °F, Annual Heat: Moisture (AHM) 16–19 °C/m zone, WMT 20–25 °F, AHM 16–19 °C/m located in the zone), Q. acuta was shown to move northward with climate change centering on the southern coastal area. Additionally, Annual Precipitation (Bio12) was the most significant factor influencing Q. acuta distribution. In confirming the climate of areas with high habitability in STZs, we verified that habitat density was high in the WMT 10–15 °F, AHM 19–21 °C/m zone and WMT 20–25 °F, AHM 19–21 °C/m zone. This study establishes that the potential distributions of A. pictum and Q. acuta are affected by climate change. It supplies evidence for ecological restoration and sustainable development, and can formulate future conservation and management plans for economically valuable species.

1. Introduction

Over the past two centuries, the increasing human impact on the global ecosystem has damaged the forest ecosystem, and during the first 20 years of the 21st century (2001–2020), the Earth’s surface temperature increased by 0.99 °C compared to 1850–1990 [1,2]. Such climate change is predicted to increase biodiversity loss and climate vulnerability by changing the plant habitat environment and increasing the introduction and settlement of alien plants [3,4,5]. The National Institute of Meteorological Sciences (NIMS) has calculated the Shared Socioeconomic Pathway (SSP), a new national climate change standard scenario, in the IPCC 6th Assessment Report, to respond to accelerated climate change and support domestic climate change policies and provide it to domestic and foreign researchers [6,7,8,9,10]. The SSP scenario is a newly introduced concept in IPCC AR6 and consists of five groups according to mitigation and efforts for climate change based on socioeconomic change [11].
Analyzing the factors affecting the vegetation distribution of climate change and predicting the geographical distribution of suitable vegetation habitats is important for protecting native seeds and reducing the vulnerability of seed adaptation. The Species Distribution Model (SDM) is a modeling technique that started when the BIOCLIM program was started in Australia in 1984 [12]. It can predict the distribution and suitability of habitats in an ecosystem, so it is used for biodiversity assessment, habitat management and restoration, and natural resource management [13,14]. Among the SDMs, MaxEnt is a regression model that predicts habitat by estimating a value that can maximize the entropy of a species. It can be predicted even with a small number of samples [15,16]. In addition, MaxEnt requires only distribution data and environmental factor data and exhibits the highest prediction accuracy for species distribution, so it has been shown to be widely used for the protection of endogenous species and ecosystem restoration [17,18,19]. Kwon et al. (2012) produced a probability distribution map for tree species native to the southern region of South Korea [20]. Yu et al. (2020) confirmed the characteristics of climate indicators in the habitat through the prediction of changes in the habitat due to climate change [21].
BIOCLM data are used not only for species distribution modeling but also for establishing Seed Transfer Zones (STZs) that can minimize seed maladaptation for effective ecological restoration of forest ecosystems [22,23]. The STZs started with the use of climate and topographic factors to respond to the failure of the US Forest Service to secure and restore planted land in the 1930s, indicating a relatively similar climate zone within the STZs and providing guidelines for seed movement guidelines. It has a role to play [24,25]. Bower et al. (2014) used climate data (temperature and precipitation) to build a map depicting the area where native seeds can adapt, providing data to confirm the habitat area for plants without genetic information [26]. Doherty et al. (2017) established priority areas for restoration using Bower’s provisional seed zones [27]. However, studies using STZs are lacking in South Korea. There may be uncertainties as the foreign methodology was temporarily applied to South Korea, but efforts to produce STZs continue in the Korea Forest Service. Therefore, it is thought that research using STZs can serve as basic data for constructing STZs suitable for South Korea.
SSP scenarios, MaxEnt, and STZs are being actively studied individually, but no research using them together has been conducted. Using MaxEnt, it is possible to confirm changes in the distribution of habitats according to future climate, and through an intersection with STZs, it is possible to confirm the climate characteristics of areas with a high possibility of habitation of target species without genetic data. This methodology is applied to South Korea to identify the growth characteristics of trees native to the southern region of South Korea, and to identify trends in habitat change and areas with high habitat density due to climate change. The results of this study can confirm the impact of climate change on the habitat, and it is thought that it can be used as basic data for how to use native plants during forest restoration. Therefore, this study aims to model the habitat distribution change of A. pictum and Q. acuta according to climate change in South Korea. To this end, the present and future distribution models of the target species are predicted using future climate scenarios and species distribution models, and the climatic zones of regions with high native seed population density are identified in connection with the STZs.

2. Materials and Methods

2.1. A. pictum and Q. acuta

A. pictum is a deciduous broad-leaved tree with a height of 10–30 m, belonging to the genus Aceraceae, distributed throughout China, Japan, and Manchuria, including Korea [28]. It grows mainly at an altitude of 100–1800 m above sea level [29] and is mainly distributed in valleys and northwestern slopes with relatively good moisture conditions [30]. A. pictum is used for furniture, musical instruments, and building materials due to its hard wood material, and its preservation value is very high, as 97% of the tree sap is used for domestic health drinks [31]. In addition, A. pictum is a species that is difficult to collect due to the insect breeding method of heterodichogamy and the number of true seeds due to the seed damage of Bradybatus sharpi and prey by wild animals even after falling; the natural group is gradually disappearing [32].
Q. acuta is an evergreen broad-leaved tree with a height of 20 m belonging to the genus Oak, distributed in far east Russia, Japan, and Taiwan, including Korea [33]. It is distributed mainly on the island coast and southern regions of Korea and is known as a relatively strong hardy tolerant species among temperate evergreen broadleaf species [34,35,36,37,38]. The wood has a beautiful red color and good preservation, so it has been used for agricultural equipment, ship materials, and construction materials [39,40,41]. Q. acuta is a representative species of temperate evergreen broadleaf trees and is an important species for the conservation of evergreen broadleaf forests because it can grow wild up to the highest latitude in the north of the temperate forest due to climate warming [42,43].

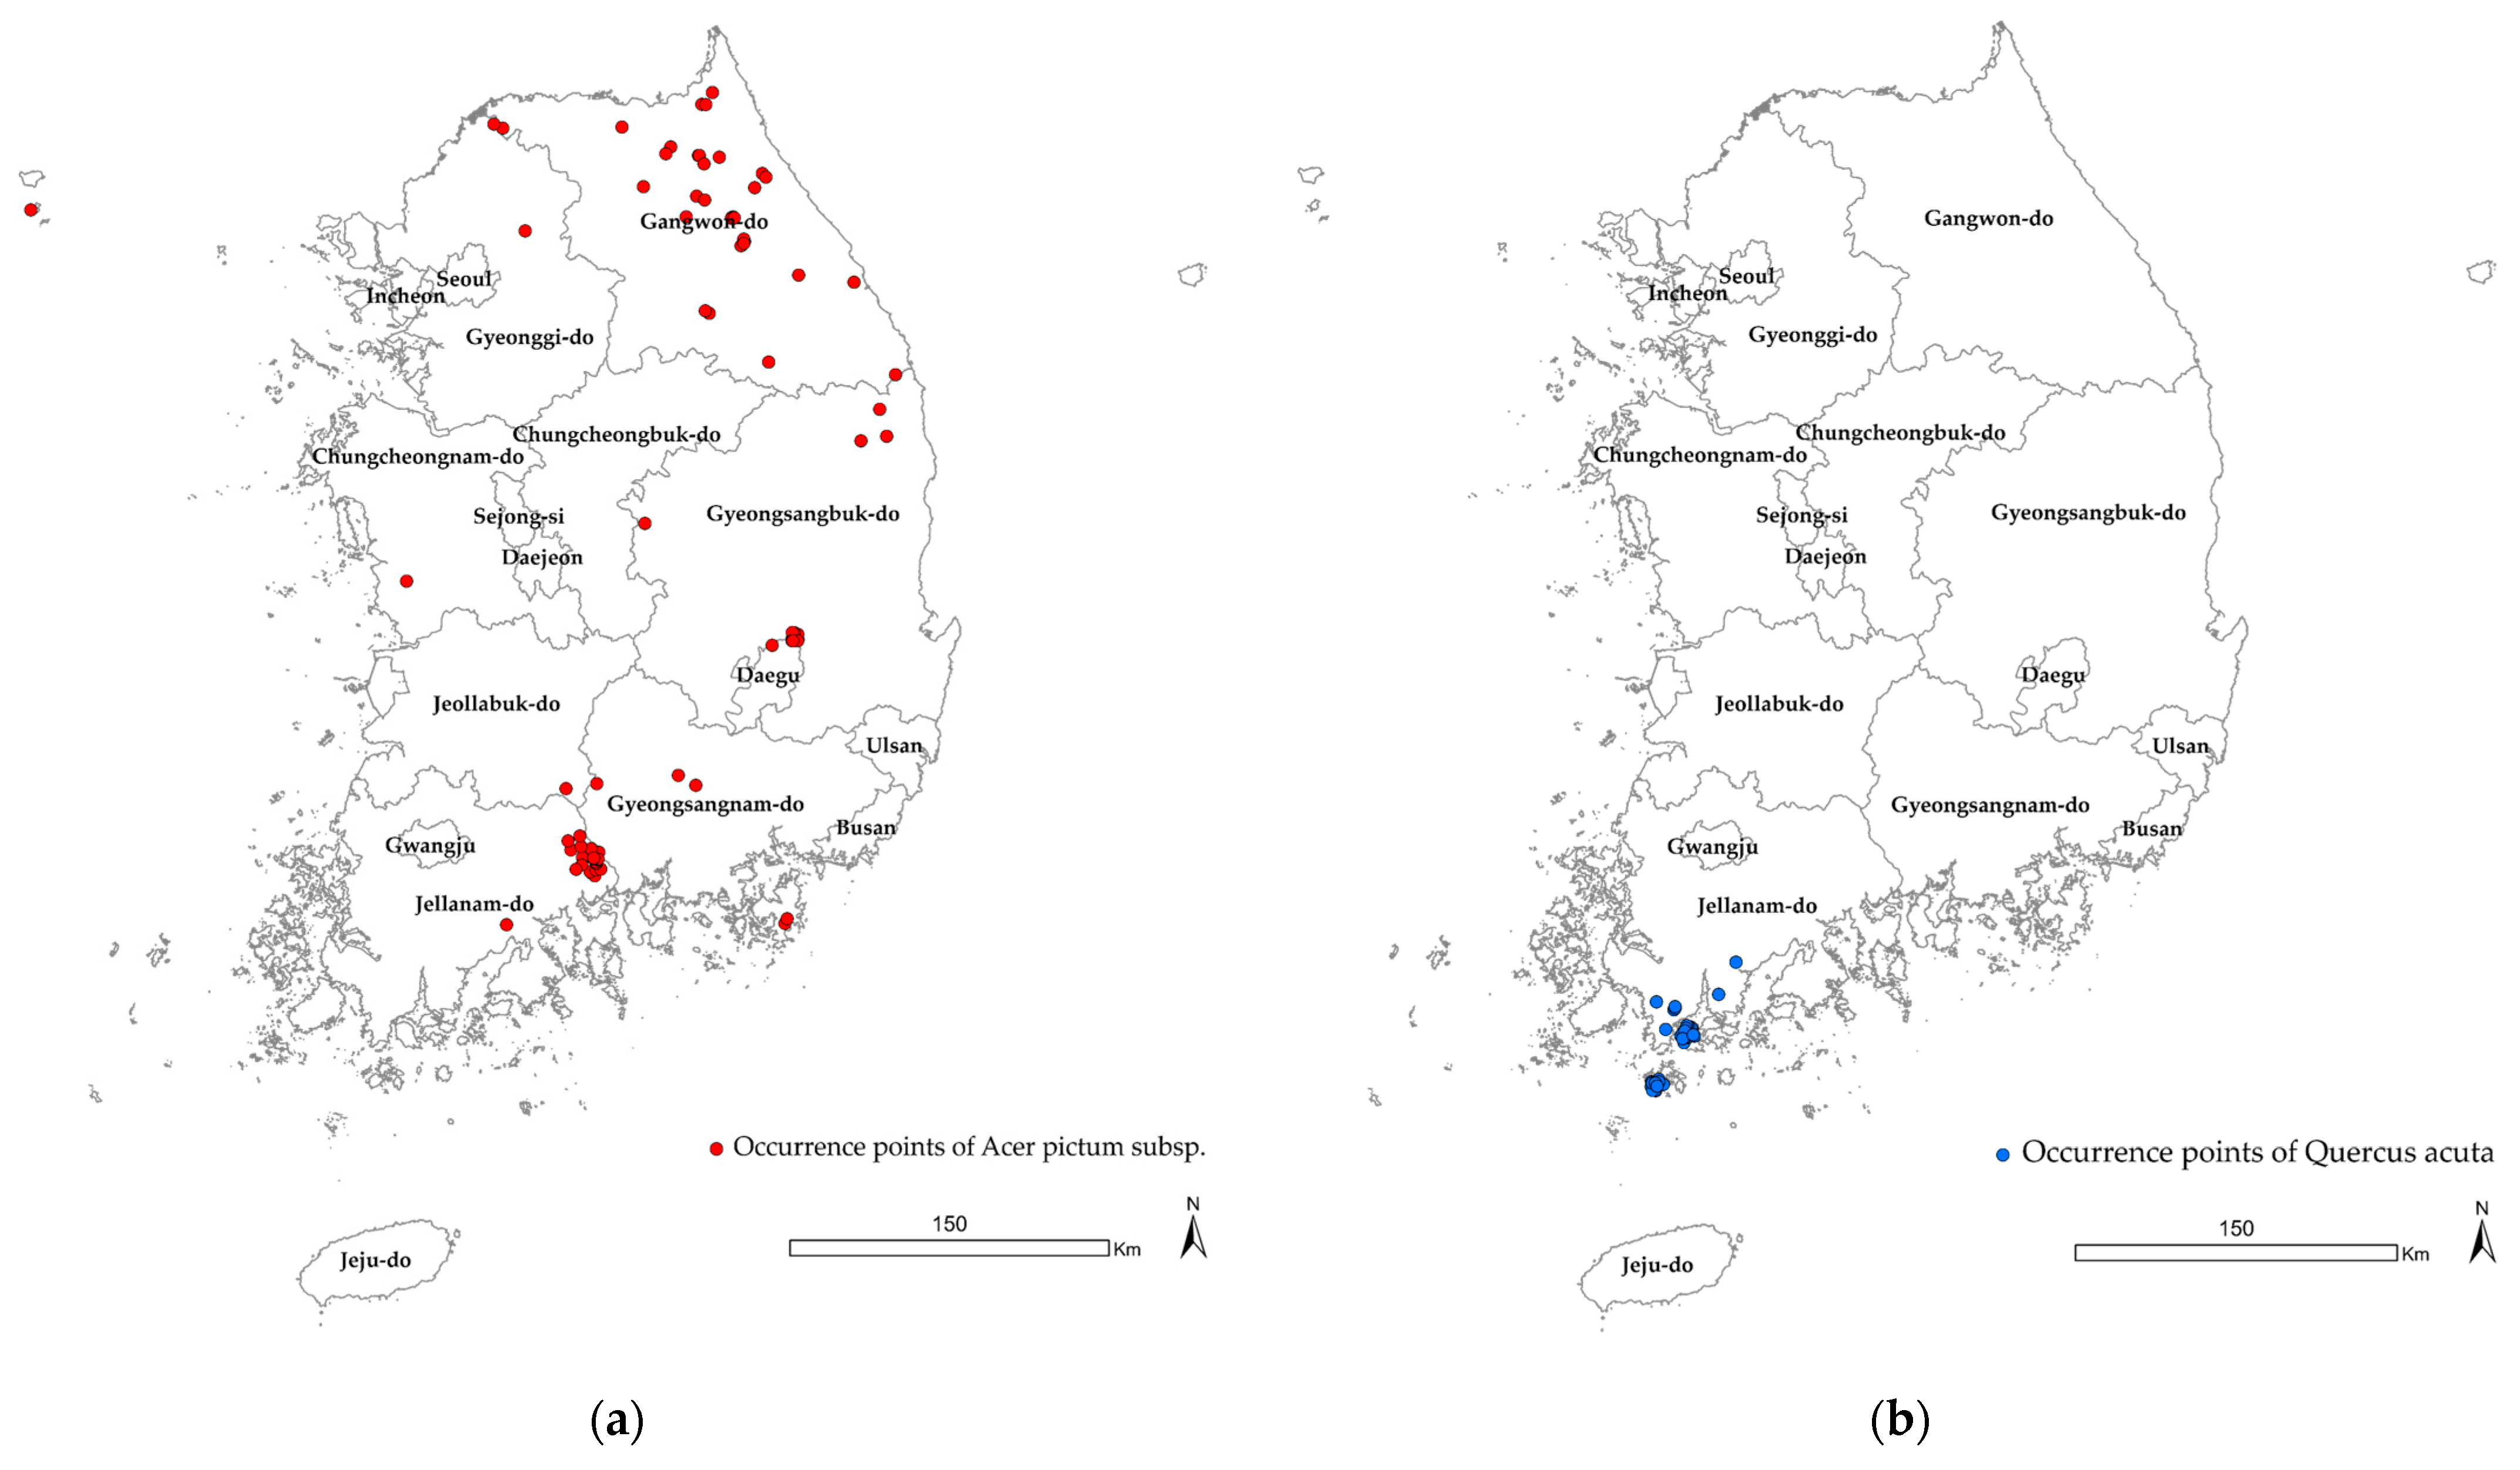
2.2. Species Occurrence Data

The data of the 4th National Ecosystem Survey (2014–2018) and the 5th National Ecosystem Survey (2019–2023) in which location information was collected were used for species data. In South Korea, a National Ecosystem Survey has been conducted fince 1986 to identify the habitats of species centered on the Ministry of Environment and the National Institute of Ecology. This is a standardized survey method in accordance with the National Ecosystem Survey guidelines, and surveys on various taxa (plants, vegetation, mammals, birds, amphibians/reptiles, terrestrial insects, fish) are conducted throughout Korea, so South Korea is targeted. In this study, the species emergence point of the National Ecosystem Survey is worth using as the most suitable data for predicting the distribution of living organisms on a national basis. Since the corresponding data are constructed with point data, including longitude and latitude, it is thought to be suitable for producing spatial data. Therefore, the species distribution is predicted based on the appearance data of the National Ecosystem Survey. It is worth using as the most appropriate resource for the 4th National Ecosystem Survey completed a nationwide survey, and the 5th National Ecosystem Survey is scheduled to be completed in 2023 and is currently being conducted. It is divided into central regions and partly surveyed every year. The 5th National Ecosystem Survey was collected from northern Gyeonggi and northern Gangwon by 2020, and a survey of 31% of the country was completed. A. pictum appearance data were collected from the 4th survey at 59 points in Gwangyang-si, Chungcheong-do, Gyeongsangbuk-do Gunwi-gun, and southern Gangwon-do, and 5th survey data were collected from 25 points in northern Gyeonggi-do and northern Gangwon-do, confirming a total of 84 points (Figure 1a). Q. acuta confirmed the occurrence of 44 species in the 4th National Ecosystem Survey data, and in the 5th National Ecosystem Survey, no species was identified (Figure 1b). In the case of Q. acuta, it is judged that the point of occurrence of Q. acuta did not appear in the 5th data, which was limited to the northern region, because it characteristically inhabits densely in Jeollanam-do. Therefore, the occurrence points of 44 species identified in the 4th National Ecosystem Survey data were used for the analysis.

2.3. Environmental Data

In order to use climatic data affecting plant growth as model input data, 18 climatic factors of bioclim were reviewed. Annual mean temperature (Bio01) and annual precipitation (Bio12) were checked to confirm the change in vegetation distribution from the perspective of climate change. In the case of CMIP6, compared to CMIP5, the variability increases, as does temperature seasonality (Bio04) as a monthly precipitation and temperature variability factor. Including precipitation seasonality (Bio15), mean diurnal range (Bio02) as a variability factor for each day of the month, mean temperature of wettest quarter (Bio08) as a variability factor for precipitation-temperature in the affected section, precipitation of warmest quarter (Bio18), a total of seven climate factors were selected [44,45]. In order to secure spatial autocorrelation by removing the variable with multicollinearity among the primarily selected variables, the Pearson correlation coefficient between variables was checked. Variables with r = 0.85 or higher were removed, leaving only the variable with a high contribution from the initial model result. In addition, the DEM (Digital Elevation Model), slope, and aspect data were constructed from the National Digital Map of the National Geographic Information Institute (NGII) to reflect soil and topographical factors, and drainage and terrain were extracted from the Korea Forest Service Forest Soil Map. It was applied as a variable (Table 1).
Using the four standard paths for SSP scenarios provided in the IPCC 6th evaluation report, the difference in the distribution of native seeds according to the scenarios was confirmed. For bioclim data, MME data were simply averaged using 18 GCMs (Global Climate Models). Based on the future year of 2100, historical period (1981–2010), near future (2011–2040), middle future (2041–2070), and the 30-year average data of the far future (2071–2100) were constructed.

2.4. South Korea Detailed Scenario

The provided bioclim data were generated using 20 indices suggested by O’Donnell and Ignizio (2012) [46]. In order to produce grid-based SSP scenario-based bioclim future forecast data, detailed data on future climate change processed at the same resolution as single-unit observation data with a specific resolution are required. The provided data are grid-based observation data produced using the PRISM (Parameter-elevation Relationships on Independent Slopes Model) method at a resolution of 1 km for the entire Korean Peninsula, including North and South Korea, and detailed climate change data produced at the same resolution for 18 GCMs using this as O’Donnell and Ignizio’s definitions of the 20 indices input [47,48] (Table A1 of Appendix A). As for the provided data, the bioclim ecological climate index for 4 SSP scenarios was produced using 18 GCMs, and then Multi-Model Ensemble data were produced by simply averaging the bioclim data of 18 GCMs. Four SSP scenarios were considered. SSP1-2.6 is an eco-friendly sustainable economic growth path that minimizes the use of fossil fuels, and SSP2-4.5 is a mid-growth path that maintains the current trend. SSP3-7.0 is a path vulnerable to climate change due to delayed technological development, and SSP5-8.5 is the path of high fossil fuel use and expansion of development. The data of 18 GCMs were used to consider the uncertainty of the future outlook. In the MME-based bioclim bioindices analysis of changes due to future climate change by the ecological index, the average for the 30-year period was calculated in the same way for the past and future periods, and then the spatial change for each ecological index was calculated through comparison. For the future period, the middle future (2041–2070) and near future (2011–2040) periods, which are 30 years based on the far future (2071–2100), were used. In the case of SSP scenario data, the historical period up to 2014 was used, but in the case of the provided data, the past period was used as 1981–2010. The reproducibility analysis for the past period compared the value calculated using the PRISM-based data used for the production of detailed data with the value calculated as the average of 18 GCMs for the same past period. We examined how well it reproduces the climatic characteristics of stars. Lastly, for the change in the future outlook for each bioclim ecological index due to climate change, the spatial distribution of the change by the bioclim ecological index for each SSP scenario and future period was analyzed by comparing the values of the future period based on the values of the past period.

2.5. Construction of MaxEnt

MaxEnt was used to predict the potential fit distributions of A. pictum and Q. acuta for four 30-year periods (historical period, near future, middle future, far future). The prediction performance of the model is affected by the selection of two parameters: the feature class (FC) and the regularization multiplier (RM). The FC can optimize the model with six combinations of L (linear), Q (quadratic), P (product), T (threshold), H (hinge), and C (categorical), which means a kind of mathematical change [49]. The RM controls the strength of the FC used in the model and prevents model complexity and overfitting [5]. Smaller RM values produce localized power distributions that better fit a given species appearance record, but are prone to overfitting, and, conversely, larger RM values produce more broadly applicable predictions. In general, the RM constant condition was applied from 0.5 to 5.0, gradually increasing in steps of 0.5. That is, 6 types of FC (L, H, LQ, LQH, LQPH, LQHPT) and 10 types of RMs (0.5, 1.0, 1.5, 2.0, 2.5, 3.0, 3.5, 4.0, 4.5, 5.0) were applied to optimize the model. By comparing the performance of 60 models, the model with the lowest AICc value was selected. In general, it is known that lower AICc values better reflect future climate scenarios [50]. For model parameter optimization, R packages raster, ENMTools, ENMeval, etc., were utilized.
MaxEnt makes the basic assumption that species appearance points have been consistently investigated globally or randomly [51]. However, there is a concern that the actual species appearance data are spatially biased, which may cause overfitting or underfitting of model results [52]. Therefore, in this study, a bias layer was created using the kde2d function of the R package MASS, which provides two-dimensional Kernel Density Estimation based on the coordinates of the species occurrence point, and was applied to the model to prevent overfitting the output. ‘Replicates’ of MaxEnt were selected as 10 times and ‘Replicated run type’ as ‘Crossvalidate’.
Model prediction accuracy was evaluated using the receiver operating characteristic curve (ROC) and the AUC value (area under the ROC curve) as evaluation metrics. The evaluation criteria of the AUC value are as follows: 0.5–0.6 is failed, 0.6–0.7 is poor, 0.7–0.8 is fair, 0.8–0.9 is good, and 0.9–1.0 is excellent [53]. The importance of the variable was confirmed by percent contribution and permutation importance, and the importance of the variable was confirmed by performing the Jackknife test. In addition, the relationship with the distribution probability was confirmed by checking the response curves for each variable. Finally, to evaluate the potential distribution area of the species, the goodness of fit derived from the MaxEnt result was evaluated using the equal interval approach in five grades (No: 0–0.2, Low: 0.2–0.4, Middle: 0.4–0.6, High: 0.6–0.8, Very High: 0.8–1.0).

2.6. Seed Transfer Zones

STZs are a method of identifying suitable seeds for reforestation areas, and building maps based on the genetic characteristics of the species is the basis [1]. When it is difficult to acquire genetic data on native seeds, STZs based on climatic environmental factors such as precipitation and temperature are established to minimize seed maladaptation when restoring forest ecosystems [54]. In the United States, a study proposed migration guidelines for Whitebark pine (Pinus albicaulis Engelm.) seeds using the annual average temperature, precipitation, and annual heat:moisture index, and proposed a mountain brome (Bromus carinatus Hook. & Arn.) seed migration area using annual precipitation and annual maximum temperature [55,56]. In addition, studies describing seed collection areas in the eastern United States are being conducted using the lowest winter temperature and annual and growing season precipitation indices [57]. As such, climate-related STZs have been proposed in consideration of temperature, moisture, and the ecological environment, which are the most important factors for plant growth, and STZs are being used as a policy by institutions such as the US Forest Service (USFS) [27,58]. In addition, in Canada, basic data guiding seed collection were established as the number of reforestation areas increased [59]. In South Africa, the habitat distribution and potential distribution area of native species due to the decrease in native species due to the introduction of exotic species was described [60]. Representatively, Bower et al. (2014) constructed a seed zone using Winter (December–February) Minimum Temperature (WMT) and the annual heat:moisture index (AH:M) data, which have a major effect on seed growth [27]. The AH:M was used as a measure of aridity and was calculated as mean annual temperature (MAT) plus 15 °C (to obtain positive values) divided by mean annual precipitation in meters [61]. In Korea, as changes in forest distribution due to environmental and climate change have been recently recognized as important, Lee et al. (2005) classified detailed climate regions through topography, vegetation, crops, and house distribution, which affect climate change [62]. In addition, studies were conducted to improve forest ecosystem resilience, and studies were conducted to confirm changes in vegetation distribution according to climate change scenarios [63,64,65,66]. Furthermore, a study was conducted to establish STZs (65 regions) using temperature and precipitation data for the Korean Peninsula [67].
To establish domestic STZs, the temperature and precipitation data provided by WorldClim were used as climate data. It is provided in four resolutions between 30″ (~1 km2) and 10′ (~340 km2), and the smallest resolution, 30″ (~1 km2), was downloaded and used. For STZs applicable to Korea, Bower et al.’s (2014) construction standards were used, and, as in previous studies abroad, a map of the minimum winter temperature (December to February) and annual heat:moisture index was created and overlapped with domestic STZs [27]. In this study, the STZs constructed for the Korean Peninsula were reclassified as the boundaries of the South Korean region. STZs reclassified for South Korea were classified into 34 zones, and the distribution of climatic zones corresponding to areas with high habitability (>0.6) was confirmed by overlapping these with the results of the A. pictum and Q. acuta species distribution models. The distribution ratio of the climate zone for each future period of each scenario was identified, and the top three climate zones with a high distribution ratio were summarized.

3. Results

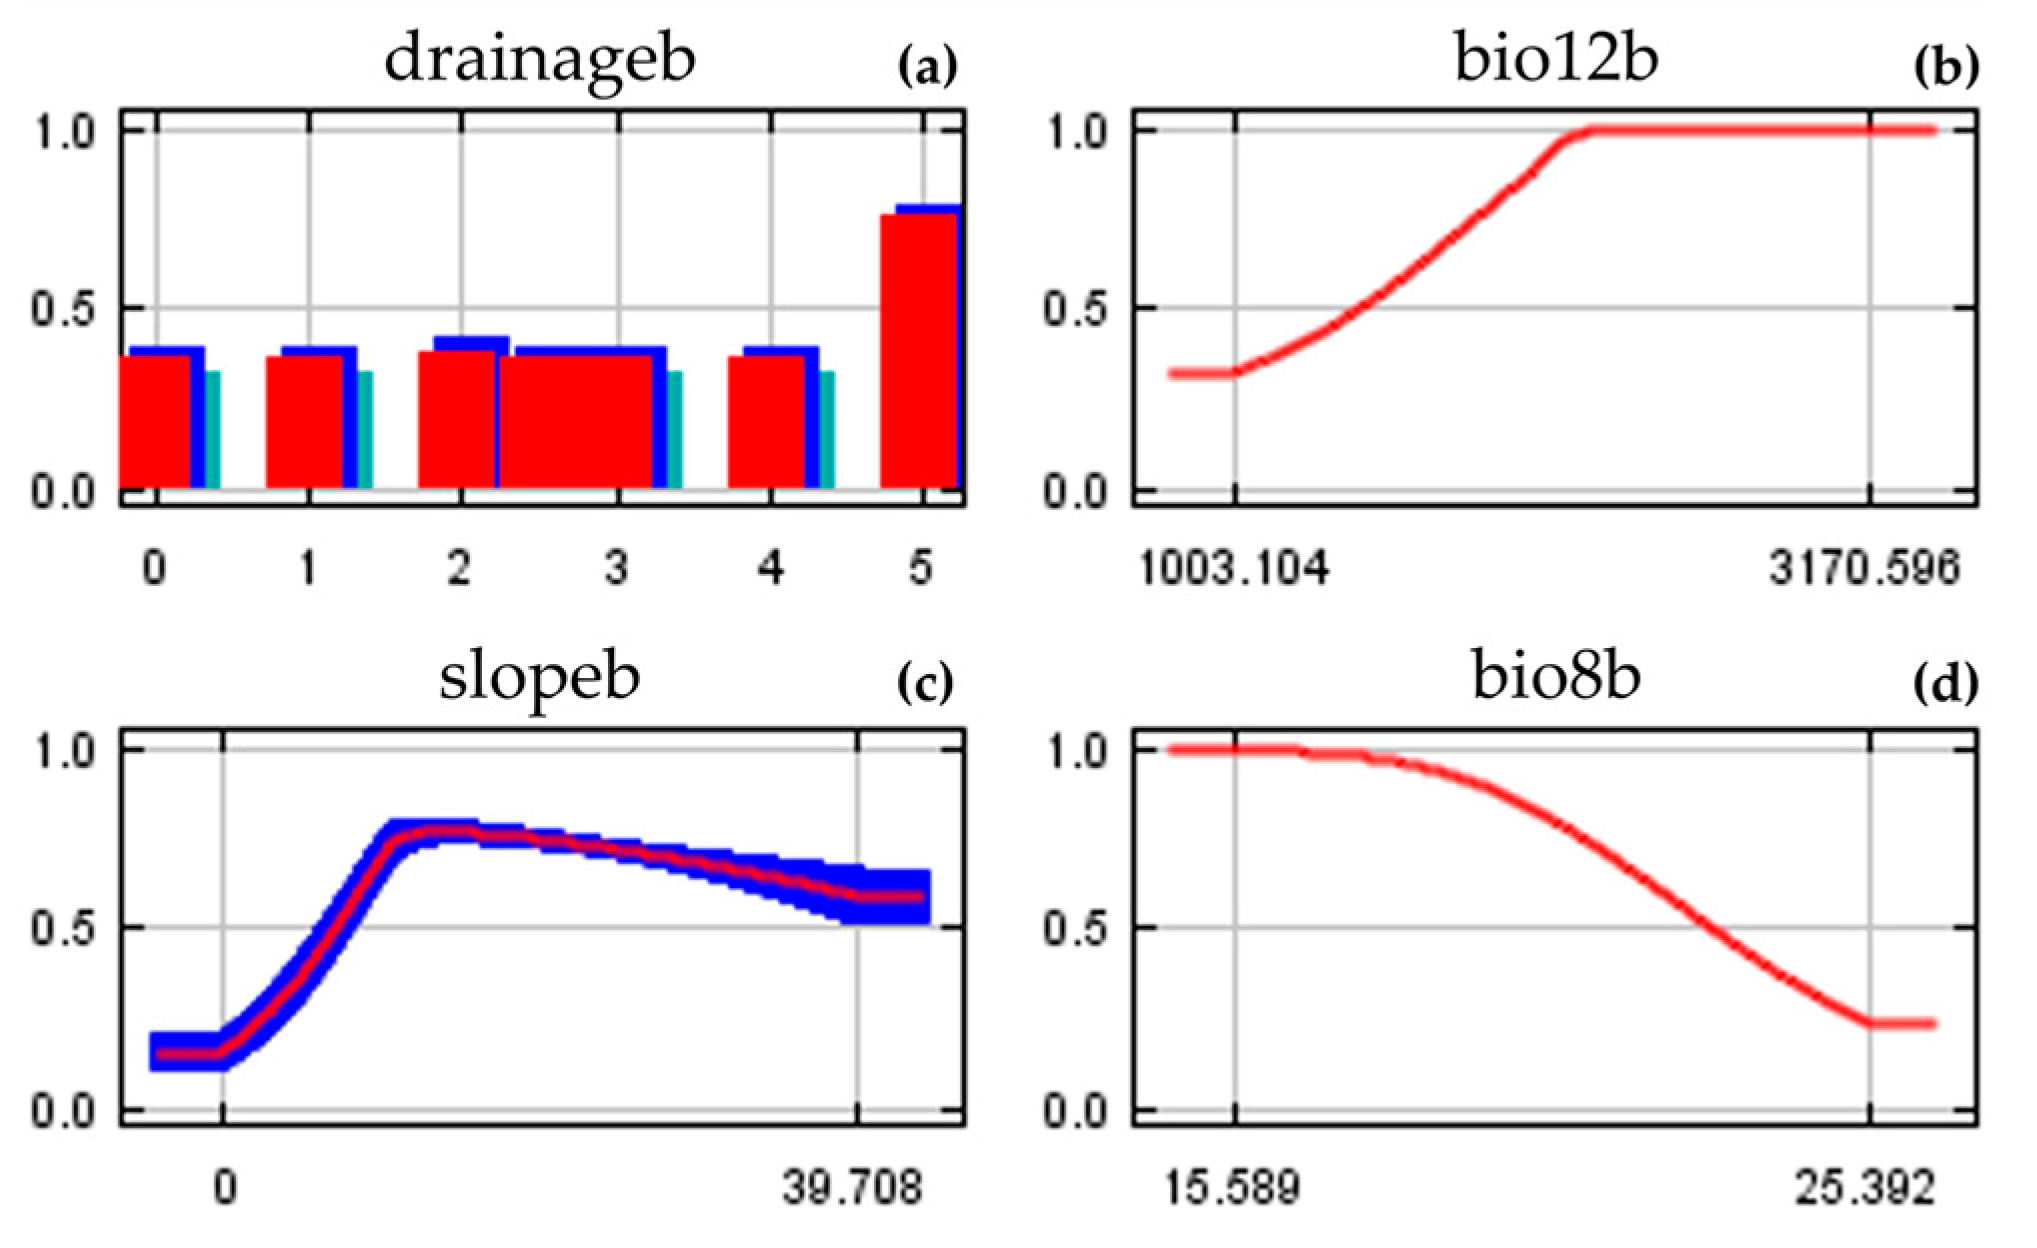
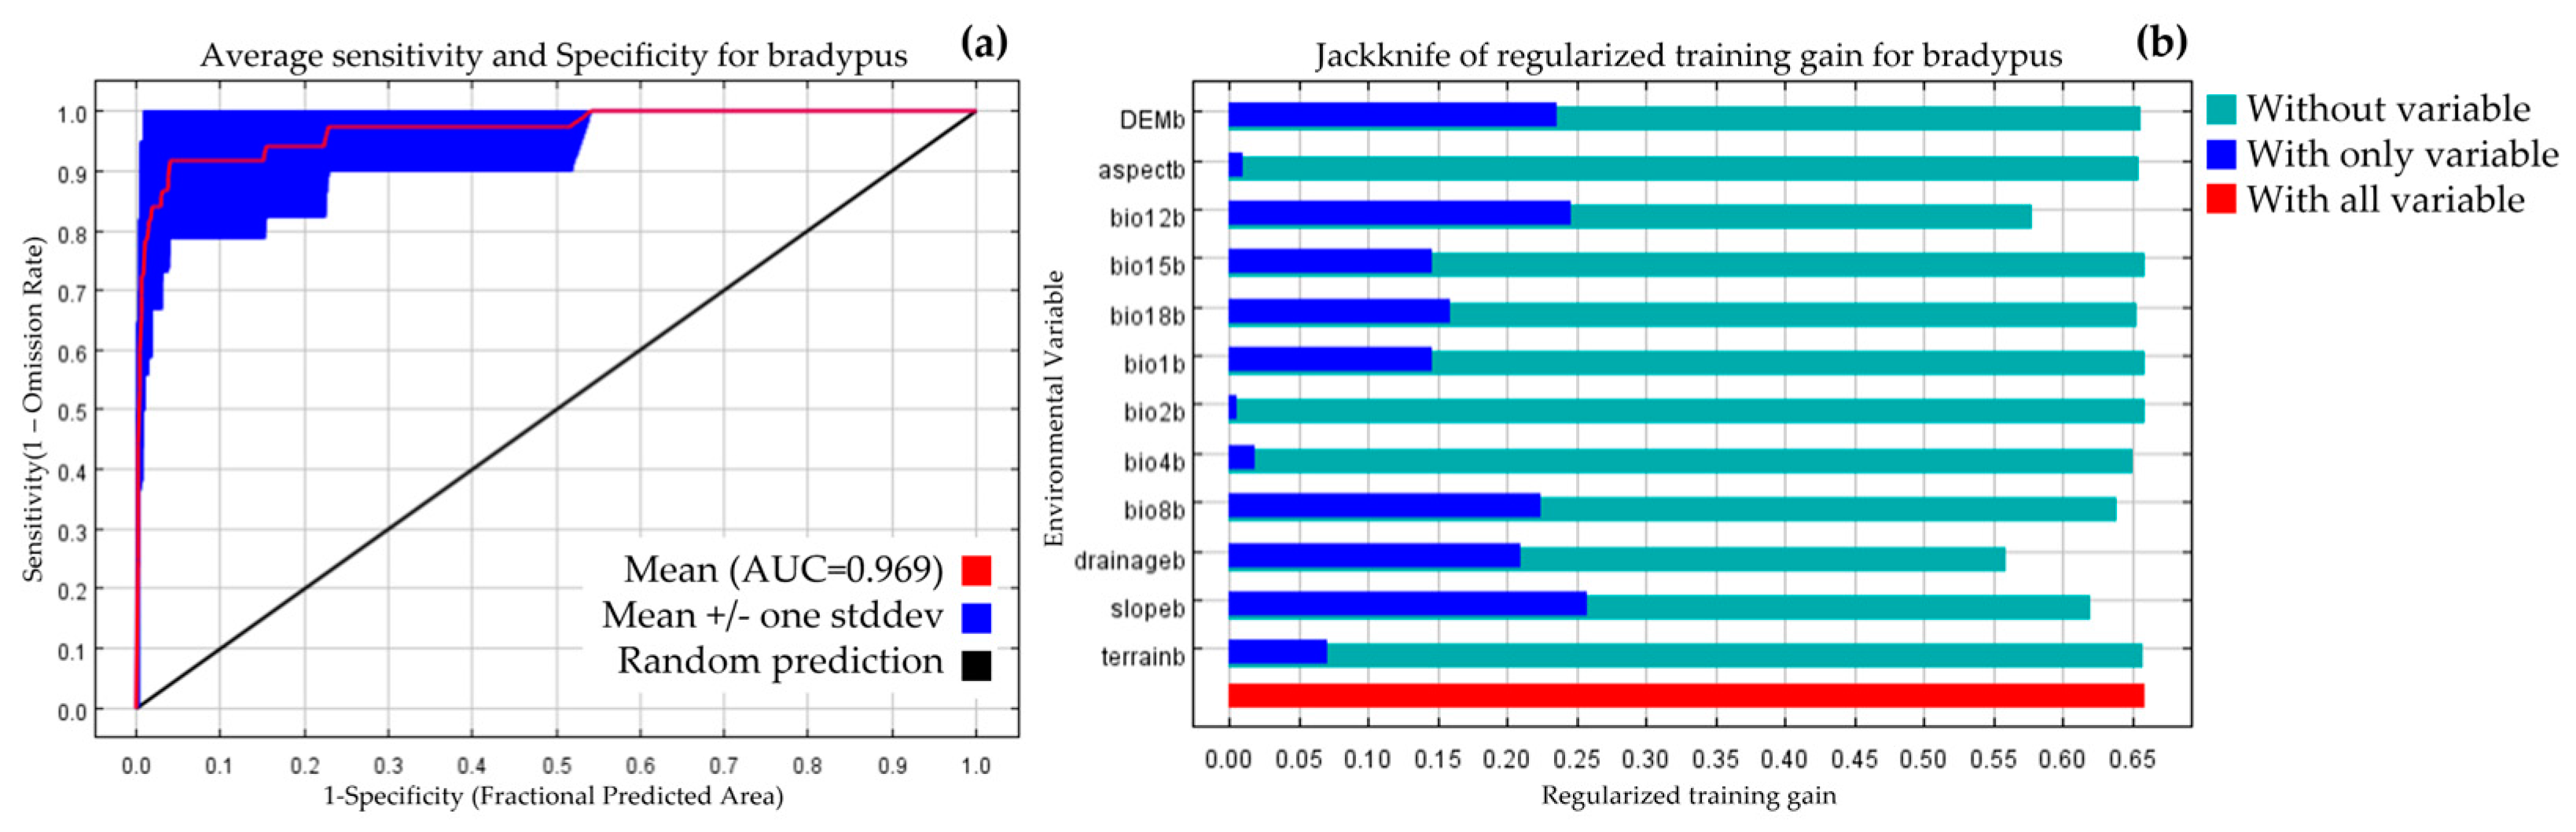
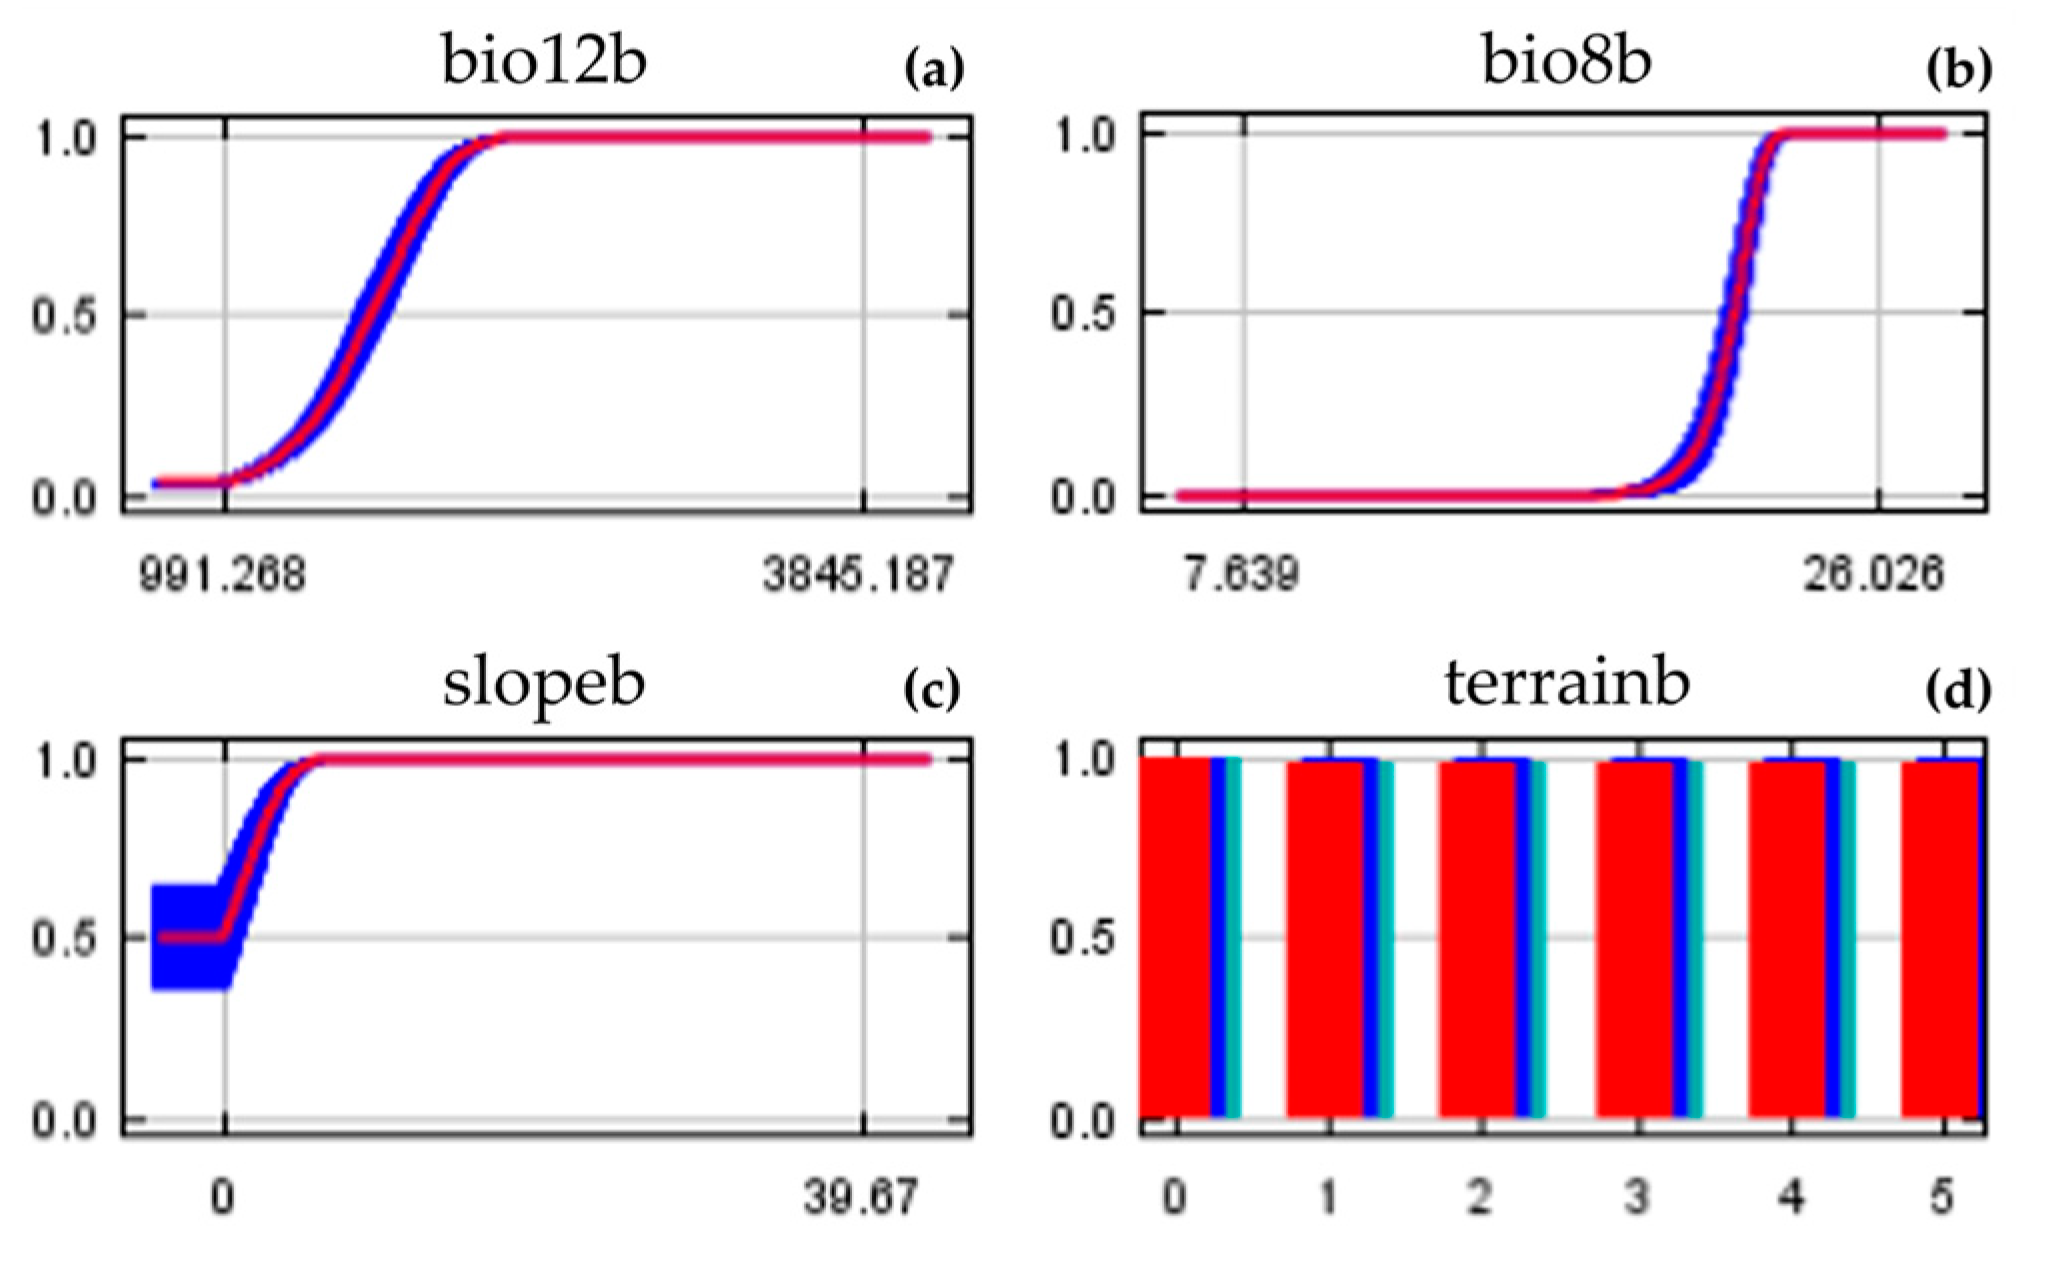
3.1. Model Performance and Variables Importance

Since a >0.85 correlation between the environment variables selected as the primary was not confirmed, five topography variables and seven climate variables were also used in the final model operation. The model performance results show that ‘LQH-1.5′, which selects the FC value LQH along with the RM value 1.5, provides the optimal performance model. Using the LQH-1.5 model, three potential distributions for 30 years (near future, middle future, far future) for each historical period and SSP scenario (SSP1-2.6, SSP2-4.5, SSP3-7.0, SSP5-8.5) total 13 potential distributions predicted in the area.
The average test AUC value of the A. pictum model was 0.881, which was interpreted as a reliable and suitable model with high prediction accuracy (Figure A1). The drainage percent contribution to the domestic A. pictum distribution was as high as 26.9%, the annual precipitation (Bio12) percent contribution was 23.8% and the slope percent contribution was 23.0%; all three variables contributed significantly to model establishment and were major factors (Table 2, Figure A2). It can be seen that the distribution is as a result of checking the response curves for the four major variables with a high contribution: the higher the drainage grade 5, the annual precipitation (Bio12) is 2250 mm or more, the slope is 10–20°, and the mean temperature of the wettest quarter (Bio08) is 15 °C or less, for A. pictum. It was interpreted as having a positive effect on the distribution. The same analysis results as those known to favor fertile and moist soil in the soil were derived for A. pictum distributed in Korea [30].
The average test AUC value of the Q. acuta model was 0.969, which was interpreted as a reliable and suitable model with high prediction accuracy (Figure A3). The annual precipitation (Bio12) percent contribution to the model was as high as 56.7%, and the mean temperature of the wettest quarter (Bio08) percent contribution was 14.7% for domestic Q. acuta distribution; both contributed significantly to the establishment of the model and were major factors (Table 2, Figure A4). It can be seen that the distribution is a result of checking the response curves for the four major variables with a high contribution: the Q. acuta distribution is found where the annual precipitation (Bio12) is 2300 mm or more, the mean temperature of the wettest quarter (Bio08) is 24 °C or more, the slope is 10–20°, and the drainage is grade 5, interpreted as having a positive effect on the same analysis results derived for Q. acuta distributed in Korea, which is known to grow well even in the alpine regions of the temperate zone [68].

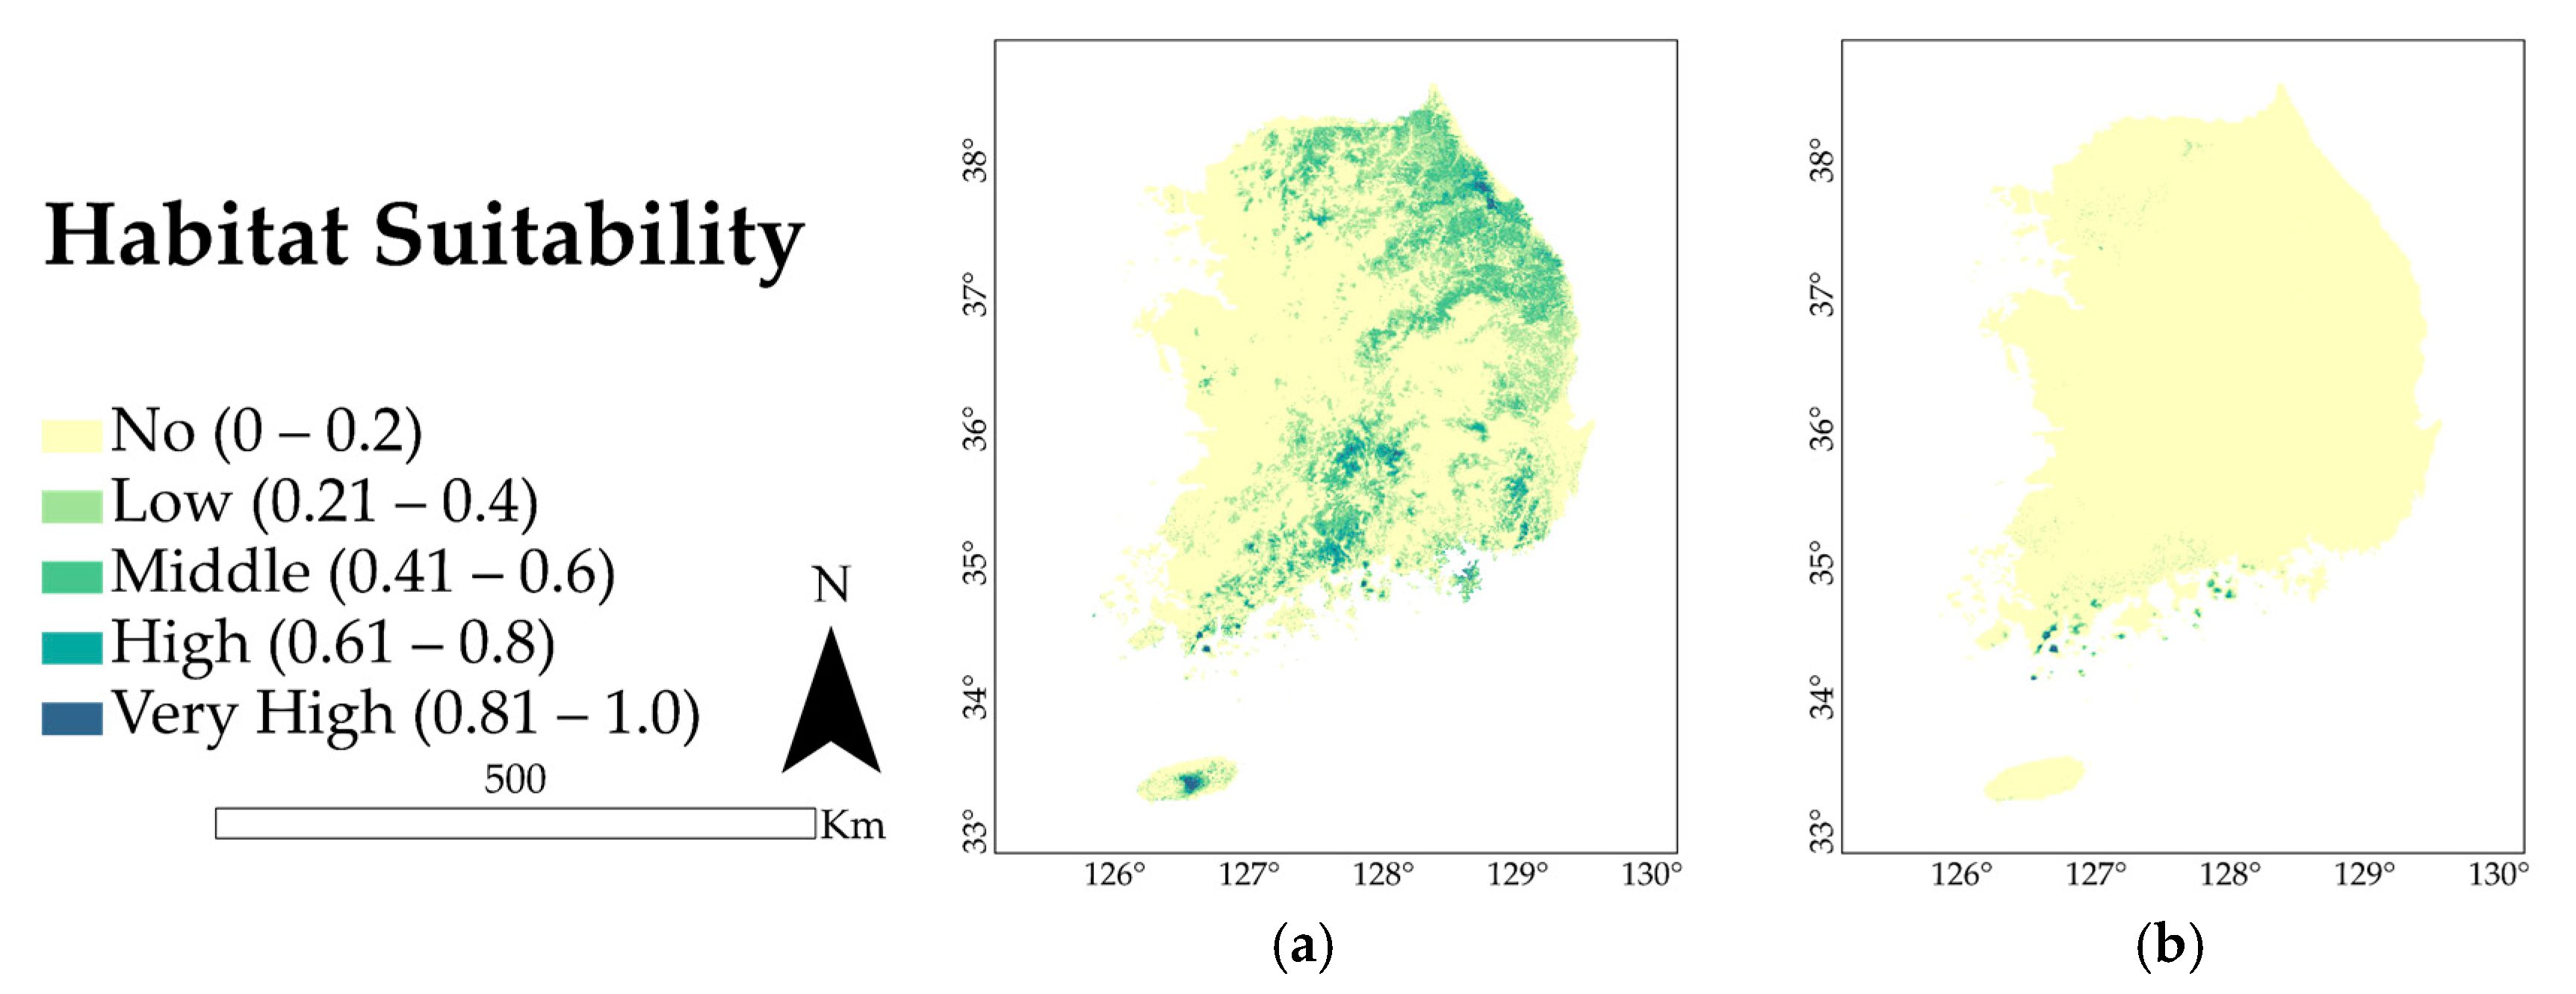
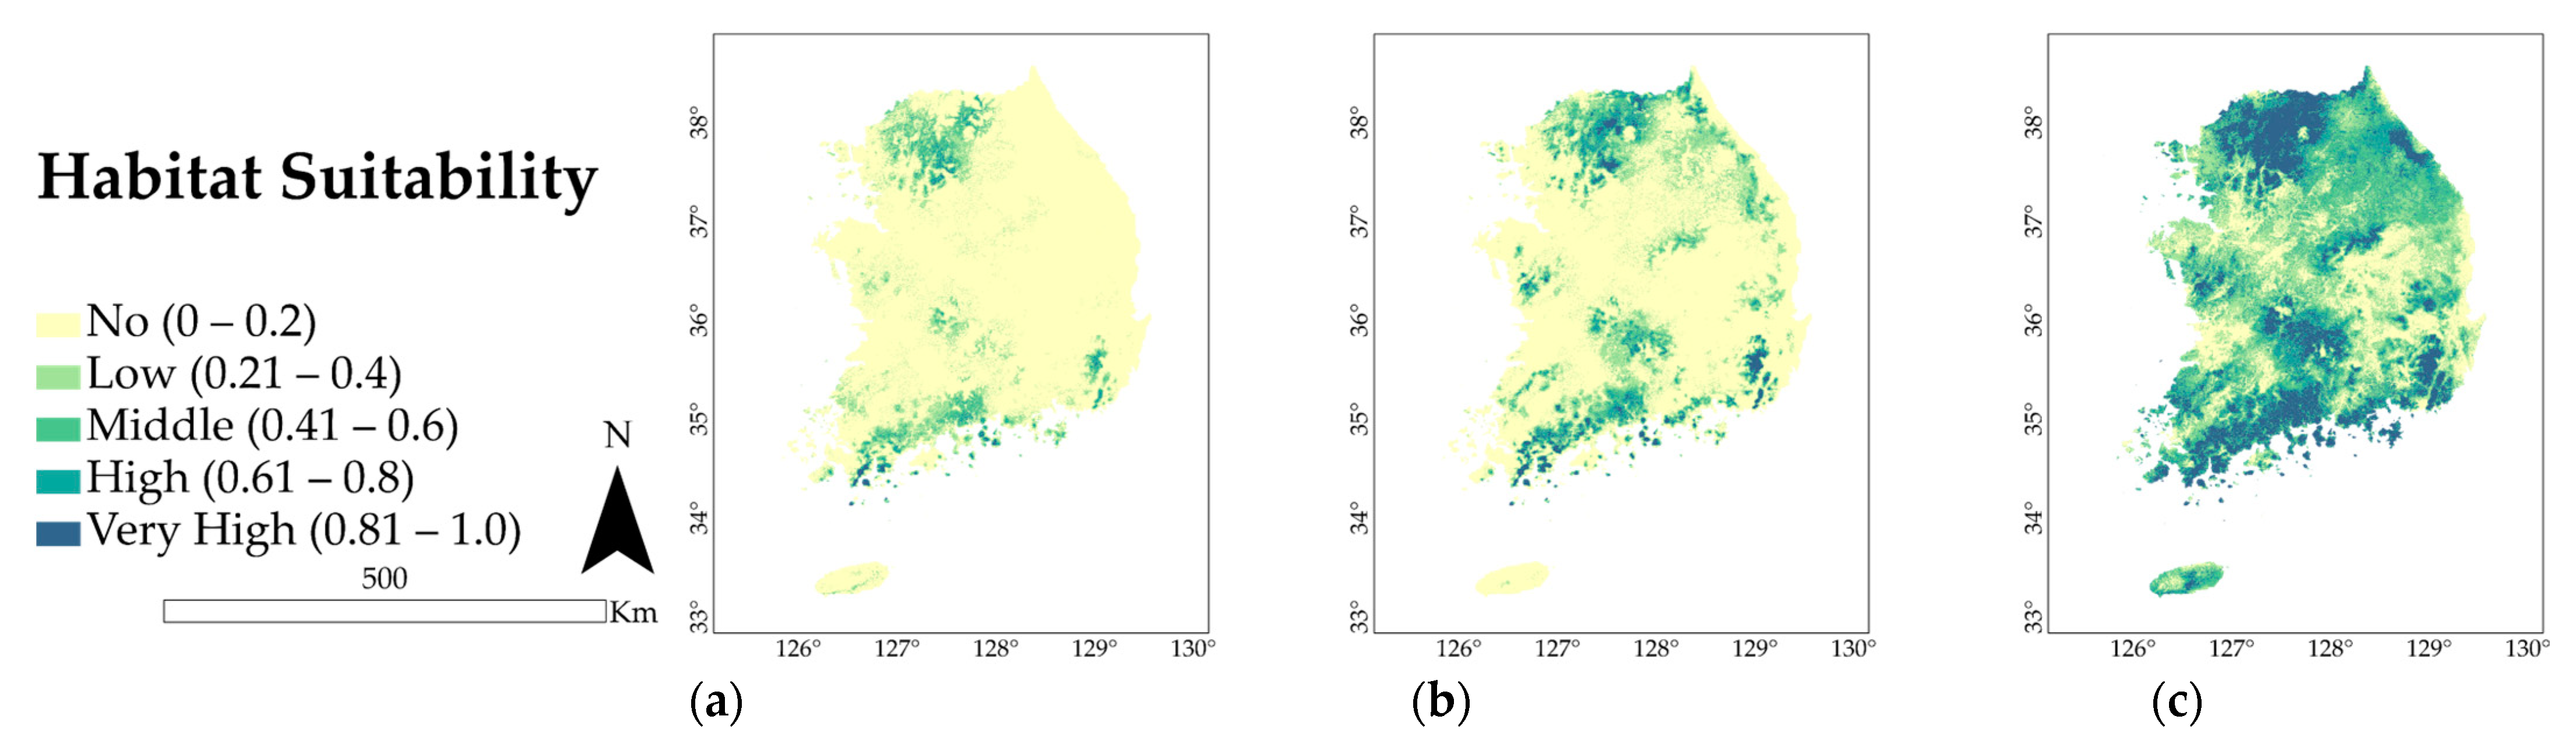
3.2. Present Distribution and Extent of Occurrence

The suitable distribution area of A. pictum confirmed by the historical period was similar to the actual distribution along the southern and eastern coasts and in northern Gangwon (Figure 2a). In addition to the actual appearance point of A. pictum, the Baekdu-daegan area connecting Woraksan Mountain–Songnisan Mountain–Deogyusan Mountain–Gayasan Mountain was also confirmed as a suitable distribution area. Very high covers 3.41% of South Korea’s area. High was 7.97%, middle was 11.23%, low was 19.54%, and no was 57.83%. In South Korea, the very high regions for A. pictum were found to be mainly located in Geochang-gun, Gyeongsangnam-do, Hapcheon-gun, Gyeongsangnam-do, Geoje-si, Gyeongsangnam-do, and Jeju-do. The high area was mainly distributed in Gyeongsangnam-do, centering on the very high area, and, in addition, it was found that inhabitation was also possible in Gangneung-si and Gangwon-do. Except for Gyeongsangnam-do, Jeju-do, and some areas of Gangwon-do, the possibility of inhabitation was low, and it was confirmed that most of the A. pictum growth was not suitable for the land area.
As a result of the Q. acuta analysis, the suitable distribution area of Q. acuta confirmed as a historical period was similar to the actual distribution along Jeollanam-do and the southern coastline (Figure 2b). In the historical period, the conformity ratio of Q. acuta was confirmed to be very high 0.005%, high 0.008%, middle 0.02%, low 0.09%, and no 99.88%. In South Korea, the very high regions for Q. acuta were found to be mainly located in Sancheong-gun, Gyeongsangnam-do, Changwon-si, Gyeongsangnam-do, Sacheon-si, Gyeongsangnam-do, Gokseong-gun, and Jeollanam-do. The high area was found to be mainly distributed in Gyeongsangnam-do and Jeollanam-do, which are very high areas, including Samcheok-si, Gangwon-do, Pyeongchang-gun, Gangwon-do, Jeongseon-gun, and Gangwon-do. Except for Gyeongsangnam-do, Jeollanam-do, and Gangwon-do, the possibility of inhabitation was low, and it was confirmed that most Q. acuta growth was not suitable for the land area.

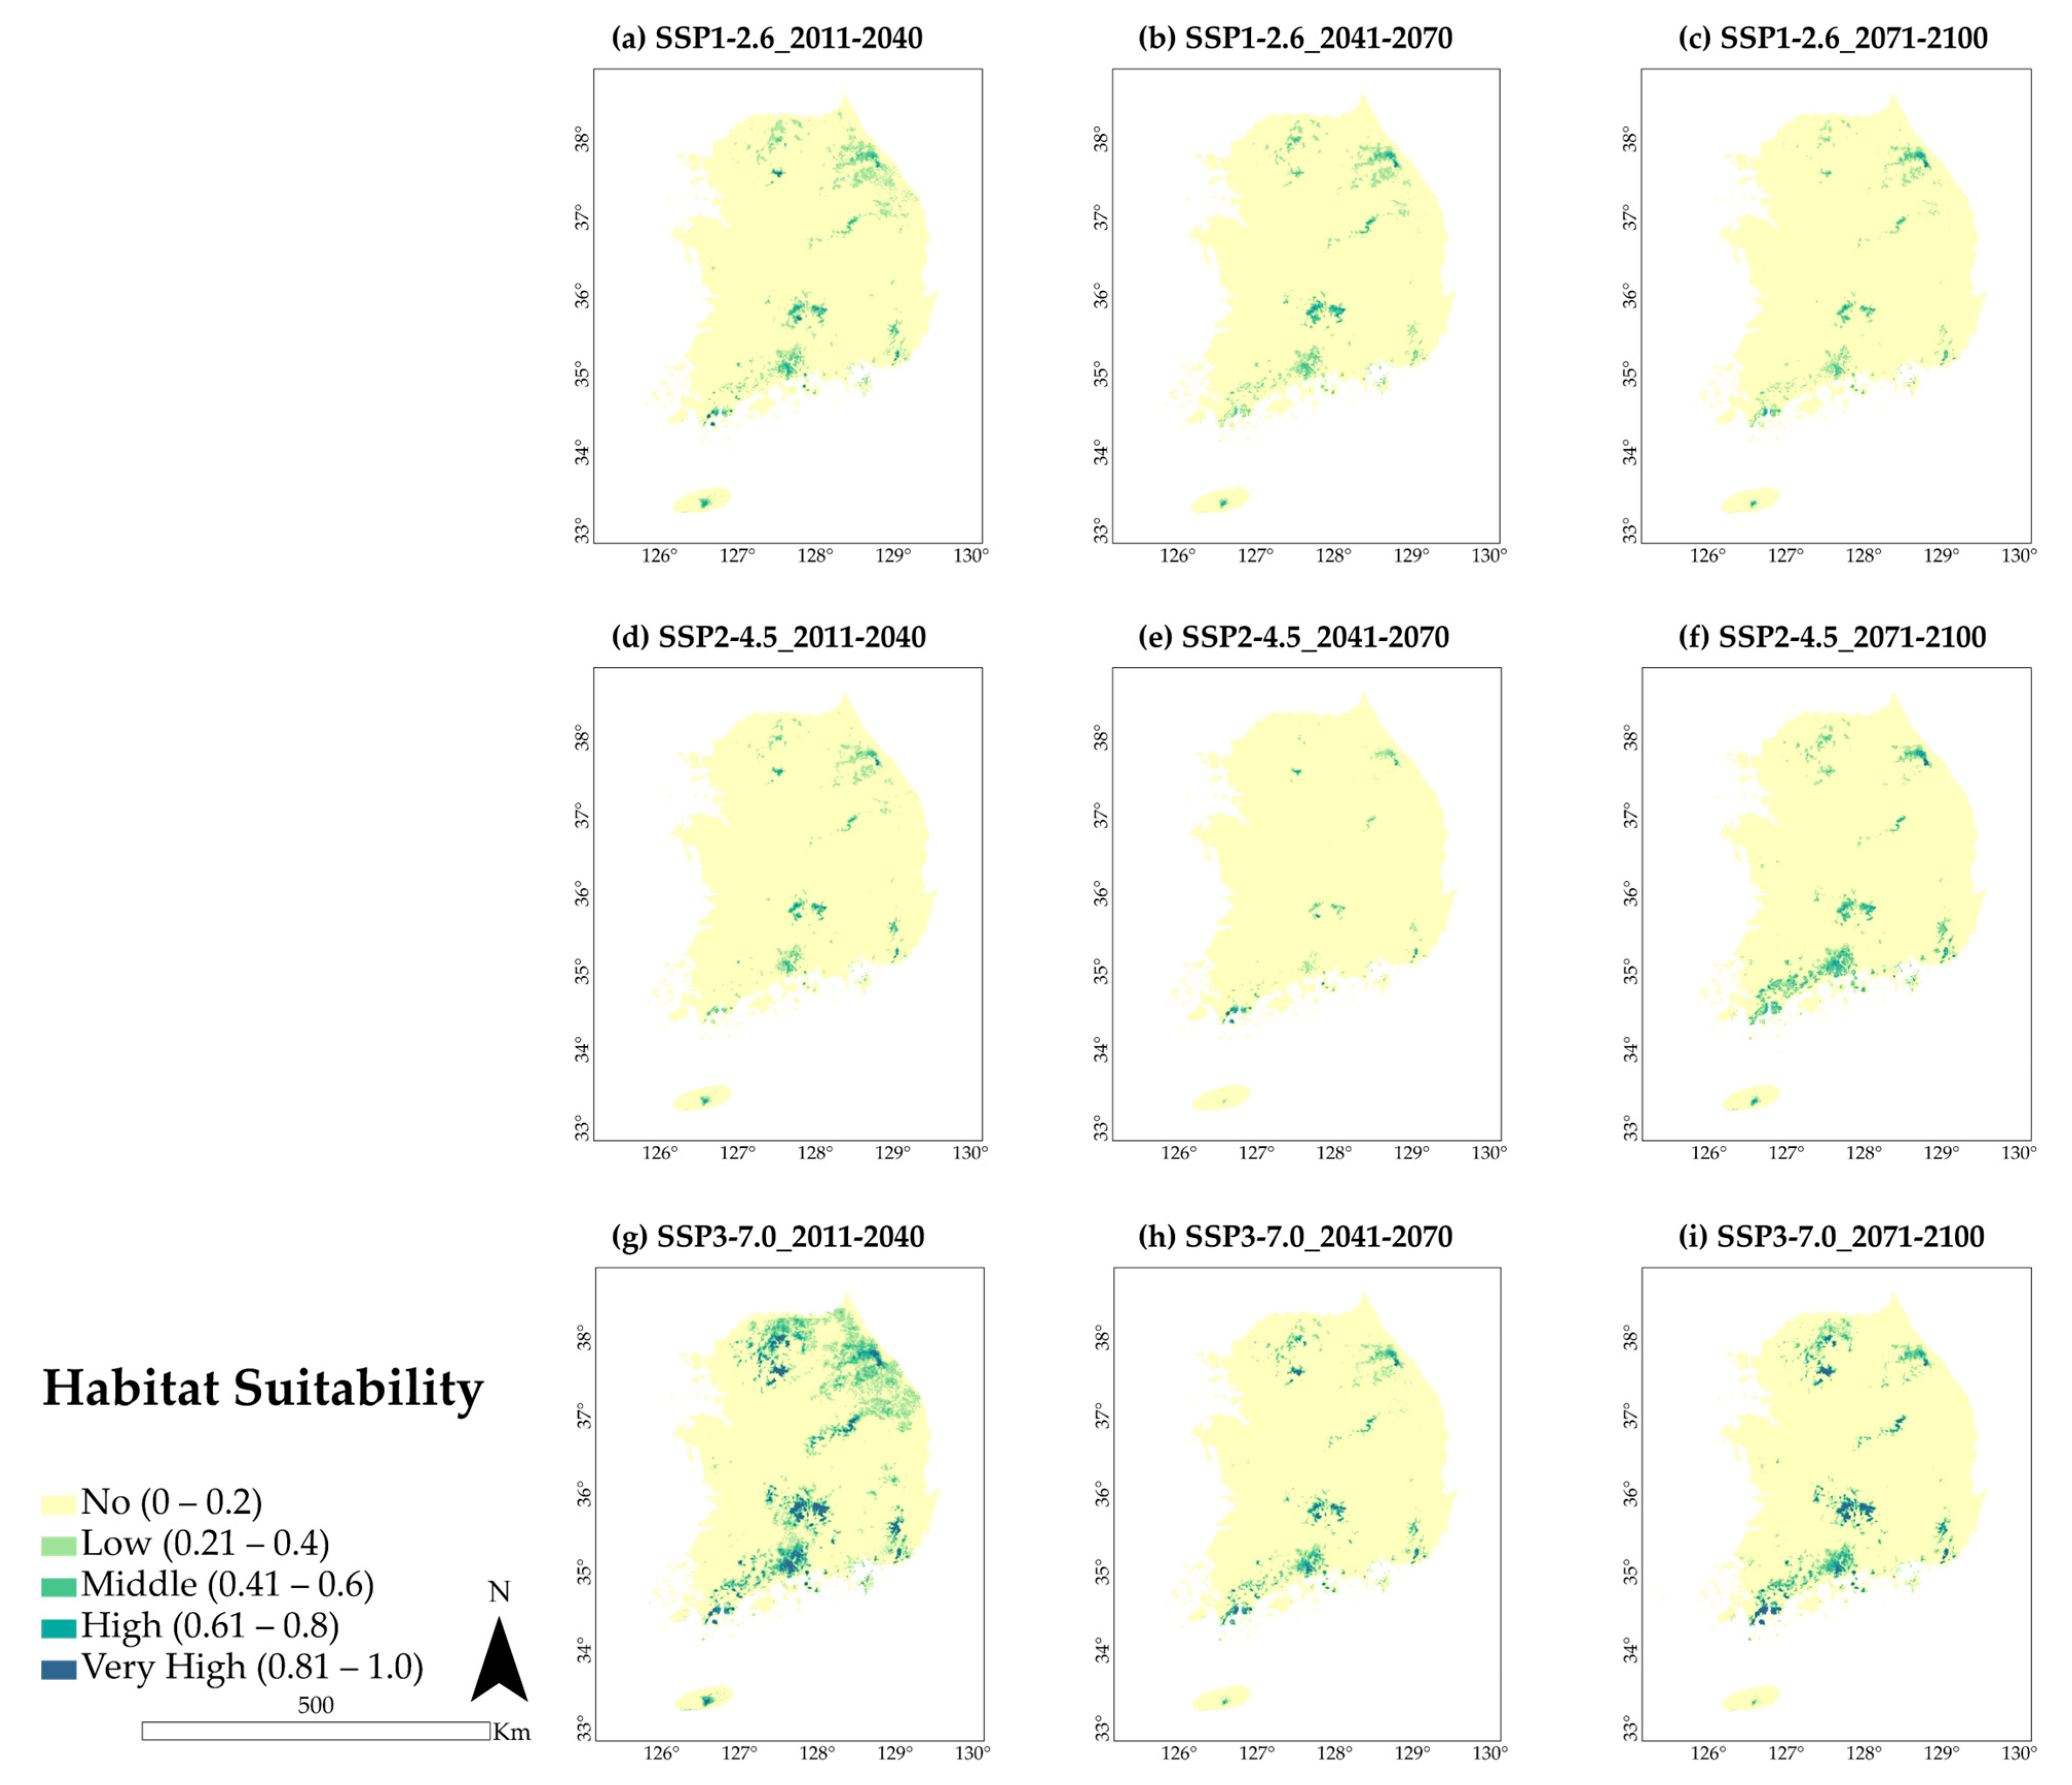
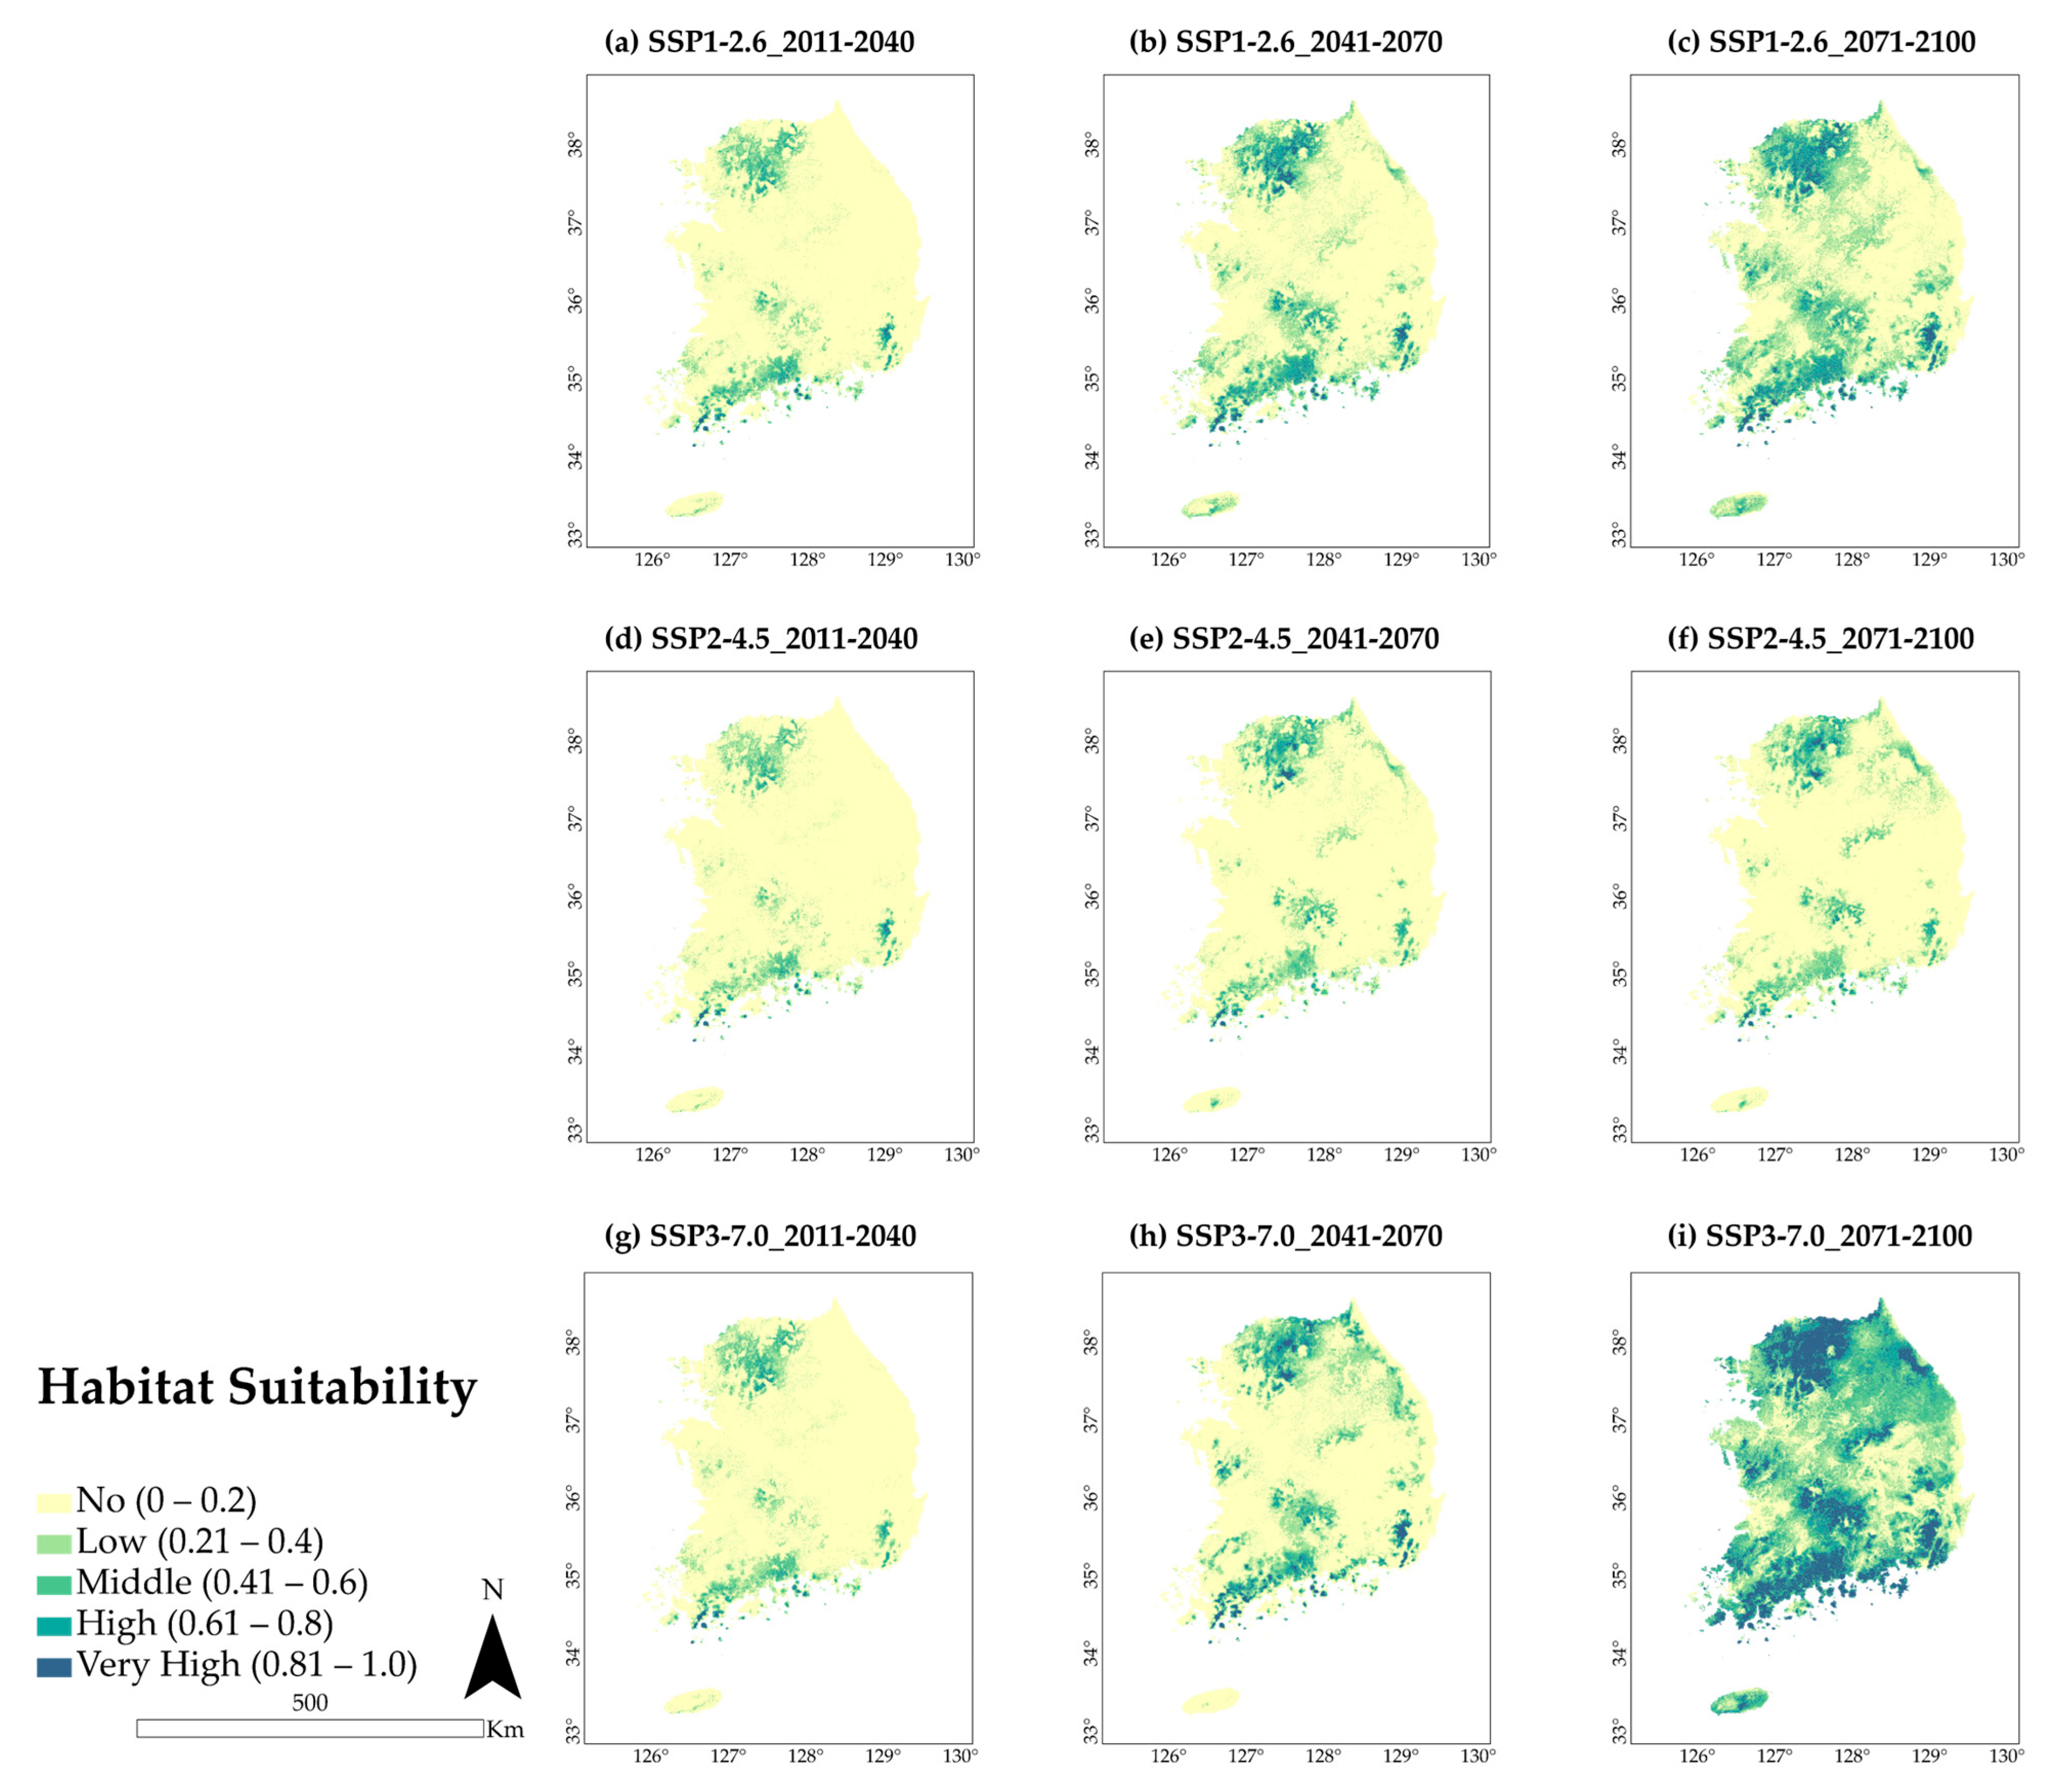
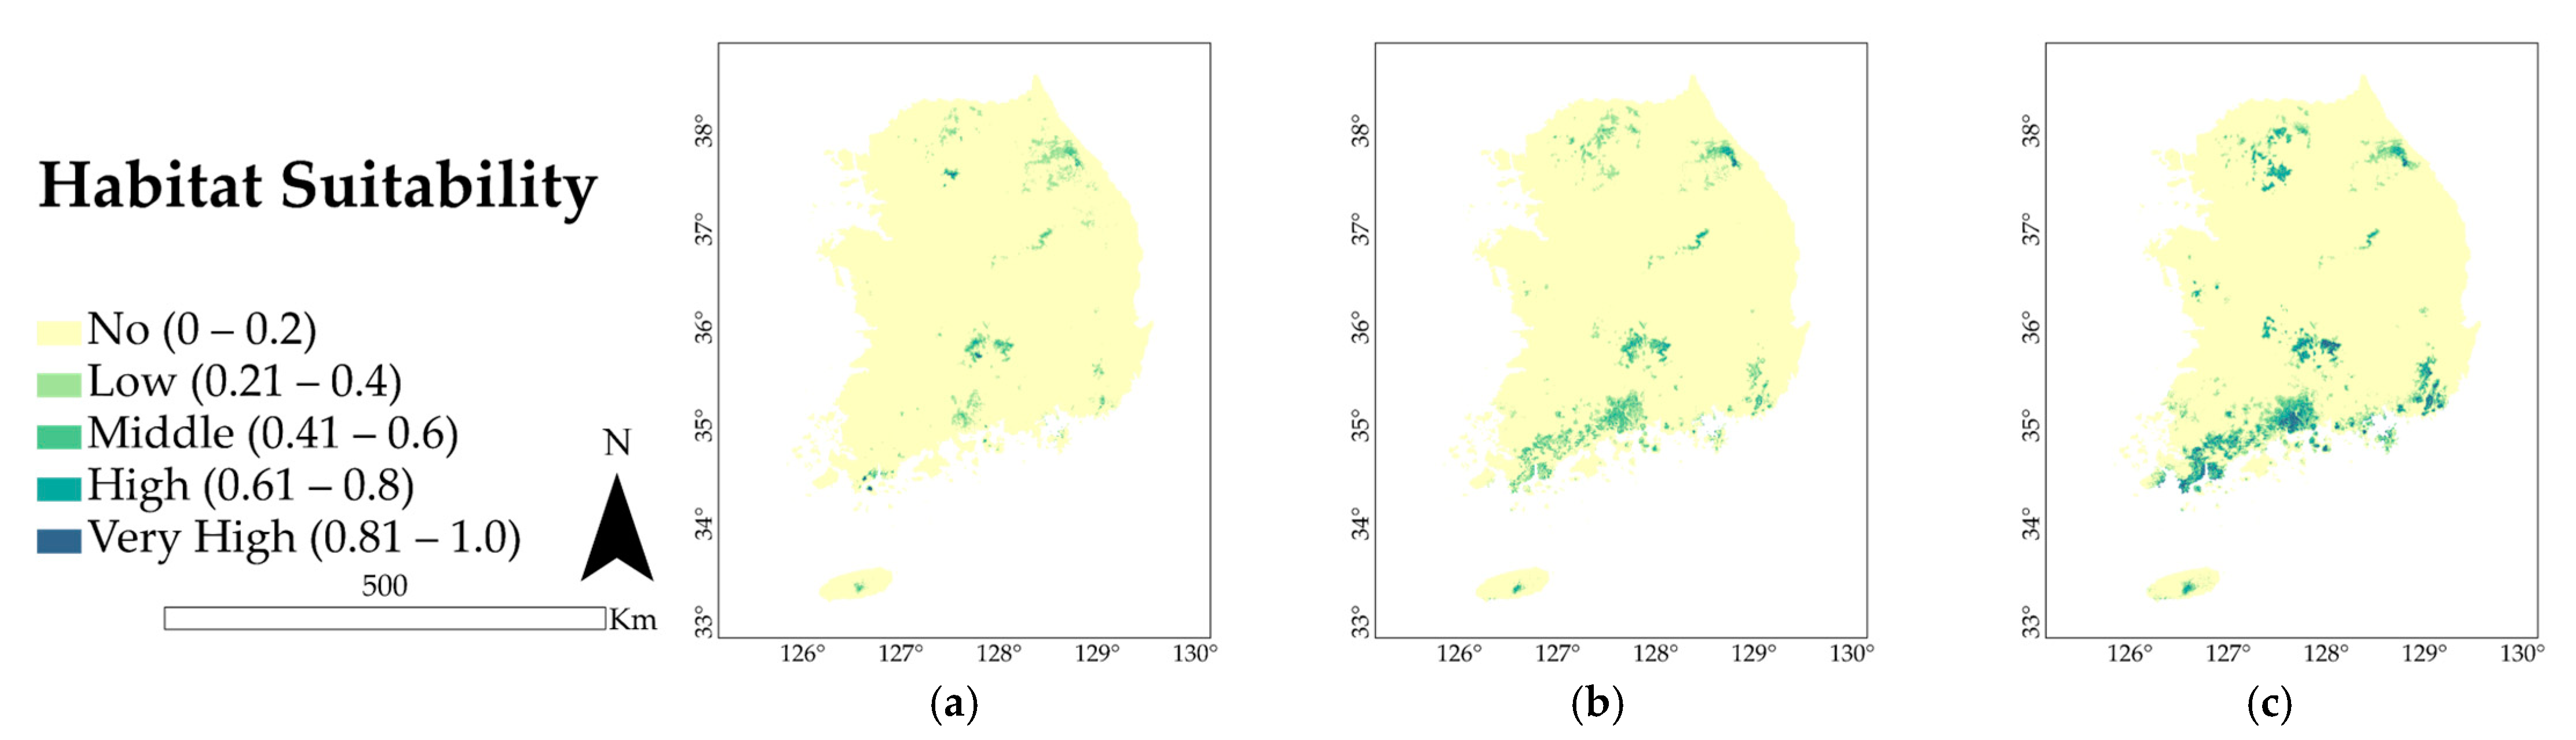
3.3. Future Predicted Distributions

As a result of projecting the future climate change scenarios SSP1-2.6, SSP2-4.5, SSP3-7.0, and SSP5-8.5 on the fitted distribution map of the historical period for A. pictum, it was confirmed that the potential distribution area of the future A. pictum was significantly reduced. For the SSP1-2.6 near future, A. pictum’s very high ratio is 0.10%, middle future 0.02%, and far future 0.02%; the habitat fit ratio decreased until 2040, and it is predicted to remain constant from 2041. The SSP2-4.5 near future high ratio was 0.04%, middle future 0.06%, and far future 0.05%, indicating that the habitat area increased until 2070 and decreased from 2071. On the other hand, the SSP3-7.0 near future’s very high ratio was 1.77%, 0.43% for middle future, and 0.92% for far future. In SSP5-8.5, the A. pictum’s very high ratio was confirmed to be 0.01% in the near future, 0.01% in the mid future, and 0.72% in the far future (Table 3, Figure 3 and Figure A5).
As a result of projecting the future climate change scenarios SSP1-2.6, SSP2-4.5, SSP3-7.0, and SSP5-8.5 on the fitted distribution map of Q. acuta for the historical period, the potential distribution area for future Q. acuta increases regardless of time and scenario. In the SSP1-2.6 near future scenario, Q. acuta’s very high ratio increased to 0.32%, middle future to 1.60%, and far future to 2.85%. In SSP2-4.5, the near future very high ratio was 0.22%, the middle future was 0.39%, and the far future was 0.45%. As in the SSP1-2.6 scenario, it was confirmed that the habitable areas gradually increased toward the far future. Even in SSP3-7.0, the near future’s very high ratio increased to 0.27%, middle future to 3.12%, and far future to 5.86%. In SSP5-8.5, the Q. acuta’s very high ratio was confirmed to be 0.28% in the near future, 2.01% in the middle future, and 17.18% in the far future. It was estimated that the habitat was expected to expand around Goseong-gun and Gangwon-do on the east coast (Table 4, Figure 4 and Figure A6).

3.4. South Korea STZs

As a result of reclassifying the domestically established STZs according to the South Korean border, STZs with 34 districts were constructed (Figure 5). WMT data are classified into 5 °F (2.2 °C) bands ranging from <−15 to >35 °F (−26.1 to 1.6 °C), and have 12 grades (<15, −15–−10, −10–−5, −5–0, 0–5, 5–10, 10–15, 15–20, 20–25, 25–30, 30–35, >35 °F); AH:M data have six bands (<16, 16–19, 19–21, 21–24, 24–27, >27 °C/m). Among the 34 districts, the WMT 15–20 °F and AHM 19–21 °C/m regions account for the largest proportion, with 20%. Next, the WMT 20–25 °F and AHM 21–24 °C/m area accounts for 13%, and the WMT 15–20 °F and AH:M 21–24 °C/m area accounts for 12%.
Regarding the species distribution model results for each scenario of South Korean STZs and A. pictum and the overlapping results of South Korea STZs, the historical period climate zone distribution ratio of A. pictum was 15–20 °F WMT and the 16–19 °C/m zone was 14.55%. For the SSP1-2.6 far future scenario, the WMT 25–30 °F, AHM 19–21 °C/m zone was found to be 21.35%. For the SSP2-4.5 far future scenario, the WMT 20–25 °F, AHM 16–19 °C/m zone was the highest, with 22.72%. In the case of the SSP3-7.0 far future scenario, the WMT 15–20 °F, AHM 16–19 °C/m zone showed the highest, with 17.59%. As a result of the SSP5-8.5 analysis, the far future WMT 20–25 °F, AHM 19–21 °C/m zone showed the highest, with 20.63% (Table 5).
Q. acuta’s historical period climate zone distribution ratio is WMT 25–30 °F, AHM 19–21 °C/m zone, with 39.10%. The SSP1-2.6 far future scenario showed that the WMT 10–15 °F and AHM 19–21 °C/m zone occupied the highest area, with 16.93%. For the SSP2-4.5 far future scenario, the WMT 10–15 °F and AHM 16–19 °C/m zone showed the highest, with 18.11%. As a result of the SSP3-7.0 analysis, it was found that the WMT 20–25 °F and AHM 19–21 °C/m zone occupied the highest regions, with 16.53%, for the far future scenario. In the case of the SSP5-8.5 far future scenario, the WMT 15–20 °F, AHM 19–21 °C/m zone showed the highest, with 20.08% (Table 5).
In this study, the distribution characteristics of climate zones according to future climate change were confirmed with STZs created based on the current climate. There is a limitation in not being able to build future STZs because winter minimum temperature data for each future period could not be acquired. However, it is meaningful to identify the preferred climate region for A. pictum and Q. acuta in the future based on the current climate. The results of this study can be used to identify climate zones with high habitat density for each scenario when future STZs are created. In addition, it is possible to check the region to which the preferred climate zone for each future period belongs, which can be helpful in selecting a management region as an important region for the future habitation of the target species. Furthermore, the Korea Forest Service is currently planning to create a seed transfer zone in order to establish a foundation for revitalizing forest restoration. It is thought that the seed zone data that we have built in Korea’s forest planning can serve as a basic data source. In addition, data that can contribute to the forest restoration process are expected to contribute to responding to climate change, creating a healthy ecosystem, fostering economic forests, and expanding welfare resources.

4. Discussion

4.1. Key Environmental Variables and Current Spatial Distribution

In this study, the MaxEnt model was used to predict the potential distribution of suitable habitats for A. pictum and Q. acuta, and to analyze environmental factors affecting species distribution. Of the 12 environmental factors involved in the construction of the A. pictum model, the contribution of precipitation-related factors was a total of 25.0%, the contribution of factors related to temperature was 14.2%, and the contribution of factors related to topography was 60.2%. It can be seen that it is a major environmental factor affecting distribution. The appropriate range of the major influencing factors appeared in the order of drainage grade 5, annual precipitation (Bio12, >2250 mm), and slope (10–20°). Shin et al. (2008) confirmed that some positive correlations with precipitation were recognized through a correlation analysis with 17 climate variables by location type, but no correlation with the rest of the climate variables [69]. This is consistent with the research results of this paper, which have the highest contribution of annual precipitation (Bio12) among the seven climate variables. Yang and Kim (2002) confirmed that A. pictum, which has a high water demand, has a high strength in the valley area, and Um and Lee (2006) confirmed that the distribution ratio of A. pictum was the highest at 24% among the dominant species appearing in valleys with slopes of 0–20° [70,71]. According to the results of the appropriate range of environmental factors in this paper, the slope was 10–20°, and the drainage was grade 5. Therefore, the dominant environmental factors affecting the distribution of A. pictum were the same as the results of previous studies.
Of the 12 environmental factors involved in constructing the Q. acuta model, the contribution of precipitation-related factors was a total of 58.0%, the contribution of temperature-related factors was 22.6%, and the contribution of factors related to topography was 19.3%. It can be seen that it is a major environmental factor affecting distribution. Shin et al. (2018) confirmed that the distribution area expanded differently depending on the degree of precipitation change, and Park et al. (2019) confirmed the positive correlation between the precipitation and the temperate evergreen broadleaf forest, and the amount of precipitation in survival was mentioned as having a relatively large impact [72,73]. This can support the results of this study showing the high contribution of precipitation. Yang and Shim (2007) confirmed the topographical distribution characteristics of Q. acuta and confirmed that it inhabits at a high density on slopes of 18–20° [74]. In addition, Nakao et al. (2011) and Yoon et al. (2011) confirmed that winter minimum temperature and summer precipitation had a significant effect on Q. acuta distribution [75,76]. This study did not consider the winter minimum temperature data, so it was not possible to confirm the contribution and permutation importance of the corresponding environmental variable. However, based on previous studies that confirmed the correlation with precipitation, we believe that the dominant environmental factors affecting the Q. acuta distribution are reliable results.

4.2. Potential Distribution of A. pictum and Q. acuta under Future Climate Conditions

When the detailed climate scenario was reflected in A. pictum, it was confirmed that most of the suitable distribution areas decreased regardless of the difference in temperature rise compared to the current location. In SSP5-8.5, the ratio of A. pictum is very high in the near future and tends to increase to 0.01% now, 0.01% in the mid future, and 0.02% in the far future, but the good fit ratio decreased by 2.69% in 2100 compared to the current distribution. Oh et al. (1998) predicted a slight increase in precipitation over the entire region of South Korea due to global warming, and confirmed that the soil moisture balance showed a negative correlation, resulting in soil drying due to evaporation [77]. Park (2002) summarized the growth characteristics of A. pictum as follows: A. pictum has strong cold tolerance and grows well in wet areas, but its growth is very poor in dry soils [78]. It was thought that the growth of A. pictum would increase due to the increase in precipitation towards the high emission scenario, but it is judged that the habitat decreased in all scenarios than the present due to the greater influence of soil drying. In the prediction according to SSP5-8.5, in 2100, the possibility of inhabitation was high in Baegunsan in Gwangyang-si, Jeollanam-do, in the coastal region of Jeollanam-do, Deogyusan in Muju-gun in Jeollabuk-do, and Odaesan in Gangneung-si in Gangwon-do. In SSP5-8.5, the areas with a high possibility of inhabitation are mainly located in the foothills or valleys. In addition, suitable habitat changes for A. pictum are consistent with areas where major A. pictum sap is currently harvested [79,80].
Reflecting the four detailed climate scenarios, the very high rates of Q. acuta in 2100 increased in SSP1 (2.845%), SSP2 (0.445%), SSP3 (5.855%), and SSP5 (17.175%) compared to today. Kwon et al. (2020) predicted that the temperature would continue to rise and predicted that the largest temperature increase would occur in SSP5-8.5, which emits the most greenhouse gases [79]. In addition, an increase in the global average precipitation was predicted according to the degree of greenhouse gas emissions, and a very large variability was predicted in the high-emissions scenario [81]. Accordingly, it is judged that Q. acuta has the largest spread of habitat in SSP5-8.5 under the influence of large changes in temperature and precipitation. According to the prediction according to SSP5-8.5, in 2100, the inland areas of Jeollanam-do and Gyeongsangnam-do, Odaesan National Park in Gangwon-do, and inland areas in northern Gyeonggi-do were found, and the habitat was predicted to move northward and move inland from the present. Future changes in suitable habitats for Q. acuta are consistent with those identified in the study of Park et al. (2016) [82].

4.3. How to Use STZs

Forest restoration is largely divided into three stages: planning, restoration work, and monitoring and maintenance. Kim and Choi (2017) established a process for the selection of restored species and the development of native wood seed germination promotion technology [83]. The restoration species selection process proceeds through the stages of a literature search, basic germination experiment, seed ecology survey, and germination factor analysis. Furthermore, by establishing a system that integrates field research, securing local seeds, seed quality management, and seed management processes, technology to improve the quality of native seeds was prepared. Once the restoration seeds are selected, restoration work begins. Restoration work is carried out through the process of logging trees, securing seeds, testing applicability, and implementing greening work. After the greening construction is completed, monitoring and maintenance are carried out. It is thought that STZs in the forest restoration phase can contribute to the identification of seed habitats to maximize the viability of the restored species in the restoration implementation phase. When it is difficult to obtain general data on native species, STZs are spatial information that describes geographic areas that can minimize maladaptation that may occur during forest ecosystem restoration in consideration of climatic and environmental factors such as precipitation and temperature. It is thought that it can play a role in preparing a plan to utilize native seeds [84].
The results of this study are expected to be able to actively contribute to the initial stage for maximizing the adaptability of the target seeds and identifying the areas that can be expanded during the restoration process. Currently, the importance of using native seeds as restoration species in the restoration construction stage is increasing. When native species are used as restored species, they are adapted to the environmental conditions of the planting area, so that the vegetation community can be maintained for a long time and a plant community with the potential to reproduce itself can be created. Our STZs allow us to check the range of native seeds and to identify geographic regions where seeds are growing the fastest and exhibit adaptive characteristics. Furthermore, an efficient management plan can be prepared through the successful settlement of the species and the identification of areas where it can be effectively spread. However, in the case of the STZs constructed through this study, it is a map depicting the STZs that can be used when there is no specific information about genetic variation and regional adaptation. Therefore, it is useful to identify the preferred regions of A. pictum and Q. acuta according to the climatic zone, but in some cases, it is difficult to identify the unique genetic type, and it is difficult to indicate the degree of genetic differentiation.
Eckert et al. (2010) performed genetic analysis by sampling loblolly pine (Pinus taeda) species from 54 regions and then identified seeds suitable for each region based on monthly and annual maximum and minimum temperature and precipitation indicators and constructed a map indicating this [85]. Johnson et al. (2012) established STZs based on the genetic diversity of Achnatherum hymenoides, monthly and annual precipitation, average monthly temperature, and monthly maximum and minimum temperature [86]. Keller and Kollmann (1999) confirmed that the growth of seeds decreased as the origin of seeds became genetically distant through genetic analysis for the construction of STZs [87]. Through genetic analysis for the establishment of STZs, it was confirmed that the growth of seeds decreased as the origin of the seeds was genetically distant. As such, overseas studies have been actively conducted from the past to the present to establish STZs in consideration of the genetic differences according to vegetation. In addition, the United States is working with the USDA Forest Service to revise the STZs’ policy, and the USDA is collecting the basic information needed to develop STZs that perfectly complement forest climate management approaches [88]. The Korea Forest Service is planning to establish an STZ considering plant genetic characteristics to promote forest restoration. The results of this study are thought to be able to provide basic data for the establishment of a domestically applicable STZ, and since the STZs we built could not combine the genetic analysis data, if the study was conducted in cooperation with the Korea Forest Service, the STZs could be applied geographically (Figure 6). It is expected that it can be clearly adjusted.

5. Conclusions

This study is based on predicting the suitable habitats of A. pictum and Q. acuta through the MaxEnt model and confirming the distribution characteristics through cross-validation with STZs. The results show the present and future distributions of A. pictum and Q. acuta, determine the main variables affecting the distribution, and identify climatic zones with high habitat density. As a result, A. pictum has a decreased habitability in all scenarios and tends to be concentrated mainly in the southern coastal regions. Important factors affecting the A. pictum distribution were expressed as soil drainage grade, annual precipitation (Bio12), and slope. As a result of cross-validation with STZs, it was confirmed that the habitat density was high in the WMT 15–20 °F, AHM 16–19 °C/m zone and in the WMT 20–25 °F, AHM 16–19 °C/m zone. Q. acuta is concentrated in the coastal areas of Jeollanam-do, and as it goes into the far future, the suitable habitat tends to move to high latitudes and spread to inland areas. Annual precipitation (Bio12) and mean temperature of the wettest quarter (Bio08) were confirmed to be important factors for growth, and in STZs, it was confirmed that the habitat density was high in the WMT 10–15 °F, AHM 19–21 °C/m zone and WMT 20–25 °F, AHM 19–21 °C/m zone.
It is thought that this provides important basic data for the useful selection of preferential restoration areas and for evaluating viable areas according to climate change. However, in addition to the variables included, other factors (including biological factors and human activity) may also have a major impact on survival and adaptation, which may be key to the adaptability of native seeds. In the future, more species distribution models should be utilized to account for more factors. In addition, in order to increase the applicability of STZs, it is necessary to focus on the genetic data of seeds, and further research on ways to increase the domestic applicability and collaboration between researchers is needed.

Author Contributions

Conceptualization, W.S., J.C. (Jaeyong Choi), W.K. and J.C. (Jaepil Cho); methodology, W.S., W.K. and C.K.; investigation, C.K. and W.K.; resources, J.C. (Jaepil Cho); writing—original draft preparation, W.S. and J.C. (Jaeyong Choi); writing—review and editing, W.S., C.K. and W.K.; visualization, C.K. and W.K.; funding acquisition, W.S. and J.C. (Jaeyong Choi) All authors have read and agreed to the published version of the manuscript.

Funding

This study was carried out with the support of R & D Program for Forest Science Technology (Project No. “2021365A00-2223-BD01”) provided by Korea Forest Service (Korea Forestry Promotion Institute).

Data Availability Statement

Not applicable.

Conflicts of Interest

The authors declare no conflict of interest.

Appendix A

Table A1. CMIP6 GCM lists [89,90,91,92,93,94,95,96,97,98,99,100,101,102,103,104,105,106].
Institution (Country)GCMsResolution
Geophysical Fluid Dynamics Laboratory (USA)GFDL-ESM4360 × 180
Meteorological Research Institute (Japan)MRI-ESM2-0320 × 160
Centre National de Recherches Meteorologiques (France)CNRM-CM-6-124,572 grids
distributed over
128 latitude circles
CNRM-ESM2-1
Institute Pierre-Simon Laplace (France)IPSL-CM6A-LR144 × 143
Max Planck Institute for Meteorology (Germany)MPI-ESM1-2-HR384 × 192
MPI-ESM1-2-LR192 × 96
Met Office Hadley Centre (UK)UKESM1-0-LL192 × 144
Commonwealth Scientific and Industrial Research Organisation, Australian Rsearch Council Centre of Excellence for Climate System Science (Australia)ACCESS-CM2192 × 144
Commonwealth Scientific and Industrial Research Organisation (Australia)ACCESS-ESM1-5192 × 145
Canadian Centre for Climate Modelling and Analysis (Canada)CanESM5128 × 64
Institute for Numerical Mathematics (Russia)INM-CM4-8180 × 120
INM-CM5-0180 × 120
EC-Earth-ConsortiumEC-Earth3512 × 256
Japan Agency for Marine-Earth Science and Technology/Atmosphere and Ocean Research Institute/National Institute for Environmental
Studies/RIKEN Center for Computational Science (Japan)
MIROC6256 × 128
MIROC-ES2L128 × 64
NorESM Climate modeling Consortium consisting of CICERO (Norway)NorESM2-LM144 × 96
National Institute of Meteorological Sciences/Korea Meteorological Administration (Korea)KACE-1-0-G192 × 144
Figure A1. The receiver operating characteristic (ROC) curve of A. pictum (a); the Jackknife tests the importance of the training of variables to distribution of A. pictum (b).
Forests 14 00087 g0a1
Figure A2. The response curve of A. pictum’s dominant environmental factors. (a) indicates that of drainage; (b) indicates that of bio12; (c) indicates that of slope; (d) indicates that of bio8. Red curves show the mean response of the 10 replicate Maxent runs and blue margins (two shades for categorical variables) indicate ±1 standard deviation.
Forests 14 00087 g0a2
Figure A3. The receiver operating characteristic (ROC) curve of Q. acuta (a); the Jackknife tests the importance of the training of variables to distribution of Q. acuta (b).
Forests 14 00087 g0a3
Figure A4. The response curve of Q. acuta’s dominant environmental factors. (a) indicates that of bio12; (b) indicates that of bio8; (c) indicates that of slope; (d) indicates that of terrain. Red curves show the mean response of the 10 replicate Maxent runs and blue margins (two shades for categorical variables) indicate ±1 standard deviation.
Forests 14 00087 g0a4
Figure A5. The potential distribution of A. pictum under future climate conditions. (ac) indicate the potential distribution at three periods under SSP1-2.6, respectively; (df) indicate the potential distribution at three periods under SSP2-4.5, respectively; (gi) indicate the potential distribution at three periods under SSP3-7.0, respectively.
Forests 14 00087 g0a5
Figure A6. The potential distribution of Q. acuta under future climate conditions. (ac) indicate the potential distribution at three periods under SSP1-2.6, respectively; (df) indicate the potential distribution at three periods under SSP2-4.5, respectively; (gi) indicate the potential distribution at three periods under SSP3-7.0, respectively.
Forests 14 00087 g0a6

References

  1. Mijnsbrugge, V.K.; Bischoff, A.; Smith, B. A question of origin: Where and how to collect seed for ecological restoration. Basic Appl. Ecol. 2010, 11, 300–311. [Google Scholar] [CrossRef] [Green Version]
  2. IPCC. Summary for Policymakers. In Climate Change 2021: The Physical Science Basis. Contribution of Working Group I to the Sixth Assessment Report of the Intergovernmental Panel on Climate Change; Cambridge University Press: Cambridge, UK; New York, NY, USA, 2021; pp. 3–32. [Google Scholar] [CrossRef]
  3. IPCC. Summary for Policymakers. In Global Warming of 1.5 °C. An IPCC Special Report on the Impacts of Global Warming of 1.5 °C above Pre-Industrial Levels and Related Global Greenhouse Gas Emission Pathways, in the Context of Strengthening the Global Response to the Threat of Climate Change, Sustainable Development, and Efforts to Eradicate Poverty; Cambridge University Press: Cambridge, UK; New York, NY, USA, 2018; pp. 3–24. [Google Scholar] [CrossRef]
  4. Shim, S.; Kwon, S.H.; Lim, Y.J.; Yum, S.S.; Byun, Y.H. Understanding climate change over East Asia under stabilized 1.5 and 2.0 °C global warming scenarios. Atmosphere 2019, 29, 391–401. [Google Scholar] [CrossRef]
  5. Oh, Y.J.; Kim, M.H.; Choi, S.K.; Kim, M.K.; Eo, J.U.; Yeob, S.J. Prediction of the spatial distribution of suitable habitats for Geranium carolinianum under SSP scenarios. Ecol. Resilient Infrastruct. 2021, 8, 154–163. [Google Scholar] [CrossRef]
  6. Xu, W.; Sun, H.; Jin, J.; Cheng, J. Predicting the Potential Distribution of Apple Canker Pathogen (Valsa mali) in China under Climate Change. Forests 2020, 11, 1126. [Google Scholar] [CrossRef]
  7. Canturk, U.; Kulaç, Ş. The effects of climate change scenarios on Tilia ssp. in Turkey. Environ. Monit. Assess. 2021, 193, 1–15. [Google Scholar] [CrossRef]
  8. Gao, X.; Liu, J.; Huang, Z. The impact of climate change on the distribution of rare and endangered tree Firmiana kwangsiensis using the Maxent modeling. Ecol. Evol. 2022, 12, e9165. [Google Scholar] [CrossRef] [PubMed]
  9. Cho, S.J.; Kim, H.N. Changes in Major Crop Allocations and Shifts under Climate Change in Korea. Korean J. Agric. Manag. Policy 2022, 49, 191–211. [Google Scholar] [CrossRef]
  10. Yu, D.S.; Kwon, O.C.; Shin, M.S.; Kim, J.K.; Lee, S.H. Effects of Climatic Factors on the Nationwide Distribution of Wild Aculeata (Insecta: Hymenoptera). Korean J. Environ. Ecol. 2022, 36, 303–317. [Google Scholar] [CrossRef]
  11. O’Neill, B.C.; Kriegler, E.; Ebi, K.L.; Kem-Benedict, E.; Riahi, K.; Rothman, D.S.; Ruijven, B.J.; Vuuren, D.P.; Birkmann, J.; Kok, K.; et al. The roads ahead: Narratives for shared socioeconomic pathways describing world futures in the 21st century. Glob. Env. Chang. 2017, 42, 169–180. [Google Scholar] [CrossRef] [Green Version]
  12. Booth, T.H. Why understanding the pioneering and continuing contributions of BIOCLIM to species distribution modelling is important. Austral Ecol. 2018, 43, 852–860. [Google Scholar] [CrossRef] [Green Version]
  13. Brown, J.L. SDM toolbox: A python-based GIS toolkit for landscape genetic, biogeographic and species distribution model analyses. Methods Ecol. Evol. 2014, 5, 694–700. [Google Scholar] [CrossRef]
  14. Elith, J.; Leathwick, J.R. Species distribution models: Ecological explenation and prediction across space and time. Annu. Rev. Ecol. Evol. Syst. 2009, 40, 677–697. [Google Scholar] [CrossRef]
  15. Phillips, S.J.; Dudík, M. Modeling of species distributions with Maxent: New extensions and acomprehensive evaluation. Ecography 2008, 31, 161–175. [Google Scholar] [CrossRef]
  16. Kim, C.Y.; Kim, W.M.; Song, W.K.; Choi, J.Y. A study on the range of native seed habitat analysis using Seed zones and MaxEnt. J. Korean Soc. Environ. Restor. Technol. 2022, 25, 57–74. [Google Scholar] [CrossRef]
  17. Jian, S.; Zhu, T.; Wang, J.; Yan, D. The Current and Future Potential Geographical Distribution and Evolution Process of Catalpa bungei in China. Forests 2022, 13, 96. [Google Scholar] [CrossRef]
  18. Li, Y.; Shao, W.; Jiang, J. Predicting the potential global distribution of Sapindus mukorossi under climate change based on MaxEnt modelling. Environ. Sci. Pollut. Res. 2022, 29, 21751–21768. [Google Scholar] [CrossRef]
  19. Shao, M.; Wang, L.; Li, B.; Li, S.; Fan, J.; Li, C. Maxent Modeling for Identifying the Nature Reserve of Cistanche deserticola Ma under Effects of the Host (Haloxylon Bunge) Forest and Climate Changes in Xinjiang, China. Forests 2022, 13, 189. [Google Scholar] [CrossRef]
  20. Kwon, H.S.; Ryu, J.E.; Seo, C.W.; Kim, J.Y.; Lim, D.O.; Suh, M.H. A study on distribution characteristics of corylopsis coreana using SDM. J. Environ. Impact Assess. 2012, 21, 735–743. [Google Scholar] [CrossRef]
  21. Yu, S.B.; Kim, B.D.; Shin, H.T.; Kim, S.J. Habitat climate characteristics of Lauraceae evergreen broad-leaved trees and distribution change according to climate change. Korean J. Environ. Ecol. 2020, 34, 503–514. [Google Scholar] [CrossRef]
  22. Campbell, R.K. Soils, Seed-Zone Maps, and Physiography: Guidelines for Seed Transfer of Douglas-Fir in Southwestern Oregon. For. Sci. 1991, 37, 4973–4986. [Google Scholar] [CrossRef]
  23. Crow, T.M.; Albeke, S.E.; Buerkle, C.A.; Hufford, K.M. Provisional methods to guide species-specific seed transfer in ecological restoration. Ecosphere 2018, 9, 1–14. [Google Scholar] [CrossRef]
  24. Omernik, J.M.; Chapman, S.S.; Lillie, R.A.; Dumke, R.T. Transactions of the Wisconsin Academy of Sciences, Arts and Letters. Ecoregions Wis. 2000, 88, 77–103. [Google Scholar]
  25. Olson, D.M.; Dinerstein, E.; Wikramanayake, E.D.; Burgess, N.D.; Underwood, E.C.; D’amico, J.A.; Itoua, I.; Strand, H.E.; Morrison, J.C.; Loucks, C.J.; et al. Terrestrial Ecoregions of the World: A New Map of Life on Earth. BioScience 2001, 51, 933–938. [Google Scholar] [CrossRef]
  26. Bower, A.D.; Bradley, J.; Clair, S.; Erickson, V. Generalized provisional seed zones for native plants. Ecol. Appl. 2014, 24, 913–919. [Google Scholar] [CrossRef]
  27. Doherty, K.D.; Butterfield, B.J.; Wood, T.E. Matching seed to site by climate similarity: Techniques to prioritize plant materials development and use in restoration. Ecol. Appl. 2017, 27, 1010–1023. [Google Scholar] [CrossRef]
  28. Lee, B.; Chung, J.; Kwon, D.S. Analysis of site suitability of forest stands for extracting sap of Acer pictum var. mono using GIS and fuzzy sets. J. Korean Soc. For. Sci. 2006, 95, 38–44. [Google Scholar]
  29. Lee, C.B. Dendrology; Hangmoon Pub. Co.: Seoul, Republic of Korea, 1990; Volume 253. [Google Scholar]
  30. Um, T.W.; Kim, G.T. Distribution and Growth Characteristics of Acer pictum var mono in Relation to Topography and Soil in Mt. Joongwang, Gangwon Province. Korean Soc. Environ. Ecol. 2006, 20, 200–207. [Google Scholar]
  31. Song, J.H.; Hur, S.D. Analysis of leaf morphological variation of 11 natural populations of Acer pictum subsp mono (Maxim.) Ohashi. Korean J. Plant Resour. 2011, 24, 540–548. [Google Scholar] [CrossRef] [Green Version]
  32. Kim, G.T.; Kim, H.J.; Lee, J.H. Studies on the Community Structure, Samara and Leaf Shape of Three Natural Acer pictum subsp mono Forest. Korean J. Environ. Ecol. 2014, 28, 55–61. [Google Scholar] [CrossRef]
  33. Lee, C.B. Coloured Flora of Korea; Hyangmunsa: Seoul, Republic of Korea, 2014; Volume 1828. [Google Scholar]
  34. Oh, K.K. Plant community Structure of Evergreen broad-Leaved Forest in Mt. Turyunsan, Korea. Korean J. Environ. Ecol. 1994, 8, 43–57. [Google Scholar]
  35. Shin, H.C.; Park, N.C.; Song, H.K. The Vegetation Structure and Community Clssification of Quercus acuta in Warm-Temperate Region of Korean Peninsula. KFRI J. For. Sci. 1999, 60, 11–25. [Google Scholar]
  36. Yeo, U.S. Natural Regeneration Patterns and Strategies of Quercus acuta in Wando, Korea. Ph.D. Dissertation, Seoul National University, Seoul, Republic of Korea, 2005. [Google Scholar]
  37. Park, I.H. Structure and Dynamics of Quercus acuta, Quercus acutissima and Pinus rigida forests in Wando island. Korean J. Environ. Ecol. 2012, 26, 406–411. [Google Scholar]
  38. Kim, S.; Park, I.H. Growth and Fruiting Characteristics and No. of Acorns/tree Allometric Equations of Quercus acuta Thunb. in Wando Island, Korea. Korean J. Environ. Ecol. 2019, 33, 440–446. [Google Scholar] [CrossRef]
  39. Kim, C.S.; Lee, K.Y.; Koh, J.G.; Ryu, K.O.; Kang, Y.J. Correlations between Growth and Isozyme Variation in Open-Pollinated Progenies of Machius thunbergii. Res. Rep. For. Gen. Res. Inst. Korea 1995, 31, 53–60. [Google Scholar]
  40. Lee, S.H.; Lee, H.S.; Park, Y.S.; Hwang, B.; Kim, J.H.; Lee, H.Y. Screening of Immune Activation Activities in the Leaves of Dendropanax morbifera Lev. Korean J. Med. Crop Sci. 2002, 10, 109–115. [Google Scholar]
  41. Cha, Y.J.; Lee, J.W.; Kim, J.H.; Park, M.H.; Lee, S.Y. Major Components of Teas Manufactured with Leaf and Flower of Korean Native Camellia japonica L. Korean J. Med. Crop Sci. 2004, 12, 183–190. [Google Scholar]
  42. Lee, S.T.; Son, Y.M.; Lee, K.J.; Hwang, J.; Choi, J.C.; Shin, H.C.; Park, N.C. Aboveground carbon storage of Quercus acuta stands by thinning intensity. Korean J. Agric. For. Meteorol. 2005, 7, 282–288. [Google Scholar]
  43. Kang, H.M. Vegetation Characteristics of Evergreen Broad-Leaved Forest in the Duryunsan Provincial Park—Focusing on the Daeheungsa(Temple) Area. Korean J. Environ. Ecol. 2019, 33, 552–564. [Google Scholar] [CrossRef]
  44. Padalia, H.; Srivastava, V.; Kushwaha, S.P.S. Modeling potential invasion range of alien invasive species, Hyptis suaveolens (L.) Poit. in India: Comparison of MaxEnt and GARP. Ecol. Inform. 2014, 22, 36–43. [Google Scholar] [CrossRef]
  45. Ma, B.; Sun, J. Predicting the distribution of Stipa purpurea across the Tibetan Plateau via the MaxEnt model. BMC Ecol. 2018, 18, 1–12. [Google Scholar] [CrossRef] [Green Version]
  46. O’Donnell, M.S.; Ignizio, D.A. Bioclimatic Predictors for Supporting Ecological Applications in the Conterminous United States. US Geol. Surv. Data Ser. 2012, 691, 4–9. Available online: https://pubs.usgs.gov/ds/691/ (accessed on 27 June 2022).
  47. Hong, K.O.; Suh, M.S.; Rha, D.K.; Chang, D.H.; Kim, C.; Kim, M.K. Estimation of high resolution gridded temperature using GIS and PRISM. Atmosphere 2007, 17, 255–268. [Google Scholar]
  48. Cho, J.P.; Kim, J.U.; Choi, S.K.; Hwang, S.W.; Jung, H.C. Variability analysis of climate extreme index using downscaled multi-models and grid-based CMIP5 climate change scenario data. J. Clim. Chang. Res. 2020, 11, 123–132. [Google Scholar] [CrossRef]
  49. Elith, J.; Phillips, S.J.; Hastie, T.; Dudík, M.; Chee, Y.E.; Yates, C.J. A statistical explanation of MaxEnt for ecologists. Divers. Distrib. 2011, 17, 43–57. [Google Scholar] [CrossRef]
  50. Warren, D.L.; Seifert, S.N. Ecological niche modeling in Maxent: The importance of model complexity and the performance of model selection criteria. Ecol. Appl. 2011, 21, 335–342. [Google Scholar] [CrossRef] [PubMed] [Green Version]
  51. Kramer-Schadt, S.; Niedballa, J.; Pilgrim, J.D.; Schröder, B.; Lindenborn, J.; Reinfelder, V.; Stillfried, M.; Heckmann, I.; Scharf, A.K.; Augeri, D.M.; et al. The importance of correcting for sampling bias in MaxEnt species distribution models. Divers. Distrib. 2013, 19, 1366–1379. [Google Scholar] [CrossRef]
  52. Yackulic, C.B.; Chandler, R.; Zipkin, E.F.; Royle, J.A.; Nichols, J.D.; Campbell Grant, E.H.; Veran, S. Presence-only modelling using MAXENT: When can we trust the inferences? Methods Ecol. Evol. 2013, 4, 236–243. [Google Scholar] [CrossRef]
  53. Swets, J. Measuring the accuracy of diagnostic systems. Science 1988, 240, 1285–1293. [Google Scholar] [CrossRef] [Green Version]
  54. Youtie, B.; Shaw, N.; Fisk, M.; Jensen, S. A strategy for maximizing native plant material diversity for ecological restoration, germplasm conservation and genecology research. In Proceedings of the 8th European Conference on Ecological Restoration, České Budějovice, Czech Republic, 9–14 September 2012; pp. 9–14. [Google Scholar]
  55. Bower, A.D. Ecological genetics and seed transfer guidelines for Pinus albicaulis (Pinaceae). Am. J. Bot. 2008, 95, 66–76. [Google Scholar] [CrossRef]
  56. Johnson, R.C.; Erickson, V.J.; Mandel, N.L.; St Clair, J.B.; Vance-Borland, K.W. Mapping genetic variation and seed zones for Bromus carinatus in the Blue Mountains of eastern Oregon, USA. Botany 2010, 88, 725–736. [Google Scholar] [CrossRef]
  57. Pike, C.; Potter, K.M.; Berrang, P.; Crane, B.; Baggs, J.; Leites, L.; Luther, T. New seed-collection zones for the eastern United States: The eastern seed zone forum. J. For. 2020, 118, 444–451. [Google Scholar] [CrossRef] [Green Version]
  58. Schubert, G.H.; Pitcher, J.A. A Provisional Tree Seed-Zone and Cone-Crop Rating System for Arizona and New Mexico; Rocky Mountain Forest and Range Experiment Station, Forest Service, US Department of Agriculture: Fort Collins, CO, USA, 1973; Volume 105. [Google Scholar]
  59. Ying, C.C.; Yanchu, A.D. The development of British Columbia’s tree seed transfer guidelines:Purpose, concept, methodology, and implementation. For. Ecol. Manag. 2006, 227, 1–13. [Google Scholar] [CrossRef]
  60. Bezeng, B.S.; Morales-Castilla, I.; Bank, M.; Yessoufou, K.; Daru, B.H.; Davies, T.J. Climate change may reduce the spread of non-native species. Ecosphere 2017, 8, e01694. [Google Scholar] [CrossRef]
  61. Hamann, A.; Wang, T.L. Models of climatic normals for genecology and climate change studies in British Columbia. Agric. For. Meteorol. 2005, 128, 211–221. [Google Scholar] [CrossRef]
  62. Lee, S.H.; Heo, I.H.; Lee, K.M.; Kwon, W.T. Classification of local climatic regions in Korea. J. Korean Meteorol. Soc. 2005, 41, 983–995. [Google Scholar]
  63. Byun, J.G.; Lee, W.K.; Nor, D.K.; Kim, S.H.; Choi, J.K.; Lee, Y.J. The relationship between tree radial growth and topographic and climatic factors in red pine and oak in central regions of Korea. J. Korean Soc. For. Sci. 2010, 99, 908–913. [Google Scholar]
  64. Lee, S.; Choi, S.; Lee, W.K.; Park, T.; Oh, S.; Kim, S.N. Vulnerability assessment of forest distribution by the climate change scenarios. J. Korean Soc. For. Sci. 2011, 100, 256–265. [Google Scholar] [CrossRef]
  65. Koo, K.A.; Kim, J.; Kong, W.S.; Jung, H.; Kim, G. Projecting the potential distribution of Abies koreana in Korea under the climate change based on RCP scenarios. J. Korean Soc. Environ. Restor. Technol. 2016, 19, 19–30. [Google Scholar] [CrossRef]
  66. Choi, Y.E.; Choi, J.Y.; Kim, W.M.; Kim, S.Y.; Song, W.K. Long-term Effects on Forest Biomass under Climate Change Scenarios Using LANDIS-II-A case study on Yoengdong-gun in Chungcheongbuk-do, Korea. J. Korean Soc. Environ. Restor. Technol. 2019, 22, 27–43. [Google Scholar] [CrossRef]
  67. Kim, C.Y.; Kim, W.M.; Song, W.K.; Choi, J.Y. A Study on the Domestic Appllication of the Concept of Seed Transfer Zone in the US. J. Korean Soc. Environ. Restor. Technol. 2021, 24, 39–56. [Google Scholar] [CrossRef]
  68. Park, I.H.; Kim, S.D.; Park, J.W.; Chae, K.S.; Kim, G.T.; Um, T.W. Flowering Characteristics and Acorn Production of Quercus auta Thunb. in Wando Island, Korea. Korean J. Environ. Ecol. 2014, 28, 326–330. [Google Scholar] [CrossRef]
  69. Shin, M.Y.; Chung, S.Y.; Han, W.S.; Lee, D.K. Effects of microclimate of different site types on tree growth in natural deciduous forest. Korean J. Agric. For. Meteorol. 2008, 10, 9–16. [Google Scholar] [CrossRef]
  70. Yang, H.M.; Kim, J.H. Selection of Desirable Species by the Estimation of Dominant and Potential Dominant Species in the Natural Deciduous Forest. For. Bioenergy 2002, 21, 77–88. [Google Scholar]
  71. Um, T.W.; Lee, D.K. Distribution of major deciduous tree species in relation to the characteristics of topography in Mt. Joongwang, Gangwon Province (I). J. Korean Soc. For. Sci. 2006, 95, 91–101. [Google Scholar]
  72. Shin, M.S.; Seo, C.; Park, S.U.; Hong, S.B.; Kim, J.Y.; Jeon, J.Y.; Lee, M. Prediction of potential habitat of Japanese evergreen oak (Quercus acuta Thunb.) considering dispersal ability under climate change. J. Environ. Impact Assess. 2018, 27, 291–306. [Google Scholar] [CrossRef]
  73. Park, J.H.; Jung, S.Y.; Lee, K.S.; Lee, H.S. The Characteristics and Survival Rates of Evergreen Broad-Leaved Tree Plantations in Korea. J. Korean Soc. For. Sci. 2019, 108, 513–521. [Google Scholar] [CrossRef]
  74. Yang, K.C.; Shim, J.K. Distribution of major plant communities based on the climatic conditions and topographic features in South Korea. Korean J. Environ. Biol. 2007, 25, 168–177. [Google Scholar]
  75. Nakao, K.; Matsui, T.; Horikawa, M.; Tsuyama, I.; Tanaka, N. Assessing the impact of land use and climate change on the evergreen broad-leaved species of Quercus acuta in Japan. Plant Ecol. 2011, 212, 229–243. [Google Scholar] [CrossRef]
  76. Yun, J.H.; Nakao, K.; Park, C.H.; Lee, B.Y.; Oh, K.H. Change prediction for potential habitats of warm-temperate evergreen broad-leaved trees in Korea by climate change. Korean J. Environ. Ecol. 2011, 25, 590–600. [Google Scholar]
  77. Oh, S.N.; Ha, K.J.; Kim, K.Y.; Kim, J.W. Effects of land hydrology in northeastern asia in a doubling CO2 climate experiment. Korean J. Atmos. Sci. 1998, 34, 293–305. [Google Scholar]
  78. Park, H.S. Acer pictum subsp. mono properties and proliferation. Landscaping Tree 2002, 70, 21–23. [Google Scholar]
  79. An, J.M.; Kim, J.S.; Kang, H.M. A study on Patterns of Sap Water Users of Acer mono. J. Korean Soc. For. Sci. 1998, 87, 510–518. [Google Scholar]
  80. Cha, D.W.; Oh, C.H. Flora and Vegetation Characteristics of Gwangyang Mt. Baegun ‘Acer pictum Thunb. var mono (Maxim.) Maxim. ex Franch’ Plantation. Proc. Korean Soc. Environ. Ecol. Conf. 2021, 31, 3. [Google Scholar]
  81. Kwon, S.H.; Kim, J.S.; Byun, Y.H.; Bu, K.O.; Seo, J.B.; Seon, M.A.; Seong, H.M.; Shim, S.B.; Lee, J.H.; Lim, Y.J. Revision of the Global Outlook Report; National Institute of Meteorological Sciences: Seogwipo, Republic of Korea, 2020. [Google Scholar]
  82. Park, S.U.; Koo, K.A.; Kong, W.S. Potential Impact of Climate Change on Distribution of Warm Temperate Evergreen Broad-leaved Trees in the Korean Peninsula. J. Korean Geogr. Soc. 2016, 51, 201–217. [Google Scholar]
  83. Kim, K.H.; Choi, J.Y. Ecological Restoration Methods Development Using Native Speciesin DMZ Vicinities; Ministry of Environment: Tokyo, Japan, 2017; pp. 1–1041. [Google Scholar] [CrossRef]
  84. Hu, X.G.; Wang, T.; Liu, S.S.; Jiao, S.Q.; Jia, K.H.; Zhou, S.S.; Jin, Y.; Li, Y.; El-Kassaby, Y.A.; Mao, J.F. Predicting future seed sourcing of Platycladus orientalis (L.) for future climates using climate niche models. Forests 2017, 8, 471. [Google Scholar] [CrossRef] [Green Version]
  85. Eckert, A.J.; Bower, A.D.; GONZÁLEZ-MARTÍNEZ, S.C.; Wegrzyn, J.L.; Coop, G.; Neale, D.B. Back to nature: Ecological genomics of loblolly pine (Pinus taeda, Pinaceae). Mol. Ecol. 2010, 19, 3789–3805. [Google Scholar] [CrossRef] [Green Version]
  86. Johnson, R.C.; Cashman, M.J.; Vance-Borland, K. Genecology and seed zones for Indian ricegrass collected in the southwestern United States. Rangel. Ecol. Manag. 2012, 65, 523–532. [Google Scholar] [CrossRef]
  87. Keller, M.; Kollmann, J. Effects of seed provenance on germination of herbs for agricultural compensation sites. Agric. Ecosyst. Environ. 1999, 72, 87–99. [Google Scholar] [CrossRef]
  88. Pike, C.C.; Hernandez, G.; Crane, B.; Berrang, P. Development for Seed Zones in the Eastern United States: Request for Input and Collaboration! General Technical Report PNW-GTR-963; U.S. Forest Service, Pacific Northwest Research Station: Portland, OR, USA, 2017; Volume 30. Available online: https://www.fs.usda.gov/research/treesearch/55237 (accessed on 21 October 2022).
  89. John, J.G.; Blanton, C.; McHugh, C.; Radhakrishnan, A.; Rand, K.; Vahlenkamp, H.; Wilson, C.; Zadeh, N.T.; Dunne, J.P.; Dussin, R.; et al. NOAA-GFDL GFDL-ESM4 Model Output Prepared for CMIP6 ScenarioMIP; Earth System Grid Federation: Seattle, WA, USA, 2018. [Google Scholar] [CrossRef]
  90. Yukimoto, S.; Koshiro, T.; Kawai, H.; Oshima, N.; Yoshida, K.; Urakawa, S.; Tsujino, H.; Deushi, M.; Tanaka, T.; Hosaka, M.; et al. MRI MRI-ESM2.0 Model Output Prepared for CMIP6 ScenarioMIP; Earth System Grid Federation: Seattle, WA, USA, 2019. [Google Scholar] [CrossRef]
  91. Voldoire, A. CNRM-CERFACS CNRM-CM6-1 Model Output Prepared for CMIP6 ScenarioMIP; Earth System Grid Federation: Seattle, WA, USA, 2019. [Google Scholar] [CrossRef]
  92. Seferian, R. CNRM-CERFACS CNRM-ESM2-1 Model Output Prepared for CMIP6 ScenarioMIP; Earth System Grid Federation: Seattle, WA, USA, 2019. [Google Scholar] [CrossRef]
  93. Boucher, O.; Denvil, S.; Levavasseur, G.; Cozic, A.; Caubel, A.; Foujols, M.A.; Meurdesoif, Y.; Cadule, P.; Devilliers, M.; Dupont, E.; et al. IPSL IPSL-CM6A-LR Model Output Prepared for CMIP6 ScenarioMIP; Earth System Grid Federation: Seattle, WA, USA, 2019. [Google Scholar] [CrossRef]
  94. Schupfner, M.; Wieners, K.H.; Wachsmann, F.; Steger, C.; Bittner, M.; Jungclaus, J.; Früh, B.; Pankatz, K.; Giorgetta, M.; Reick, C.; et al. CMIP6 CMIP DKRZ MPI-ESM1-2-HR amip-RCM-Forcing Data; World Data Center for Climate (WDCC) at DKRZ: Hamburg, Germany, 2019. [Google Scholar] [CrossRef]
  95. Wieners, K.H.; Giorgetta, M.; Jungclaus, J.; Reick, C.; Esch, M.; Bittner, M.; Gayler, V.; Haak, H.; de Vrese, P.; Raddatz, T.; et al. MPI-M MPIESM1.2-LR Model Output Prepared for CMIP6 ScenarioMIP; Earth System Grid Federation: Seattle, WA, USA, 2019. [Google Scholar] [CrossRef]
  96. Good, P.; Sellar, A.; Tang, Y.; Rumbold, S.; Ellis, R.; Kelley, D.; Kuhlbrodt, T.; Walton, J. MOHC UKESM1.0-LL Model Output Prepared for CMIP6 ScenarioMIP; Earth System Grid Federation: Seattle, WA, USA, 2019. [Google Scholar] [CrossRef]
  97. Dix, M.; Bi, D.; Dobrohotoff, P.; Fiedler, R.; Harman, I.; Law, R.; Mackallah, C.; Marsland, S.; O’Farrell, S.; Rashid, H.; et al. CSIRO-ARCCSS ACCESS-CM2 Model Output Prepared for CMIP6 ScenarioMIP; Earth System Grid Federation: Seattle, WA, USA, 2019. [Google Scholar] [CrossRef]
  98. Ziehn, T.; Chamberlain, M.; Lenton, A.; Law, R.; Bodman, R.; Dix, M.; Wang, Y.; Dobrohotoff, P.; Srbinovsky, J.; Stevens, L.; et al. CSIRO ACCESS-ESM1.5 Model Output Prepared for CMIP6 ScenarioMIP; Earth System Grid Federation: Seattle, WA, USA, 2019. [Google Scholar] [CrossRef]
  99. Swart, N.C.; Cole, J.N.S.; Kharin, V.V.; Lazare, M.; Scinocca, J.F.; Gillett, N.P.; Anstey, J.; Arora, V.; Christian, J.R.; Jiao, Y.; et al. CCCma CanESM5 model Output Prepared for CMIP6 ScenarioMIP; Earth System Grid Federation: Seattle, WA, USA, 2019. [Google Scholar] [CrossRef]
  100. Volodin, E.; Mortikov, E.; Gritsun, A.; Lykossov, V.; Galin, V.; Diansky, N.; Gusev, A.; Kostrykin, S.; Iakovlev, N.; Shestakova, A.; et al. INM INM-CM4-8 Model Output Prepared for CMIP6 ScenarioMIP; Earth System Grid Federation: Seattle, WA, USA, 2019. [Google Scholar] [CrossRef]
  101. Volodin, E.; Mortikov, E.; Gritsun, A.; Lykossov, V.; Galin, V.; Diansky, N.; Gusev, A.; Kostrykin, S.; Iakovlev, N.; Shestakova, A.; et al. INM INM-CM5-0 Model Output Prepared for CMIP6 ScenarioMIP; Earth System Grid Federation: Seattle, WA, USA, 2019. [Google Scholar] [CrossRef]
  102. EC-Earth Consortium (EC-Earth). EC-Earth-Consortium EC-Earth3 Model Output Prepared for CMIP6 ScenarioMIP; Earth System Grid Federation: Seattle, WA, USA, 2019. [Google Scholar] [CrossRef]
  103. Shiogama, H.; Abe, M.; Tatebe, H. MIROC MIROC6 Model Output Prepared for CMIP6 ScenarioMIP; Earth System Grid Federation: Seattle, WA, USA, 2019. [Google Scholar] [CrossRef]
  104. Tachiiri, K.; Abe, M.; Hajima, T.; Arakawa, O.; Suzuki, T.; Komuro, Y.; Ogochi, K.; Watanabe, M.; Yamamoto, A.; Tatebe, H.; et al. MIROC MIROC-ES2L Model Output Prepared for CMIP6 ScenarioMIP; Earth System Grid Federation: Seattle, WA, USA, 2019. [Google Scholar] [CrossRef]
  105. Seland, Ø.; Bentsen, M.; Oliviè, D.J.L.; Toniazzo, T.; Gjermundsen, A.; Graff, L.S.; Debernard, J.B.; Gupta, A.K.; He, Y.; Kirkevåg, A.; et al. NCC NorESM2-LM Model Output Prepared for CMIP6 ScenarioMIP; Earth System Grid Federation: Seattle, WA, USA, 2019. [Google Scholar] [CrossRef]
  106. Byun, Y.H.; Lim, Y.J.; Shim, S.; Sung, H.M.; Sun, M.; Kim, J.; Kim, B.H.; Lee, J.H.; Moon, H. NIMS-KMA KACE1.0-G Model Output Prepared for CMIP6 ScenarioMIP; Earth System Grid Federation: Seattle, WA, USA, 2019. [Google Scholar] [CrossRef]
Figure 1. Species occurrence point: (a) A. pictum; (b) Q. acuta.
Forests 14 00087 g001
Figure 2. Predicted habitat suitability under current condition: (a) A. pictum; (b) Q. acuta.
Forests 14 00087 g002
Figure 3. Predicted habitat suitability of A. pictum in South Korea under future condition: (a) SSP5-8.5 Near future; (b) SSP5-8.5 Middle future; (c) SSP5-8.5 Far future.
Forests 14 00087 g003
Figure 4. Predicted habitat suitability of Q. acuta in South Korea under future conditions: (a) SSP5-8.5 Near future; (b) SSP5-8.5 Middle future; (c) SSP5-8.5 Far future.
Forests 14 00087 g004
Figure 5. Seed Transfer Zones in South Korea (34 zones).
Forests 14 00087 g005
Figure 6. Measures to apply STZs in South Korea’s forest policy.
Forests 14 00087 g006
Table 1. Environment variables entered into the model.
Environmental
Variables
DescriptionUnitData TypeData Soure
ClimateBio01Annual Mean Temperature°CContinuousRural Development Administration based SSPs Scenario
Bio02Mean Diurnal Range°CContinuous
Bio04Temperature Seasonality°CContinuous
Bio08Mean Temperature of Wettest Quarter°CContinuous
Bio12Annual PrecipitationmmContinuous
Bio15Precipitation Seasonality%Continuous
Bio18Precipitation of Warmest QuartermmContinuous
TopographyElevationDEMmContinuousMinistry of Environment,
Korea (2020)
SlopeSlope%Continuous
AspectAspect°Continuous
DrainageSoil drainage grade-CategoricalForest Service, Korea
(2020)
TerrainForest Soil Map-Categorical
Table 2. Percent contribution and permutation importance of the environmental variables.
Environmental
Variables
A. pictumQ. acuta
Percent
Contribution (%)
Permutation
Importance (%)
Percent
Contribution (%)
Permutation
Importance (%)
Bio010.10.00.00.0
Bio020.00.02.53.8
Bio042.92.35.43.9
Bio0811.228.014.741.5
Bio1223.831.756.724.4
Bio150.60.90.00.0
Bio181.22.01.30.0
Elevation9.13.01.40.4
Slope23.017.68.420.9
Aspect0.90.00.10.0
Drainage26.913.81.31.6
Terrain0.30.68.13.3
Table 3. The ratio of predicted area to total land area of South Korea for A. pictum under climate change using SSP1-2.6, SSP2-4.5, SSP3-7.0, and SSP5-8.5.
Suitability
Grade
SSP
Historical
Period
SSP1-2.6SSP2-4.5SSP3-7.0SSP5-8.5
Near
Future
Mid
Future
Far
Future
Near
Future
Mid
Future
Far
Future
Near
Future
Mid
Future
Far
Future
Near
Future
Mid
Future
Far
Future
No (%)57.8392.9094.3696.0596.2098.3893.4481.4493.8991.1896.9093.4689.75
Low (%)19.545.414.152.882.691.153.7910.753.504.552.464.184.60
Middle (%)11.231.151.100.800.750.261.883.991.342.110.481.862.53
High (%)7.970.110.350.220.320.150.842.050.841.230.110.472.38
Very High (%)3.410.100.020.020.040.060.051.770.430.920.010.010.72
Table 4. The ratio of predicted area to total land area of South Korea for Q. acuta under climate change using SSP1-2.6, SSP2-4.5, SSP3-7.0, and SSP5-8.5.
Suitability
Grade
SSP
Historical
Period
SSP1-2.6SSP2-4.5SSP3-7.0SSP5-8.5
Near
Future
Mid
Future
Far
Future
Near
Future
Mid
Future
Far
Future
Near
Future
Mid
Future
Far
Future
Near
Future
Mid
Future
Far
Future
No (%)99.8889.8870.4054.7487.2682.2178.8586.8856.0141.6584.7670.7220.18
Low (%)0.099.8915.9123.008.5210.8612.928.7623.2424.539.6615.2322.42
Middle (%)0.024.307.2511.603.024.755.633.1110.7516.463.997.4622.60
High (%)0.0081.614.847.810.981.792.140.996.8811.501.314.5817.62
Very High (%)0.0050.321.602.850.220.390.450.273.125.860.282.0117.18
Table 5. Potential high-density zone and ratio in STZs for the future period of the A. pictum and Q. acauta SSP scenario.
NoA. pictumQ. acuta
Scenario Seed Zone
(°F, °C/m)
Ratio
(%)
Seed Zone
(°F, °C/m)
Ratio
(%)
Historical15–20, 16–1914.5525–30, 19–2139.10
SSP1-2.6Near future10–15, 16–1915.0710–15, 19–2121.58
Mid future10–15, 16–1921.7710–15, 19–2119.25
Far future25–30, 19–2121.3510–15, 19–2116.93
SSP2-4.5Near future15–20, 16–1917.9810–15, 19–2124.93
Mid future25–30, 19–2137.7810–15, 19–2121.36
Far future20–25, 16–1922.7210–15, 16–1918.11
SSP3-7.0Near future15–20, 16–1917.2020–25, 19–2122.52
Mid future20–25, 16–1918.8520–25, 19–2117.96
Far future15–20, 16–1917.5920–25, 19–2116.53
SSP5-8.5Near future25–30, 19–2118.4010–15, 19–2128.13
Mid future20–25, 16–1923.1310–15, 19–2116.86
Far future20–25, 19–2120.6315–20, 19–2120.08
Disclaimer/Publisher’s Note: The statements, opinions and data contained in all publications are solely those of the individual author(s) and contributor(s) and not of MDPI and/or the editor(s). MDPI and/or the editor(s) disclaim responsibility for any injury to people or property resulting from any ideas, methods, instructions or products referred to in the content.

