
SRTM DEM Correction Based on PSO-DBN Model in Vegetated Mountain Areas

Abstract
:1. Introduction
2. Study Areas and Data
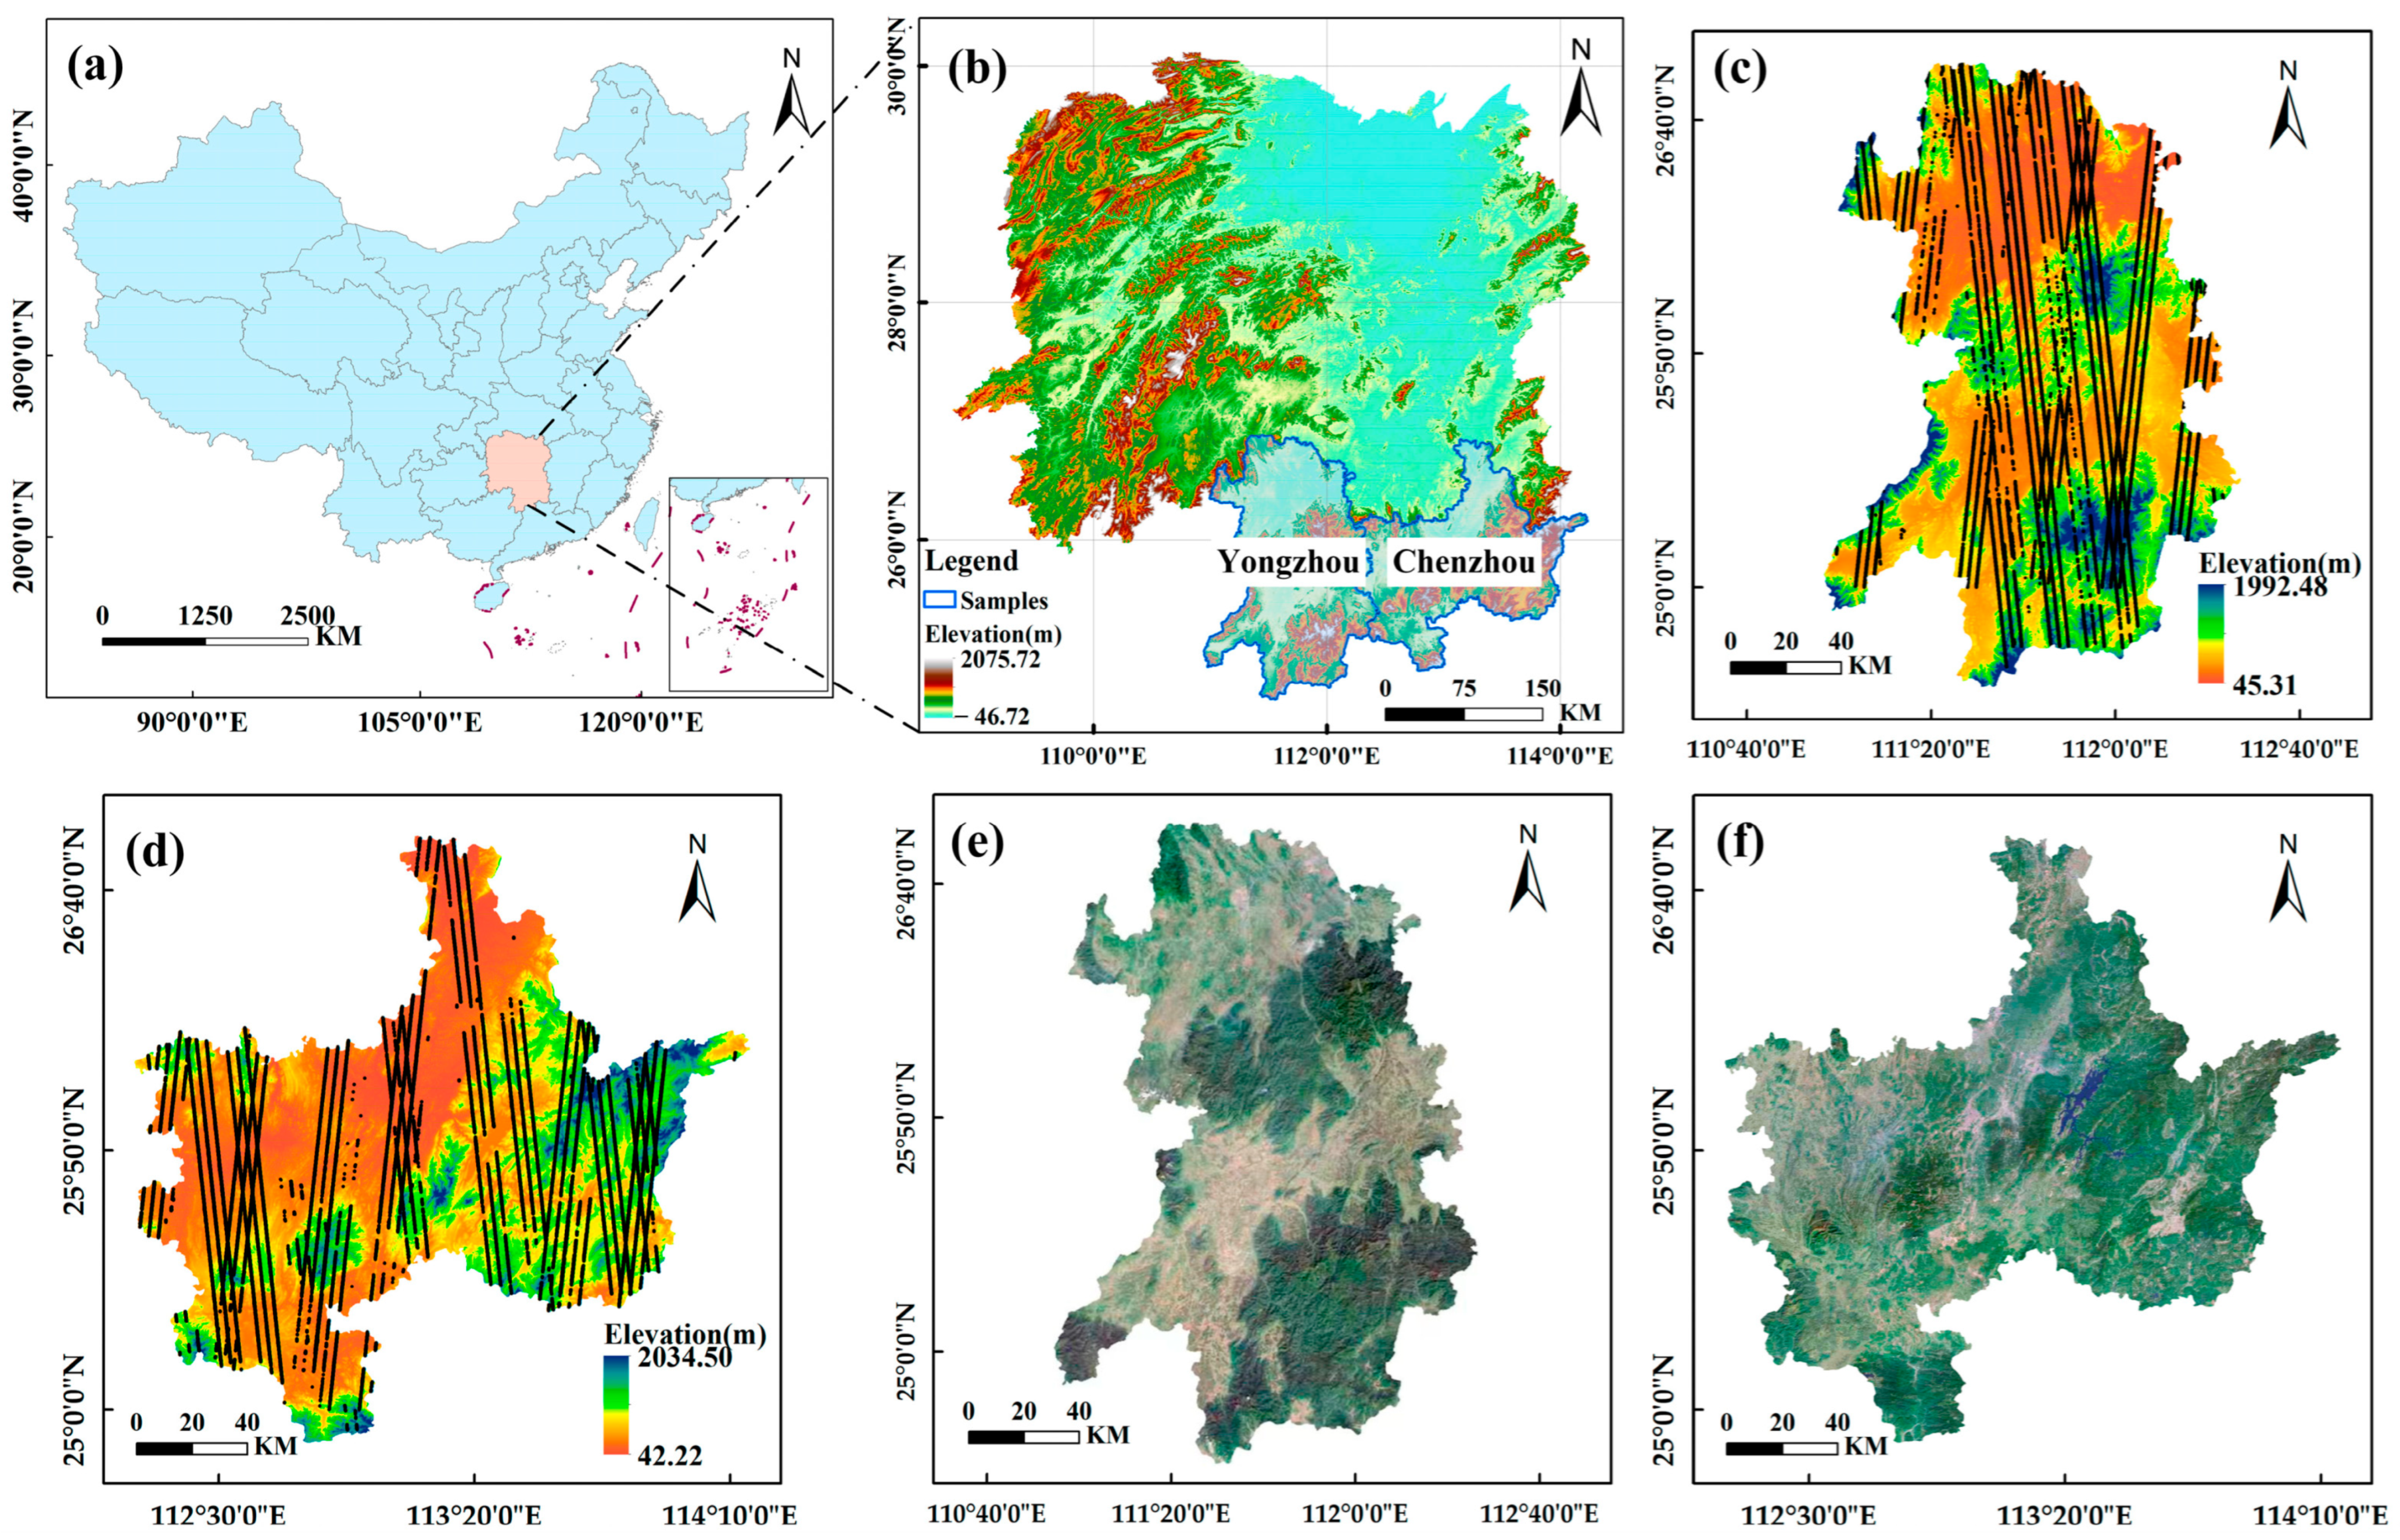
2.1. Study Areas
2.2. SRTM DEM
2.3. ICESat-2
2.4. Ancillary Data
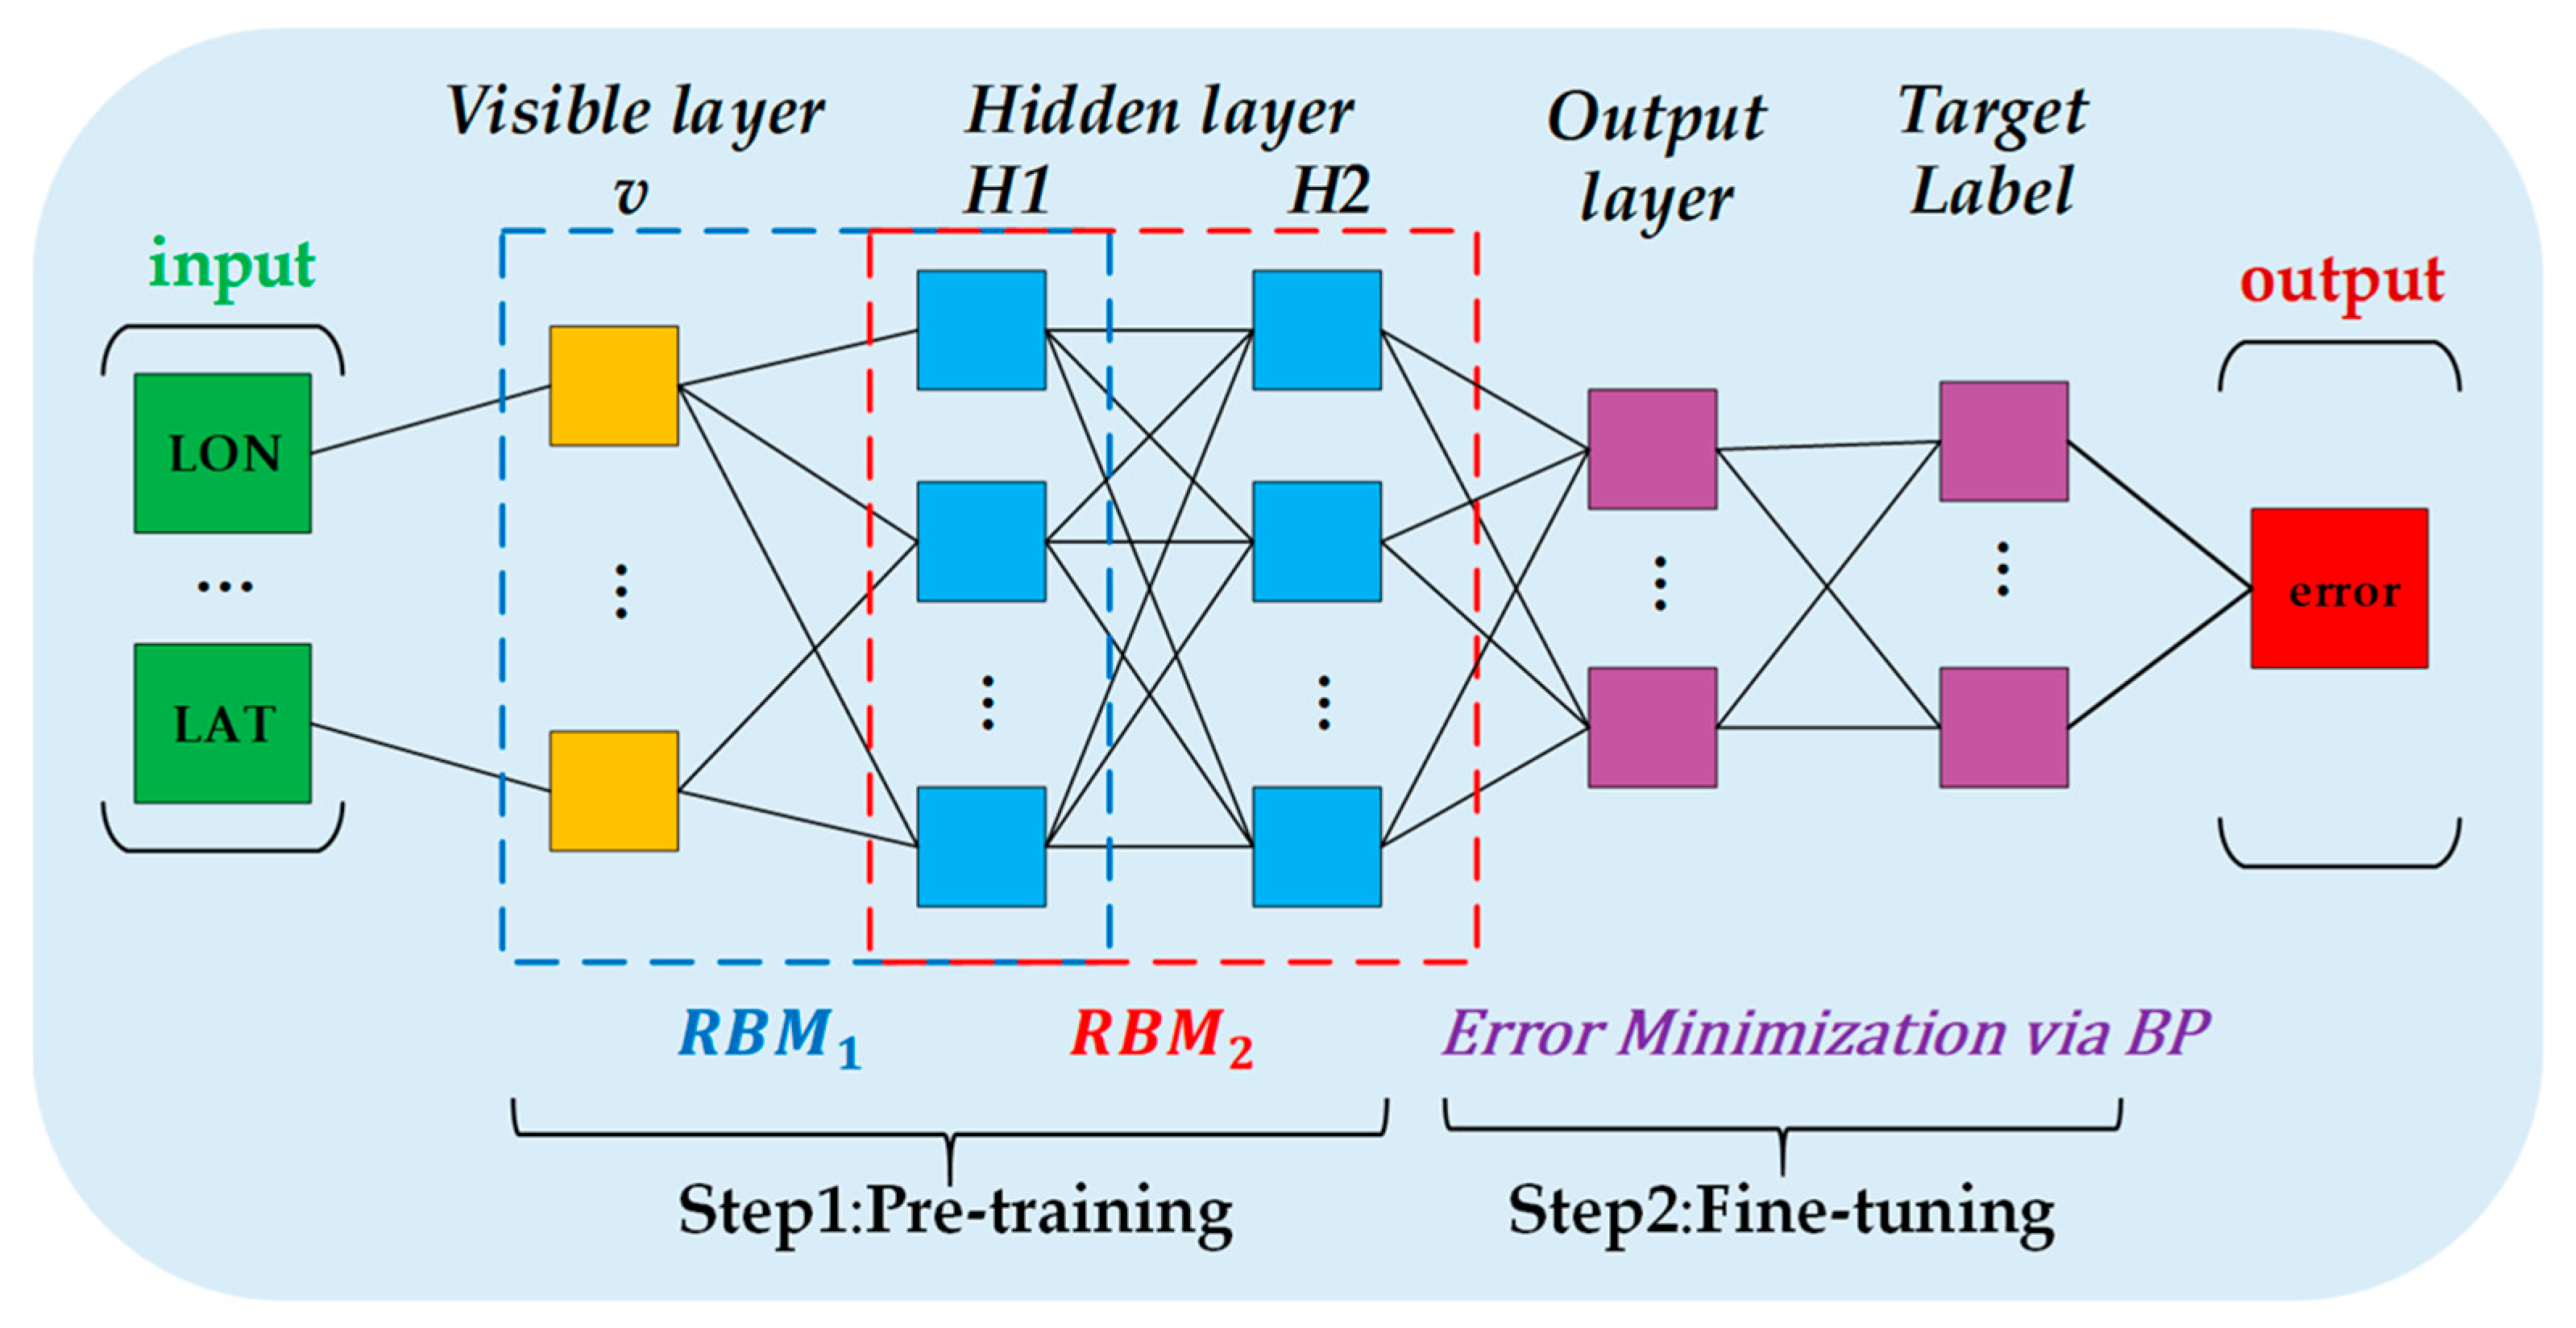
3. Methodology
4. Results and Discussion
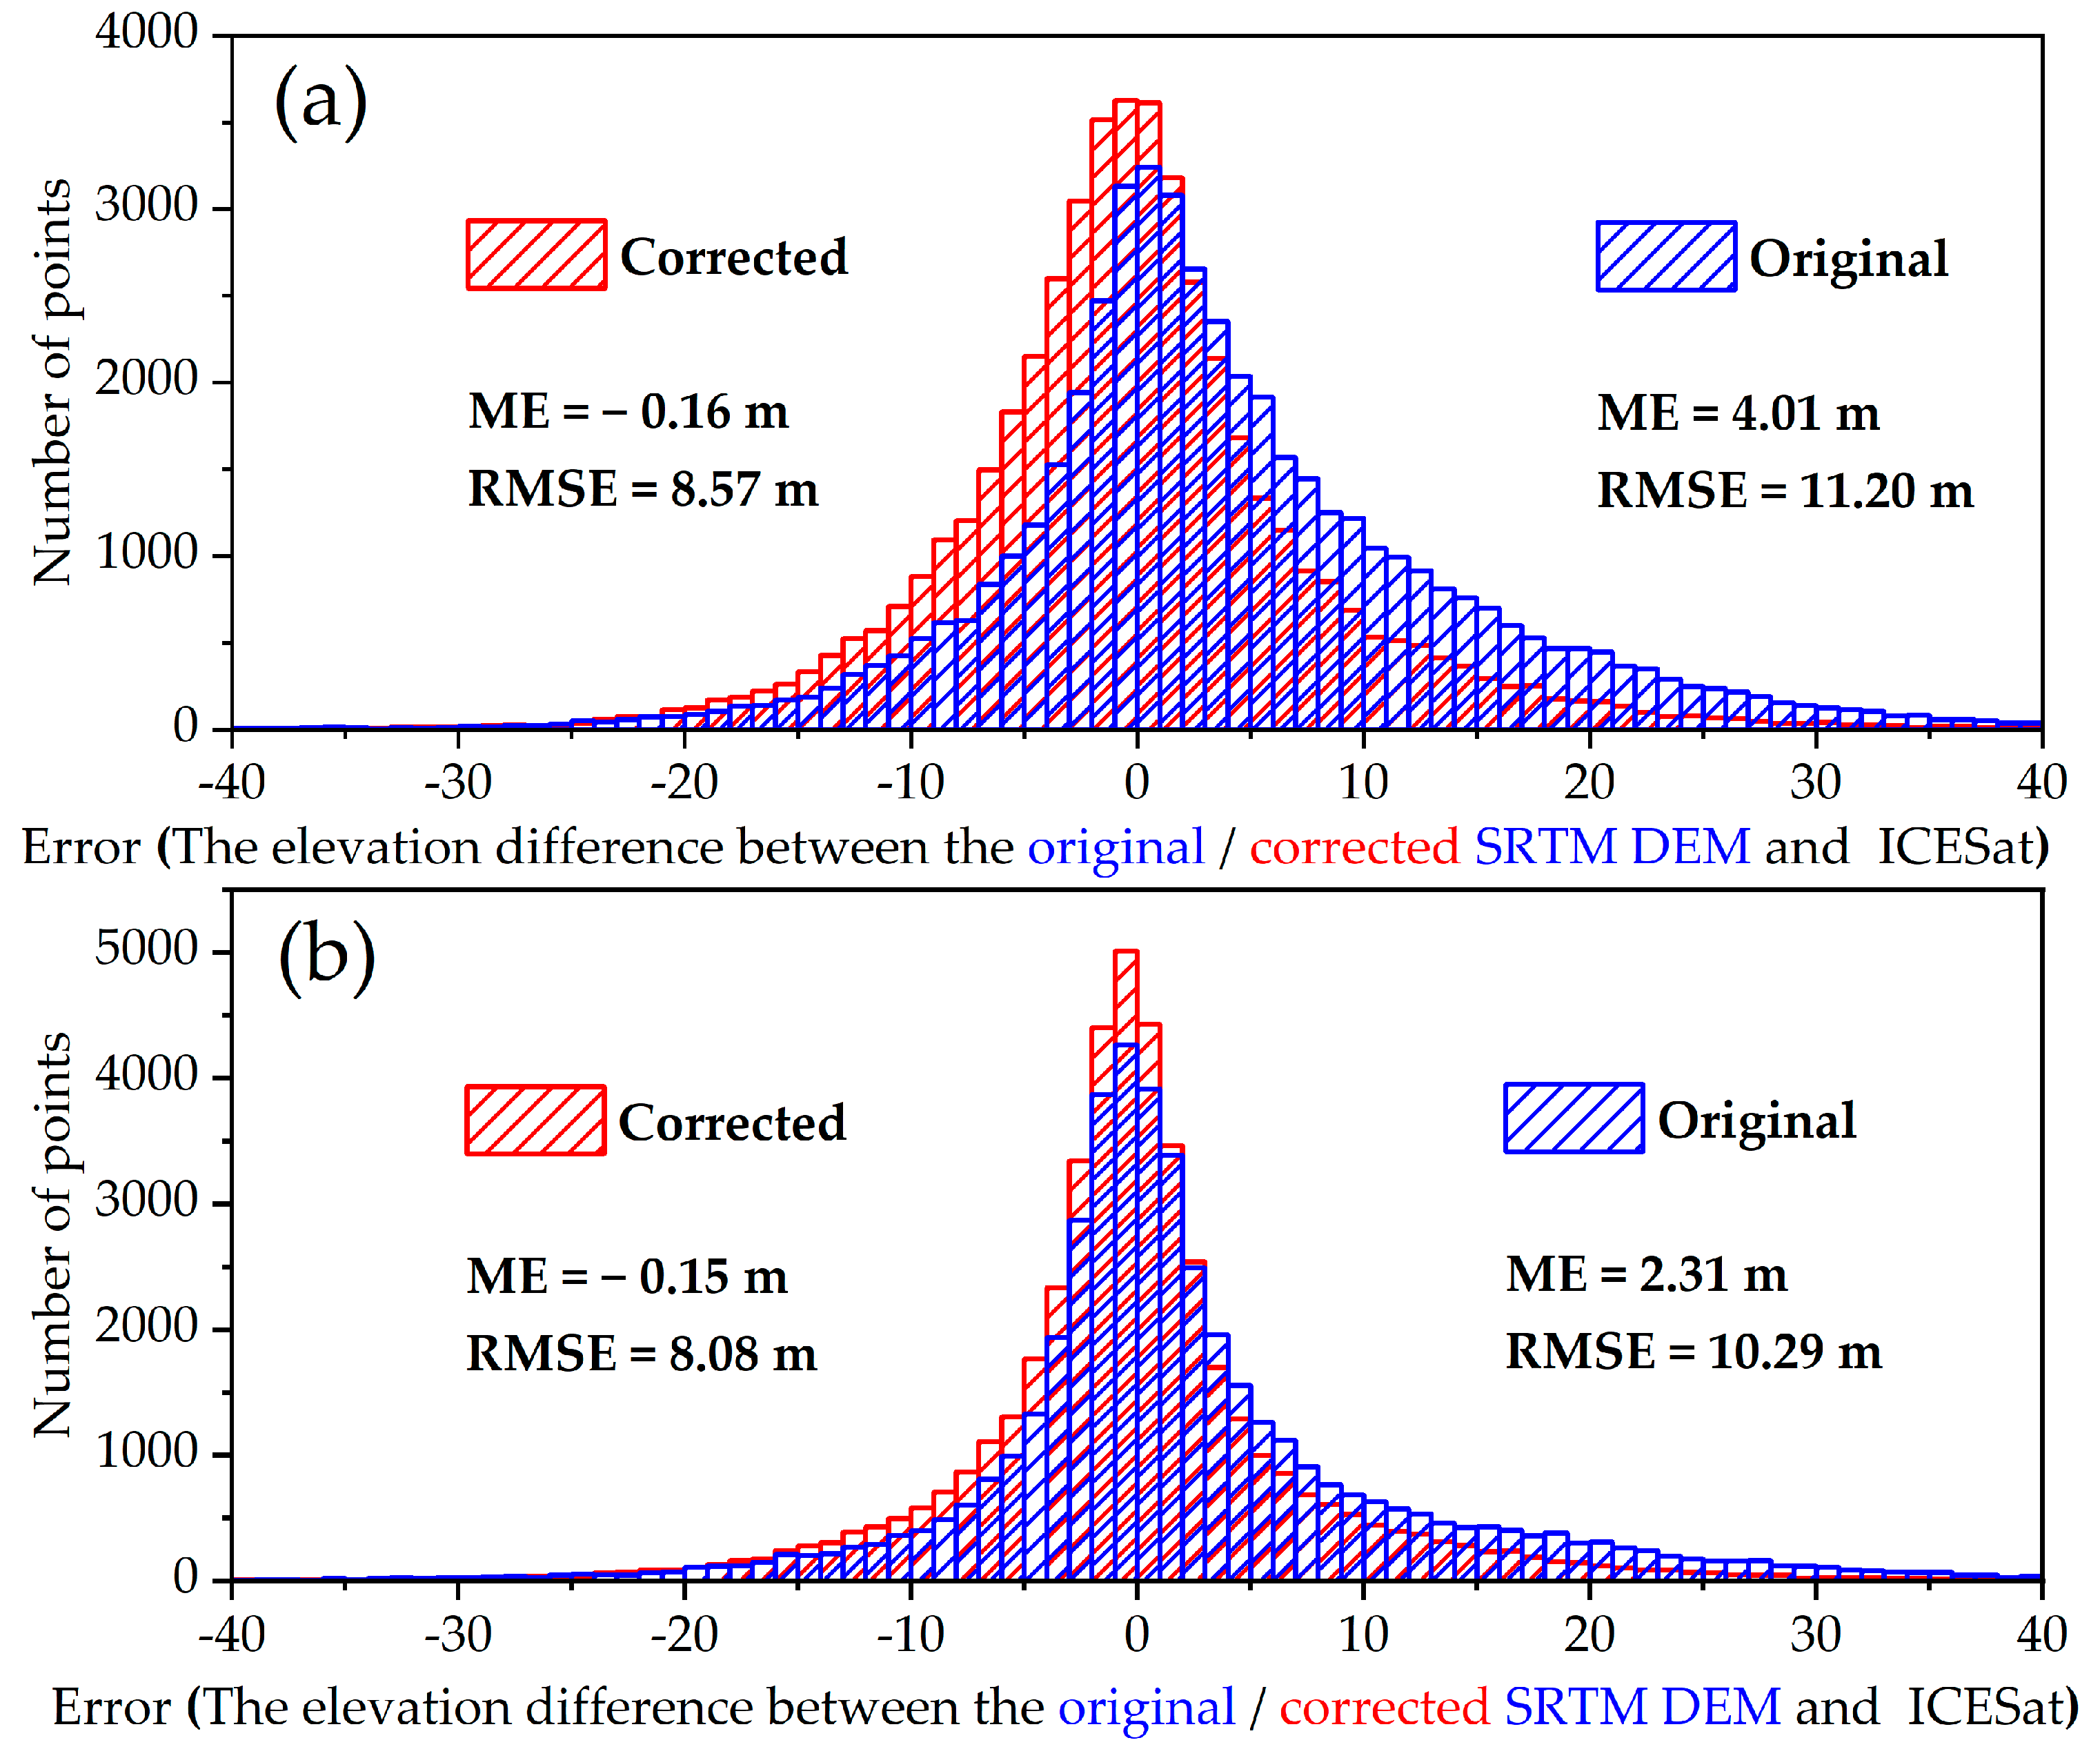
4.1. Overall Accuracy
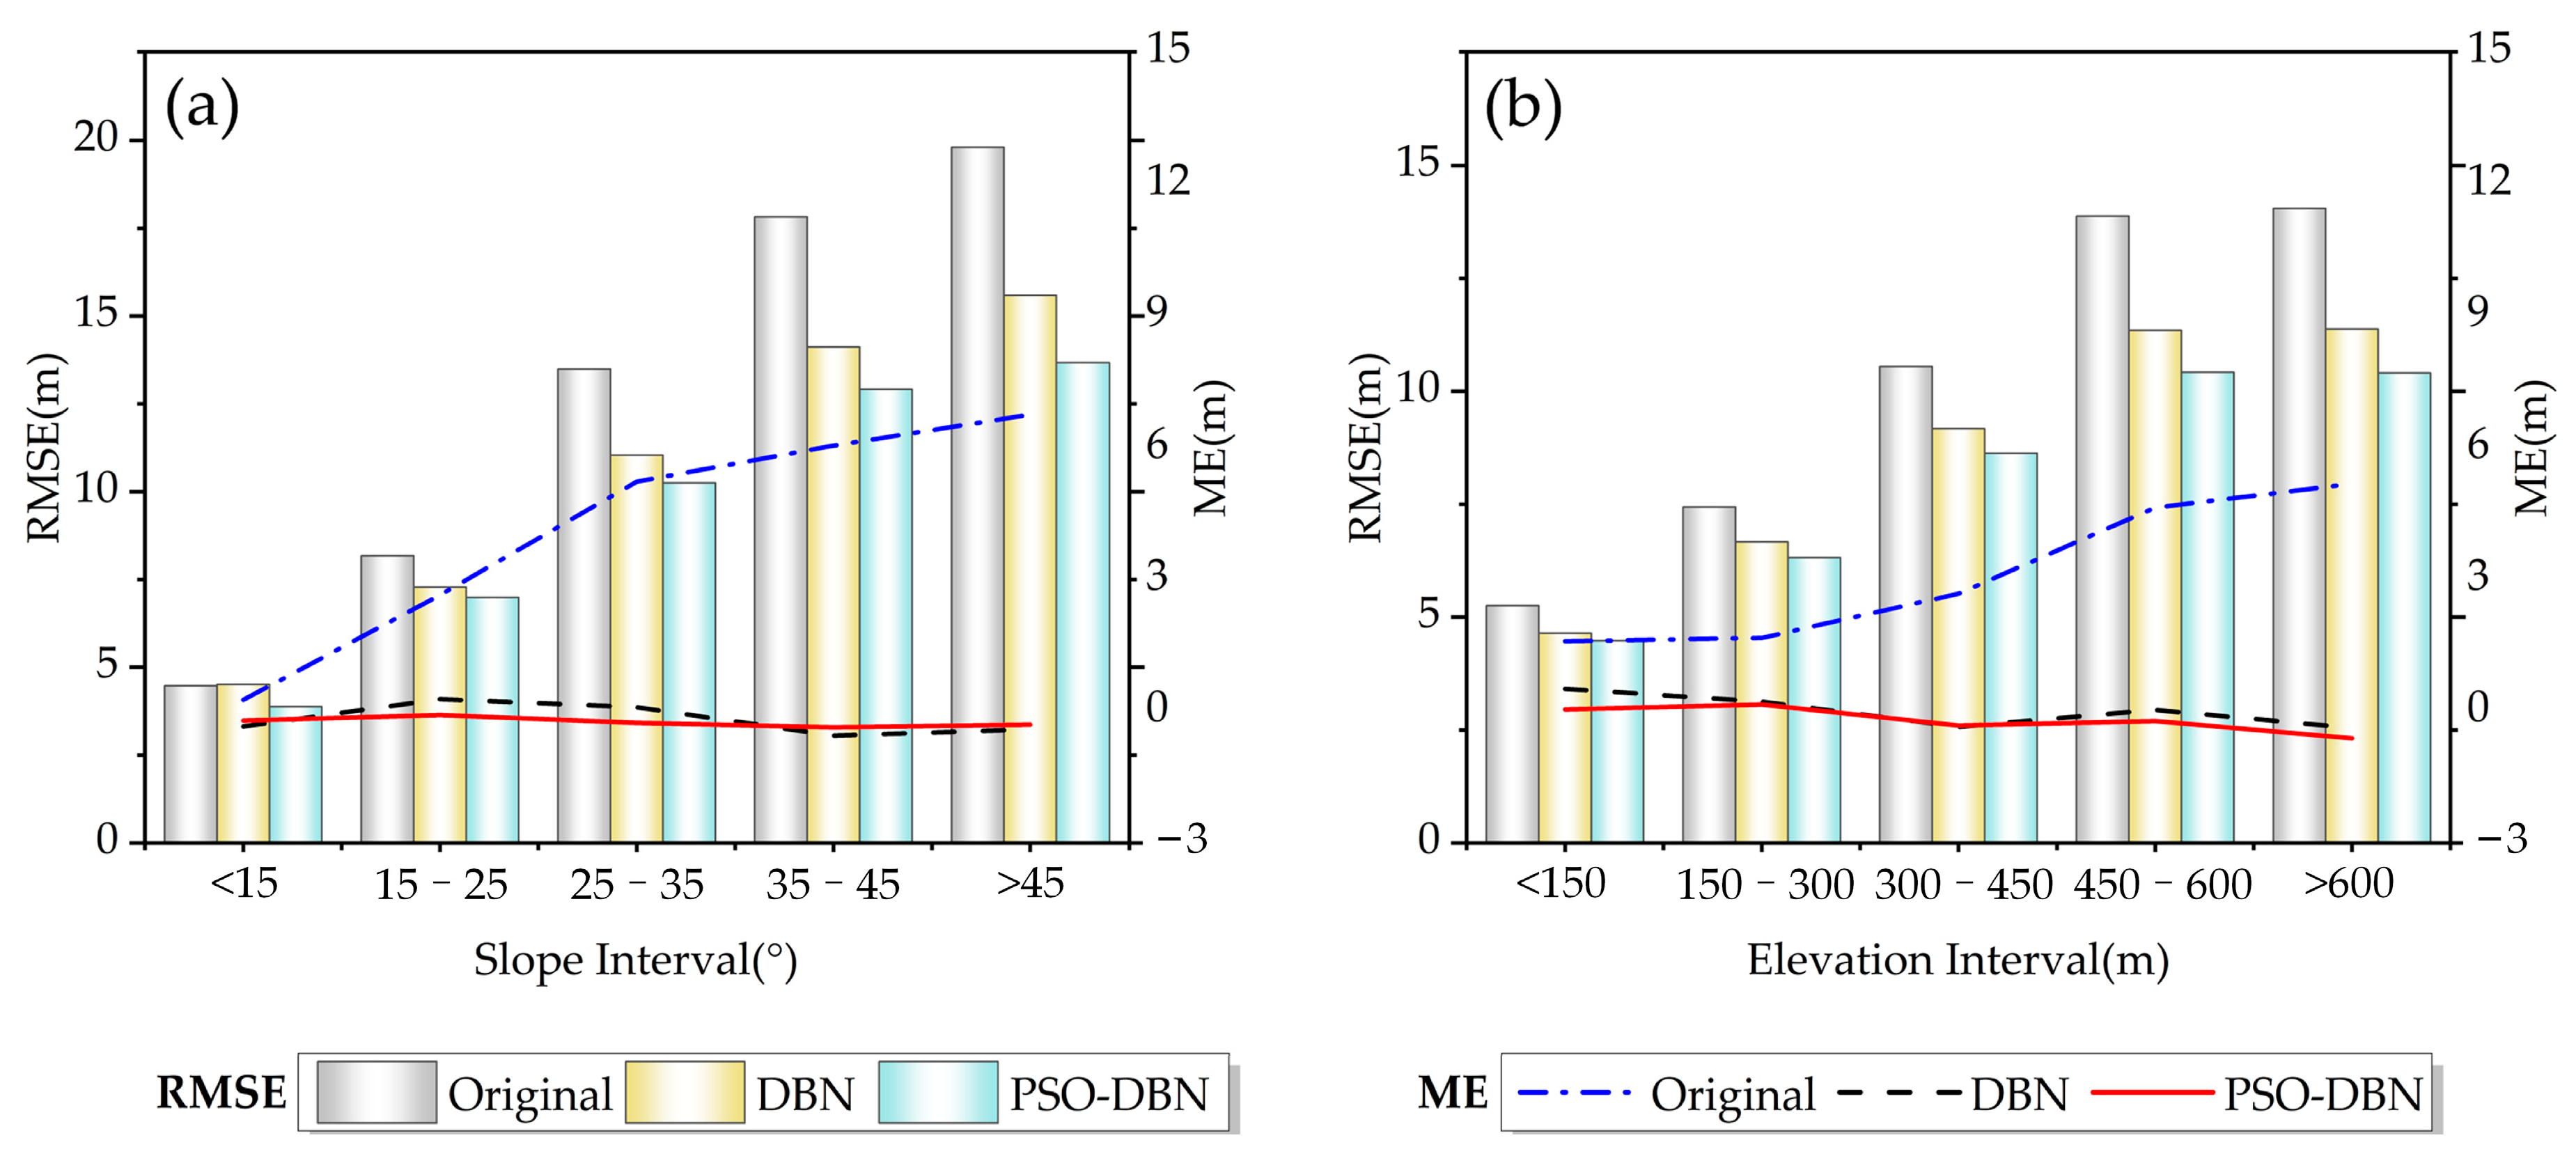
4.2. The Influence of Different Terrain Factors on Error Prediction of SRTM3 DEM
4.3. The Influence of Different Land Cover Types on SRTM DEM Error Correction
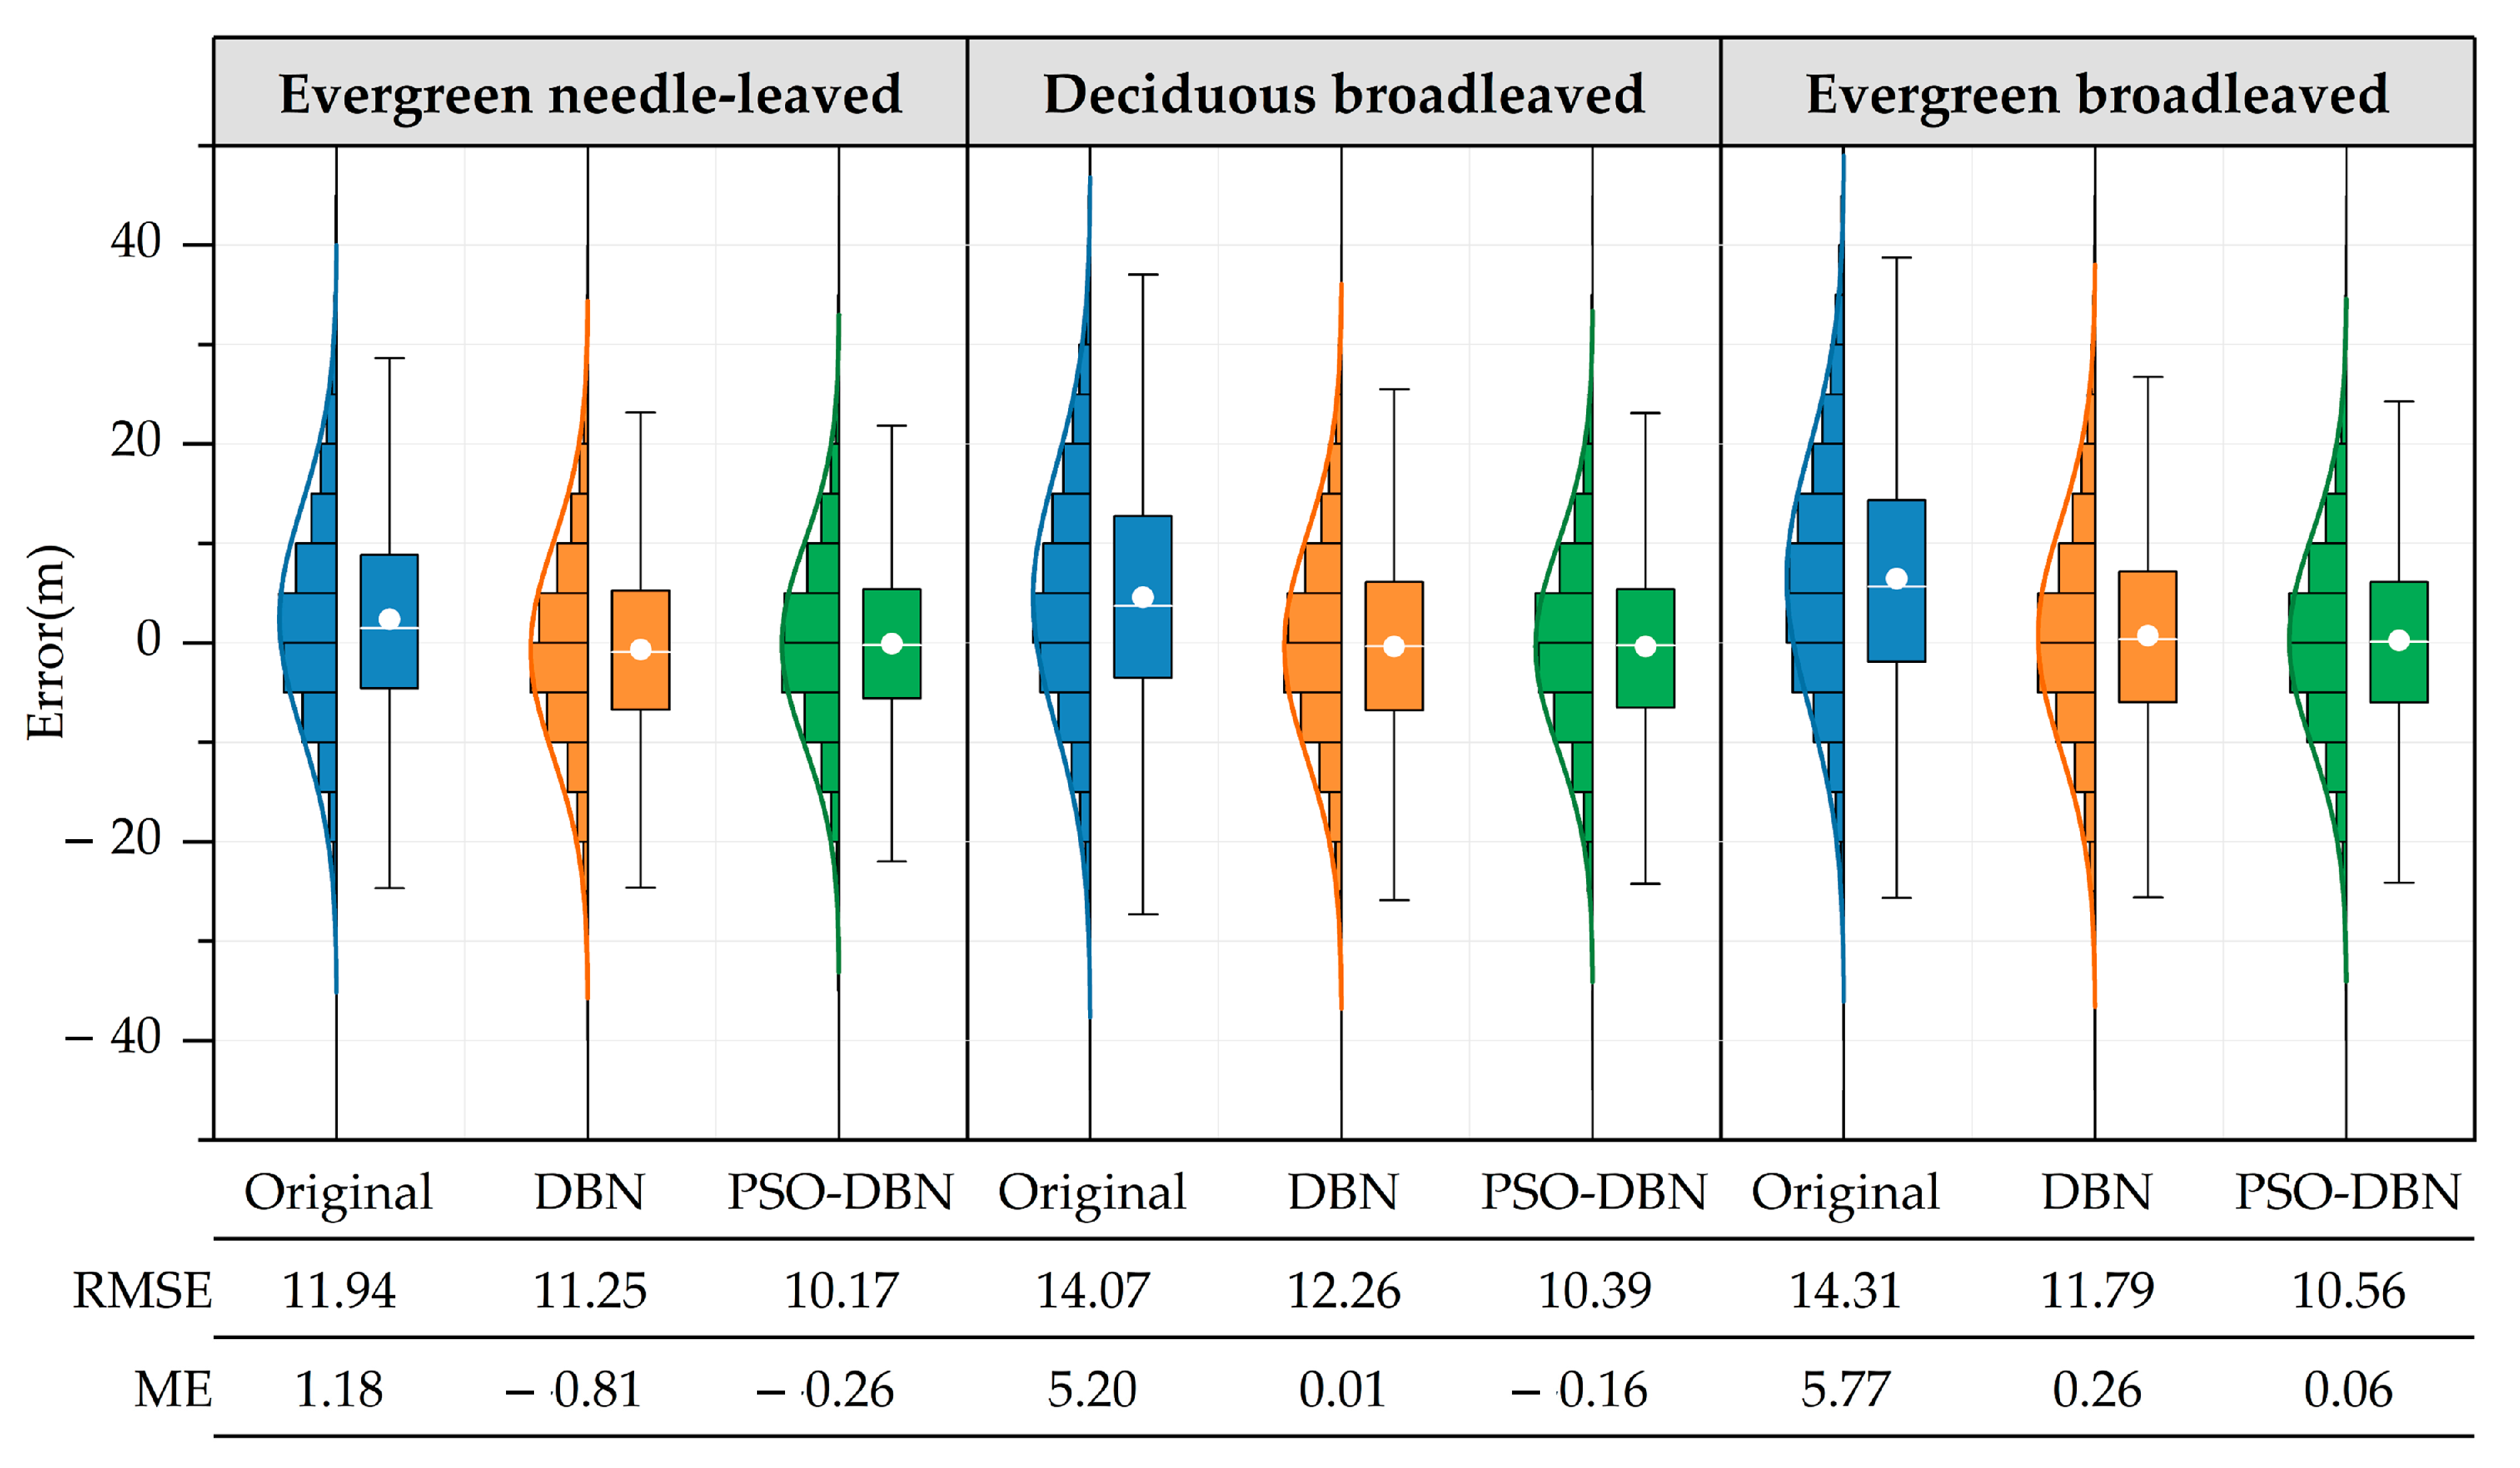
4.4. The Influence of Different Vegetation Types on SRTM DEM Error Correction
4.5. Model Performance Comparison
5. Conclusions
Author Contributions
Funding
Acknowledgments
Conflicts of Interest
References
- Li, H.; Zhao, J. Evaluation of the Newly Released Worldwide AW3D30 DEM Over Typical Landforms of China Using Two Global DEMs and ICESat/GLAS Data. IEEE J. Sel. Top. Appl. Earth Obs. Remote Sens. 2018, 11, 4430–4440. [Google Scholar] [CrossRef]
- Parizi, E.; Khojeh, S.; Hosseini, S.M.; Moghadam, Y.J. Application of Unmanned Aerial Vehicle DEM in Flood Modeling and Comparison with Global DEMs: Case Study of Atrak River Basin, Iran. J. Environ. Manag. 2022, 317, 115492. [Google Scholar] [CrossRef] [PubMed]
- Zhang, N.; Chen, M.; Yang, F.; Yang, C.; Yang, P.; Gao, Y.; Shang, Y.; Peng, D. Forest Height Mapping Using Feature Selection and Machine Learning by Integrating Multi-Source Satellite Data in Baoding City, North China. Remote Sens. 2022, 14, 4434. [Google Scholar] [CrossRef]
- Li, J.; Wang, W.; Chen, G.; Han, Z. Spatiotemporal Assessment of Landslide Susceptibility in Southern Sichuan, China Using SA-DBN, PSO-DBN and SSA-DBN Models Compared with DBN Model. Adv. Space Res. 2022, 69, 3071–3087. [Google Scholar] [CrossRef]
- Frey, H.; Paul, F. On the Suitability of the SRTM DEM and ASTER GDEM for the Compilation of Topographic Parameters in Glacier Inventories. Int. J. Appl. Earth Obs. Geoinf. 2012, 18, 480–490. [Google Scholar] [CrossRef]
- Ngula Niipele, J.; Chen, J. The Usefulness of Alos-Palsar Dem Data for Drainage Extraction in Semi-Arid Environments in The Iishana Sub-Basin. J. Hydrol. Reg. Stud. 2019, 21, 57–67. [Google Scholar] [CrossRef]
- Mukul, M.; Srivastava, V.; Mukul, M. Accuracy Analysis of the 2014–2015 Global Shuttle Radar Topography Mission (SRTM) 1 Arc-Sec C-Band Height Model Using International Global Navigation Satellite System Service (IGS) Network. J. Earth Syst. Sci. 2016, 125, 909–917. [Google Scholar] [CrossRef]
- Mukherjee, S.; Joshi, P.K.; Mukherjee, S.; Ghosh, A.; Garg, R.D.; Mukhopadhyay, A. Evaluation of Vertical Accuracy of Open Source Digital Elevation Model (DEM). Int. J. Appl. Earth Obs. Geoinf. 2013, 21, 205–217. [Google Scholar] [CrossRef]
- Gruber, A.; Wessel, B.; Huber, M.; Roth, A. Operational TanDEM-X DEM Calibration and First Validation Results. ISPRS J. Photogramm. Remote Sens. 2012, 73, 39–49. [Google Scholar] [CrossRef]
- Cenci, L.; Galli, M.; Palumbo, G.; Sapia, L.; Santella, C.; Albinet, C. Describing the Quality Assessment Workflow Designed for DEM Products Distributed Via the Copernicus Programme. Case Study: The Absolute Vertical Accuracy of the Copernicus DEM Dataset in Spain. In Proceedings of the 2021 IEEE International Geoscience and Remote Sensing Symposium IGARSS, Brussels, Belgium, 11 July 2021; pp. 6143–6146. [Google Scholar]
- Almeida, L.; Almar, R.; Bergsma, E.; Berthier, E.; Baptista, P.; Garel, E.; Dada, O.; Alves, B. Deriving High Spatial-Resolution Coastal Topography From Sub-Meter Satellite Stereo Imagery. Remote Sens. 2019, 11, 590. [Google Scholar] [CrossRef]
- Su, Y.; Guo, Q.; Ma, Q.; Li, W. SRTM DEM Correction in Vegetated Mountain Areas through the Integration of Spaceborne LiDAR, Airborne LiDAR, and Optical Imagery. Remote Sens. 2015, 7, 11202–11225. [Google Scholar] [CrossRef]
- Young, S.S.; Wamburu, P. Comparing Drone-Derived Elevation Data with Air-Borne LiDAR to Analyze Coastal Sea Level Rise at the Local Level. Pap. Appl. Geogr. 2021, 7, 331–342. [Google Scholar] [CrossRef]
- Mancini, F.; Dubbini, M.; Gattelli, M.; Stecchi, F.; Fabbri, S.; Gabbianelli, G. Using Unmanned Aerial Vehicles (UAV) for High-Resolution Reconstruction of Topography: The Structure from Motion Approach on Coastal Environments. Remote Sens. 2013, 5, 6880–6898. [Google Scholar] [CrossRef]
- Sun, G.; Ranson, K.; Kimes, D.; Blair, J.; Kovacs, K. Forest Vertical Structure from GLAS: An Evaluation Using LVIS and SRTM Data. Remote Sens. Environ. 2008, 112, 107–117. [Google Scholar] [CrossRef]
- Gorokhovich, Y.; Voustianiouk, A. Accuracy Assessment of the Processed SRTM-Based Elevation Data by CGIAR Using Field Data from USA and Thailand and Its Relation to the Terrain Characteristics. Remote Sens. Environ. 2006, 104, 409–415. [Google Scholar] [CrossRef]
- Chen, H.; Liang, Q.; Liu, Y.; Xie, S. Hydraulic Correction Method (HCM) to Enhance the Efficiency of SRTM DEM in Flood Modeling. J. Hydrol. 2018, 559, 56–70. [Google Scholar] [CrossRef]
- Guth, P.L.; Geoffroy, T.M. LiDAR Point Cloud and ICESat-2 Evaluation of 1 Second Global Digital Elevation Models: Copernicus Wins. Trans. GIS 2021, 25, 2245–2261. [Google Scholar] [CrossRef]
- Li, H.; Zhao, J.; Yan, B.; Yue, L.; Wang, L. Global DEMs Vary from One to Another: An Evaluation of Newly Released Copernicus, NASA and AW3D30 DEM on Selected Terrains of China Using ICESat-2 Altimetry Data. Int. J. Digit. Earth 2022, 15, 1149–1168. [Google Scholar] [CrossRef]
- Wendi, D.; Liong, S.-Y.; Sun, Y.; Doan, C.D. An Innovative Approach to Improve SRTM DEM Using Multispectral Imagery and Artificial Neural Network: An Innovative Approach to Improve SRTM. J. Adv. Model. Earth Syst. 2016, 8, 691–702. [Google Scholar] [CrossRef]
- Pham, H.T.; Marshall, L.; Johnson, F.; Sharma, A. A Method for Combining SRTM DEM and ASTER GDEM2 to Improve Topography Estimation in Regions without Reference Data. Remote Sens. Environ. 2018, 210, 229–241. [Google Scholar] [CrossRef]
- Li, Y.; Fu, H.; Zhu, J.; Wu, K.; Yang, P.; Wang, L.; Gao, S. A Method for SRTM DEM Elevation Error Correction in Forested Areas Using ICESat-2 Data and Vegetation Classification Data. Remote Sens. 2022, 14, 3380. [Google Scholar] [CrossRef]
- Zhou, C.; Zhang, G.; Yang, Z.; Ao, M.; Liu, Z.; Zhu, J. An Adaptive Terrain-Dependent Method for SRTM DEM Correction Over Mountainous Areas. IEEE Access 2020, 8, 130878–130887. [Google Scholar] [CrossRef]
- O’Loughlin, F.E.; Paiva, R.C.D.; Durand, M.; Alsdorf, D.E.; Bates, P.D. A Multi-Sensor Approach towards a Global Vegetation Corrected SRTM DEM Product. Remote Sens. Environ. 2016, 182, 49–59. [Google Scholar] [CrossRef]
- Ouyang, Z.; Zhou, C.; Xie, J.; Zhu, J.; Zhang, G.; Ao, M. SRTM DEM Correction Using Ensemble Machine Learning Algorithm. Remote Sens. 2023, 15, 3946. [Google Scholar] [CrossRef]
- Hawker, L.; Uhe, P.; Paulo, L.; Sosa, J.; Savage, J.; Sampson, C.; Neal, J. A 30 m Global Map of Elevation with Forests and Buildings Removed. Environ. Res. Lett. 2022, 17, 024016. [Google Scholar] [CrossRef]
- Li, Y.; Li, L.; Chen, C.; Liu, Y. Correction of Global Digital Elevation Models in Forested Areas Using an Artificial Neural Network-Based Method with the Consideration of Spatial Autocorrelation. Int. J. Digit. Earth 2023, 16, 1568–1588. [Google Scholar] [CrossRef]
- Chen, Y.; Zhao, X.; Jia, X. Spectral–Spatial Classification of Hyperspectral Data Based on Deep Belief Network. IEEE J. Sel. Top. Appl. Earth Obs. Remote Sens. 2015, 8, 2381–2392. [Google Scholar] [CrossRef]
- Yue, L.; Shen, H.; Yuan, Q.; Liu, X. A Multi-source DEM Point-Surface Fusion Model Based on Deep Belief Network. Geomat. Inf. Sci. Wuhan Univ. 2021, 46, 1090–1097. [Google Scholar] [CrossRef]
- Rabus, B.; Eineder, M.; Roth, A.; Bamler, R. The Shuttle Radar Topography Mission—A New Class of Digital Elevation Models Acquired by Spaceborne Radar. Remote Sens. 2003, 57, 241–262. [Google Scholar] [CrossRef]
- Farr, T.G.; Kobrick, M. Shuttle Radar Topography Mission Produces a Wealth of Data. Eos Trans. Am. Geophys. Union 2000, 81, 583. [Google Scholar] [CrossRef]
- Su, Y.; Guo, Q. A Practical Method for SRTM DEM Correction over Vegetated Mountain Areas. ISPRS J. Photogramm. Remote Sens. 2014, 87, 216–228. [Google Scholar] [CrossRef]
- Neuenschwander, A.; Pitts, K. The ATL08 Land and Vegetation Product for the ICESat-2 Mission. Remote Sens. Environ. 2019, 221, 247–259. [Google Scholar] [CrossRef]
- Schenk, T.; Csatho, B.; Neumann, T. Assessment of ICESat-2′s Horizontal Accuracy Using Precisely Surveyed Terrains in McMurdo Dry Valleys, Antarctica. IEEE Trans. Geosci. Remote Sens. 2022, 60, 4303811. [Google Scholar] [CrossRef]
- Gdulová, K.; Marešová, J.; Moudrý, V. Accuracy Assessment of the Global TanDEM-X Digital Elevation Model in a Mountain Environment. Remote Sens. Environ. 2020, 241, 111724. [Google Scholar] [CrossRef]
- Tian, X.; Shan, J. Comprehensive Evaluation of the ICESat-2 ATL08 Terrain Product. IEEE Trans. Geosci. Remote Sens. 2021, 59, 8195–8209. [Google Scholar] [CrossRef]
- Satgé, F.; Bonnet, M.P.; Timouk, F.; Calmant, S.; Pillco, R.; Molina, J.; Lavado-Casimiro, W.; Arsen, A.; Crétaux, J.F.; Garnier, J. Accuracy Assessment of SRTM v4 and ASTER GDEM v2 over the Altiplano Watershed Using ICESat/GLAS Data. Int. J. Remote Sens. 2015, 36, 465–488. [Google Scholar] [CrossRef]
- Fu, C.Y.; Tsay, J.R. Statistic Tests Aided Multi-Source DEM Fusion. ISPRS Int. Arch. Photogramm. Remote Sens. Spat. Inf. Sci. 2016, XLI-B6, 227–233. [Google Scholar] [CrossRef]
- Chen, C.; Yang, S.; Li, Y. Accuracy Assessment and Correction of SRTM DEM Using ICESat/GLAS Data under Data Coregistration. Remote Sens. 2020, 12, 3435. [Google Scholar] [CrossRef]
- Zhao, X.; Su, Y.; Hu, T.; Chen, L.; Gao, S.; Wang, R.; Jin, S.; Guo, Q. A Global Corrected SRTM DEM Product for Vegetated Areas. Remote Sens. Lett. 2018, 9, 393–402. [Google Scholar] [CrossRef]
- Magruder, L.; Neuenschwander, A.; Klotz, B. Digital Terrain Model Elevation Corrections Using Space-Based Imagery and ICESat-2 Laser Altimetry. Remote Sens. Environ. 2021, 264, 112621. [Google Scholar] [CrossRef]
- Uuemaa, E.; Ahi, S.; Montibeller, B.; Muru, M.; Kmoch, A. Vertical Accuracy of Freely Available Global Digital Elevation Models (ASTER, AW3D30, MERIT, TanDEM-X, SRTM, and NASADEM). Remote Sens. 2020, 12, 3482. [Google Scholar] [CrossRef]
- Kolecka, N.; Kozak, J. Assessment of the Accuracy of SRTM C- and X-Band High Mountain Elevation Data: A Case Study of the Polish Tatra Mountains. Pure Appl. Geophys. 2014, 171, 897–912. [Google Scholar] [CrossRef]
- Cheng, R.; Jin, Y. A Social Learning Particle Swarm Optimization Algorithm for Scalable Optimization. Inf. Sci. 2015, 291, 43–60. [Google Scholar] [CrossRef]
- Fisher, P.F.; Tate, N.J. Causes and Consequences of Error in Digital Elevation Models. Prog. Phys. Geogr. Earth Environ. 2006, 30, 467–489. [Google Scholar] [CrossRef]
- Huang, X.; Xie, H.; Liang, T.; Yi, D. Estimating Vertical Error of SRTM and Map-Based DEMs Using ICESat Altimetry Data in the Eastern Tibetan Plateau. Int. J. Remote Sens. 2011, 32, 5177–5196. [Google Scholar] [CrossRef]
- Du, X.; Guo, H.; Fan, X.; Zhu, J.; Yan, Z.; Zhan, Q. Vertical Accuracy Assessment of Freely Available Digital Elevation Models over Low-Lying Coastal Plains. Int. J. Digit. Earth 2016, 9, 252–271. [Google Scholar] [CrossRef]
- Carabajal, C.C.; Harding, D.J. ICESat Validation of SRTM C-Band Digital Elevation Models: ICESat VALIDATION OF SRTM C-BAND DEMS. Geophys. Res. Lett. 2005, 32, L22S01. [Google Scholar] [CrossRef]
- Carabajal, C.C.; Harding, D.J. SRTM C-Band and ICESat Laser Altimetry Elevation Comparisons as a Function of Tree Cover and Relief. Photogramm. Eng. Remote Sens. 2006, 72, 287–298. [Google Scholar] [CrossRef]
- Woodhouse, I.H. Predicting Backscatter-Biomass and Height-Biomass Trends Using a Macroecology Model. IEEE Trans. Geosci. Remote Sens. 2006, 44, 871–877. [Google Scholar] [CrossRef]
- Shen, X.; Zhou, C.; Zhu, J. Improving the Accuracy of TanDEM-X Digital Elevation Model Using Least Squares Collocation Method. Remote Sens. 2023, 15, 3695. [Google Scholar] [CrossRef]
- Passini, R.; Jacobsen, K. Accuracy Analysis of SRTM Height Models. In Proceedings of the 2007 American Society for Photogrammetry and Remote Sensing Annual Conference, Tampa, FL, USA, 7–11 May 2007. [Google Scholar]
- Bhang, K.J.; Schwartz, F.W.; Braun, A. Verification of the Vertical Error in C-Band SRTM DEM Using ICESat and Landsat-7, Otter Tail County, MN. IEEE Trans. Geosci. Remote Sens. 2007, 45, 36–44. [Google Scholar] [CrossRef]
- Yu, X.; Hyyppä, J.; Kaartinen, H.; Maltamo, M. Automatic Detection of Harvested Trees and Determination of Forest Growth Using Airborne Laser Scanning. Remote Sens. Environ. 2004, 90, 451–462. [Google Scholar] [CrossRef]
- Brown, C.G.; Sarabandi, K.; Pierce, L.E. Model-Based Estimation of Forest Canopy Height in Red and Austrian Pine Stands Using Shuttle Radar Topography Mission and Ancillary Data: A Proof-of-Concept Study. IEEE Trans. Geosci. Remote Sens. 2010, 48, 1105–1118. [Google Scholar] [CrossRef]


| Region | Area (km2) | Mean Elevation (m) | Mean Slope (°) | Mean Canopy Height (m) | Vegetation Coverage (%) |
|---|---|---|---|---|---|
| Yongzhou | 22259 | 434.3 | 15.3 | 7.5 | 61.9 |
| Chenzhou | 19387 | 493.3 | 15.7 | 8.1 | 67.7 |
| Terrain Actors | Classes | Original | DBN Corrected | PSO-DBN Corrected | |||
|---|---|---|---|---|---|---|---|
| ME (m) | RMSE (m) | ME (m) | RMSE (m) | ME (m) | RMSE (m) | ||
| Height (m) | <150 | 1.59 | 5.25 | 0.51 | 4.64 | 0.04 | 4.47 |
| 150–300 | 1.67 | 7.43 | 0.22 | 6.66 | 0.15 | 6.32 | |
| 300–450 | 2.68 | 10.55 | −0.36 | 9.17 | −0.33 | 8.63 | |
| 450–600 | 4.64 | 13.88 | 0.03 | 11.35 | −0.23 | 10.42 | |
| >600 | 5.18 | 14.05 | −0.38 | 11.38 | −0.62 | 10.41 | |
| Slope (°) | <15 | 0.26 | 4.48 | −0.35 | 4.51 | −0.22 | 3.88 |
| 15–25 | 2.65 | 8.17 | 0.27 | 7.28 | −0.09 | 6.99 | |
| 25–35 | 5.23 | 13.49 | 0.09 | 11.04 | −0.27 | 10.25 | |
| 35–45 | 6.05 | 17.82 | −0.56 | 14.12 | −0.37 | 12.91 | |
| >45 | 6.76 | 19.80 | −0.41 | 15.59 | −0.31 | 13.67 | |
| Land Cover Type | Number of Test Observations | Original | DBN Corrected | PSO-DBN Corrected | |||
|---|---|---|---|---|---|---|---|
| ME (m) | RMSE (m) | ME (m) | RMSE (m) | ME (m) | RMSE (m) | ||
| cultivated land | 8464 | 0.75 | 5.21 | −0.39 | 4.72 | −0.26 | 4.48 |
| forestland | 15873 | 4.58 | 13.13 | 0.22 | 10.85 | −0.13 | 10.21 |
| grassland | 2802 | 3.47 | 9.50 | 0.09 | 7.83 | −0.55 | 7.76 |
| water area | 488 | 0.45 | 8.59 | −1.80 | 7.68 | −0.80 | 7.25 |
| built-up land | 541 | 0.95 | 5.79 | −0.74 | 5.65 | 0.79 | 5.25 |
| Models | ME (m) | RMSE (m) | ||
|---|---|---|---|---|
| Original | Corrected | Original | Corrected | |
| MLR | 4.01 | 3.72 | 10.46 | 10.43 |
| MNLR | 4.01 | 0.10 | 10.46 | 10.19 |
| ANN | 3.13 | 0.18 | 11.12 | 8.87 |
| DBN | 3.98 | −0.06 | 11.07 | 9.20 |
| PSO-DBN | 3.16 | −0.16 | 10.75 | 8.33 |
Disclaimer/Publisher’s Note: The statements, opinions and data contained in all publications are solely those of the individual author(s) and contributor(s) and not of MDPI and/or the editor(s). MDPI and/or the editor(s) disclaim responsibility for any injury to people or property resulting from any ideas, methods, instructions or products referred to in the content. |
© 2023 by the authors. Licensee MDPI, Basel, Switzerland. This article is an open access article distributed under the terms and conditions of the Creative Commons Attribution (CC BY) license (https://creativecommons.org/licenses/by/4.0/).
Share and Cite
Sun, X.; Zhou, C.; Xie, J.; Ouyang, Z.; Luo, Y. SRTM DEM Correction Based on PSO-DBN Model in Vegetated Mountain Areas. Forests 2023, 14, 1985. https://doi.org/10.3390/f14101985
Sun X, Zhou C, Xie J, Ouyang Z, Luo Y. SRTM DEM Correction Based on PSO-DBN Model in Vegetated Mountain Areas. Forests. 2023; 14(10):1985. https://doi.org/10.3390/f14101985
Chicago/Turabian StyleSun, Xinpeng, Cui Zhou, Jian Xie, Zidu Ouyang, and Yongfeng Luo. 2023. "SRTM DEM Correction Based on PSO-DBN Model in Vegetated Mountain Areas" Forests 14, no. 10: 1985. https://doi.org/10.3390/f14101985