Article

Comparative Physiological, Transcriptomic, and Metabolomic Analyses of Acacia mangium Provide New Insights into Its Molecular Mechanism of Self-Incompatibility

Chinese Academy of Forestry, Research Institute of Tropical Forestry, Guangzhou 510520, China
*
Authors to whom correspondence should be addressed.
Forests 2023, 14(10), 2034; https://doi.org/10.3390/f14102034
Submission received: 8 September 2023 / Revised: 30 September 2023 / Accepted: 5 October 2023 / Published: 11 October 2023
(This article belongs to the Special Issue Molecular Mechanism of Secondary Metabolic Pathways in Forest Trees)

Abstract

:
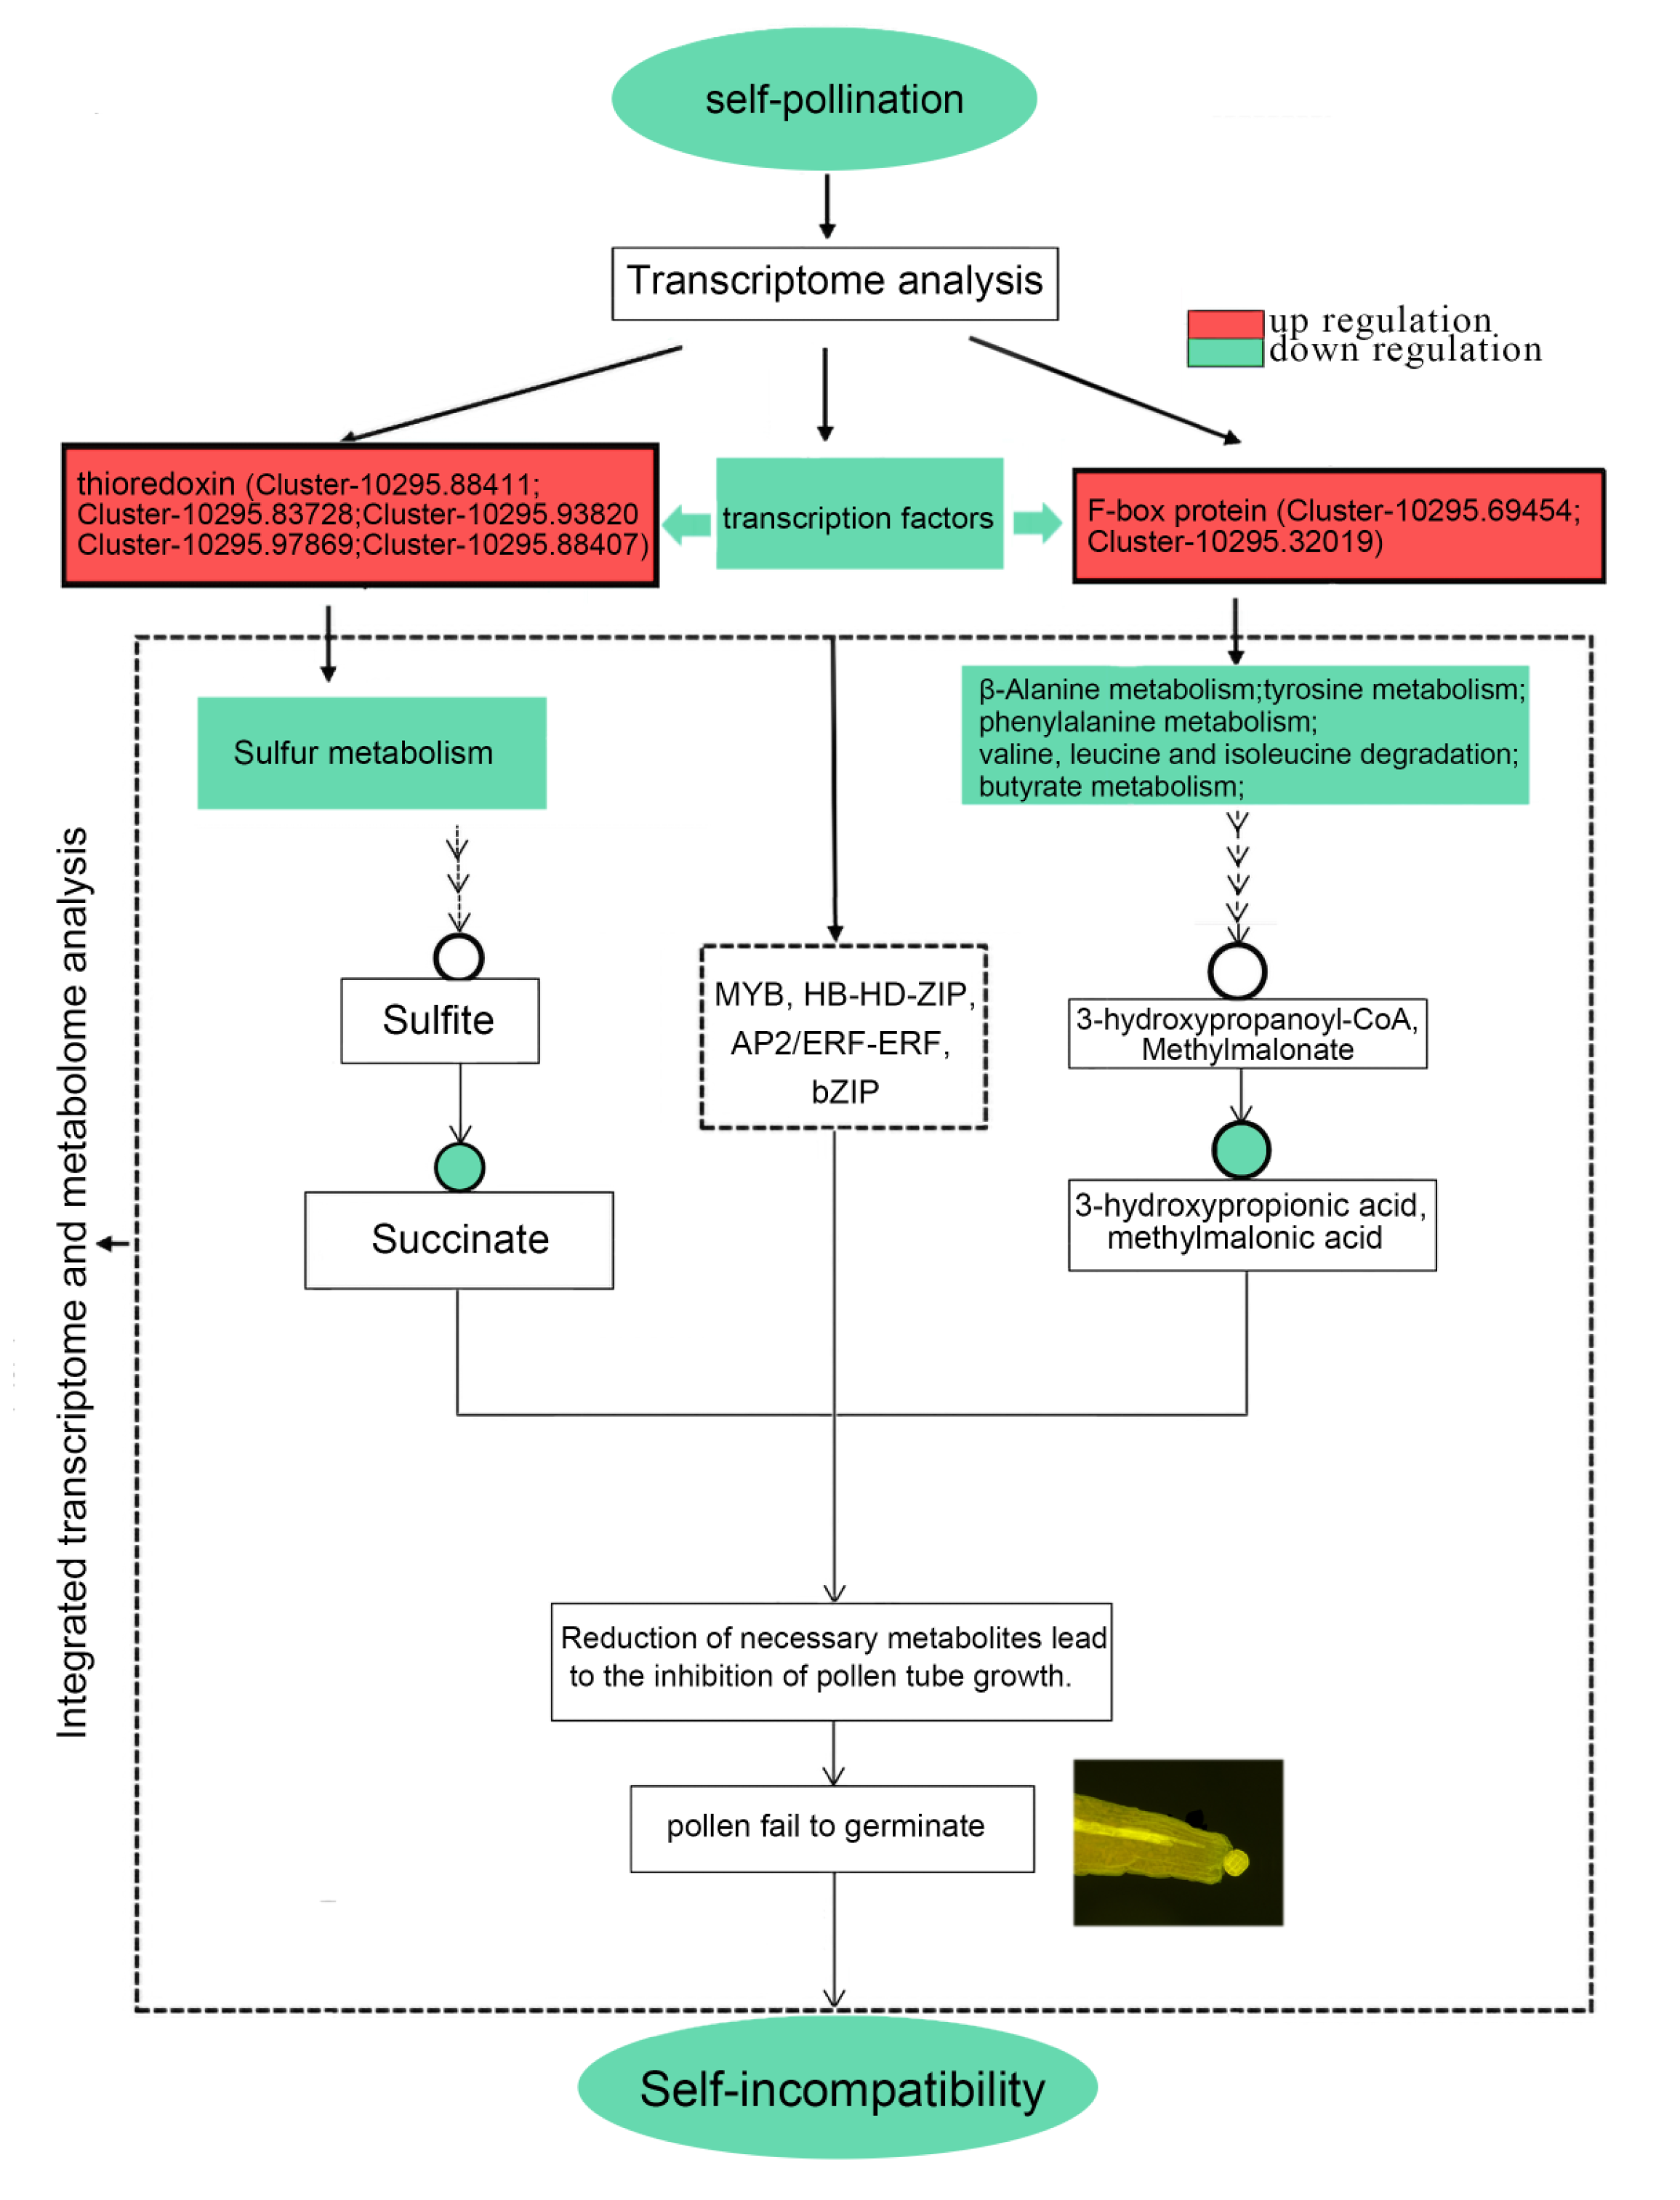
Acacia mangium is well known as a valuable commercial tree species in the Acacia genus. A. mangium was recently found to be self-incompatible (SI), but its SI mechanism is not clear, which has hindered the progress of genetic improvement of A. mangium with strong resistance. To confirm the SI type of A. mangium, pollen germination was observed via fluorescence microscopy at 0 h, 3 h, 6 h, 9 h, 12 h, and 24 h after self-pollination. We found over ninety percent of the pollen grains produced no pollen tube growth on the stigma/style. To further explore the SI molecular mechanism of A. mangium, tests of the transcriptome and metabolome were carried out after self-pollination. Observations of pollen germination after self-pollination using fluorescence microscopy suggested that the SI type of A. mangium is gametophytic self-incompatibility (GSI). A combined transcriptomic and metabolomic analysis showed that DEGs (differentially expressed genes) related to SI (6 S-glycoproteins, 93 F-box proteins, 69 26S proteasomes, 38 calcium-dependent protein kinases/calmodulin and 41 thioredoxin genes) were significantly enriched in six KEGG (sulfur metabolism, tyrosine metabolism, phenylalanine metabolism, butanoate metabolism, and valine, leucine, and isoleucine degradation). Further analysis of these six pathways revealed the enrichment of SI-related DEGs corresponding to succinate, methylmalonate, and 3-hydroxypropane. These three metabolites were significantly downregulated. The analysis of transcripts and metabolites suggested that transcripts of SI-related gene families (thioredoxin and F-box protein) were significantly upregulated under the regulation of transcription factors (TFs) after self-pollination, leading to a decrease in metabolites (such as succinate, methylmalonate, and 3-hydroxypropionate). We also further speculated that TFs (MYB, HB-HD-ZIP, AP2/ERF-ERF, and bZIP) and gene families (thioredoxin and F-box protein) were important factors related to the SI of A. mangium.

1. Introduction

There are two main types of self-incompatibility (SI), namely gametophytic self-incompatibility (GSI) and sporophytic self-incompatibility (SSI) [1]. SSI includes two main forms based on pollen tube growth. One is pollen that cannot germinate, as observed in Raphanus sativus [2]. Another is pollen that can germinate but cannot pass through the stigma, as observed in Chinese cabbage [3]. There are three types of GSI, defined according to the growth state of the pollen tube after self-pollination. In the first type, the Ca2+-dependent signal transduction pathway mediates the suppression of incompatible pollen, and pollen does not properly germinate, as observed in poppies [4,5,6,7]. In the second type, pollen tubes can grow into the ovary, but are unable to produce fertilized eggs, as observed in Camellia sinensis [5,6,7]. In the third type of GSI, pollen tubes can enter into the ovary but cannot extend past the stigma, as observed in Camellia oleifera [4,8].
The molecular mechanism of SI is not clear. Some studies have found that SSI is determined by several S-factor alleles [9]; for instance, the SLG and SP11/SCR genes were determined to be associated with SSI [6,7,8,10,11,12]. At present, it is speculated that there are two types of molecular mechanism of GSI in most GSI plants. One mechanism is the GSI system of programmed cell death (PCD) mediated by S glycoproteins, which are generally specifically recognized by the stigma and the pollen S protein after pollination, prompting a rapid increase in Ca2+ concentration [13]. This impairs the ability to produce the components necessary for pollen tube formation, causing P26 phosphorylation and resulting in the progressive inactivation of pyrophosphates. Moreover, PCD develops as a result of p56 activation [14,15]. At the same time, Ca2+ also activates the PrABP8 protein and other coenzyme factors, which together lead to F actin depolymerization and ultimately SI [16]. For example, in the SI of Papaver rhoeas, Ca2+ acts as an intracellular signal factor to induce a cascade reaction, leading to the failure of pollen germination [17]. The other SI mechanism is the GSI system mediated by S-RNase. The most common molecular mechanism of SI is usually one in which the compatible pollen S factors complex with the Skp1 binding protein, Cullin 1 skeleton protein F-box protein, and the SBP1 proteins to form the SCF complex, which then specifically binds to S-RNase later, resulting in the degradation of the S-RNase via E3 ubiquitination. In contrast, the pollen S factor that is incompatible during self-pollination is specifically bound to the S-RNase, resulting in an inability to form the SCF complex. However, S-RNase destroys rRNA in pollen tubes, which consequently causes the occurrence of GSI [18,19].
At the molecular level, some SI-related genes, such as those encoding calmodulin, calcium-dependent protein kinase, calmodulin-like interacting protein kinase, F-box protein, thioredoxin, and 26S protease, have also been found [20,21]. In recent years, research on the transcriptomic, metabolomic and proteomic analysis of Camellia oleifera has shown that the complex regulation of PCD during SI in C. oleifera is related to the MAPK signaling pathway, plant hormone signal transduction, ABC transporters, and ubiquitin-mediated proteolysis [8]. Moreover, lipid metabolism-related, flavonoid biosynthesis and spliceosome pathway activities are down-regulated in self-pollinated pistils according to the Kyoto Encyclopedia of Genes and Genomes (KEGG) pathway analysis [22]. Seif studied the germination of Chinese fir pollen grains at different time points (1, 24 and 48 h) via the metabolic spectrum technique, and their results showed that there were considerable changes in metabolites during pollen development [23].
There are more than 800 species of Acacia, so the SI in this genus is very complex. Kenrick and Knox used the index of self-incompatibility (ISI, or the ratio of infructescences or pods set after self-pollination/cross-pollination) to quantitatively evaluate seven acacia trees, and found that A. mearnsii, A. pycnantha, and A. retinodes showed high levels of self-incompatibility, A. myrtifolia, A. paradoxa, and A. terminalis showed partial self-compatibility, and A. ulicifolia showed self-compatibility [24]. Fluorescence microscopy has been widely used to observe the growth of pollen tubes to evaluate the SI type of plants [6,25,26]. Fluorescence microscopy observations of in manually pollinated pistils of A. retinodes showed that pollen tubes could not enter the embryo sac [27]. Temporal studies of pollen tube growth in manually pollinated pistils showed that pollen tubes grew for 18–24 h in the style before reaching the embryo sac [28].
A. mangium is used for the ecological restoration of barren hills and degraded areas all over the world due to its rapid growth, high nitrogen fixation capacity, abundant litter-fall, strong tolerance to acidic and poor soils, and potential nitrification [29,30,31,32,33,34]. The high economic value of A. mangium also results from its frequent use in pulp, paper and particleboard manufacturing and as a greening tree species [35,36,37]. Furthermore, A. mangium, widely planted in coastal areas, is easily affected by typhoons [38,39]. Genetic improvement may be the best option [40], but SI makes A. mangium breeding very challenging. Indeed, in A. mangium, the pistils mature first, and the pistils are slightly longer than the stamens, which is not conducive to wind pollination [41]. Additionally, the main insects for entomophilous pollination are Chinese honeybees; the pollen is almost 100% single-plant pollen, which is not conducive to cross-pollination [41]. Furthermore, the SI index of A. mangium is less than 0.002, indicating a high degree of self-incompatibility [42]. However, the SI type of A. mangium remains to be elucidated, and there has been no related research on its molecular mechanism. Therefore, especially in the tall trees of Acacia, it is necessary to study the self-incompatibility of A. mangium.
In order to confirm the SI type and molecular mechanism of A. mangium, this study observed the pollen tube growth of A. mangium after self-pollination, and determined its SI phenotype category via fluorescence microscopy. Then, we further explored the differentially expressed genes, metabolites, and pathways related to SI to reveal the molecular mechanism of SI in A. mangium. Because it is difficult for tall trees to pollinate directly, we carried out a flower branch hydroponics experiment at the early stage [43]. Our study will fill a knowledge gap regarding the cellular basis of SI for A. mangium, and will provide an important molecular basis for A. mangium breeding and genetic improvement in the future. Moreover, the study can also be used as a reference for SI studies of tall trees and other plants.

2. Materials and Methods

2.1. Site Description and Samples

Plant materials were acquired from the Key National Breeding Base of Acacia in Jiangmen City, Guangdong Province, China (113°08′ E longitude, 22°18′ N latitude), which has a subtropical marine climate. Elite individual plants of A. mangium (the trees are 21–25 m high, 26–32 cm in diameter at breast height, 21 years old) were collected from the clonal seed orchard, which was established in January 1998. The collection area was 2 hm2, and the row spacing was 5 m × 8 m. The study was conducted from September to November 2019.
Fresh pollen was collected and then stored in the refrigerator for later use [44,45]. After cutting the flowering branches that were strong and about to bloom, the flowering branch watering method (5 leaves, twigs, and 3 g/L potassium dihydrogen phosphate nutrient solution) established by our research group was used for cultivation [43]. The unopened flower spikes and sporadic unopened flower buds were removed after the flowers bloomed at 9:00 a.m. the next day, and the unopened flower buds were removed from the refrigerator at approximately 10:00 a.m. The brush method was used for hand pollination [43,45]. The pollen of self-pollination comes from the same tree, and the pollen of cross-pollination comes from a different tree of the same species. The flowers were sampled at 0 h, 3 h, 6 h, 9 h, 12 h, and 24 h after pollination, soaked in a solution containing FAA, and refrigerated at −4 °C. The pistils were removed for fluorescence microscopy observations, and 20–30 pistils were observed at each time point (the pistil was pollinated). The flowers used for transcriptomic and metabolomic analysis were sampled at 0 h and 24 h after pollination, and the every experimental treatment was repeated three times. Each sample weighed 0.3–0.5 g and was immediately placed in liquid nitrogen, and was then stored in an ultralow temperature refrigerator at −80 °C. The samples were sent to Wuhan Metroville Biotechnology Co., Ltd. (Wuhan, China) for transcriptome sequencing and metabolome detection.

2.2. Microscopy Observation for Evaluate the SI Type

For fluorescence microscopy observation, the style was treated as follows. After removing the sample from the refrigerator, it was rinsed 3–4 times with distilled water, and then soaked in alcohol containers with different concentrations (70%, 50%, and 30%), respectively. After 30 min, the sample was removed and washed with distilled water 1–2 times, soaked in pH 5.5 buffer for 1.5–2 h, rinsed with distilled water 1–2 times, placed in NaOH solution and softened in a boiling water bath for 15 min. After the temperature dropped to room temperature, the sample was washed and aniline blue dye solution was added for 6–8 h for staining. Finally, the stained samples were washed 1–2 times in the culture dish to remove the stamens, the pistils were retained and placed on a slide, and a cover slip was placed over them and pressed down lightly. Each glass slide contained 8–10 pistils (5 slides per time point). Additionally, 40–50 pistils were observed at each time point (n = 40–50). A fluorescence microscope (LeicaDM2500, Wetzlar, Germany) was used for observations and for taking photos.

2.3. Total RNA Extraction and RNA-seq Analysis

We picked the flowering branches from tall A. mangium plants for hydroponics, and self-pollinated them with the pollen from the same tree that had been collected previously. Flowers (60%–70% pistil tissue, from unpublished breeding system studies) were first collected immediately after self-pollination (T0/CK), and then after 9 h (T9) and 24 h (T24). Both sample types were immediately placed into liquid nitrogen. The inflorescence of A. mangium is spike-shaped and consists of 172.72 ± 27.06 single flowers. The corolla is approximately 0. 2 mm long after extension, the diameter of the compound pollen is 29–35 μm, and the pistil is (4.55 ± 0.38) mm long (from unpublished breeding system studies). It is difficult to separate petals and stamens because the flowers are small (Figure S1). We also needed to take enough samples for RNA extraction immediately at each time point. Sequencing requires a large number of samples. If we spend a lot of time peeling stamens, this will also strongly affect the experimental results. Moreover, our previous research showed that leaving the stamens unpeeled did not affect the final pollination results [46]. Therefore, the samples used for transcriptomic and metabolomic analyses were derived from intact flowers.
RNA extraction was performed using an Aidlab Plant RNA extraction kit (Aidlab Biotech, Beijing, China) according to the manufacturer’s instructions, and quality testing was performed according to the methods of Chen et al. [6] and J Chen [32]. Transcriptomes of A. mangium were developed by using the Illumina HiSeq NovaSeq 6000 platform (San Diego, CA, USA). After the library construction was completed, the library was preliminarily quantified by Qubit2.0, and the insert size of the library was assessed with an Agilent 2100 system. After it was verified that the insert size met expectations, the effective concentration of the library was accurately quantified via Q-PCR (the effective concentration of the library > 2 nm) to complete the library quality check. After the library qualified, different libraries were pooled according to the target download data volume and sequenced on the Illumina HiSeq platform. The RNA-seq data obtained by quality control, filtering, and splicing of the data were compared with KEGG, NR, Swiss-Prot, GO, COG/KOG, and Trembl databases using BLAST 2.12.0 [47,48,49]. Then, the predicted amino acid sequence of a unigene was compared with the Pfam database using HMMER software to obtain annotation information for the unigene. The annotated sequences were compared, subjected to differential expression analysis, and screened (the screening criteria were [log2 fold-change] = 1 and FDR < 0.05), and the differentially expressed genes were then subjected to KEGG/GO annotation and enrichment analysis [47,50,51]. A network diagram of different structural genes and TFs was drawn according to |r| > 0.8, p < 0.05 [52,53]. Transcriptome sequencing without a reference genome was carried out by Wuhan Maiwei Metabolism Company (Wuhan, China).

2.4. UPLC-MS/MS-Based Metabolomic Analysis

Based on UPLC-MS/MS and an in-house-built database by the Wuhan Maiwei Metabolism Company (Wuhan, China), we conducted the extraction, detection, pretreatment, quality control, and annotation of the metabolites for the samples. The main liquid-phase conditions were as follows: chromatographic column (Waters ACQUITY UPLC HSS T3 C18 1.8 µm, 2.1 mm × 100 mm), mobile phase (phase A was ultrapure water with 0.04% acetic acid added, and phase B was acetonitrile with 0.04% acetic acid added), gradient of elution (the proportion of phase B was 5% at 0.00 min, the proportion of phase B linearly increased to 95% within 10.00 min, and remained at 95% for 1 min from 11.00–11.10 min, then decreased to 5% and remained balanced at 5% until 14 min), a flow rate of 0.35 mL/min, a column temperature of 40 °C, and an injection volume of 4 μL.
The main mass spectrometry conditions were as follows: electrospray ionization (ESI) temperature 550 °C, mass spectrometry voltage 5500 V, and curtain gas (CUR) 30 psi; the collision-activated dissociation (CAD) parameter was set to high. In the triple four-pole (QQQ) analyses, each ion pair was scanned and detected according to the optimized decluttering potential (DP) and collision energy (CE) [54]. LIT and triple quadrupole (QQQ) scans were acquired on a triple quadrupole-linear ion trap mass spectrometer (Q TRAP), API 4500 Q TRAP UPLC/MS/MS System equipped with an ESI Turbo Ion-Spray interface, operating in positive and negative ion mode and controlled using Analyst 1.6.3 software (AB Sciex, Framingham, MA, USA). The ESI source operation parameters were as follows: ion source, turbo spray, source temperature 550 °C, and ion spray voltage (IS) 5500 V (positive ion mode)/−4500 V (negative ion mode); the ion source gas I (GSI), gas II (GSII), and the curtain gas (CUR) were set at 50, 60, and 30.0 psi, respectively, and the collision gas (CAD) was high. Instrument tuning and mass calibration were performed with 10 and 100 μmol/L polypropylene glycol solutions in QQQ and LIT modes, respectively. QQQ scans were acquired as MRM experiments with the collision gas (nitrogen) set to 5 psi. DP and CE for individual MRM transitions were performed with further DP and CE optimization. A specific set of MRM transitions was monitored for each period according to the metabolites eluted within this period [55]. The different metabolites detected were statistically analyzed, and then clustering heatmaps, KEGG pathway enrichment classifications, and scatterplots were then generated [56,57].

2.5. Joint Transcriptomic–Metabolomic Joint Analysis of the Molecular Mechanism of SI

Associations between PCCs (Pearson’s correlation coefficients) > 0.8 and p < 0.05 were selected, and the network of genes and metabolites was constructed using Cytoscape software [53]. Additionally, the differentially expressed genes and metabolites were mapped using the KEGG pathway database and the enrichment analysis results were plotted in a histogram. Then, the differential genes and metabolites related to SI were further correlated and analyzed via CCA and O2PLS [58,59]. Additionally, differential genes and metabolites with correlation greater than 0.8 in each pathway were used to make a network diagram. Finally, Adobe Photoshop (Adobe Inc., San Jose, CA, USA) CC 2019 was used to draw the metabolic pathways related to SI for analysis.

3. Results

3.1. Microscopy Observation of Pollen Germination and Stigma Contact Sites

Our previous research on the pollen vitality of A. mangium has proven the vitality of fresh pollen [44]. Less than 6.67% of polyad–pistil combinations resulted in the germination of the grains after self-pollination or hand-controlled cross-pollination (Table S1), and others (over 90% of the pollen grains) produced no pollen tube growth on the stigma/style (Table S1, Figure 1A). Polyad–pistil combinations resulted in the germination of a minority of the grains at different times, as shown in Figure S1. Only 2.78% of pollen grains had grown pollen tubes at 9 h after self-pollination, and 3.13% of pollen grains had grown pollen tubes at 9 h after cross-pollination (Table S1). Moreover, all of the germinated pollen tubes were twisted towards the stigma and could not enter the style channel (Figure 1B,C). Therefore, we speculate that the self-pollination and cross-pollination of A. mangium are incompatible, considering our previous research [42]. Furthermore, GSI mediated by Ca2+ may explain why pollen grains cannot grow pollen tubes after self-pollination [17].

3.2. Transcriptomic Analysis

3.2.1. Transcriptome Data and Differentially Expressed Gene (DEG) Screening

To elucidate the molecular genetic mechanisms of self-incompatibility in A. mangium, a transcriptomic analysis was performed. Quality estimation and data cleaning resulted in 73.46 Gb of clean data, with more than 6Gb from each sample. Their GC contents and Q30 were above 44% and 91%, respectively (Table S2).
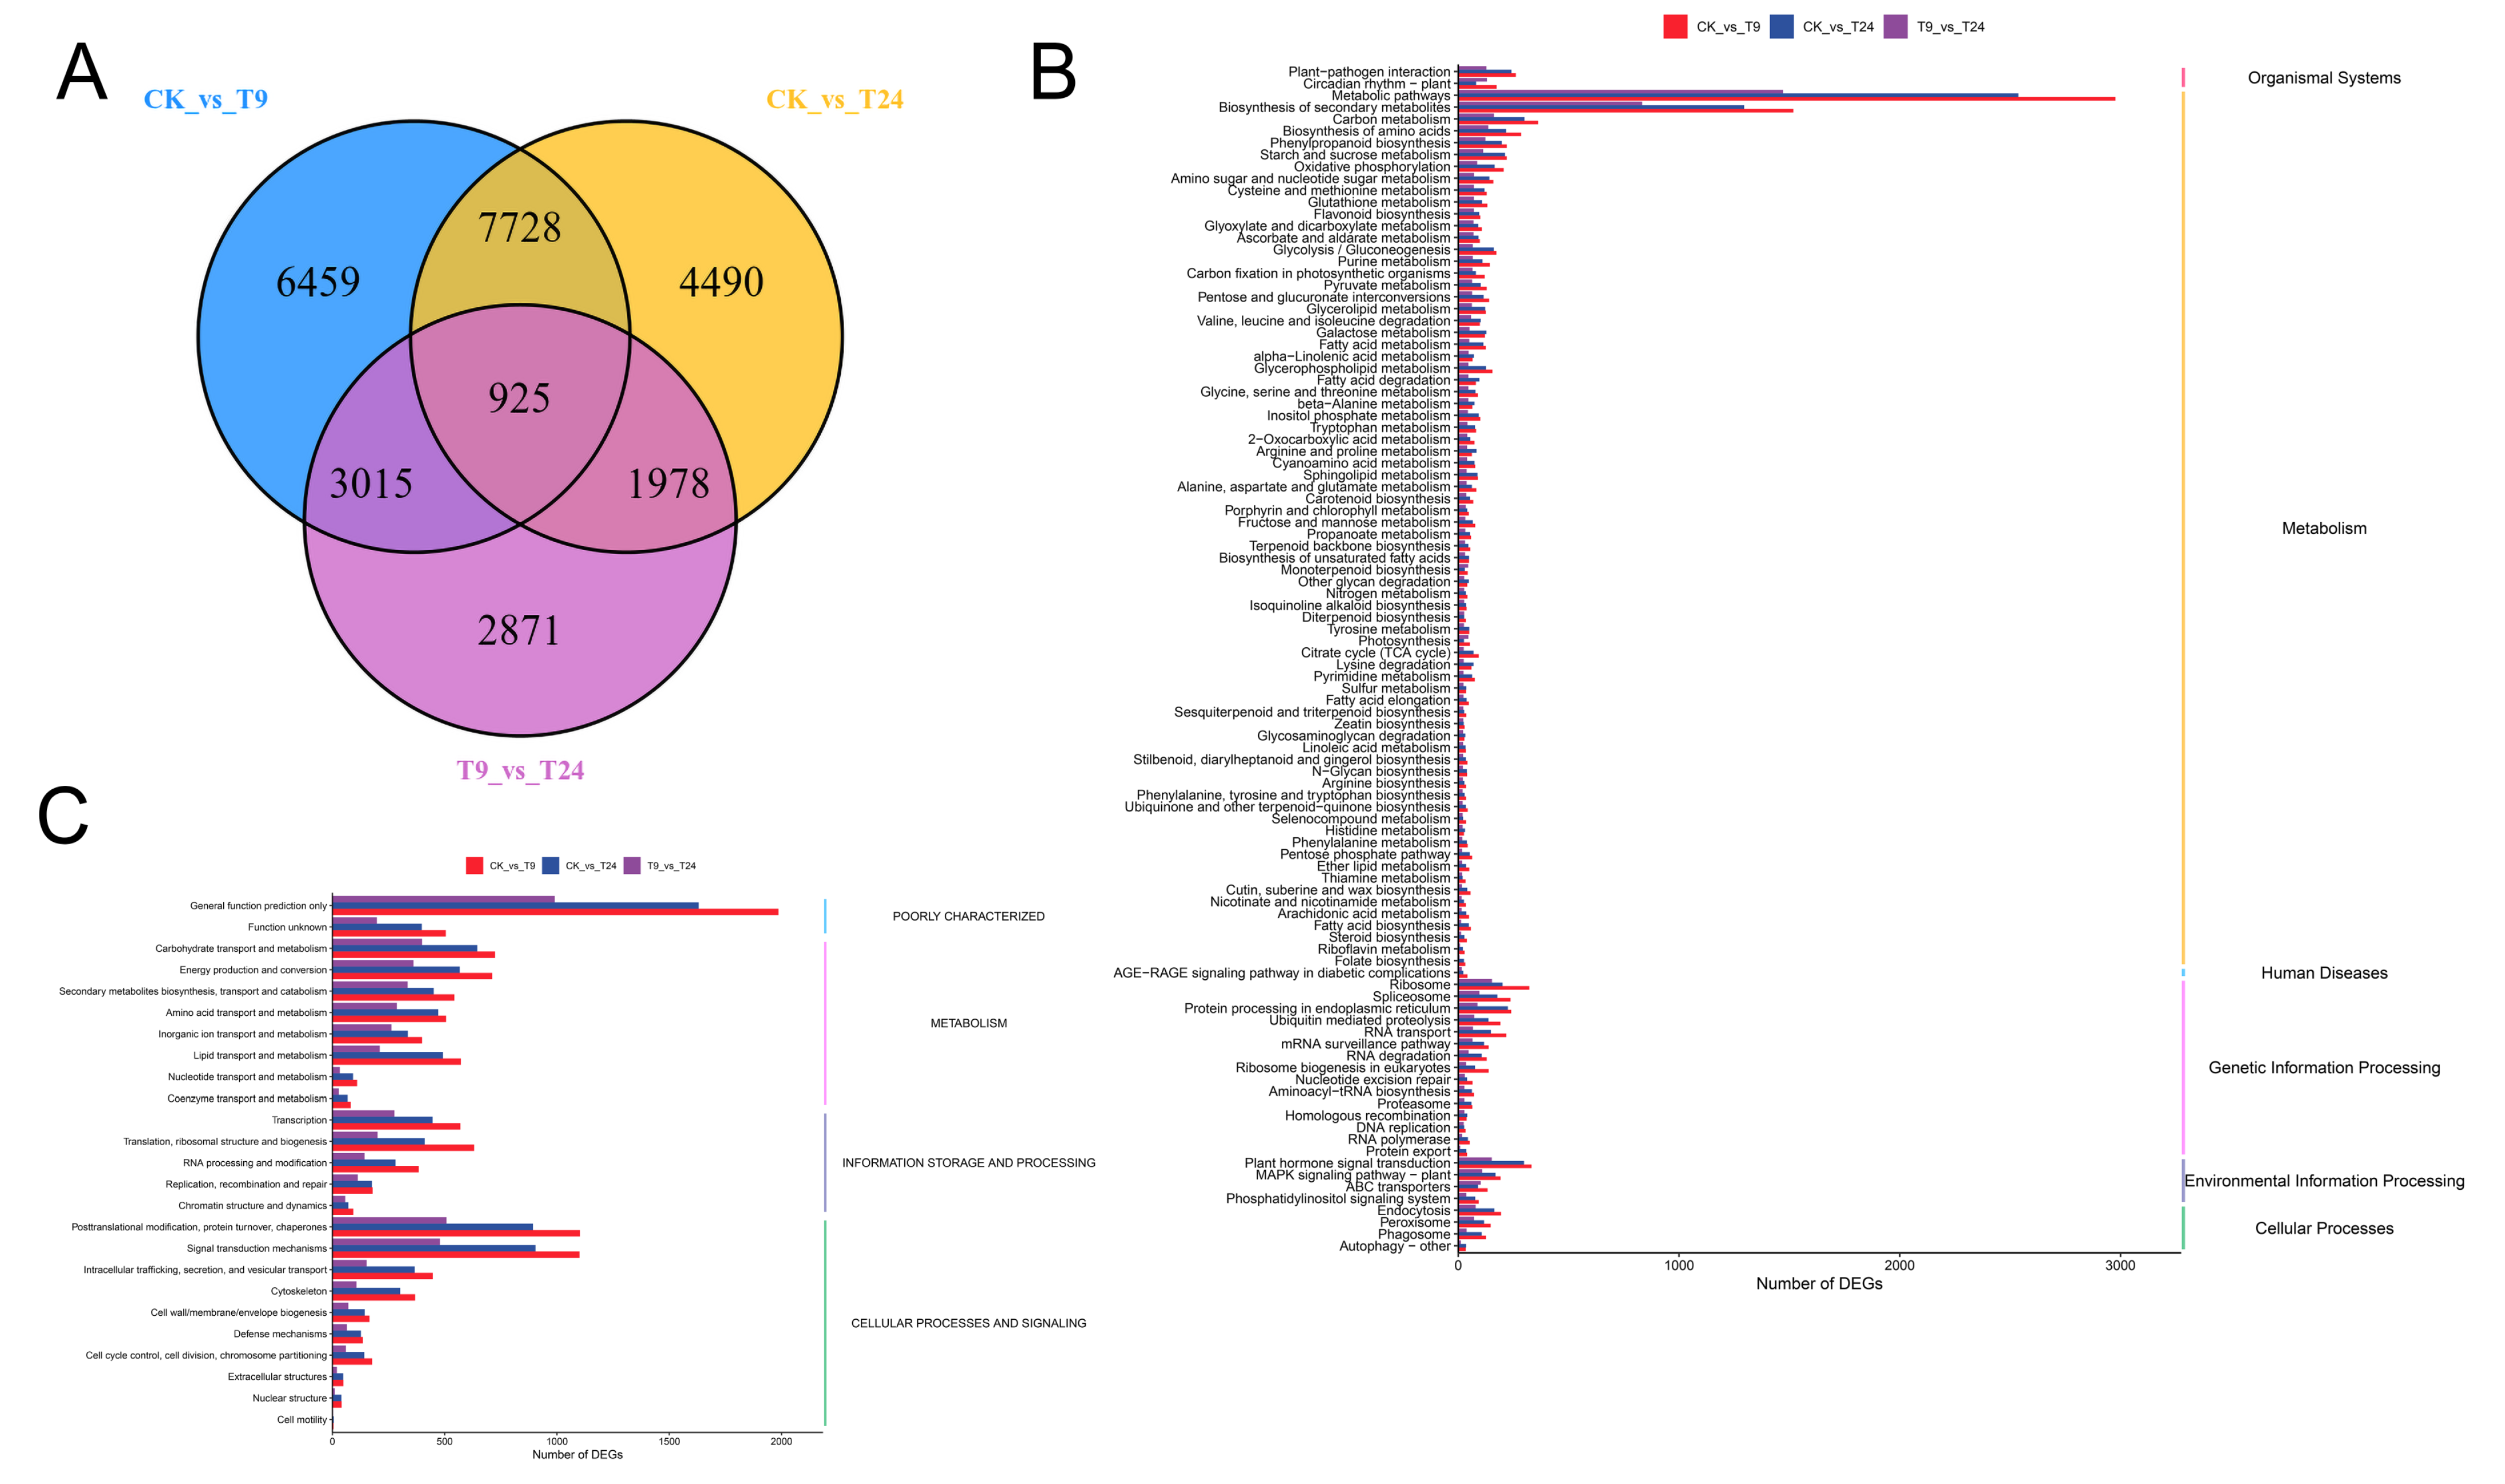
To verify the effects of self-pollination time on the transcript levels of SI genes in A. mangium, DEGs from the self-pollination treatments were identified via pairwise comparisons of the three libraries (CK/T0 vs. T9, CK/T0 vs. T24, and T9 vs. T24). A total of 18,127 (9689 upregulated and 8438 downregulated), 15,121 (7653 upregulated and 7468 downregulated), and 8789 (3998 upregulated and 4791 downregulated) DEGs were found during the comparisons of CK/T0 vs. T9, CK/T0 vs. T24, and T9 vs. T24, respectively (Table S3). Moreover, 925 DEGs were shared among the three groups (Figure 2A). The number of DEGs was higher in CK/T0 vs. T9 than in CK/T0 vs. T24, which indicated strong gene expression disturbance experienced by A. mangium at 24 h after self-pollination. The promotion of SI in A. mangium was more active at 24 h than at 9 h.
The results of the KEGG analysis revealed that significantly enriched DEGs among the three comparison groups were associated with metabolic pathways, biosynthesis of secondary metabolites, carbon metabolism, biosynthesis of amino acids, and phenylpropanoid biosynthesis (Figure 2B). Furthermore, DEGs were annotated by searching against the KOG dataset based on their annotated functions. KOG-annotated putative proteins were functionally classified into at least 25 categories, including poorly characterized, metabolism, information storage and processing, and cellular processes and signaling. In the metabolism-based classification, carbohydrate transport and metabolism, energy production and conversion, lipid and amino acid transport and metabolism, and secondary metabolite biosynthesis were the primary enriched pathways across the three groups (Figure 2C). The results indicated that these DEGs were associated with metabolic pathways that could contribute to the biosynthesis and accumulation of carbohydrates and amino acids in A. mangium flowers after different pollination times.

3.2.2. DEGs Related to SI Genes and Growth of Pollen Tubes

Previous studies have shown that the DEGs related to calcium-dependent protein kinases, thioredoxins, F-box protein families, and 26S proteases may be involved in the self-incompatibility of plants. Our fluorescence microscopic observation results suggested that there were largely ‘pollen grains could not grow’-type pollen tubes on the stigma/style in A. mangium due to self-incompatibility. The DEGs implicated in these crucial gene families were consequently screened. Moreover, the DEGs associated with pollen tube growth were searched for. Core genes related to SI were studied in detail, and the results demonstrated that most of the transcripts showed significant changes in their expression levels. The expression levels for most of the SI-related DEGs were higher in the T9 and T24 than in CK, and the DEGs in T24 were upregulated when compared with those in T9 (Table S4). There may be feedback regulation among the DEGs related to SI under self-pollination. DEGs encoding thioredoxins, which are receptor proteins related to SI, were upregulated after self pollination. Accordingly, the expression of DEGs encoding F-box protein-encoding gene families, which mediate several responses to SI, was upregulated after self-pollination (Table S4). These results indicate that self-pollination at 24 h could promote the occurrence of self-incompatibility compared with other pollination times via the direct or indirect regulation of the expression levels of SI-related DEGs.
Our fluorescence microscopy results showed that most pollen grains could not grow pollen tubes after self-pollination, and the expression of SI-related genes was significantly different at 24 h after pollination. Therefore, we chose 24 h as the time point for excavating the gene and transcription factor (TF) that affect the growth of A. mangium pollen tubes. We obtained 42 DEGs that may be related to A. mangium pollen tube growth after comparing the differences in expression between CK/T0 and T24. These DEGs were classified into fifteen main categories, including pollen receptor-like kinase clusters, 1,3-glucan synthase/sucrose synthase catalytic subunit clusters, serine/threonine protein kinase and peptidase clusters, four Ras-related protein clusters, ROP guanine nucleotide exchange factor clusters, Ca2+/calcium-dependent protein kinase clusters, S-locus glycoprotein clusters, K+-channel ERG and related protein clusters, zinc finger protein clusters, 26S proteasome clusters, DNA-binding protein clusters, acetyl-CoA and phosphoethanolamine N-methyltransferase clusters (Table S5). Moreover, we also found that two MYB clusters and four MADS-box clusters were significantly differentially expressed 24 h after self-pollination. Therefore, SI-related gene families (such as Ca2+/calcium-dependent protein kinase, S-locus glycoprotein, and 26S proteasome-encoding genes), TFs, and carbohydrate and amino acid protein kinases may be associated with the self-incompatibility of A. mangium.

3.2.3. The Co-Expression Network between Differentially Expressed TFs and SI-Related Genes

A. mangium flowers with different self-pollination times showed significantly different TFs, primarily belonging to 83 different families (Figure 3A, Table S5). Most of the differentially expressed TFs belonged to the NAC, bZIP, MYB-related, MYB, WRKY, HB-HD-ZIP, bHLH, AP2/ERF-ERF, and C2H2 families. There were more differentially expressed TFs in CK/T0 after self-pollination, and few expressed TFs in T9 and T24, indicating that self-pollination promoted changes in gene or TF expression levels (Figure 3B).
TFs regulate gene expression patterns by acting as activators or repressors to induce or inhibit gene promoter activity. There is a potential regulatory mechanism by which differentially expressed TFs may influence the expression levels of SI-related genes. Co-expression networks were established between TFs and SI-related genes (CK vs. T24) to verify this hypothesis using gene expression profile data based on the correlation coefficient. The resulting co-expression networks indicated that different TFs connected distinct genes, and there were correlations among them (Figure 3C). TFs (MYB, HB-HD-ZIP, AP2/ERF-ERF, and bZIP) connected more genes related to SI in A. mangium flowers 24 h after self-pollination.

3.3. Transcriptome–Metabolome Joint Analysis

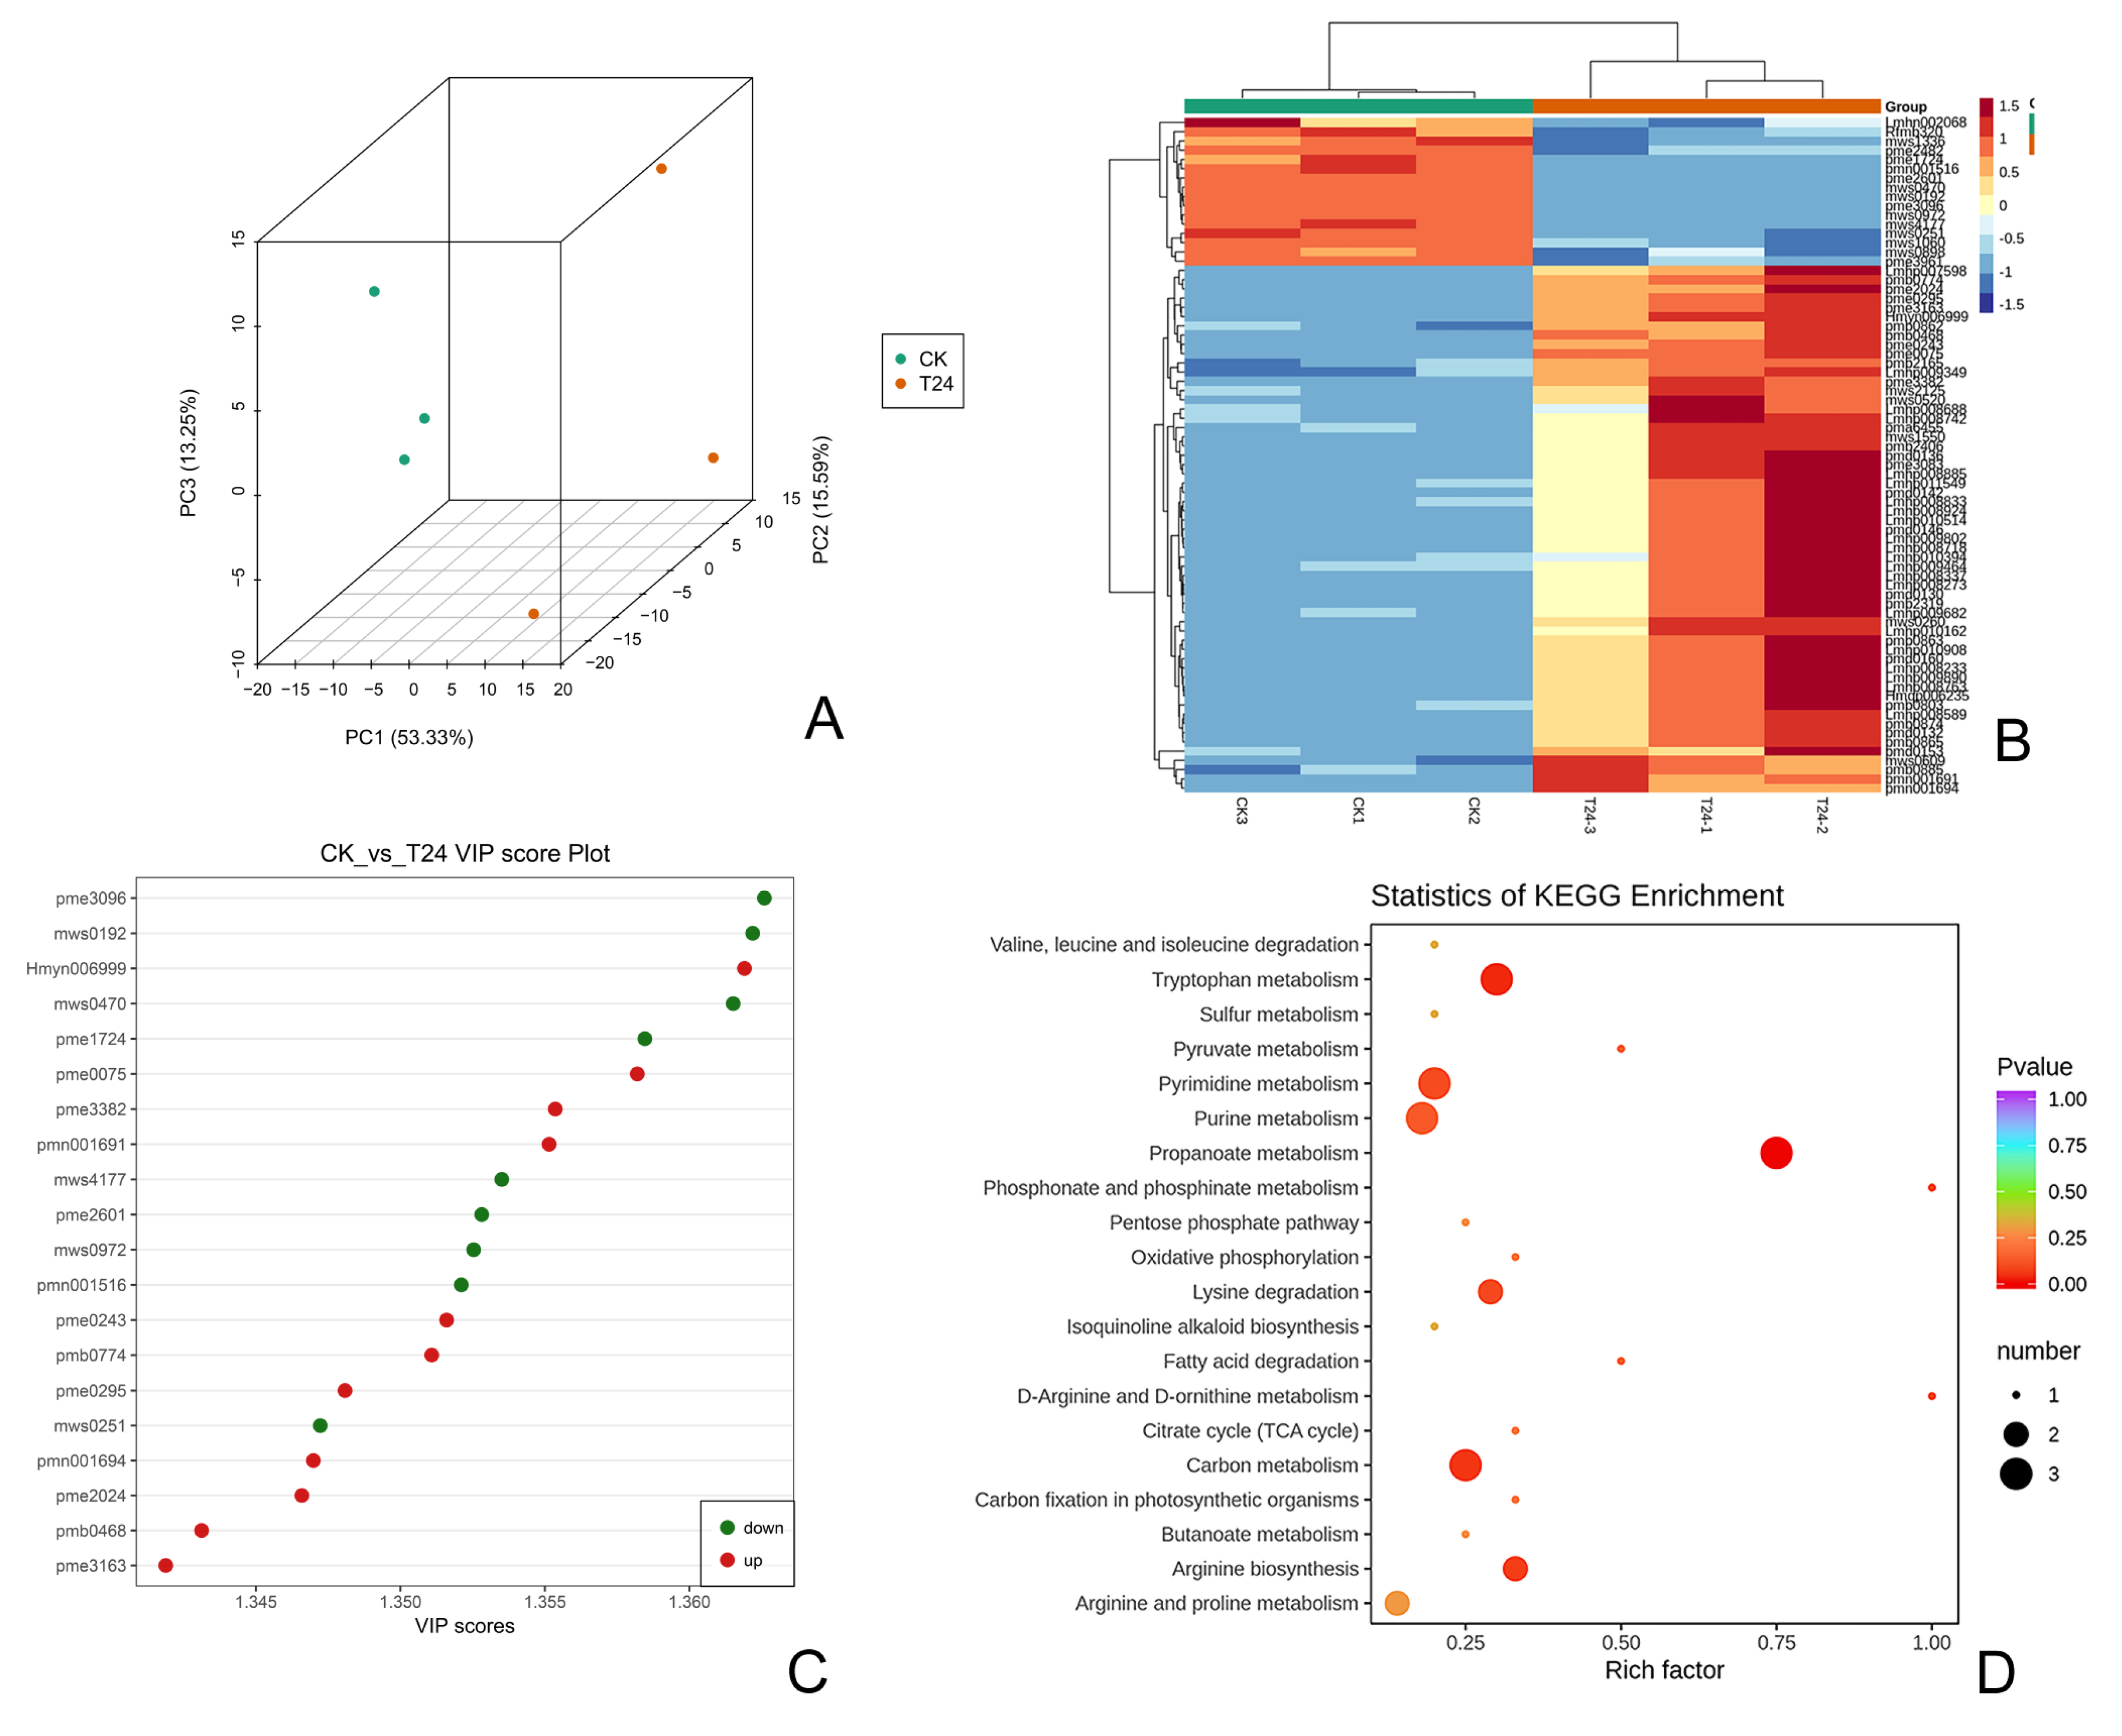
UPLC-MS/MS was used to compare the metabolite compositions of A. mangium flowers after self-pollination by hand at different times. PCA was used to classify six samples into two distinct clusters, accurately reflecting the four light-quality treatments applied to blueberry leaves (Figure 4A). The differences between the CK/T0 and T24 resulted from PC1, PC2 and PC3 in this model (53.33%, 15.59% and 13.25% of the variables, respectively). A total of 73 differential metabolites were identified at 0 and 24 h following self-pollination, among which 16 were downregulated and 57 were upregulated (Figure 4B). For the significantly differential metabolites, unit variance scaling (UV) normalization processing was used, and heatmaps were created for CK/T0 vs. T24 using the R programming language. Thus, 73 anthocyanins were grouped into seven categories, among which lipids, amino acids, and their derivatives were significantly different between T0 and 24 h after self-pollination (Figure S2A). An orthogonal partial least-squares discriminant analysis (OPLS-DA) model was used to identify the differentially accumulated metabolites responsible for metabolic differentiation between the two treatments. A total of 20 (11 up-accumulated, 9 down-accumulated) metabolites were selected for a comparative analysis of CK and T24 (Figure 4C).
Furthermore, according to the differential metabolite KEGG enrichment map (Figure 4D), the pathways with more significant scatterplot enrichment showed the following order: tryptophan metabolism, propanoate metabolism, glycerophospholipid metabolism, ether lipid metabolism, phosphonate and phosphinate metabolism, arachidonic acid metabolism, and arginine biosynthesis. Based on a differential metabolite analysis, glycerophospholipid metabolism, propionate metabolism, ether lipid metabolism, and arginine biosynthesis were the pathways that produced the most diverse metabolites.

3.4. Joint Transcriptomic–Metabolomic Analysis

3.4.1. Differentially Expressed Genes and Metabolites Related to SI

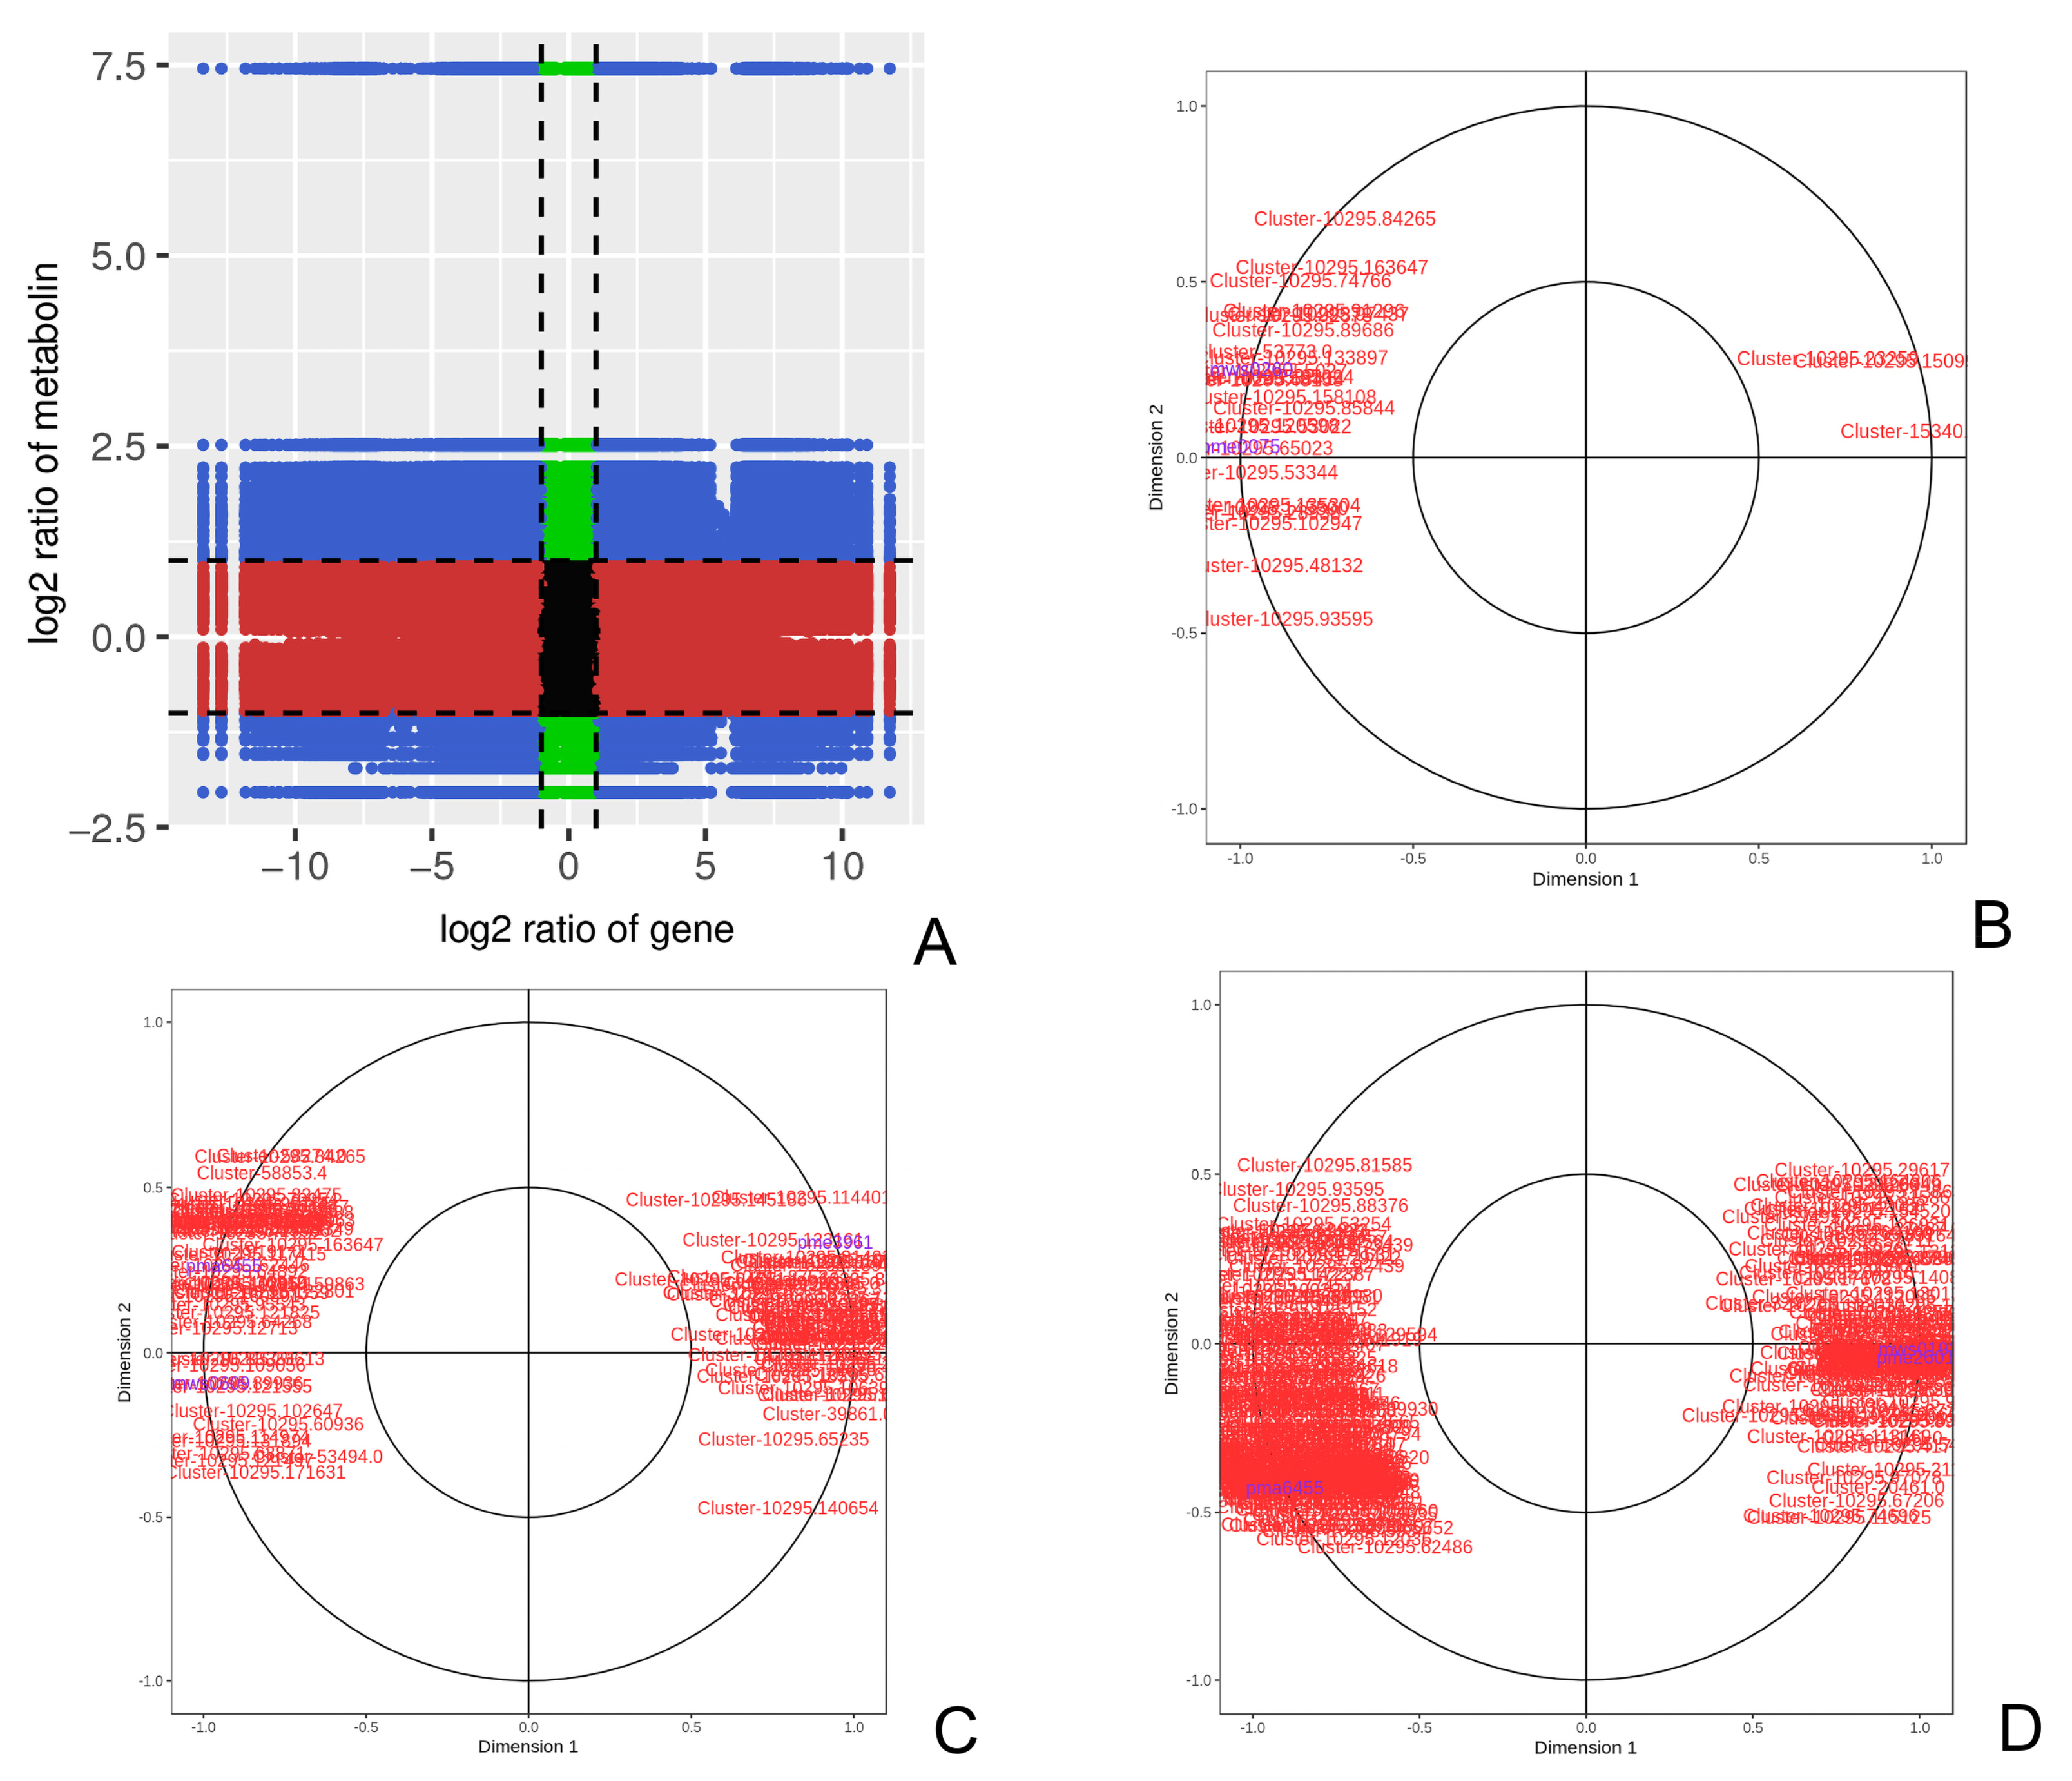
Based on the enrichment analysis results for differential metabolites and differential genes, the correlations between the identified differentially expressed genes and metabolites were analyzed by drawing a nine-quadrant diagram (Figure 5A). The genes were upregulated and the metabolites were downregulated in quadrants 6, 8 and 9. According to the categories of SI-related genes, 166 genes for S-locus glycoproteins, 419 genes for calcium-dependent protein kinases, 249 genes for calmodulin, 2440 genes for thioredoxin, 2830 genes for F-box protein, and 1776 genes for the 26S proteasome were found in quadrants 6, 8, and 9 (Figure 5A). In addition, transcripts with significantly different expressions are also shown in Table S8. These results also indicated that the expression of SI genes in A. mangium can regulate metabolites.
The above differential metabolites and differential genes with correlation coefficients above 0.8 were selected to draw network maps. Ten maps associated with SI-related genes were found among all 34 network maps. The network related to the thioredoxin genes (ko00920 and ko01200) was associated with succinate (Succinate) numbered mws0192 (Figure S2, Table S6). The network plots (ko00280, ko00350, ko00360, ko00410, ko00650, and ko00950) related to the F-box genes were associated with methylmalonate, succinate, and 3-hydroxypropanoic acid (Figure S3, Table S6). Furthermore, a canonical correlation analysis (CCA) was carried out on differentially expressed genes related to SI and metabolites. Notably, three CCA maps related to thioredoxin genes were obtained, and the metabolites (L±-arginine, N-acetyl-L-glutamic acid, ribulose-5-phosphate, 2-deoxyadenosine, guanosine 3′,5′- cyclic monophosphate, 3- hydroxypropionic acid, and succinate) connected more genes related to SI (Figure 5B–D, Table S7). All of the differential metabolites were also selected to establish an O2PLS model for screening out the important metabolites affecting other levels of omics (Table S9, Figure S4). The results showed that the metabolites named succinate, N-acetyl-L-glutamic acid, 3-hydroxypropionic acid, and methylmalonate presented high correlations with transcriptomic results. These metabolites corresponded to the above analysis of the network maps.
Through the joint analysis of differential genes and metabolites based on KEGG enrichment, we found that 6 S-glycoproteins, 38 SCF ubiquitin ligases, 93 F-box proteins, 68 26S proteasomes, 36 calcium-dependent protein kinases, 27 calmodulins, and 67 thioredoxin genes related to SI were significantly differentially expressed. Furthermore, classifying the significantly 247 DEGs associated with SI via a KEGG enrichment analysis revealed a total of six pathway maps, five of which were related to the F-box protein pathway (tyrosine metabolism, phenylalanine metabolism, β-alanine metabolism, valine, leucine and isoleucine degradation, and butanoate metabolism) and one of which was related to thioredoxin (sulfur metabolism). There are two distinct genes that encode F-box proteins, which are involved in the production of three important metabolites: succinate, 3-hydroxypropionic acid, and methylmalonate. Five distinct genes are associated with thioredoxin, and succinate is the associated metabolite. In addition, succinate accounted for the majority of the differential metabolites associated with the six pathways (Table 1).

3.4.2. Joint Analysis of the Path Graph of SI from the Perspective of Transcriptomics and Metabolomics

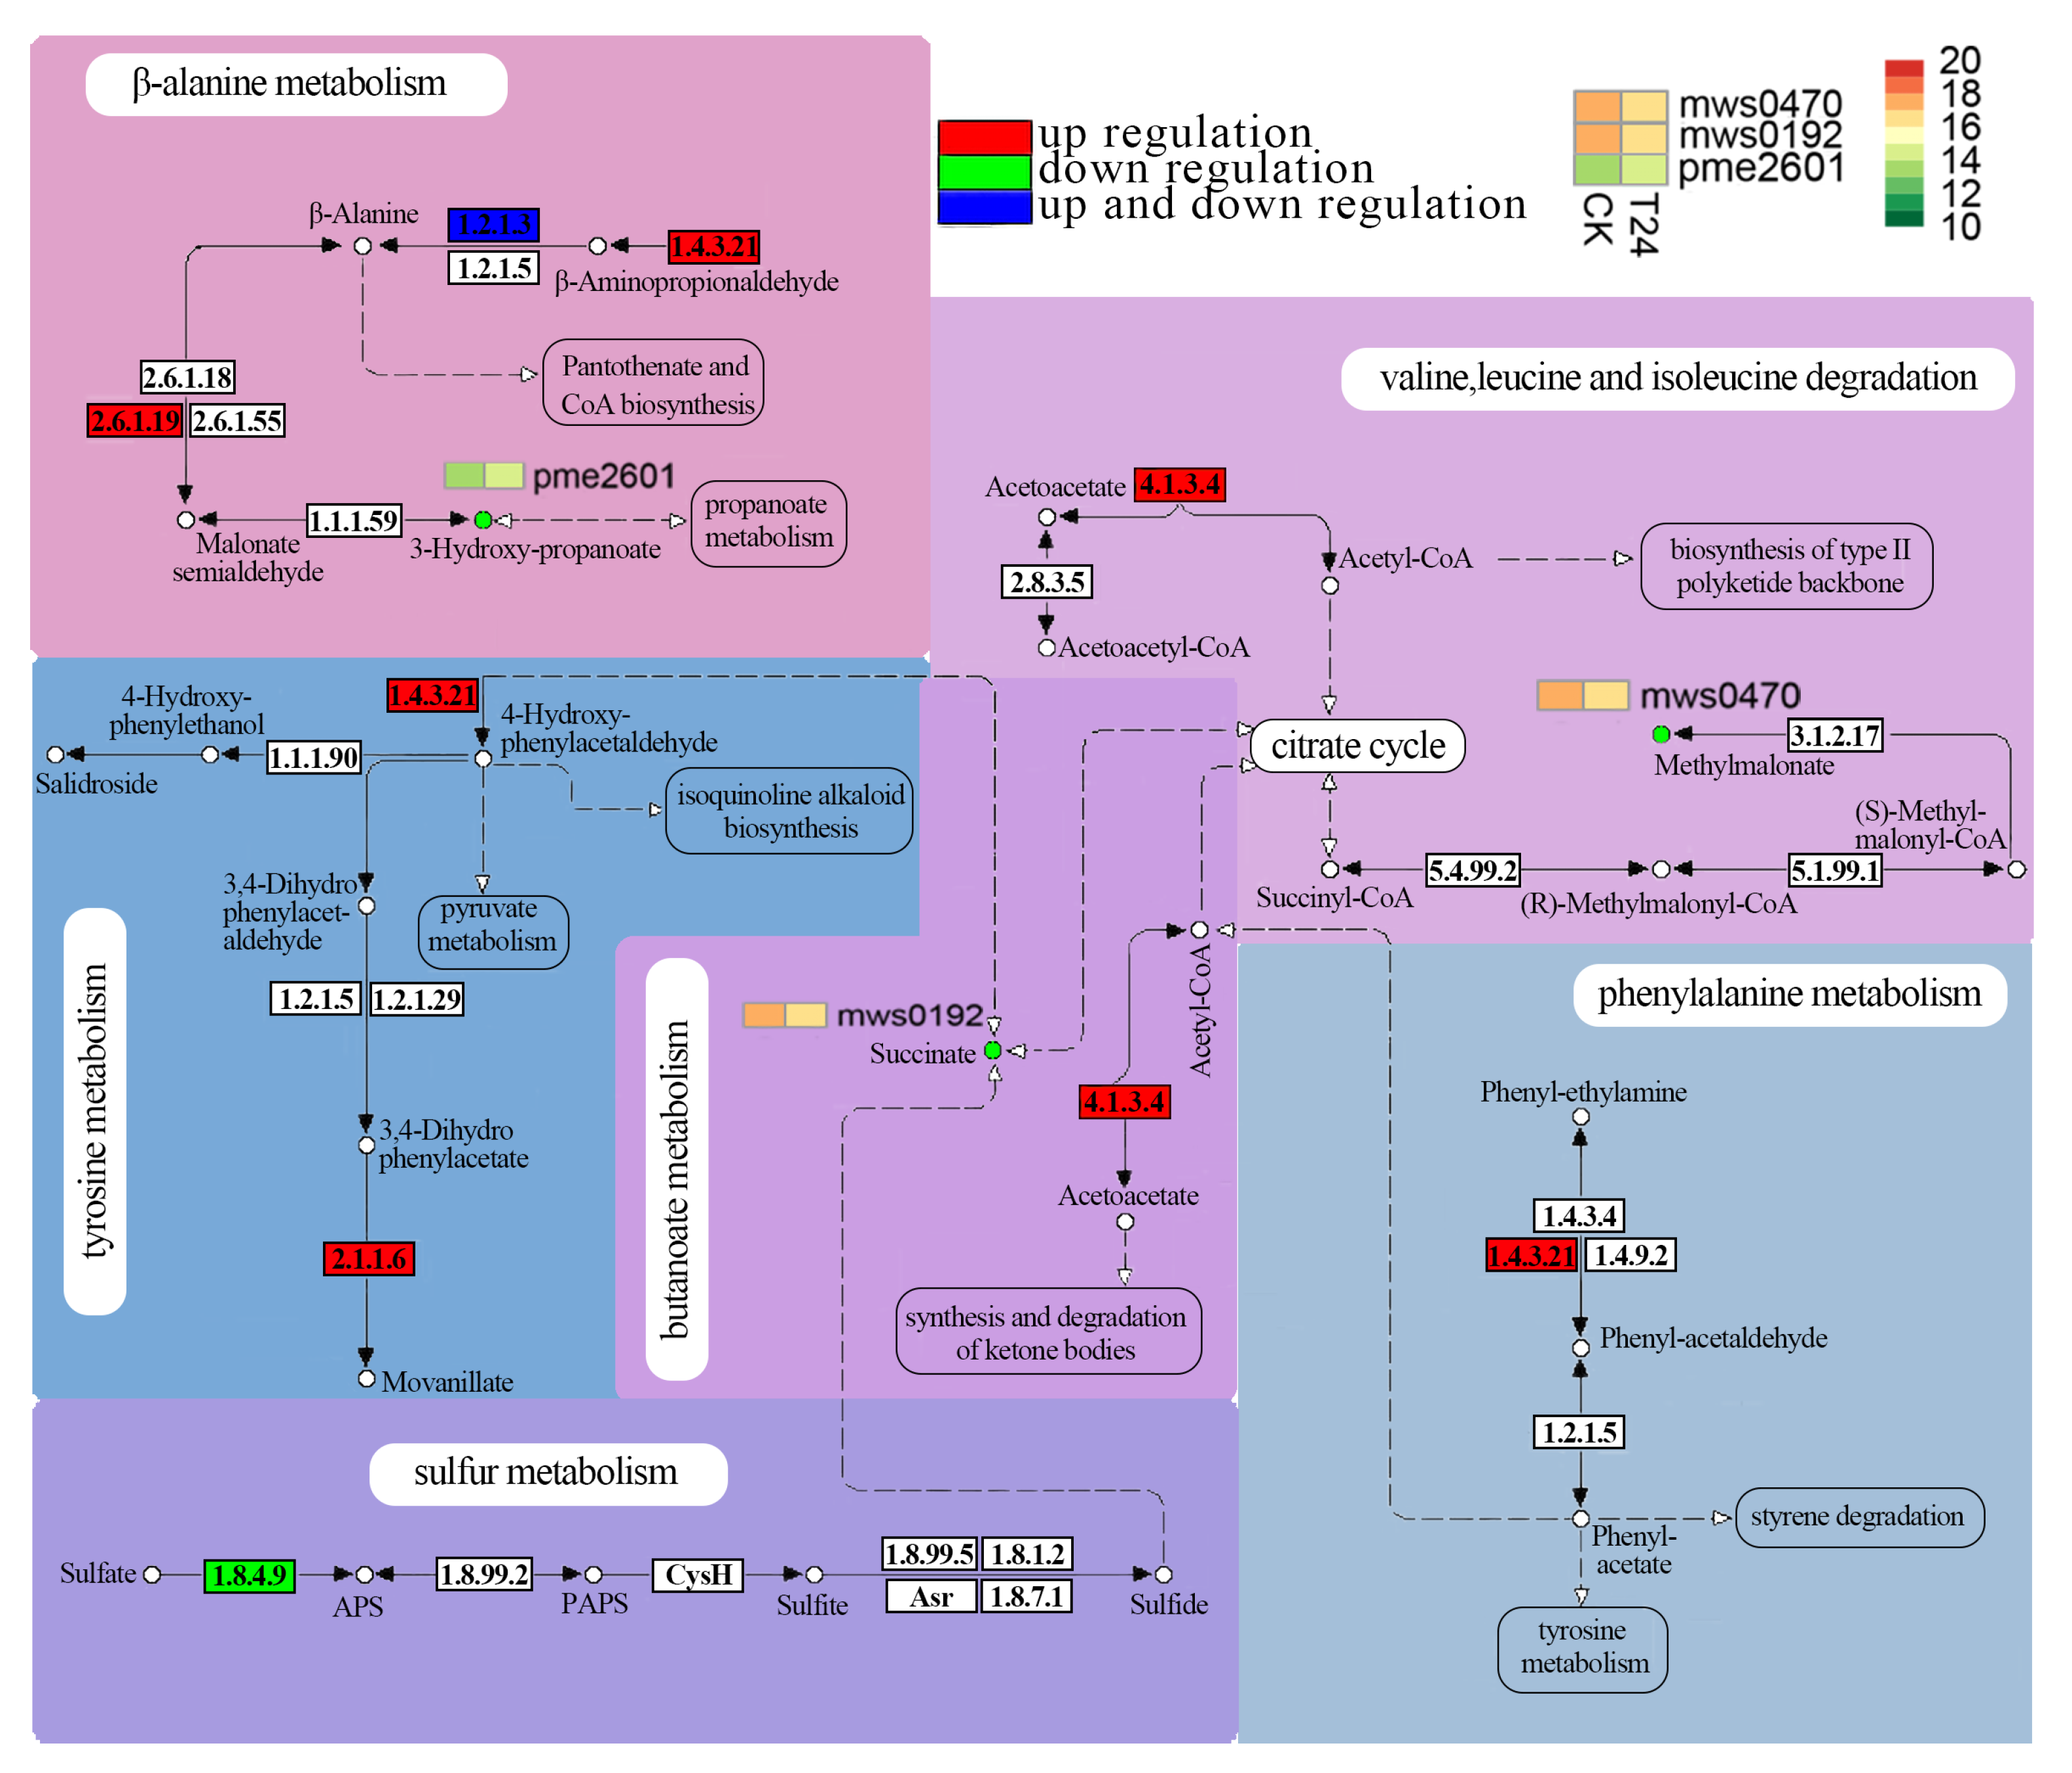
As shown in Figure 6, analysis of the six pathway diagrams revealed that the expression of a gene in the F-box protein family (Cluster-10295.69454) (enzyme code: 1.4.3.21) was significantly upregulated, and the metabolite 4-hydroxy-phenylacetaldehyde, generated in the tyrosine metabolic pathway, entered the isoquinoline alkaloid biosynthesis pathway; it also entered the pyruvate and butanoate metabolism pathways via the production of 4-hydroxy-phenylacetaldehyde. On the other hand, movanillate was produced in a reaction catalyzed by catechol O-methyltransferase (enzyme code: 2.1.1.6). In phenylalanine metabolism, a significantly upregulated SI gene product (Cluster-10295.69454) (enzyme code: 1.4.3.21) works with two other enzymes to produce the metabolite phenyl acetate. Then, the product enters the tyrosine metabolism and styrene degradation pathways; on the other hand, it enters the citric acid cycle (or tricarboxylic acid cycle or TCA) through acetyl-CoA. An SI gene product (Cluster-10295.69454) (enzyme code: 1.4.3.21) produces the metabolite alanine in the β-alanine metabolism pathway and the β-alanine branch in pantothenate and CoA biosynthesis. On the other hand, the differentially downregulated metabolite 3-hydroxy-propionate was produced under the action of 4-aminobutyrate aminotransferase (EC: 2.6.1.19).
A significant downregulation of another F-box gene (Cluster-10295.32019) (enzyme code: 4.1.3.4) causes valine, leucine and isoleucine degradation, while acetyl acetate is produced; when this product enters the biosynthesis pathway of the type II polyketide backbone through acetyl-CoA production and enters the citric acid cycle, the metabolite succinate is significantly downregulated, indirectly leading to significant downregulation of the metabolite methylmalonate. In the butanoate metabolism pathway, Cluster-10295.32019 (enzyme code: 4.1.3.4) affects the synthesis and degradation of ketone bodies by producing acetyl acetate; it also participates in the citric acid cycle, producing a significantly downregulated metabolite, succinate.
Therefore, it is reasonable to speculate that the significant upregulation of SI genes after pollination will affect the expression of some enzymes (such as the enzyme codes 1.4.3.21, 2.1.1.6, 2.6.1.19, 4.1.3.4, and 1.8.4.9), and will thereby cause a large reduction in metabolites (succinate, methylmalonate and 3-hydroxypropionate), which are strongly associated with the occurrence of SI. All abbreviations are shown in Schedule S10 (Table S10). Laboratory diagrams of sample preparation, plant sampling, and RNA extraction are shown in Figure S5 (Figure S5).

4. Discussion

4.1. SI Type in A. Mangium

According to the state and position of the pollen tube, there are three main types of GSI. In the third GSI type, mediated by Ca2+, pollen cannot germinate normally on the stigma after pollination [4,60]. Early studies found that the seed setting rate of A. mangium was low due to the SI [42]. In this study, fluorescence microscopy revealed that at 24 h after self-pollination, more than 90% of A. mangium pollen grains could not germinate, which is very similar to what is observed in Ca2+-mediated GSI [60]. Cases in which a wet stigma manifests SI usually involve the GSI mechanism [61,62]. In the mature A. mangium pistil, the surface of the stigma secretes mucus, resulting in a wet stigma [41]. Therefore, we believe that the SI mechanism of A. mangium can be classified as a GSI mechanism.
According to previous research results, in self-pollinated and hybrid A. caven showing GSI, pollen tubes can reach the ovary within 11 h, but pollen tubes from the self cannot enter the embryo sac [27,63]. Additionally, in A. senegal showing GSI, pollen tubes can access the ovules [28]. The above research findings show that the GSI mechanism of Acacia species is characterized by variable performance. Sedgley found via fluorescence microscopy that pollen tubes entered the style channel of A. mangium [64]. However, they did not record the rate of entry into the style passage, and they only counted the numbers of pollen tubes after entry into the style. In this study, more than 90% of the pollen grains were unable to germinate 24 h after self-pollination (Table S1), and the results showed similarities to the GSI mechanism, in which pollen cannot germinate after self-pollination [2,4,65,66]. Hence, we speculated that the SI mechanism of A. mangium was roughly similar to that of most acacia species, and both were GSI mechanisms [24,27,28,63,67].

4.2. Transcriptomic Analysis

Studies have shown that when SI occurs, the increase in the Ca2+ concentration leads to the inhibition of pollen tube growth [13,65], and the increase in Ca2+ is related to the SI response [66,68]. A study of A. mangium showed that high concentrations of Ca2+ exert a significant inhibitory effect on pollen germination [69]. Our study also identified 28 calcium-dependent protein kinase genes that were significantly differentially expressed. Therefore, we further hypothesized that A. mangium was Ca2+-mediated GSI after self-pollination [65,66], and the increase in the Ca2+ concentration and other modifications may prevent the formation of synthetic pollen tube material, inhibit the elongation of the pollen tube, and eventually result in the occurrence of SI. An SCF complex composed of the four protein subunits (SKP1, CUL1, RBX1, and F-box proteins, and the majority of the proteins produced by the F-box) takes part in ubiquitination and facilitates the ubiquitination and destruction of target proteins. The target proteins are ubiquitinated, and the 26S proteasomes can detect ubiquitin substrates and degrade them [70,71]. It has been reported that F-box protein genes play a role in the self-incompatible S-RNase system of plants [72,73]. In this assay, all gene families related to 26S proteasomes and F-box proteins were upregulated similarly to SI plants [70,71,73], suggesting that these genes may be crucial in the development of SI in A. mangium. As a type of multifunctional acidic protein, thioredoxin generally participates in various reactions in cells via reduced disulphide bonds [74]. The key gene bm2, identified in a study of the SI of Eupatorium adenophorum, encodes a thioredoxin-like product, and functional verification showed that bm2 plays a very important role in the SI of E. adenophorum [75]. The thioredoxin h protein from Nicotiana alata (NaTrxh) is expressed by the transmitting tissue cells of the style and secreted to the extracellular matrix; however, its essential role in the pollen rejection response suggests a function within the pollen tube [76,77]. Forty-one thioredoxin genes with variable expression were also identified in A. mangium, which proved that thioredoxin may play a role in SI of A. mangium [75,77]. However, further research is required to determine whether they contribute to the SI of A. mangium in the stylus channel surface and pollen interior.
The growth of pollen tubes and SI are tightly connected. In recent years, research on this related gene has found that sequences encoding Ca2+/calcium-dependent protein kinases, the 26S proteasome, and serine/threonine kinase proteins have been shown to be involved in the reaction of pollen tubes to recognize non-self and self S-RNase proteins [78,79,80]. Moreover, two MADS-box transcription factors have also been proven to be close to the S-locus in HIS [81]. A zinc-finger protein and a MYB protein were also encoded by genes that are specifically or preferentially expressed genes in stigmas/style after self-pollination [82,83]. Similarly, transcriptome analysis also identified these specifically expressed genes and TFs in this study. The questions as to whether these genes are involved in the SI reaction of A. mangium and what their specific functions are require further study.

4.3. Metabolomic Analysis

The metabolites produced by pollen grain germination can increase or inhibit germination and pollen tube growth [23]. For example, fatty acids/lipids are essential for the hydrophobic interaction between pollen and stigmas [84], pollen tube growth requires fatty acids to form membrane lipids [85], and flavonoids can promote pollen germination and pollen tube growth [86]. Goetz et al. argue that glucose and sucrose are metabolic signals required for pollen germination and extension [87]. Zhao et al. analyzed the metabolic profile of tomato SI and identified a total of nine different compounds related to self-pollination and non-self-pollination, including amino acids, sugars, fatty acids/lipids, and organic acids [88]. Additionally, recent research by He et al. on Camellia oleifera self-flowering and cross-pollination revealed variations in both lipid metabolism and the mechanism of flavonoid synthesis. Thus, He et al. hypothesized that self-pollination alters the peroxisome pathway and inhibits lipid metabolism, which together reduce the production of flavonoids after self-pollination and cause SI in C. oleifera [22].
In this study, the metabolomic analysis of A. mangium at 0 h and 24 h after self-pollination indicated that significantly altered metabolites included lipids, organic acids, amino acids, and their derivatives, similar to previous studies [84,85,88]. As a result, it is hypothesized that lipids, organic acids, and amino acids may also play a role in the SI of A. mangium, but this hypothesis still needs to be confirmed.

4.4. Model-Based Prediction of Transcripts and Metabolites Related to SI of A. Mangium

The six identified pathways, sulfur metabolism, butyric acid metabolism, tyrosine metabolism, phenylalanine metabolism, alanine metabolism, and valine, leucine, and isoleucine degradation, were correlated with the SI-related genes, and all metabolites were found to be directly or indirectly associated with the SI genes. Meanwhile, the citric acid cycle (or tricarboxylic acid cycle, or TCA) was also found to be an important pathway for connecting SI genes and metabolites (Figure 6). The phenylalanine metabolism of A. mangium corresponds to previous research showing that phenylalanine related to RNase NE inhibits the elongation of germ tubes via degradation of microbial RNAs [89]. Amino acids/peptides and tricarboxylic acid cycle-related metabolites were also found to be involved in heteromorphic self-incompatibility [90]. Additionally, the compounds that were correlated with these genes in the six pathways, namely, succinate, methylmalonate, and 3-hydroxypropionate, were considerably enriched, with succinate accounting for the highest proportion. Thioredoxin h2 and the mitochondrial thioredoxin system regulate the metabolic fluxes throughout the tricarboxylic acid cycle and associated pathways (glycolysis, gluconeogenesis and the synthesis of glutamine) [91]. The F-box targets citrate synthase 2 for proteasomal degradation, thereby suppressing the glyoxylate cycle, an anabolic pathway that replenishes the TCA cycle with succinate for the activation of gluconeogenesis [92]. Notably, in our results, the significantly upregulated and SI-related transcripts (F-box and thioredoxin gene families) were associated with the metabolites (succinate, methylmalonate and 3-hydroxypropionate) in the corresponding pathway, and were all significantly downregulated. Other research has found that metabolites are associated with the expression of transcripts, which are related to plant SI [8,80,93]. Therefore, we speculate that these metabolites, genes, and SI-related TFs are associated with the inhibition of pollen growth and the occurrence of SI in A. mangium (Figure 7).

5. Conclusions

The SI mechanism of A. mangium was not clear. In order to further understand the SI of A. mangium, the flowers were analyzed at different time points after pollination and from the perspectives of cell and molecular biology. We found that over ninety percent of the pollen grains produced no pollen tube growth on the stigma/style. We speculated that A. mangium was GSI. In addition, DEGs related to SI (6 S-glycoproteins, 93 F-box proteins, 69 26S proteasomes, 38 calcium-dependent protein kinases/calmodulin and 41 thioredoxin genes) were significantly enriched. Further analysis of six pathways (sulfur metabolism, tyrosine metabolism, phenylalanine metabolism, and butanoate metabolism, and valine, leucine and isoleucine degradation) revealed the enrichment of SI-related DEGs corresponding to succinate, methylmalonate and 3-hydroxypropane. Additionally, the three metabolites were significantly downregulated. Combining analyses of the transcriptome and metabolome, we suggested that transcripts encoding thioredoxin and F-box proteins were significantly upregulated under the regulation of transcription factors after self-pollination, leading to a decrease in succinate, methylmalonate and 3-hydroxypropionate. These may play a key role in the occurrence of the self-incompatibility of A. mangium.

Supplementary Materials

The following supporting information can be downloaded at: https://www.mdpi.com/article/10.3390/f14102034/s1, Table S1. Pollen germination rate of A. mangium after self-pollination (same tree) and cross-pollination (different trees); Table S2. Statistics of transcriptome sequencing data of A. mangium; Table S3. Number and expression analysis of differentially expressed genes; Table S4. Classification and expression characteristics of significantly differentially expressed genes in CK/T0 vs. T9, CK/T0 vs. T24 and T9 vs. T24; Table S5. Classification and expression characteristics of TFs in CK/T0 vs. T9, CK/T0 vs. T24 and T9 vs. T24; Table S6. The genes and metabolites of Figures S2 and S3; Table S7. The genes and metabolites of Figure S5B–D; Table S8. Classification of significantly differentially expressed genes in CK vs. T24; Table S9. Top ten genes and metabolites with a greater influence on other histology by O2PLS analysis; Table S10. Abbreviations of target gene families; Figure S1. Fluorescence microscopy observations of Acacia mangium. Scale bar = 100 μm (white); Scale bar = 10 μm (blue). A–F, Pollen germination at 3, 6, 9, 12, 24 and 48 h after self-pollination. G–H: Pollen germination at 3, 6, 9, 12, 24 and 48 h after cross-pollination from the same clones. M: Flower spike of A. mangium. N: A whole pistil that has been pollinated. O: A pistil that has not been pollinated. P–R: Enlarged view of the contact area between the pistil and pollen; Figure S2. Two correlation network diagrams of the thioredoxin genes and metabolites; Figure S3. Six correlation network diagrams of F-box proteins and metabolites; Figure S4. O2PLS model for screening out the important metabolites affecting another omics; Figure S5. The diagrams of hand pollination, flower collection, pistil peeling, RNA extraction, and detection in the experiment.

Author Contributions

Conceptualization, L.H. and B.Z.; Methodology, R.Z.; Software, R.Z.; Validation, L.H., B.Z. and R.Z.; Formal Analysis, R.Z.; Investigation, L.H.; Resources, L.H.; Data Curation, R.Z.; Writing—Original Draft Preparation, R.Z.; Writing—Review and Editing, R.Z.; Visualization, R.Z.; Supervision, B.Z. and L.H.; Project Administration, B.Z. and L.H.; Funding Acquisition, B.Z. and L.H. All authors have read and agreed to the published version of the manuscript.

Funding

This research was funded by the National Key R&D Program of China during the 14th Five-Year Plan Period—Selection and breeding of excellent varieties of Acacia melanoxylon solid wood and A. mangium × A. auliculiformis pulp wood. (2022YFD2200205-1) and Fundamental Research Funds of Chinese Academy of Forestry (CAFYBB2017MB009). The APC was funded by the Chinese Academy of Forestry. The funders had no role in study design, data analysis, or manuscript preparation.

Data Availability Statement

Transcriptome sequence data from this article can be found in the NCBI database under BioProject code PRJNA 947385.

Conflicts of Interest

The authors declare no conflict of interest.

References

  1. Allen, A.M.; Hiscock, S.J. Evolution and Phylogeny of Self-Incompatibility Systems in Angiosperms. In Self-Incompatibility in Flowering Plants; Springer: Berlin/Heidelberg, Germany, 2008; pp. 73–101. [Google Scholar] [CrossRef]
  2. Liu, L. Rapid identification of self-incompatibility in radish(Raphanus sativus L.) with fluorescent observation. J. Nanjing Agric. Univ. 2007, 30, 30–34. [Google Scholar] [CrossRef]
  3. Jun, S.G.; Lin, H.X. Measurement of Self-incompatible by Fluoroscope Observation in Non-heading Chinese Cabbage. J. Wuhan Bot. Res. 2004, 22, 197–200. [Google Scholar]
  4. Jordan, N.D.; Ride, J.P.; Rudd, J.J.; Davies, E.M.; Franklin-Tong, V.E.; Franklin, F. Inhibition of Self-incompatible Pollen in Papaver rhoeas Involves a Complex Series of Cellular Events. Ann. Bot. 2000, 85, 197–202. [Google Scholar] [CrossRef]
  5. Wachira, F.N.; Kamunya, S.K. Pseudo-self-incompatibility in some tea clones (Camellia sinensis (L.) O. Kuntze). J. Hortic. Sci. Biotechnol. 2005, 80, 716–720. [Google Scholar] [CrossRef]
  6. Chen, X.; Hao, S.; Wang, L.; Fang, W.; Wang, Y.; Li, X. Late-acting self-incompatibility in tea plant (Camellia sinensis). Biologia 2012, 67, 347–351. [Google Scholar] [CrossRef]
  7. Zhang, C.C.; Wang, L.Y.; Wei, K.; Wu, L.Y.; Li, H.L.; Zhang, F.; Cheng, H.; Ni, D.J. Transcriptome analysis reveals self-incompatibility in the tea plant (Camellia sinensis) might be under gametophytic control. BMC Genom. 2016, 17, 359. [Google Scholar] [CrossRef] [PubMed]
  8. Zhou, J.; Lu, M.; Yu, S.; Liu, Y.; Yang, J.; Tan, X. In-depth Understanding of Camellia oleifera Self-incompatibility by Comparative Transcriptome, Proteome and Metabolome. Int. J. Mol. Sci. 2020, 21, 1600. [Google Scholar] [CrossRef]
  9. Naithani, S.; Chookajorn, T.; Ripoll, D.R.; Nasrallah, J.B. Structural modules for receptor dimerization in the S-locus receptor kinase extracellular domain. Proc. Natl. Acad. Sci. USA 2007, 104, 12211–12216. [Google Scholar] [CrossRef]
  10. Stein, J.C.; Howlett, B.; Boyes, D.C.; Nasrallah, N.J.B. Molecular cloning of a putative receptor protein kinase gene encoded at the self-incompatibility locus of Brassica oleracea. Proc. Natl. Acad. Sci. USA 1991, 88, 8816–8820. [Google Scholar] [CrossRef]
  11. Haffani, Y.Z.; Silva, N.F.; Goring, D.R. Receptor kinase signalling in plants. Can. J. Bot. 2004, 82, 1–15. [Google Scholar] [CrossRef]
  12. Ivanov, R.; Gaude, T. Endocytosis and Endosomal Regulation of the S-Receptor Kinase during the Self-Incompatibility Response in Brassica oleracea. Plant Cell Online 2009, 21, 2107–2117. [Google Scholar] [CrossRef] [PubMed]
  13. Franklin-Tong, V.E.; Holdaway-Clarke, T.L.; Straatman, K.R.; Kunkel, J.G.; Hepler, P.K. Involvement of extracellular calcium influx in the self-incompatibility response of Papaver rhoeas. Plant J. 2002, 29, 333–345. [Google Scholar] [CrossRef] [PubMed]
  14. Franklin-Tong, N.; Franklin, F. Gametophytic self-incompatibility inhibits pollen tube growth using different mechanisms. Trends Plant Sci. 2003, 8, 598–605. [Google Scholar] [CrossRef] [PubMed]
  15. Franklin-Tong, V.E.; Franklin, F.C. The different mechanisms of gametophytic self-incompatibility. Philos. Trans. R. Soc. London Ser. B Biol. Sci. 2003, 358, 1025–1032. [Google Scholar] [CrossRef] [PubMed]
  16. Huang, S.; Blanchoin, L.; Chaudhry, F.; Franklin-Tong, V.E.; Staiger, C.J. A gelsolin-like protein from Papaver rhoeas pollen (PrABP80) stimulates calcium-regulated severing and depolymerization of actin filaments. J. Biol. Chem. 2004, 279, 23364–23375. [Google Scholar] [CrossRef]
  17. Liu, S.L.; Zhao, G.J.; Xin, W.U.; Zhang, B.H.; Gao, L.W.; Ding, M.L.; Chen, W. Research Progress on Plant Self-incompatibility Mechanism. J. Agric. Sci. Technol. 2016, 18, 31–37. [Google Scholar] [CrossRef]
  18. McClure, B. New views of S-RNase-based self-incompatibility. Curr. Opin. Plant Biol. 2006, 9, 639–646. [Google Scholar] [CrossRef]
  19. Sun, L.; Williams, J.S.; Li, S.; Wu, L.; Khatri, W.A.; Stone, P.G.; Keebaugh, M.D.; Kao, T.H. S-Locus F-Box Proteins Are Solely Responsible for S-RNase-Based Self-Incompatibility of Petunia Pollen. Plant Cell 2018, 30, 2959–2972. [Google Scholar] [CrossRef]
  20. Daele, I.V.; Bockstaele, E.V.; Martens, C.; Roldán-Ruiz, I. Identification of transcribed derived fragments involved in self-incompatibility in perennial ryegrass (Lolium perenne L.) using cDNA-AFLP. Euphytica 2008, 163, 67–80. [Google Scholar] [CrossRef]
  21. Rohini, G.; Patel, R.K.; Tyagi, A.K.; Mukesh, J. De Novo Assembly of Chickpea Transcriptome Using Short Reads for Gene Discovery and Marker Identification. DNA Res. 2011, 18, 53–63. [Google Scholar] [CrossRef]
  22. He, Y.; Song, Q.; Wu, Y.; Ye, S.; Chen, S.; Chen, H. TMT-Based Quantitative Proteomic Analysis Reveals the Crucial Biological Pathways Involved in Self-Incompatibility Responses in Camellia oleifera. Int. J. Mol. Sci. 2020, 21, 1987. [Google Scholar] [CrossRef]
  23. Seif, A.; Wang, P.; Li, N.; Chen, Y.; Lin, S. Metabolomic Analysis of Pollen Grains with Different Germination Abilities from Two Clones of Chinese Fir (Cunninghamia lanceolata (Lamb) Hook). Molecules 2018, 23, 3162. [Google Scholar] [CrossRef]
  24. Kenrick, J.; Knox, R.B. Quantitative Analysis of Self-Incompatibility in Trees of Seven Species of Acacia. J. Hered. 1989, 80, 240–245. [Google Scholar] [CrossRef]
  25. Kho, Y.O.; Bar, J. Observing pollen tubes by means of fluorescence. Euphytica 1968, 17, 298–302. [Google Scholar] [CrossRef]
  26. Gao, C.; Yuan, D.; Yang, Y.; Wang, B.; Liu, D.; Feng, Z.; Tan, X. Anatomical characteristics of self-incompatibility of Camellia oleifera. Sci. Silvae Sin. 2015, 51, 60–68. [Google Scholar]
  27. Kenrick, J.; Williams, V.K.G. Self-incompatibility in Acacia retinodes: Site of pollen-tube arrest is the nucellus. Planta 1986, 169, 245–250. [Google Scholar] [CrossRef] [PubMed]
  28. Tandon, R.; Shivanna, K.R.; Ram, H.M. Pollination biology and breeding system of Acacia senegal. Biol. J. Linn. Soc. 2000, 135, 251–262. [Google Scholar] [CrossRef]
  29. Li, Z.; Lin, Y.; Peng, S. Nutrient content in litterfall and its translocation in plantation forests in south China. Ying Yong Sheng Tai Xue Bao J. Appl. Ecol. 2000, 11, 321–326. [Google Scholar] [CrossRef]
  30. Kumar, A.; Jhariya, M.K.; Yadav, D.K.; Banerjee, A. Vegetation dynamics in Bishrampur collieries of northern Chhattisgarh, India: Eco-restoration and management perspectives. Environ. Monit. Assess. 2017, 189, 371. [Google Scholar] [CrossRef] [PubMed]
  31. Caldeira, M.V.W.; Favalessa, M.; Delarmelina, W.M.; Gonçalves, E.D.O.; Santos Moura, R.R.D. Sewage sludge assessment on growth of Acacia mangium seedlings by principal components analysis and orthogonal contrasts. J. Plant Nutr. 2018, 41, 1303–1311. [Google Scholar] [CrossRef]
  32. Chen, J.; Shen, W.; Xu, H.; Li, Y.; Luo, T. The Composition of Nitrogen-Fixing Microorganisms Correlates with Soil Nitrogen Content during Reforestation: A Comparison between Legume and Non-legume Plantations. Front. Microbiol. 2019, 10, 508. [Google Scholar] [CrossRef]
  33. Silva, J.L.; Demolin Leite, G.L.; de Souza Tavares, W.; Souza Silva, F.W.; Sampaio, R.A.; Azevedo, A.M.; Serrão, J.E.; Zanuncio, J.C. Diversity of arthropods on Acacia mangium (Fabaceae) and production of this plant with dehydrated sewage sludge in degraded area. R. Soc. Open Sci. 2020, 7, 191196. [Google Scholar] [CrossRef]
  34. Lima, J.S.; Leite, G.L.D.; Guanabens, P.F.S.; Soares, M.A.; Silva, J.L.; Mota, M.V.S.; Lemes, P.G.; Zanuncio, J.C. Insects and spiders on Acacia mangium (Fabaceae) saplings as bioindicators for the recovery of tropical degraded areas. Braz. J. Biol. Rev. Bras. Biol. 2021, 84, e252088. [Google Scholar] [CrossRef]
  35. Zeng, S.C.; Su, Z.Y.; Gu, Y.K.; Xie, Z.S.; Liu, Y.X. Litterfalls of major forest stands at Baiyunshan scenic spot of Guangzhou. Chin. J. Appl. Ecol. 2003, 14, 3. [Google Scholar] [CrossRef]
  36. Pinto, P.C.; Evtuguin, D.V.; Neto, C.P. Chemical composition and structural features of the macromolecular components of plantation Acacia mangium wood. J. Agric. Food Chem. 2005, 53, 7856–7862. [Google Scholar] [CrossRef] [PubMed]
  37. Hermawan, D.; Hadi, Y.S.; Fajriani, E.; Massijaya, M.Y.; Hadjib, N. Resistance of Particleboards Made from Fast-Growing Wood Species to Subterranean Termite Attack. Insects 2012, 3, 532–537. [Google Scholar] [CrossRef]
  38. Wang, Z.J.; Ye, G.F.; Tan, F.L.; Chen, S. The study on stress resistance of acacia tree species in coastal sandy site. J. Fujian For. Sci. Technol. 2005, 4, 35–38. [Google Scholar] [CrossRef]
  39. Zhang, Z.Z.; Zhao, P.; Ni, G.Y.; Zhu, L.W.; Zhao, X.H.; Zhao, P.Q.; Niu, J.F. Water use of re-vegetation pioneer tree species Schima superba and Acacia mangium in hilly land of South China. Ying Yong Sheng Tai Xue Bao J. Appl. Ecol. 2014, 25, 931–939. [Google Scholar]
  40. Hegde, N.; Joshi, S.; Soni, N.; Kushalappa, A.C. The caffeoyl-CoA O-methyltransferase gene SNP replacement in Russet Burbank potato variety enhances late blight resistance through cell wall reinforcement. Plant Cell Rep. 2021, 40, 237–254. [Google Scholar] [CrossRef]
  41. Huang, L.J.; Zhan, N.; Li, J. Floral biology of Acacia mangium. For. Res. 2014, 27, 45–52. [Google Scholar] [CrossRef]
  42. Zhan, N.; Huang, L.J.; Jun, L.I. Study the Reasons of Low Pod of Acacia mangium Seed Orchard. J. Southwest Univ. (Nat. Sci. Ed.) 2016, 38, 46–52. [Google Scholar] [CrossRef]
  43. Zhang, R.P.; Zeng, B.S.; Huang, L.J. Preliminary study on hydroponics culture of flower branch of A. mangium and A. auriculiformis. Acta Agric. Shanghai 2021, 37, 70–73. [Google Scholar] [CrossRef]
  44. Zhan, N.; Huang, L.J. Study on Acacia mangium pollen germination in vitro. Guihaia 2016, 36, 92–96+125. [Google Scholar] [CrossRef]
  45. Zhang, R.P.; Zhan, N.; Huang, L.J. Control Pollination of Acacia mangium and A. auriculiformis. Mol. Plant Breed. 2020, 18, 5877–5882. [Google Scholar] [CrossRef]
  46. Zhan, N. Three Acacia Pollen Vigor Test and Controlled Pollination. Mater’s Thesis, Chinese Academy of Forestry, Beijing, China, 2016. [Google Scholar]
  47. Kanehisa, M.; Araki, M.; Goto, S.; Hattori, M.; Hirakawa, M.; Itoh, M.; Katayama, T.; Kawashima, S.; Okuda, S.; Tokimatsu, T.; et al. KEGG for linking genomes to life and the environment. Nucleic Acids Res. 2008, 36, D480–D484. [Google Scholar] [CrossRef] [PubMed]
  48. Wang, Z.; Gerstein, M.; Snyder, M. RNA-Seq: A revolutionary tool for transcriptomics. Nat. Rev. Genet. 2009, 10, 57–63. [Google Scholar] [CrossRef]
  49. Conesa, A.; Madrigal, P.; Tarazona, S.; Gomez-Cabrero, D.; Cervera, A.; McPherson, A.; Szczesniak, M.W.; Gaffney, D.J.; Elo, L.L.; Zhang, X.; et al. A survey of best practices for RNA-seq data analysis. Genome Biol. 2016, 17, 13. [Google Scholar] [CrossRef]
  50. Love, M.I.; Huber, W.; Anders, S. Moderated estimation of fold change and dispersion for RNA-seq data with DESeq2. Genome Biol. 2014, 15, 550. [Google Scholar] [CrossRef]
  51. Varet, H.; Brillet-Gueguen, L.; Coppee, J.Y.; Dillies, M.A. SARTools: A DESeq2- and EdgeR-Based R Pipeline for Comprehensive Differential Analysis of RNA-Seq Data. PLoS ONE 2016, 11, e0157022. [Google Scholar] [CrossRef]
  52. Alcaraz, N.; Friedrich, T.; Kötzing, T.; Krohmer, A.; Müller, J.; Pauling, J.; Baumbach, J. Efficient key pathway mining: Combining networks and OMICS data. Integr. Biol. Quant. Biosci. Nano Macro 2012, 4, 756–764. [Google Scholar] [CrossRef]
  53. Alcaraz, N.; Pauling, J.; Batra, R.; Barbosa, E.; Junge, A.; Christensen, A.G.; Azevedo, V.; Ditzel, H.J.; Baumbach, J. KeyPathwayMiner 4.0: Condition-specific pathway analysis by combining multiple omics studies and networks with Cytoscape. BMC Syst. Biol. 2014, 8, 99. [Google Scholar] [CrossRef]
  54. Chen, W.; Gong, L.; Guo, Z.; Wang, W.; Zhang, H.; Liu, X.; Yu, S.; Xiong, L.; Luo, J. A novel integrated method for large-scale detection, identification, and quantification of widely targeted metabolites: Application in the study of rice metabolomics. Mol. Plant 2013, 6, 1769–1780. [Google Scholar] [CrossRef]
  55. Fraga, C.G.; Clowers, B.H.; Moore, R.J.; Zink, E.M. Signature-discovery approach for sample matching of a nerve-agent precursor using liquid chromatography-mass spectrometry, XCMS, and chemometrics. Anal. Chem. 2010, 82, 4165–4173. [Google Scholar] [CrossRef] [PubMed]
  56. Kanehisa, M.; Goto, S. KEGG: Kyoto encyclopedia of genes and genomes. Nucleic Acids Res. 2000, 28, 27–30. [Google Scholar] [CrossRef] [PubMed]
  57. Chen, C.; Chen, H.; Zhang, Y.; Thomas, H.R.; Frank, M.H.; He, Y.; Xia, R. TBtools: An Integrative Toolkit Developed for Interactive Analyses of Big Biological Data. Mol. Plant 2020, 13, 1194–1202. [Google Scholar] [CrossRef] [PubMed]
  58. Bylesjö, M.; Eriksson, D.; Kusano, M.; Moritz, T.; Trygg, J. Data integration in plant biology: The O2PLS method for combined modeling of transcript and metabolite data. Plant J. 2007, 52, 1181–1191. [Google Scholar] [CrossRef]
  59. Hong, S.; Chen, X.; Jin, L.; Xiong, M. Canonical correlation analysis for RNA-seq co-expression networks. Nucleic Acids Res. 2013, 41, e95. [Google Scholar] [CrossRef] [PubMed]
  60. Niu, J.H.; Xiaomin, L. Self-incompatibility in Poaceae and its Advancement in Molecular Biological Research. Mol. Plant Breed. 2006, 4, 269–274. [Google Scholar] [CrossRef]
  61. Nettancourt, D. Incompatibility and Incongruity in Wild and Cultivated Plants; Springer: Berlin/Heidelberg, Germany, 2001; pp. 15–24. [Google Scholar] [CrossRef]
  62. Li, F.; Tang, F.; Gao, D.; Duan, S.; Li, Y.; Li, C.; Ma, L. Research progress on gametophytic self-incompatibility. J. Yunnan Norm. Univ. (Nat. Sci. Ed.) 2019, 39, 65–70. [Google Scholar]
  63. Luis, B.J.; Cocucci, A.A.; Anton, A.M. Reproductive biology in Acacia caven (Mol.) Mol. (Leguminosae) in the central region of Argentina. Bot. J. Linn. Soc. 1995, 119, 65–76. [Google Scholar] [CrossRef]
  64. Sedgley, M.; Harbard, J.; Smith, R.M.M.; Wickneswari, R.; Griffin, A.R. Reproductive-Biology and Interspecific Hybridization of Acacia mangium and Acacia auriculiformis A. Cunn. ex Benth (Leguminosae, Mimosoideae). Aust. J. Bot. 1992, 40, 37–48. [Google Scholar] [CrossRef]
  65. Wehling, P.; Hackauf, B.; Wricke, G. Phosphorylation of pollen proteins in relation to self-incompatibility in rye (Secale cereale L.). Sex. Plant Reprod. 1994, 7, 67–75. [Google Scholar] [CrossRef]
  66. Rudd, J.J. Ca2+—Independent phosphorylation of a 68 kDa pollen protein is stimulated by the self-incompatibility response in Papaver rhoeas. Plant J. 2010, 12, 507–514. [Google Scholar] [CrossRef]
  67. Peralta, I.; Rodríguez, J.; Arroyo, M. Breeding system and aspects of pollination in Acacia caven (Mol.) Mol. (Leguminosae: Mimosoideae) in the mediterranean-type climate zone of central Chile. Bot. Jarbücher Für Syst. Pflanzengesch. Pflanzengeogr. 1992, 114, 297–314. [Google Scholar]
  68. Klaas, M.; Yang, B.; Bosch, M.; Thorogood, D.; Manzanares, C.; Armstead, I.P.; Franklin, F.C.H. Progress towards elucidating the mechanisms of self-incompatibility in the grasses: Further insights from studies in Lolium. Ann. Bot. 2011, 108, 677. [Google Scholar] [CrossRef]
  69. Zhan, N.; Huang, L.J. Effects of Ca2+ on in vitro pollen germination of three Acacia species. Silvae Genet. 2016, 65, 11–16. [Google Scholar] [CrossRef]
  70. Rogel, M.R.; Jaitovich, A.; Ridge, K.M. The role of the ubiquitin proteasome pathway in keratin intermediate filament protein degradation. Proc. Am. Thorac. Soc. 2010, 7, 71–76. [Google Scholar] [CrossRef]
  71. Shang, F.; Taylor, A. Roles for the ubiquitin-proteasome pathway in protein quality control and signaling in the retina: Implications in the pathogenesis of age-related macular degeneration. Mol. Asp. Med. 2012, 33, 446–466. [Google Scholar] [CrossRef]
  72. Kao, T.H.; Tsukamoto, T. The molecular and genetic bases of S-RNase-based self-incompatibility. Plant Cell 2004, 16, S72–S83. [Google Scholar] [CrossRef]
  73. Kakeda, K. S locus-linked F-box genes expressed in anthers of Hordeum bulbosum. Plant Cell Rep. 2009, 28, 1453–1460. [Google Scholar] [CrossRef]
  74. Wei, L.; Li, P.K.; Zhang, H.Q.; Wang, T.C. Research progress in plant thioredoxin. Guizhou Agric. Sci. 2006, 129–131, 123. [Google Scholar] [CrossRef]
  75. Li, X.; Paech, N.A.; Nield, J.; Hayman, D.; Langridge, P. Self-incompatibility in the grasses: Evolutionary relationship of the S gene from Phalaris coerulescens to homologous sequences in other grasses. Plant Mol. Biol. 1997, 34, 223–232. [Google Scholar] [CrossRef] [PubMed]
  76. Juárez-Díaz, J.A.; McClure, B.; Vázquez-Santana, S.; Guevara-García, A.; León-Mejía, P.; Márquez-Guzmán, J.; Cruz-García, F. A novel thioredoxin h is secreted in Nicotiana alata and reduces S-RNase in vitro. J. Biol. Chem. 2006, 281, 3418–3424. [Google Scholar] [CrossRef]
  77. Torres-Rodríguez, M.D.; González-Segura, L.; Rodríguez-Sotres, R.; Juárez-Día, Z.J.; Cruz-Zamora, Y.; Cruz-García, F. High resolution crystal structure of NaTrxh from Nicotiana alata and its interaction with the S-RNase. J. Struct. Biol. 2020, 212, 107578. [Google Scholar] [CrossRef]
  78. Li, J.; Zhang, Y.; Song, Y.; Zhang, H.; Fan, J.; Li, Q.; Zhang, D.; Xue, Y. Electrostatic potentials of the S-locus F-box proteins contribute to the pollen S specificity in self-incompatibility in Petunia hybrida. Plant J. 2017, 89, 45–57. [Google Scholar] [CrossRef]
  79. Li, Y.; Duan, X.; Wu, C.; Yu, J.; Liu, C.; Wang, J.; Zhang, X.; Yan, G.; Jiang, F.; Li, T.; et al. Ubiquitination of S(4)-RNase by S-LOCUS F-BOX LIKE2 Contributes to Self-Compatibility of Sweet Cherry ‘Lapins’. Plant Physiol. 2020, 184, 1702–1716. [Google Scholar] [CrossRef]
  80. Xu, Y.; Zhang, Q.; Zhang, X.; Wang, J.; Ayup, M.; Yang, B.; Guo, C.; Gong, P.; Dong, W. The proteome reveals the involvement of serine/threonine kinase in the recognition of self-incompatibility in almond. J. Proteom. 2022, 256, 104505. [Google Scholar] [CrossRef]
  81. Burrows, B.A.; McCubbin, A.G. Sequencing the genomic regions flanking S-linked PvGLO sequences confirms the presence of two GLO loci, one of which lies adjacent to the style-length determinant gene CYP734A50. Plant Reprod. 2017, 30, 53–67. [Google Scholar] [CrossRef] [PubMed]
  82. Miao, H.; Qin, Y.; Silva, J.A.T.D.; Ye, Z.; Hu, G. Identification of differentially expressed genes in pistils from self-incompatible Citrus reticulata by suppression subtractive hybridization. Mol. Biol. Rep. 2013, 40, 159–169. [Google Scholar] [CrossRef] [PubMed]
  83. Zhou, Q.; Jia, J.; Huang, X.; Yan, X.; Cheng, L.; Chen, S.; Li, X.; Peng, X.; Liu, G. The large-scale investigation of gene expression in Leymus chinensis stigmas provides a valuable resource for understanding the mechanisms of poaceae self-incompatibility. BMC Genom. 2014, 15, 399. [Google Scholar] [CrossRef]
  84. Heizmann, P.; Luu, D.T.; Dumas, C. Pollen-Stigma Adhesion in the Brassicaceae. Ann. Bot. 2000, 85, 23–27. [Google Scholar] [CrossRef]
  85. Ischebeck, T. Lipids in pollen—They are different. Biochim. Biophys. Acta Mol. Cell Biol. Lipids 2016, 1861, 1315–1328. [Google Scholar] [CrossRef] [PubMed]
  86. Mo, Y.; Nagel, C.; Taylor, L.P. Biochemical complementation of chalcone synthase mutants defines a role for flavonols in functional pollen. Proc. Natl. Acad. Sci. USA 1992, 89, 7213–7217. [Google Scholar] [CrossRef] [PubMed]
  87. Goetz, M.; Guivarćh, A.; Hirsche, J.; Bauerfeind, M.A.; González, M.C.; Hyun, T.K.; Eom, S.H.; Chriqui, D.; Engelke, T.; Großkinsky, D.K.; et al. Metabolic Control of Tobacco Pollination by Sugars and Invertases. Plant Physiol. 2017, 173, 984–997. [Google Scholar] [CrossRef]
  88. Zhao, P.; Pan, Q.; Yu, W.; Zhao, L. Dissect style response to pollination using metabolite profiling in self-compatible and self-incompatible tomato species. J. Chromatogr. B Anal. Technol. Biomed. Life Sci. 2016, 1017, 153–162. [Google Scholar] [CrossRef]
  89. Hugot, K.; Ponchet, M.; Marais, A.; Ricci, P.; Galiana, E. A tobacco S-like RNase inhibits hyphal elongation of plant pathogens. Mol. Plant Microbe Interact. 2002, 15, 243–250. [Google Scholar] [CrossRef] [PubMed]
  90. Hu, D.; Li, W.; Gao, S.; Lei, T.; Hu, J.; Shen, P.; Li, Y.; Li, J. Untargeted metabolomic profiling reveals that different responses to self and cross pollination in each flower morph of the heteromorphic plant Plumbago auriculata. Plant Physiol. Biochem. 2019, 144, 413–426. [Google Scholar] [CrossRef]
  91. Porto, N.P.; Bret, R.S.C.; Souza, P.V.L.; Cândido-Sobrinho, S.A.; Medeiros, D.B.; Fernie, A.R.; Daloso, D.M. Thioredoxins regulate the metabolic fluxes throughout the tricarboxylic acid cycle and associated pathways in a light-independent manner. Plant Physiol. Biochem. 2022, 193, 36–49. [Google Scholar] [CrossRef]
  92. Nakatsukasa, K.; Kawarasaki, T.; Moriyama, A. Heterologous expression and functional analysis of the F-box protein Ucc1 from other yeast species in Saccharomyces cerevisiae. J. Biosci. Bioeng. 2019, 128, 704–709. [Google Scholar] [CrossRef]
  93. Lénárt, J.; Gere, A.; Causon, T.; Hann, S.; Dernovics, M.; Németh, O.; Hegedűs, A.; Halász, J. LC-MS based metabolic fingerprinting of apricot pistils after self-compatible and self-incompatible pollinations. Plant Mol. Biol. 2021, 105, 435–447. [Google Scholar] [CrossRef]
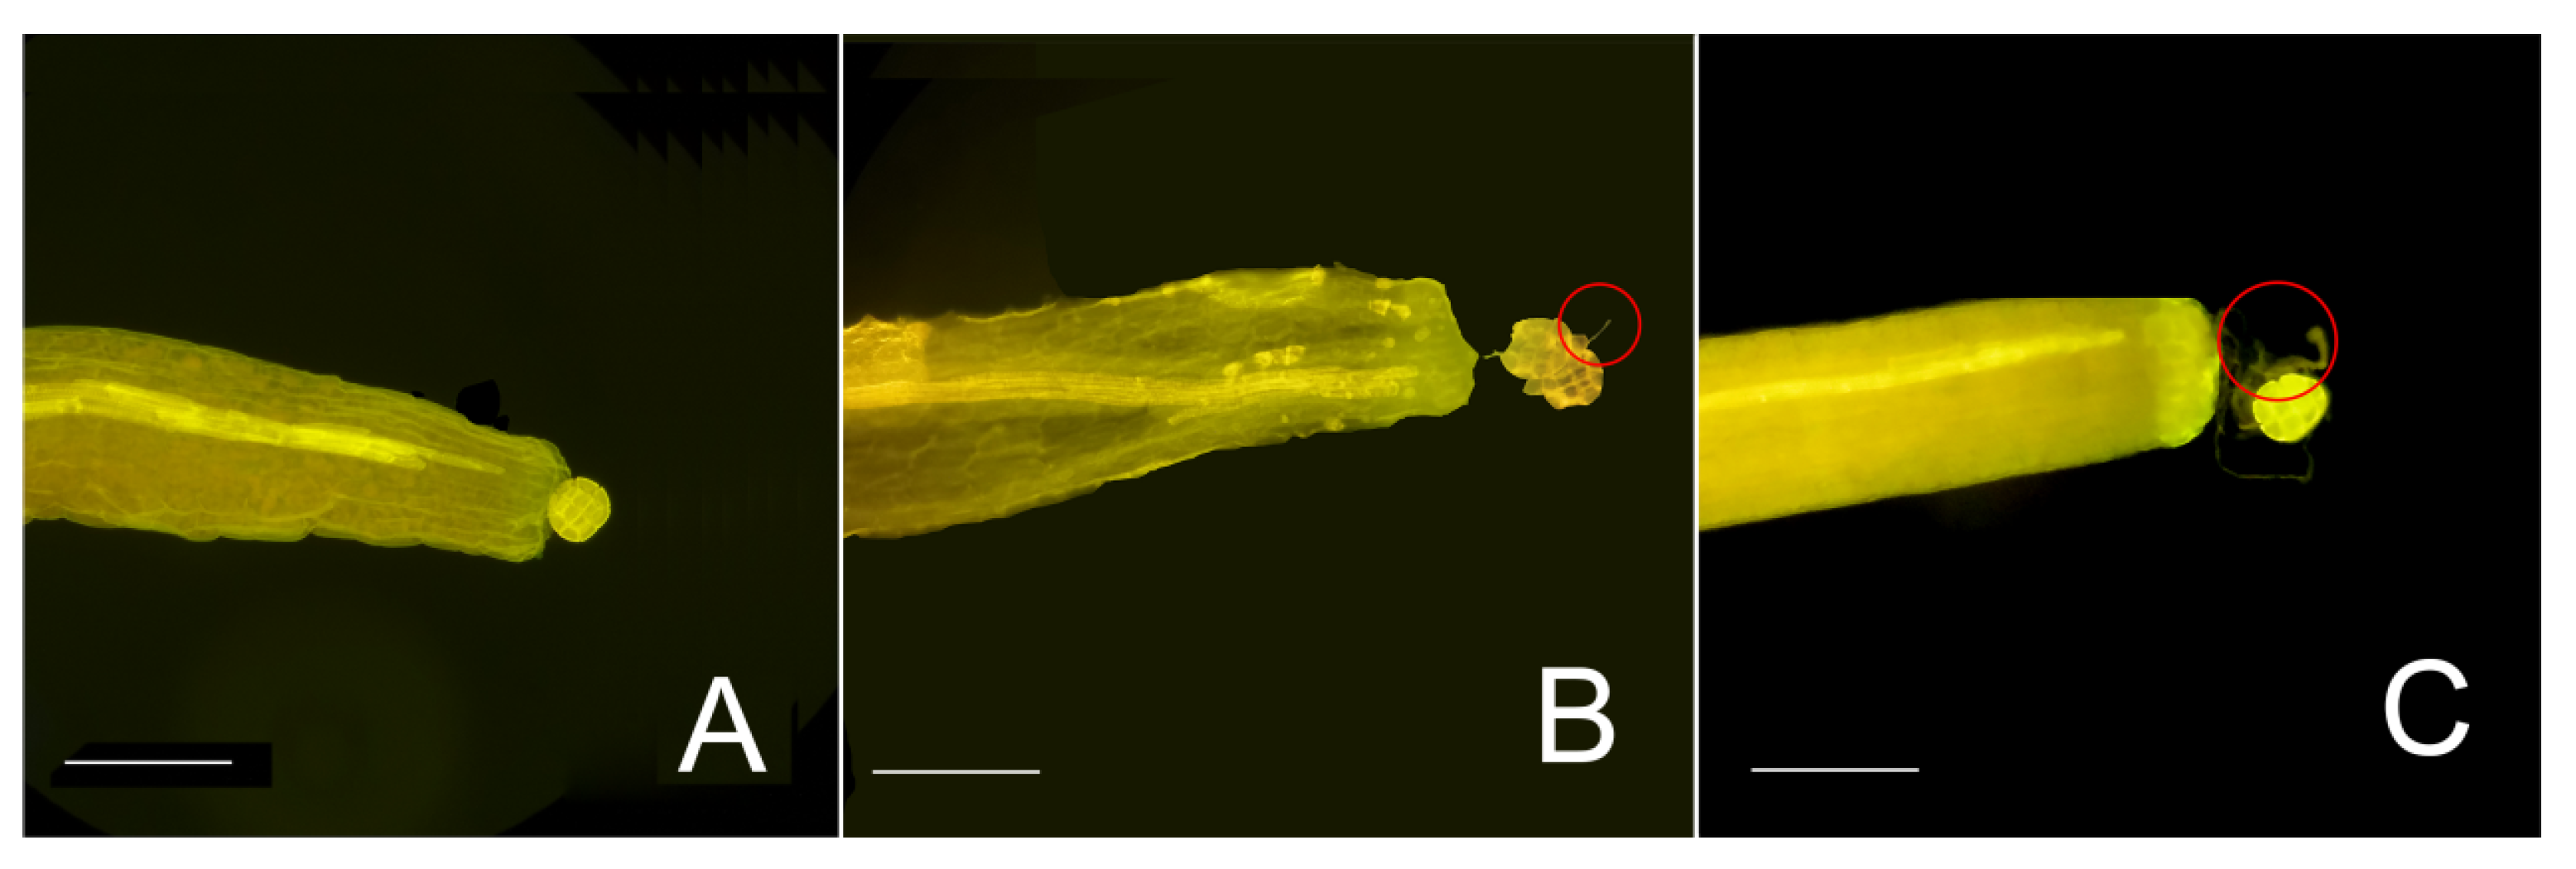
Figure 1. Germination of a few pollen grains of A. mangium after self-pollination. (A) Pollen grains showed no germinated pollen tubes after self-pollination (pollen coming from the same tree), (B) 9 h after self-pollination, and (C) 24 h after cross-pollination (pollen coming from a different tree of the same species). Scale bar = 20 pm. Highlighted in the red circle are the germinated pollen tubes.
Forests 14 02034 g001
Figure 2. Functional annotation results of the differentially expressed genes between comparison of CK/T0 vs. T24, T9 vs. T24 and CK/T0 vs. T24 using the transcriptome data from A. mangium; (A) Venn diagram showing the shared and common DEGs under all treatments, (B) annotation information obtained from the Kyoto Encyclopedia of Genes and Genomes (KEGG), (C) functional annotation of the DEGs based on the Eukaryotic Orthologous Groups (KOG) database.
Forests 14 02034 g002
Figure 3. Distribution of the differentially expressed transcription factors (TFs) and co-expression networks between candidate genes and TFs. (A) Quantitative statistics for the differentially expressed TFs; (B) Heatmap showing the candidate TFs under various self-pollination conditions; (C) Co-expression networks between DEGs related to SI and TFs under different self-pollination times.
Forests 14 02034 g003
Figure 4. Metabolome profiling of A. mangium flowers under different self-pollination times. (A) Principal component analysis (PCA) scores for the first component (PC1), second component (PC2), and third component (PC3). Within the same area, the farther from the origin, the closer the distance, and the higher the correlation. (B) The results for differentially expressed metabolites in the OPLS-DA model with the top ranked VIP value. (C) Hierarchical clustering analysis of the metabolites. (D) KEGG classification and enrichment diagram of differential metabolites.
Forests 14 02034 g004
Figure 5. Analysis of differentially expressed genes and metabolites. (A) The nine-quadrant chart shows the different multiples of gene and metabolites. It is divided into quadrants 1–9 from left to right and from top to bottom with black dashed lines. Genes and metabolites with negative correlations are presented, in quadrants 6, 8 and 9, genes are upregulated, and metabolites are unchanged or downregulated. (BD) CCA diagram of differentially expressed genes and metabolites.
Forests 14 02034 g005
Figure 6. Diagram of pathways related to self-incompatibility in A. mangium.
Forests 14 02034 g006
Figure 7. Model-based prediction of the SI molecular mechanism of A. mangium.
Forests 14 02034 g007
Table 1. Metabolic pathways and metabolites of differentially expressed and significantly enriched genes related to SI.
Differential Gene FamiliesDifferential
Gene Number
Pathway
ID
Pathway
Annotation
Differential Metabolite
ThioredoxinCluster-10295.88411
Cluster-10295.83728
Cluster-10295.93820
Cluster-10295.97869
Cluster-10295.88407
ko00920sulfur metabolismsuccinate
F-box proteinCluster-10295.69454ko00350tyrosine metabolismsuccinate
ko00360phenylalanine metabolismsuccinate
ko00410β-alanine metabolism3-hydroxypropionate
Cluster-10295.32019ko00280valine, leucine and isoleucine degradationmethylmalonate
ko00650butanoate metabolismsuccinate
Disclaimer/Publisher’s Note: The statements, opinions and data contained in all publications are solely those of the individual author(s) and contributor(s) and not of MDPI and/or the editor(s). MDPI and/or the editor(s) disclaim responsibility for any injury to people or property resulting from any ideas, methods, instructions or products referred to in the content.