Article

Ecophysiological Behavior of Fagus sylvatica L. Growing at Its Southern Distribution Limit: Insights for Understanding the Fate of the European Beech under Warmer and Dryer Growth Conditions

by
Maria Prigoliti
1,
Maria Teresa Chiofalo
1,
Francesco Petruzzellis
2,
Maria Assunta Lo Gullo
1 and
Patrizia Trifilò
2,*
1
Dipartimento di Scienze Chimiche, Biologiche, Farmaceutiche e Ambientali, Università di Messina, Viale Ferdinando Stagno d’Alcontres 31, 98166 Messina, Italy
2
Dipartimento di Scienze della Vita, Università di Trieste, Via L. Giorgieri 10, 34127 Trieste, Italy
*
Author to whom correspondence should be addressed.
Forests 2023, 14(10), 2058; https://doi.org/10.3390/f14102058
Submission received: 17 September 2023 / Revised: 10 October 2023 / Accepted: 12 October 2023 / Published: 15 October 2023

Abstract

:
In the last 20 years, a significant mortality of Fagus sylvatica L. (European beech) has been documented in central and northern European forests. Surprisingly, no beech die off occurred at the southern limit. This fact leads us to hypothesize that European beech populations growing at the southern limit of the distribution might have a significant phenotypic plasticity to better cope with low water availability and rising temperatures. To check this hypothesis, we evaluated the ecophysiological behavior of F. sylvatica growing along an altitudinal transect in Calabria (Italy). We selected three study sites (750 m a.s.l., 976 m a.sl. m a.s.l., 1450 m a.s.l.) showing narrow ranges of temperature, rainfall and air humidity. Trees growing at 976 m a.s.l. showed the highest stomatal conductance values during the entire experimental period. The lowest gas exchange and highest leaf mass area were recorded in plants growing at 750 m a.s.l. In the European beech growing at 1450 m a.s.l., higher vessel density, lower mean vessel diameter and higher vessel grouping index values were recorded. Overall, our results highlighted that the measured populations show a considerable phenotypic plasticity leading them to adjust anatomical and physiological traits in response to narrow ranges of environmental parameters. Despite that, the distribution of F. sylvatica seems to be limited to areas with a growing season rainfall of at least 400 mm and vapor pressure deficit (VPD) values < 3 kPa, which may represent the main environmental thresholds which strongly limit the beech growth and, therefore, influence the ability of this species to cope with future environmental conditions.

1. Introduction

Fagus sylvatica L. (European beech) is an ecologically and economically relevant deciduous species of European forests: it is one of the dominant trees of natural sites ranging from southern Scandinavia to southern Italy [1,2] and has a high economical relevance in the forestry sector. F. sylvatica is also one of the deciduous trees most suffering from climate-change-driven plant decline [3]. Since 2005, a drought-driven decline in radial growth has been documented in populations growing at the southern edge limit of the European beech [4] and, in the last 20 years, European beech die off has occurred mainly in Central Europe [5,6]. Based on model predictions, further productivity losses are expected in the near future [7], although some data support the hypothesis of an increase of beech dominance in response to climate change, especially in Central Europe [4,8]. European beech is known as a drought sensitive species: it is capable of acclimatizing its hydraulic system under mild drought [9], but it suffers when exposed to severe and recurrent drought events [10,11]. Greater drought vulnerability of F. sylvatica individuals has been recorded in mesic compared with xeric sites [12,13,14]. Pfenninger et al. [15] recorded differences in gene expression of differently damaged beech trees that grew close to each other and experienced the same drought events. Overall, these results suggest that a phenotypic plasticity in drought resistance traits might exist among different European beech populations, as a consequence of natural selection, selective management and breeding. On the other hand, other studies showed a weak or even absent plasticity to drought acclimation of F. sylvatica samples collected from native sites with different water availability [16,17,18]. It cannot be excluded that the reported discrepancies on the drought vulnerability and/or plasticity of F. sylvatica are a consequence of studies in plants of different ages [19,20,21]. Nevertheless, these contrasting results reveal our still limited knowledge on the ecophysiological plasticity of F. sylvatica within its distribution range, as well as on the actual resilience of this species to the predicted global warming. This, in turn, strongly affects our ability to reliably predict the fate of F. sylvatica forests in the near future. In this light, European beech populations occurring on the southern edge of Europe (i.e., the hottest and/or driest environment in which this species grows) represent ideal model experimental sites to study the maximum phenotypic plasticity levels that this species can achieve when growing under stressful environmental conditions and, then, possibly, to identify more drought-tolerant genotypes.
In Italy, beech forests occur between 600 and 1300 m a.s.l. in the Alps and between 1000 and 1700 m a.s.l. in the Apennine mountains [22]. In Calabrian sites, however, beech populations are also present at lower altitudes, as low as 400–500 m a.s.l. As far as we know, only one study has been performed on the ecophysiology of natural populations of beech trees growing in south Europe [23] and none on samples growing in Calabria, where no climate-driven dieback has been documented. In the present study, we measured leaf water relations, morphological and xylem anatomical traits of adult beech individuals growing along an altimetric transect in the Calabrian forests (Southern Italy) (i.e., the southern sites, along with a few sites in Sicily, where this species grows) [1]. The aim of the study was to highlight the ecophysiological behavior of the beech growing at its southern edge. We expect that the results of our analysis could provide key information about the phenotypic plasticity of F. sylvatica, as a result of a long-term growth acclimatation in hot and drought-prone sites. This information, in turn, can provide insights that can be useful to predict the fate of European beech forests and/or pinpoint possible genotypes with a better chance of surviving to novel climate conditions.

2. Materials and Methods

2.1. Study Sites

The study was performed during the summer 2022 on three F. sylvatica populations growing in Aspromonte, a mountain massif of the southern Apennines in the Metropolitan city of Reggio Calabria (Calabria, Italy), along an altimetric transect of about 700 m. The study sites were located at 750 m a.s.l. (i.e., Cittanova, 38°20′27.66″ N 16°7′18.70″ E), 976 m a.s.l. (i.e., Ostello, 38°18′27.18″ N, 16° 7′4.00″ E) and 1450 m a.s.l. (i.e., Santo Stefano in Aspromonte, 15°50′32.09″ E, 38° 9′38.61″ N). In each study site, 5 adult samples of similar age (about 20 years old and 5 m in height) and exposition (i.e., South–East) were randomly selected. The three study sites are characterized by a temperate climate with dry summer. In detail, the sites show a mean annual precipitation (MAP) ranging between 1300 and 1800 mm year−1, with minimum rainfall during the summer period, as recorded in the last 60 years (data derived from Arpacal Calabria, https://www.meteoincalabria.com/tag/arpacal/, accessed on 20 January 2023).

2.2. Seasonal Changes of Plant Water Relations

Leaf water conductance to water vapor (gL) and leaf water potential (ΨL) were measured hourly from 11.00 to 14.00 h (solar time) in June, in July and at the beginning of September 2022 in selected trees per site. In detail, in each study site and experimental period, gL of at least five fully expanded and undamaged leaves was measured by a steady-state porometer (SC-1, Decagon Devices Inc., Pullman, WA, USA), while leaf water potential (ΨL) was measured in three leaves (one sample per tree) using a portable pressure chamber (3005 Plant Water Status Console, Soil Moisture, Santa Barbara, CA, USA). All measurements were performed on clear sunny days with PAR ranging between 1200 and 1600 μmol m−2 s−1. The time of day at which to perform measurements was chosen on the basis of preliminary measurements which showed that the highest stomatal conductance values were recorded during the selected time slot. At the same time, air temperature (T) and relative humidity (RH) were also recorded by using a data logger (Datalogger BL30, Trotec, Marchtrenk, Austria) in order to estimate the vapor pressure deficit (VPD). VPD was estimated as: SVP × (1 − RH), where SVP is the saturated vapor pressure.
Leaf water potential at turgor loss point (Ψtlp), osmotic potential at full turgor (π0) and elastic modulus at full turgor (ε) were estimated by Pressure–Volume curve analysis. Measurements were performed in June and in September in order to evaluate possible changes of water relation parameters, as driven by the lower water availability that typically occurs during the summer season in all three study sites. Five shoots per study sites were collected in the early morning, transported to the laboratory with their petiole submerged in the water within 3 h. Measurements were performed according to [24].

2.3. Anatomical Measurements

Three branches of different plants and for each study site were collected in September, i.e., at the end of the seasonal growth. Samples were transported to the laboratory with their cut basal end immersed in water in order to avoid leaf dehydration and then shrinkage. One-year branch segments, as collected at about 12 cm from the apex, were fixed in 50% FAA solution (formalin, acetic acid, ethanol, 1:1:1, v:v:v) to be analyzed later. Leaf surface area (AL) was estimated by acquiring leaf images with a scanner (HP Scanjet G4050, USA) and measuring with the software ImageJ (http://imagej.nih.gov/ij/; accessed on 6 September 2021). Leaf samples were then dehydrated in an oven for 3 days at 70 °C and their dry weight (DW) was measured by a digital balance in order to estimate the leaf mass area, LMA, calculated as: DW/AL.
Cross transverse sections from branch segments were obtained using a microtome (mod. Cut 4055, SLEE Technick GmbH, Mainz, Germany) and analyzed by a microscope (Laborlux S, Leitz GmbH, Stuttgart, Germany) connected to a PC via a digital camera (DC 300F Leica Camera AG, Solm, Germany).
Vessel density, Vd (i.e., total number of xylem conduits per section) and xylem conduits diameters (d) were measured using the software ImageJ. Moreover, we measured:
  • the mean xylem conduit diameter D;
  • the hydraulically weighted mean xylem conduit diameter [25], Dh, estimated as: Σd5/Σd4;
  • the potential cross-sectional conductive area, estimated as: Σπr2, where r is the inner conduit radius;
  • the relative xylem conduit area, estimated as: Σπr2/Ax, where Ax is the xylem area;
  • the efficiency of water transport estimated as: Σr4 (according to the Hagen–Poiseuille equation).
The solitary vessel index Vs (estimated as the ratio of total number of solitary vessels to total vessel groupings). the vessel grouping index, VG (estimated as the ratio of the total number of vessels to the total number of vessel groupings, including solitary and grouped vessels) and the vessel multiple fraction, FVM (estimated as the ratio of grouped vessels to the total number of vessels) [26] were calculated.

2.4. Statistical Analysis

The main aim of our analysis was to test eventual differences of ecophysiological, as well as anatomical, traits between populations of F. sylvatica growing in three sites along an elevational gradient.
We used linear mixed models (LMMs) to test differences in gL and ΨL among sites and months. Specifically, we used the lme function in the “nlme” [27] R [28] package to run two independent LMMs for gL and ΨL (response variables), setting Site (levels: 750, 976 and 1450 m a.s.l.), Month (levels: June, July, September) and their interaction as the fixed factors, while individual was set as the random one. For significant interactions (p-value < 0.05), estimated marginal means were calculated using the emmeans function in the “emmeans” [29] R package to assess pairwise group differences. The p-values were corrected using the Holm correction. Marginal and conditional R2 were calculated using the r.squaredGLMM function in the “MuMIn” [30] R package.
To test the differences among sites and months in Ψtlp, πo and ε, two-way ANOVA models followed by post hoc Tukey comparisons were performed using the aov and TukeyHSD functions, respectively, in the “stats” R package.
To check differences among sites on anatomical traits, one-way ANOVA models followed by post hoc Tukey comparisons were performed, as indicated above. At last, linear models were calculated using the lm function in the “stats” R package to test the relationships between gL and ΨL (set as the response variables) and climatic data (set as predictive variables).

3. Results

3.1. Study Sites

In all three study sites, the mean temperature in spring and summer 2022 was at least 1 °C higher than that recorded in the last 60 years (Figure 1).
Ostello (976 m a.s.l.) was the rainiest study site during the growing season (March–September). However, in all three study sites, the rainfall during the 2022 growing season was lower with respect to the values recorded in 1960–2021. In more detail, in Cittanova (750 m a.s.l.) the sum of rainfall in March–September was 434 mm versus 535 mm, in Ostello (976 m a.s.l.) it was 532 mm versus 682 mm and in Santo Stefano in Aspromonte (1450 m a.s.l.) it was 413 mm versus 566 mm. It can be noted that the mean temperature of the 2022 growing season of Ostello (976 m a.s.l.) was very similar to the value recorded over the last 60 years (Figure 1). By contrast, a higher temperature was recorded especially at Santo Stefano in Aspromonte (1450 m a.s.l.).

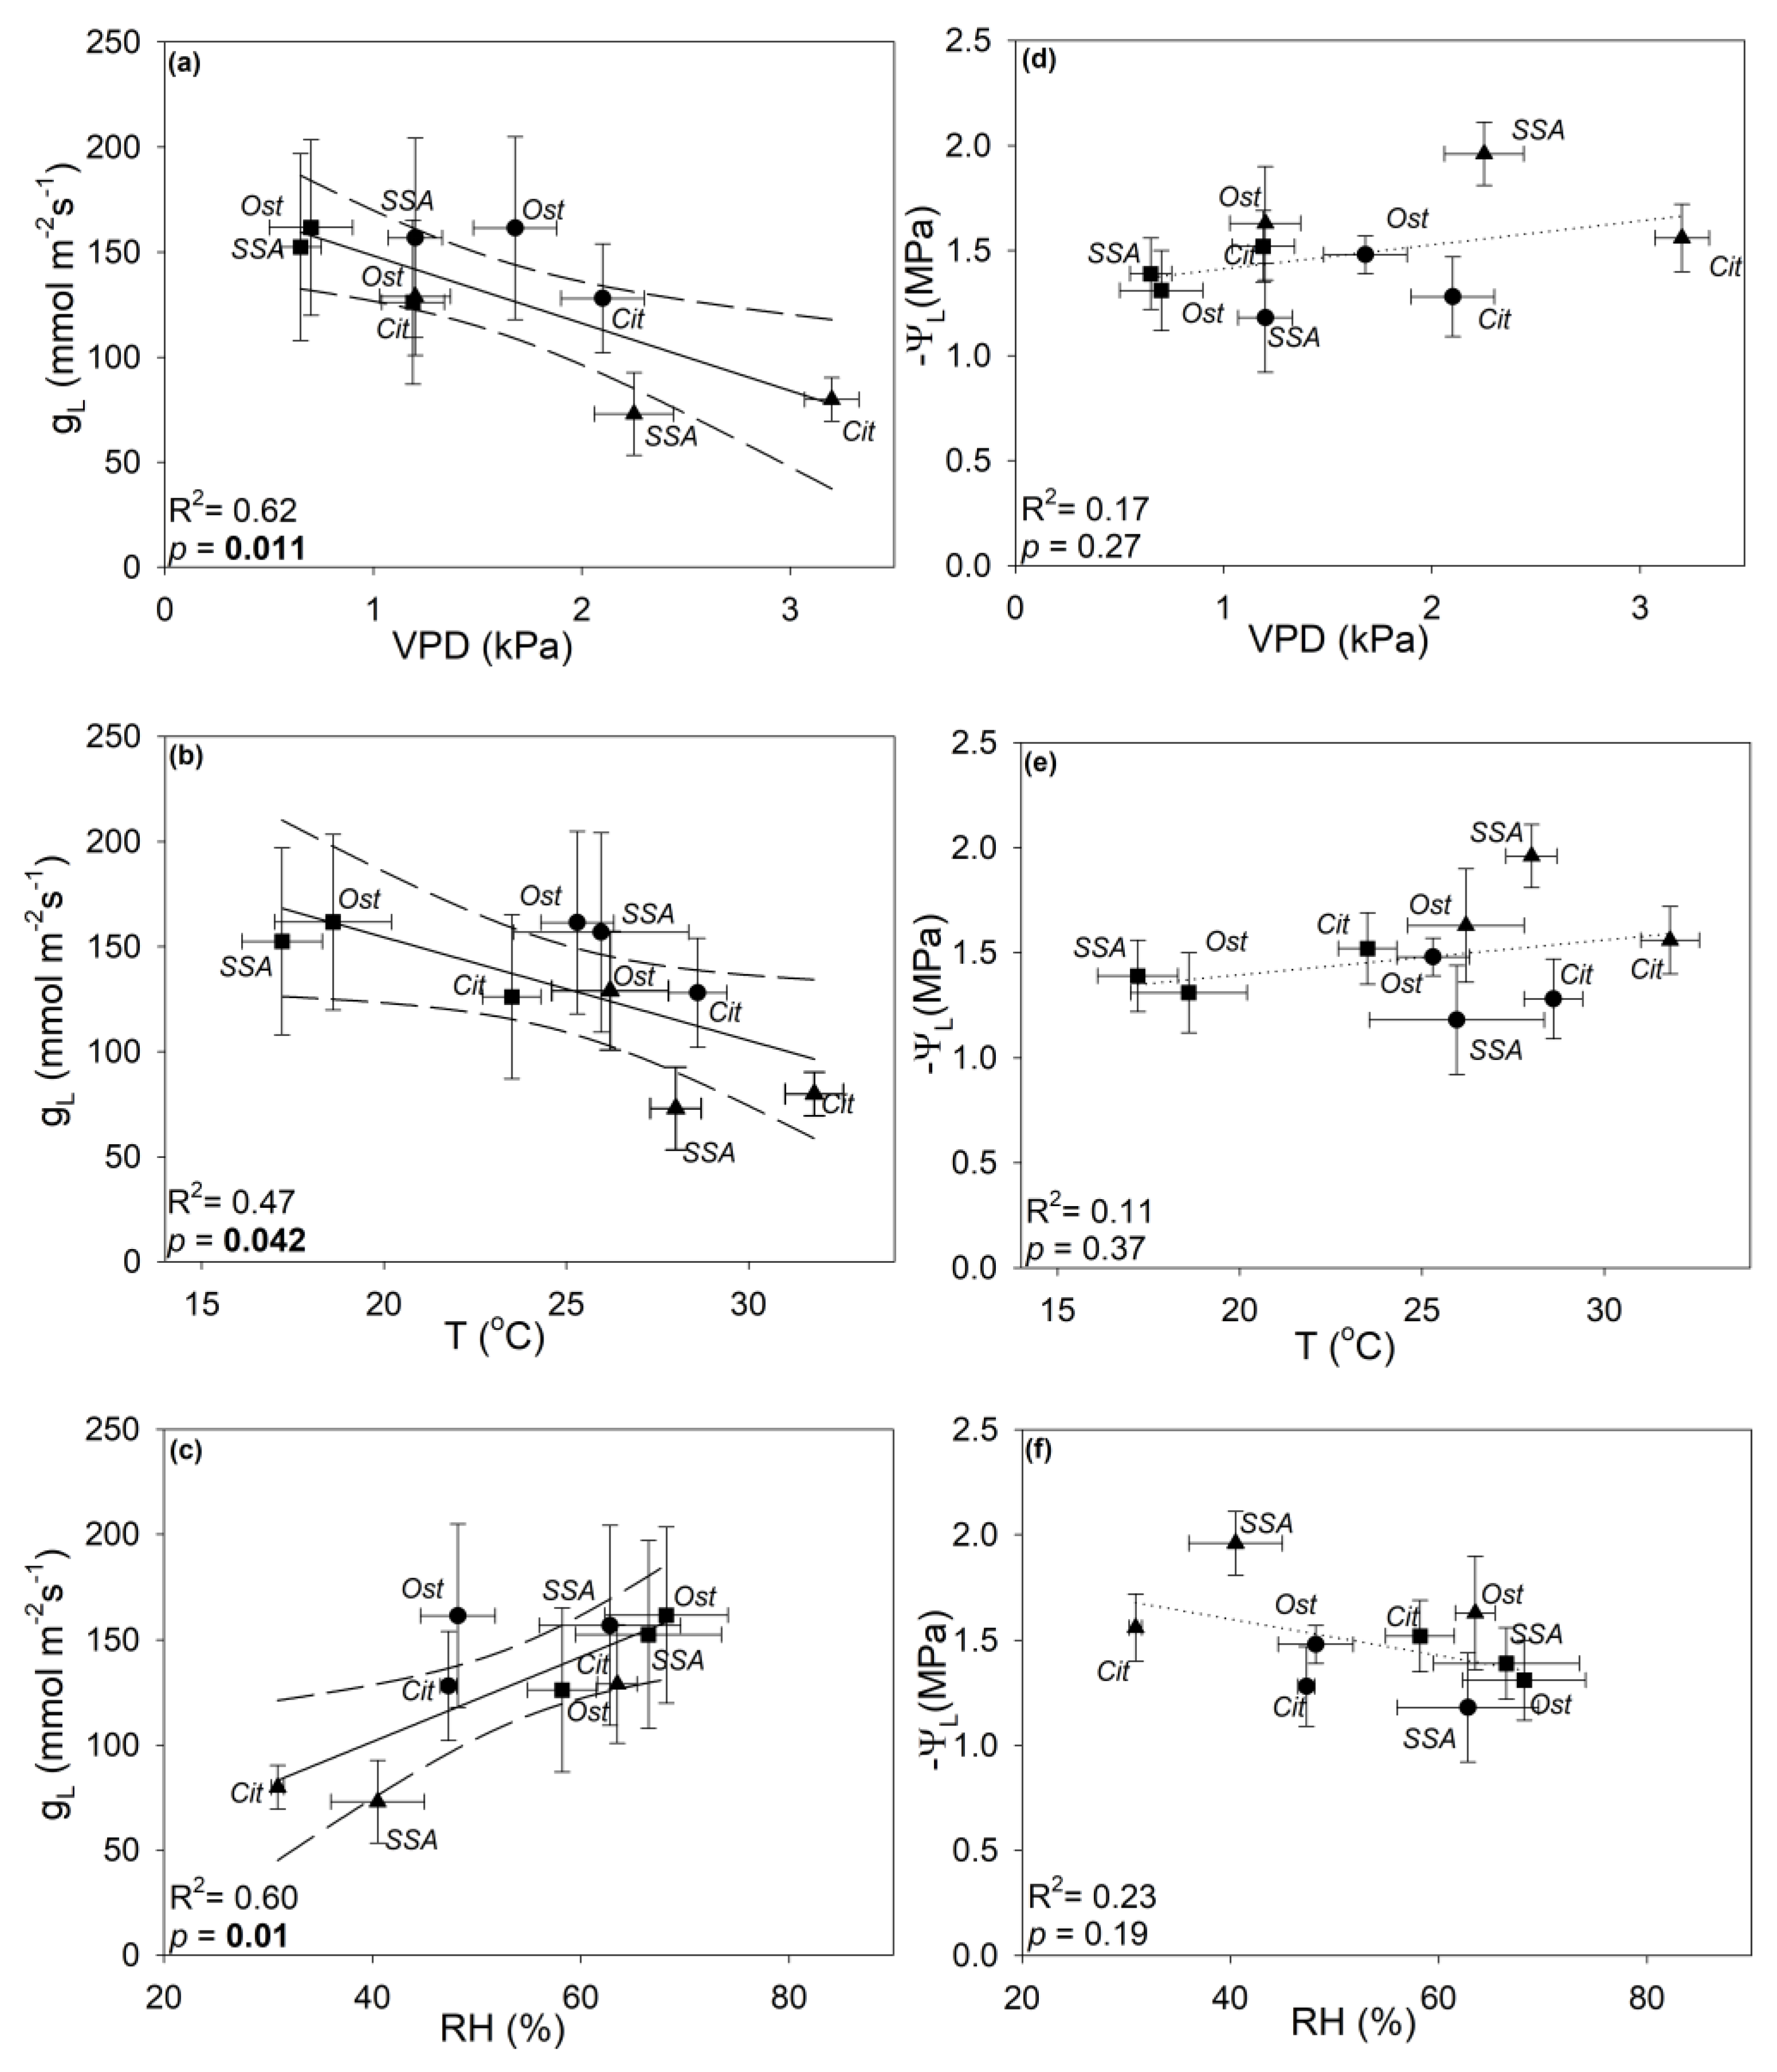
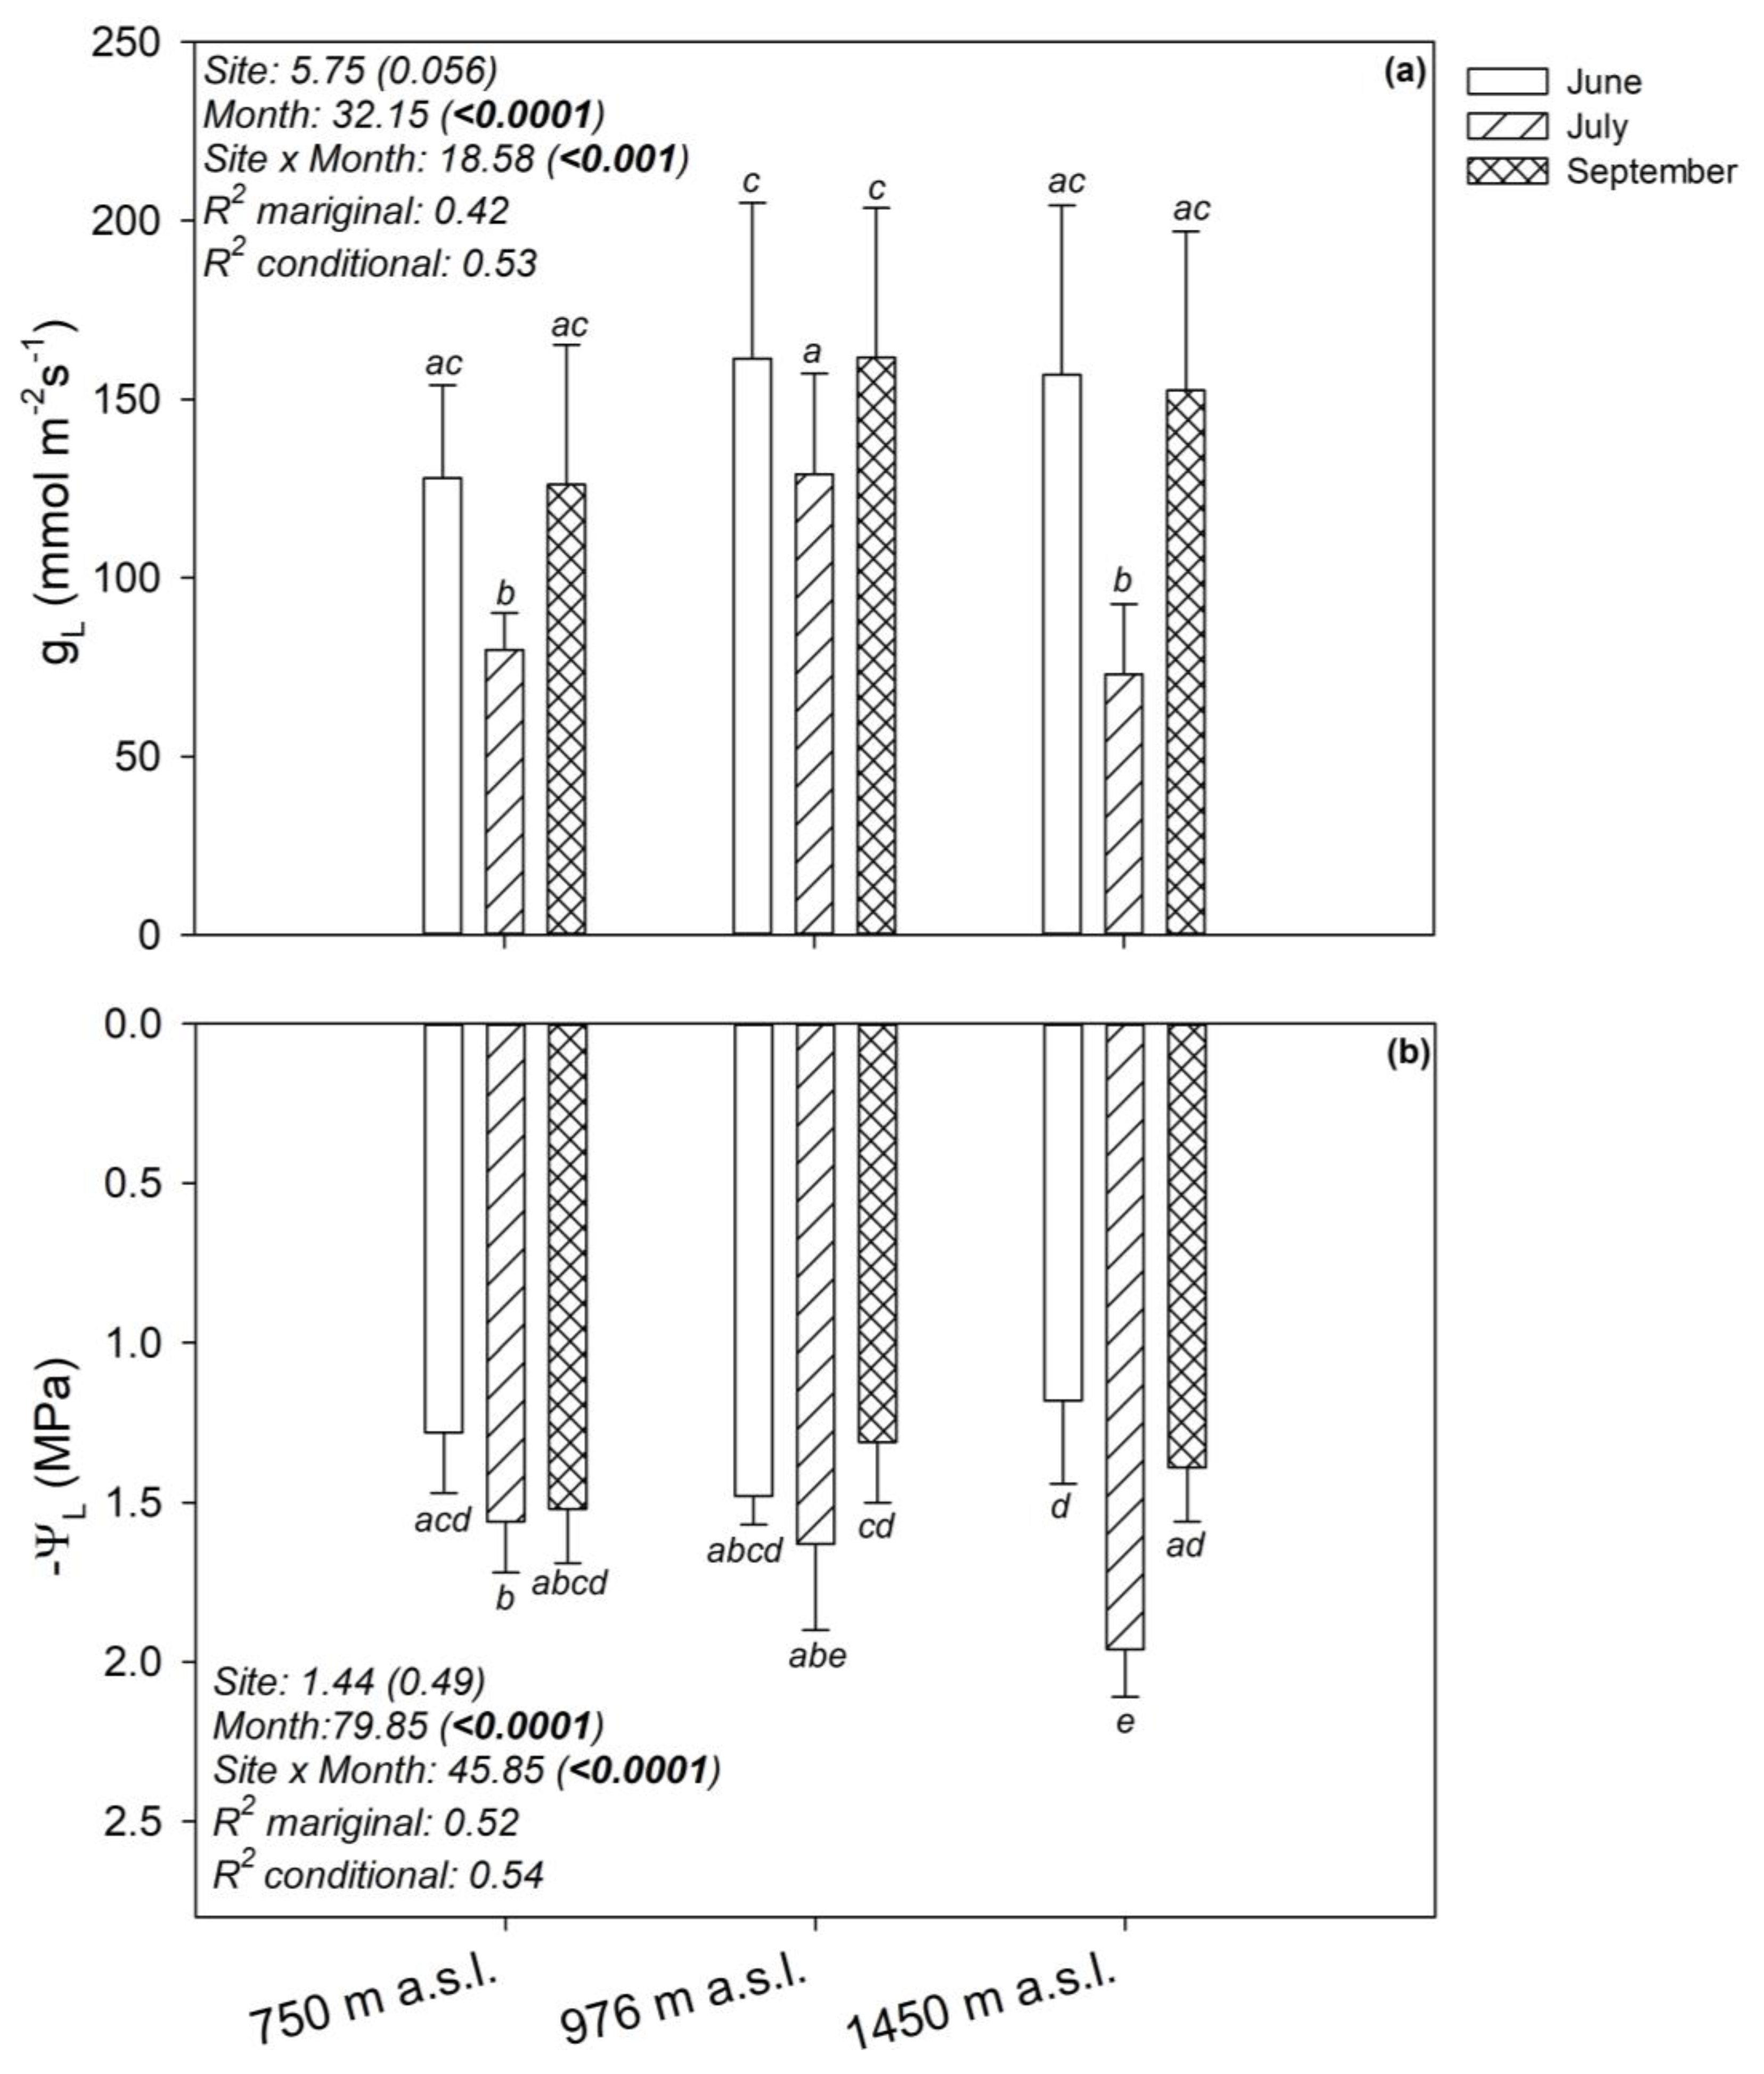
3.2. Seasonal Changes of Plant Water Relations

European beech samples growing at lower and higher altitude sites (i.e., 750 m a.s.l. and 1450 m a.s.l.) showed the same Ψtlp values as well as of πo and ε during the experimental period (Table 1). In detail, in the late summer, lower Ψtlp (i.e., more negative) as a consequence of lower πo values, were recorded in these sites with respect to values recorded in June. F. sylvatica samples growing at Ostello (i.e., 976 m a.s.l.) showed, at the beginning of the summer, Ψtlp and πo values similar to those recorded in the other two study sites but no change was recorded in response to the summer season. No significant change of ε was recorded in response to the summer season in all three study sites.
During the entire experimental period, plants growing at 976 m a.s.l. (Ostello) showed the highest values of stomatal conductance to water vapor with respect to plants growing at the two other sites (Figure 2). In July, a statistically significant stomatal closure occurred in samples growing in all three study sites. However, it can be noted that trees growing in Ostello (976 m a.s.l.), where a rainy spring occurred in 2022, in July showed gL values high as about 130 mmol m−2 s−1, i.e., the same value recorded in June and in September in samples growing at 750 m a.s.l. and 1450 m a.s.l. The most negative leaf water potential value (i.e., about −2.2 MPa) was recorded in July at the higher altitude site (i.e., 1450 m a.s.l.). However, the turgor loss point was reached at no site along the altitudinal transect.
The seasonal variation of gas exchange rates was strongly driven by VPD and, thus, by the diurnal and seasonal values of T and RH (Figure 3).

3.3. Anatomical Measurements

No difference in the mean leaf surface area was recorded among the three study sites (Table 2). Samples growing at Cittanova (750 m a.s.l.) showed the highest LMA value and the lowest values of vessel density, potential cross-sectional conductive area (Σπr2), relative xylem conduit area (Σπr2/Ax), vessel grouping index and vessel multiple fraction (Table 2). European beech growing at Santo Stefano in Aspromonte (1450 m a.s.l.) showed significantly higher values of vessel density (i.e., about 870), VG (about 2.4) and FVM (about 0.8) as well as the lowest values of the mean xylem conduit diameter (~20 μm), Dh (~27) and vs. (0.5) compared to samples growing at lower altitude study sites.

4. Discussion

Data recorded in the present study highlighted two main results: 1. plants growing in the three study sites showed anatomical and physiological differences in response to the little different environmental growing conditions, suggesting a high phenotypic plasticity. Therefore, the populations sampled in our study area represent a valuable genetic pool that can be exploited in forest management planning; 2. the measured turgor loss point (i.e., a proxy of drought resistance) was similar to or even less negative than values recorded in adult trees growing in central and northern Europe [31,32]. Likewise, measured xylem anatomical traits, such as mean conduit diameter (a proxy of xylem embolism vulnerability), were similar to values recorded in European beech growing in the warmer and more arid sites of central Europe [4,33,34]. Moreover, in the Mediterranean region, F. sylvatica grows in sites with specific microclimatic conditions (i.e., growing season rainfall not lower than about 400 mm and VPD not higher than about 3 kPa). Overall, these data suggest a vulnerability to severe drought events of this species similar to that of some measured F. sylvatica populations growing in northern and central Europe.

4.1. Phenotypic Plasticity of Beech Populations at Its Southern Distribution Limit

In all the three study sites, the recorded seasonal regulation in stomatal aperture operated properly to avoid dehydration damage, ensuring gas exchange, and therefore carbon assimilation, even in the hottest and driest month of the 2022 (July). However, it can be noted that the absence of changes in turgor loss point in Ostello (976 m a.s.l.) suggests that trees growing on this site did not experience drought conditions [31,32]. In fact, the site at 976 m a.s.l. showed the highest rainfall during the whole growing season and the least decrease in spring precipitation compared to data recorded in Cittanova (750 m a.s.l.) and Santo Stefano in Aspromonte (1450 m a.s.l.). In Cittanova (750 m a.s.l.) the MAT value of 2022 was higher with respect to the value reported in the literature for beech samples (i.e., 15.6 °C versus 6.6–13.5 °C, [23,34,35]. In this site, in July, F. sylvatica has experienced the highest VPD values with respect to plants growing in the other two study sites. This reasonably explains the higher LMA values recorded in samples growing in Cittanova (750 m a.s.l.) with respect to the value recorded in the sites at higher altitude. Indeed, LMA values are generally more strongly related to VPD values than to rainfall [36]. Therefore, the adjustments adopted by samples growing in this site allowed beech samples to cope with periods of the year with VPD values of about 3 kPa and temperature reaching peaks of 30 °C. Schönbeck et al. [37] showed that VPD and T values negatively impact European beech hydraulics, even when soil water is not limiting. Rising T and VPD caused major hydraulic dysfunctions in trees without soil drought with respect to the experience of drought per se. Furthermore, Zhu et al. [38] showed that different F. sylvatica leaf traits were driven by the previous years’ VPD values. On this basis, the significant negative relationship found between gL, a proxy of plant growth and, thus, productivity [39], and VPD, is not surprising, especially if considering the leaf water uptake ability of European beech by trichomes and cuticle [40,41].
Differences in anatomical traits were also recorded among the three study sites. The lowest values of the mean xylem vessel diameter and hydraulically weighted mean xylem conduit diameter and the highest values of vessel density were recorded in Santo Stefano in Aspromonte (1450 m a.s.l.). Different studies reported that vessel diameter is positively related to the water potential, leading to 50% loss of hydraulic conductivity (P50), and thus to the xylem embolism vulnerability, caused by drought and freeze–thaw events [42,43,44]. The link between xylem embolism vulnerability and xylem anatomy is probably more complex than we know, limiting our ability to predict how plant water transport is affected by environmental constraints [45]. Nevertheless, mean vessel diameter and/or Dh are good predictors of xylem vulnerability especially for diffuse porous species [46], such as F. sylvatica. The development of narrower conduits in samples growing at the 1450 m a.s.l. site is reasonably a proxy for the ability of the beech to adjust xylem traits to limit xylem embolism spread at the site where this risk is most likely to occur. Indeed, it can be noted that, at this site, there was a decrease in growing season precipitation of −153 mm and the greater increase in T (i.e., +2 °C) in 2022 with respect to the mean values of the last 60 years. Therefore, the beech trees growing in Santo Stefano in Aspromonte (1450 m a.s.l.) actually experienced, in 2022, a more severe hot and drought-like summer than in the past compared to the other two study sites. However, it can be noted that plants growing in this site showed a D value of about 20 μm, similar to value recorded in F. sylvatica trees growing in the more xeric and warmer sites of central Europe [33,34]. At a higher altitude study site, F. sylvatica trees also showed a lower solitary vessel index and higher values of vessel grouping index and vessel multiple vessel fraction values than those recorded in plants growing at lower altitudes. Vessel grouping indexes are poorly investigated functional traits of the xylem hydraulic system, despite their potential ecological relevance. Higher conduit connectivity increases the risk of xylem embolism spread to the neighboring conduits of similar developmental age and radial position because xylem embolism likely propagates by air seeding from embolized into neighboring conduits in a circumferential pattern [47]. However, a greater number of grouped vessels can increase the resilience to xylem dysfunction because it provides alternative pathways to bypass the non-functioning vessel(s) through one or more still functional xylem conduits [48,49], also increasing the xylem hydraulic conductivity by ion-mediated mechanism [26,50]. Thus, the higher number of grouped vessels recorded in the site with more environmental constraints (i.e., hot and drought-like during the summer and cold during the winner) may actually improve the redundancy of the xylem pathways to mitigate the risk of xylem dysfunction. In summary, higher vessel density, smaller vessel diameter and higher vessel grouping index suggest greater resistance to xylem embolism of plants growing at 1450 m a.s.l. with respect to those at lower altitude sites [51]. Last but not least, high vessel density and xylem conductive allow compensating of the low efficiency of water transport, as driven by narrower conduits (on the basis of the Hagen–Poiseuille equation) of these trees.

4.2. Climate-Driven Plasticity

On a global scale, 2022 was a year of climate extremes: Europe experienced its second-warmest year on record and severe heat waves and drought events were recorded in different regions, including Italy (https://climate.copernicus.eu, accessed on 15 June 2023). In line with this report, in all three study sites, 2022 was characterized by higher temperature and lower precipitation with respect to the mean values recorded in the last 60 years, especially during the growing season. However, no evident symptom of climate-driven suffering has been noted in the studied beech populations, as previously discussed. These findings allow advancement of our knowledge on environmental thresholds limiting beech growth.
Knutzen et al. [52] have estimated for the center and north distribution range of beech that the minimum MAP value ensuring the survival of this species is about 660 mm and not less than about 350 mm of rainfall must occur during the growing season. Different studies have reported the key role of the water availability, especially during the spring/early summer for beech tree growth [6,53] as well as the relevant impact of climatic conditions of the current year with respect to that of the previous year [54]. At the investigated sites, despite the documented heat waves and drought events during spring and summer of 2022, the precipitation and temperature that occurred during the growing season were above the thresholds estimated by Knutzen et al. [52]. In other words, we suggest that, in addition to a long-term acclimatation, the growth F. sylvatica populations in Calabria (southern edge) is guaranteed by the presence of specific microclimate conditions, widely different from those of the coastal areas’ climate, characterized by an adequate rainfall rate during the growing seasons (i.e., not less than about 400 mm) and relatively low VPD, not higher than about 3 kPa. In accordance, no shift towards drier sites has been documented in southern Italy for this species.

5. Conclusions

Overall, our data support the hypothesis that European beech populations growing at their southern distribution limit have a significant phenotypic plasticity leading them to be able to regulate stomatal conductance and change physiological and anatomical traits in response to even a narrow range of climate conditions (rainfall and temperature) during the growing season. However, the fact that, at southern Italy, F. sylvatica typically grow only at sites with high mean annual precipitation (i.e., not lower than 800–1000 mm year−1) and mean maximum summer temperature not exceeding 25 °C, strongly suggests that this species is not able to face more severe drought and temperature raises. In fact, the distribution of F. sylvatica seems to be limited to areas with a growing season rainfall of at least 400 mm and vapor pressure deficit (VPD) values < 3 kPa, i.e., threshold values similar to European beech growing in central Europe. Future studies and predictive models will have to pay particular attention to the range of VPD values suitable for F. sylvatica growth.

Author Contributions

Conceptualization and methodology, M.A.L.G., M.P. and P.T.; investigation and formal analysis, M.T.C., F.P., M.P. and P.T.; data curation, writing—original draft preparation, P.T.; funding acquisition, P.T. All authors have read and agreed to the published version of the manuscript.

Funding

This research was supported by Finanziamento Attività di Base della Ricerca di Ateneo (FFABR Unime) 2020.

Data Availability Statement

Data will be made available on request.

Conflicts of Interest

The authors declare no conflict of interest.

References

  1. Durrant, T.H.; de Rigo, D.; Caudullo, G. Fagus sylvatica and other beeches in Europe: Distribution, habitat, usage and threats. In European Atlas of Forest Tree Species; San-Miguel-Ayanz, J., de Rigo, D., Caudullo, G., Houston Durrant, T., Mauri, A., Eds.; Publication Office of EU: Luxembourg, 2016; pp. 40–45. [Google Scholar]
  2. Spampinato, G.; Crisarà, R.; Cameriere, P.; Cano-Ortiz, A.; Musarella, C.M. Analysis of the forest landscape and its transformations through phytotoponyms: A case study in Calabria (Southern Italy). Land 2022, 11, 518. [Google Scholar] [CrossRef]
  3. Schuldt, B.; Buras, A.; Arend, M.; Vitasse, Y.; Beierkuhnlein, C.; Damm, A.; Kahmen, A. A first assessment of the impact of the extreme 2018 summer drought on Central European forests. Basic Appl. Ecol. 2020, 45, 86–103. [Google Scholar] [CrossRef]
  4. Leuschner, C. Drought response of European beech (Fagus sylvatica L.)—A review. Perspect. Plant Ecol. Evolut. Syst. 2020, 47, 12557. [Google Scholar] [CrossRef]
  5. Farahat, E.; Linderholm, H.W. Growth-climate relationship of European beech at its northern distribution limit. Europ. J. Forest Res. 2018, 137, 619–629. [Google Scholar] [CrossRef]
  6. Obladen, N.; Dechering, P.; Skiadaresis, G.; Tegel, W.; Keßler, J.; Höllerl, S.; Kaps, S.; Hertel, M.; Dulamsuren, C.; Seifert, T.; et al. Tree mortality of European beech and Norway spruce induced by 2018–2019 hot droughts in central Germany. Agric. Forest Meteorol. 2021, 307, 108482. [Google Scholar] [CrossRef]
  7. Martinez del Castillo, E.; Zang, C.S.; Buras, A.; Hacket-Pain, A.; Esper, J.; Serrano-Notivoli, R.; de Luis, M. Climate-change-driven growth decline of European beech forests. Communicat. Biol. 2022, 5, 163. [Google Scholar] [CrossRef]
  8. Kulla, L.; Roessiger, J.; Bošea, M.; Kucbel, S.; Murgaš, V.; Vencurik, J.; Pittner, J.; Jaloviar, P.; Šumichrast, L.; Saniga, M. Changing patterns of natural dynamics in old-growth European beech (Fagus sylvatica L.) forests can inspire forest management in Central Europe. Forest Ecol. Manag. 2023, 529, 120633. [Google Scholar] [CrossRef]
  9. Tomasella, M.; Beikircher, B.; Häberle, K.; Hesse, B.; Kallenbach, C.; Matyssek, R.; Mayr, S. Acclimation of branch and leaf hydraulics in adult Fagus sylvatica and Picea abies in a forest through-fall exclusion experiment. Tree Physiol. 2018, 38, 198–211. [Google Scholar] [CrossRef]
  10. Tomasella, M.; Nardini, A.; Hesse, B.D.; Machlet, A.; Matyssek, R.; Häberle, K. Close to the edge: Effects of repeated severe drought on stem hydraulics and non-structural carbohydrates in European beech saplings. Tree Physiol. 2019, 39, 717–728. [Google Scholar] [CrossRef]
  11. Meyer, B.F.; Buras, A.; Rammig, A.; Zang, C.S. Higher susceptibility of beech to drought in comparison to oak. Dendrocronology 2020, 64, 125780. [Google Scholar] [CrossRef]
  12. Peuke, A.D.; Schraml, C.; Hartung, W.; Rennenberg, H. Identification of drought-sensitive beech ecotypes by physiological parameters. New Phytol. 2002, 154, 373–387. [Google Scholar] [CrossRef]
  13. Rose, L.; Leuschner, C.; Kockemann, B.; Buschmann, H. Are marginal beech (Fagus sylvatica L.) provenances a source for drought tolerant ecotype? Europ. J. Forest Res. 2009, 128, 335–343. [Google Scholar] [CrossRef]
  14. Weber, P.; Bugmann, H.; Pluess, a.R.; Walthert, L.; Rigling, A. Drought response and changing mean sensitivity of European vìbeech close to dry distribution limit. Trees Struct. Funct. 2013, 27, 171–181. [Google Scholar] [CrossRef]
  15. Pfenninger, M.; Reuss, F.; Kiebler, A.; Schönnenbeck, P.; Caliendo, C.; Gerber, S.; Cocchiararo, B.; Reuter, S.; Blüthgen, N.; Mody, K.; et al. Genomic basis for drought resistance in European beech forests threatened by climate change. eLife 2021, 10, e65532. [Google Scholar] [CrossRef] [PubMed]
  16. Knutzen, F.; Meier, I.C.; Leuschner, C. Does reduced precipitation trigger physiological and morphological drought adaptations in European beech (Fagus sylvatica L.)? Comparing provenances across a precipitation gradient. Tree Physiol. 2015, 35, 949–963. [Google Scholar] [CrossRef] [PubMed]
  17. Stolz, J.; van der Maaten, E.; Kalanke, H.; Martin, J.; Wilmking, M.; van der Maaten-Theunissen, M. Increasing climate sensitivity of beech and pine is not mediated by adaptation and soil characteristics along a precipitation gradient in northeastern Germany. Dendrochrology 2021, 67, 125834. [Google Scholar] [CrossRef]
  18. Wang, F.; Israel, D.; Ramirez-Valiente, J.A.; Sanchez-Gomez, D.; Aranda, I.; Aphalo, P.J.; Robson, T.M. Seedlings from marginal and core populations of European beech (Fagus sylvatica L.) respond differently to imposed drought and shade. Trees Struct. Funct. 2021, 35, 53–67. [Google Scholar] [CrossRef]
  19. Lo Gullo, M.A.; Salleo, S.; Rosso, R.; Trifilò, P. Drought resistance of 2 years old saplings of Mediterranean forest trees in the field: Relations between water relations, hydraulics and productivity. Plant Soil 2003, 250, 259–272. [Google Scholar] [CrossRef]
  20. Niinemets, U. Responses of forest trees to single and multiple environmental stresses from seedlings to mature plants: Past stress history, stress interactions, tolerance and acclimation. Forest Ecol. Manag. 2010, 260, 1623–1639. [Google Scholar] [CrossRef]
  21. Andivia, E.; Ruiz-Benito, P.; Díaz-Martínez, P.; Carro-Martínez, N.; Zavala, M.A.; Madrigal-González, J. Inter-specific tolerance to recurrent droughts of pine species revealed in saplings rather than adult trees. Forest Ecol. Manag. 2020, 459, 117848. [Google Scholar] [CrossRef]
  22. Pignatti, S. Flora d’Italia—Volume II, 2nd ed.; Edagricole: Bologna, Italy, 1982; ISBN 978-88-506-5243-3. [Google Scholar]
  23. Fotelli, M.N.; Nahm, M.; Radoglou, K.; Rennenberg, H.; Halyvopoulos, G.; Matzarakis, A. Seasonal and interannual ecophysiological responses of beech (Fagus sylvatica) at its south-eastern distribution limit in Europe. Forest Ecol. Manag. 2009, 257, 1157–1164. [Google Scholar] [CrossRef]
  24. Tyree, M.T.; Hammel, H.T. The measurement of the turgor pressure and the water relations of plants by the pressure-bomb technique. J. Exp. Bot. 1972, 23, 267–282. [Google Scholar] [CrossRef]
  25. Kolb, K.J.; Sperry, J.S. Differences in drought adaptation between subspecies of sagebrush (Artemisia tridentata). Ecology 1999, 80, 2373–2384. [Google Scholar] [CrossRef]
  26. Jansen, S.; Gortan, E.; Lens, F.; Lo Gullo, M.A.; Salleo, S.; Scholz, A.; Stein, A.; Trifilò, P.; Nardini, A. Do quantitative vessel and pit characters account for ion-mediated changes in the hydraulic conductance of angiosperm xylem? New Phytol. 2011, 189, 218–228. [Google Scholar] [CrossRef] [PubMed]
  27. Pinheiro, J.; Bates, D.; Debroy, S.; Sarkar, D.; R Core Team. Nlme Nonlinear MIXED Effects Models. R Package. Version 3.1-124. 2016. Available online: https://CRAN.R-project.org/package=nlme (accessed on 14 January 2022).
  28. R Core Team. R: A Language and Environment for Statistical Computing; R Foundation for Statistical Computing: Vienna, Austria, 2020; Available online: https://www.R-project.org/ (accessed on 14 January 2022).
  29. Lenth, R.V. Emmeans: Estimated Marginal Means, aka LeastSquares Means. R Package Version 1.7.2. 2022. Available online: https://CRAN.R-project.org/package=emmeans (accessed on 14 June 2022).
  30. Bartoń, K. MuMIn: Multi-Model Inference. R Package Version 1.47.5. 2023. Available online: https://CRAN.R-project.org/package=MuMIn (accessed on 5 August 2023).
  31. Bartlett, M.K.; Scoffoni, C.; Sack, L. The determinants of leaf turgor loss point and prediction of drought tolerance of species and biomes: A global meta-analysis. Ecol. Lett. 2012, 15, 393–405. [Google Scholar] [CrossRef] [PubMed]
  32. Zhu, S.; Chen, Y.; Ye, Q.; He, P.; Liu, H.; Li, R.; Fu, P.; Jiang, G.; Cao, K. Leaf turgor loss point is correlated with drought tolerance and leaf carbon economics traits. Tree Physiol. 2018, 38, 658–663. [Google Scholar] [CrossRef]
  33. Schuldt, B.; Knutzen, F.; Delzon, S.; Jansen, S.; Müller-Haubold, H.; Burlett, R.; Clough, Y.; Leuschner, C. How adaptable is the hydraulic system of European beech in the face of climate change-related precipitation reduction? New Phytol. 2016, 210, 443–458. [Google Scholar] [CrossRef] [PubMed]
  34. Vicente, E.; Didion-Gency, M.; Morcillo, L.; Morin, X.; Vilagrosa, A.; Grossiord, C. Aridity and cold temperatures drive divergent adjustments of European beech xylem anatomy, hydraulics and leaf physiological traits. Tree Physiol. 2022, 42, 1720–1735. [Google Scholar] [CrossRef] [PubMed]
  35. Peters, R. Beech Forests in Geobotany; No. 24; Kluwer Academic Publishers: Dordrecht, The Netherlands, 1997; p. 169. ISBN 978-079-234-485-8. [Google Scholar]
  36. Wright, I.J.; Reich, P.B.; Cornelissen, J.H.C.; Falster, D.S.; Groom, P.K.; Hikosaka, K.; Lee, W.; Lusk, C.H.; Niinemets, Ü.; Oleksyn, J.; et al. Modulation of leaf economic traits and trait relationships by climate. Glob. Ecol. Biogeogr. 2005, 14, 411–421. [Google Scholar] [CrossRef]
  37. Schönbeck, L.C.; Schuler, P.; Lehmann, M.M.; Mas, E.; Mekarni, L.; Pivovaroff, A.L.; Turberg, P.; Grossiord, C. Increasing temperature and vapour pressure deficit lead to hydraulic damages in the absence of soil drought. Plant Cell Environ. 2022, 45, 3275–3289. [Google Scholar] [CrossRef]
  38. Zhu, J.; Thimonier, A.; Etzold, S.; Meusburger, K.; Waldner, P.; Schmitt, M.; Schleppi, P.; Schaub, M.; Thormann, J.; Lehmann, M.M. Variation in leaf morphological traits of European beech and norway spruce over two decades in Switzerland. Front. For. Glob. Chang. 2022, 4, 778351. [Google Scholar] [CrossRef]
  39. Gago, J.; de Menezes Daloso, D.; Figueroa, C.M.; Flexas, J.; Fernie, A.R.; Nikoloski, Z. Relationships of leaf net photosynthesis, stomatal conductance, and mesophyll conductance to primary metabolism: A multispecies meta-analysis approach. Plant Physiol. 2016, 171, 265–279. [Google Scholar] [CrossRef] [PubMed]
  40. Schreel, J.D.M.; Leroux, O.; Goossens, W.; Brodersen, C.; Rubinstein, A.; Steppe, K. Identifying the pathways for foliar water uptake in beech (Fagus sylvatica L.): A major role for trichomes. Plant J. 2020, 103, 769–780. [Google Scholar] [CrossRef] [PubMed]
  41. Schreel, J.D.M.; Brodersen, C.; De Schryver, T.; Dierick, M.; Rubinstein, A.; Dewettinck, K.; Boone, M.N.; Van Hoorebeke, L.; Steppe, K. Foliar water uptake does not contribute to embolism repair in beech (Fagus sylvatica L.). Ann. Bot. 2022, 129, 555–566. [Google Scholar] [CrossRef] [PubMed]
  42. Choat, B.; Medek, D.E.; Stuart, S.A.; Pasquet-Kok, J.; Egerton, J.J.G.; Salari, H.; Sack, L.; Ball, M.C. Xylem traits mediate a trade-off between resistance to freeze–thaw-induced embolism and photosynthetic capacity in overwintering evergreens. New Phytol. 2011, 191, 996–1005. [Google Scholar] [CrossRef] [PubMed]
  43. Lintunen, A.; Hölttä, T.; Kulmala, M. Anatomical regulation of ice nucleation and cavitation helps trees to survive freezing and drought stress. Sci. Rep. 2013, 3, 2031. [Google Scholar] [CrossRef]
  44. Hacke, U.G.; Spicer, R.; Schreiber, S.G.; Plavcová, L. An ecophysiological and developmental perspective on variation in vessel diameter. Plant Cell Environ. 2017, 40, 831–845. [Google Scholar] [CrossRef]
  45. Lens, F.; Gleason, S.M.; Bortolami, G.; Brodersen, C.; Delzon, S.; Jansen, S. Functional xylem characteristics associated with drought-induced embolism in angiosperms. New Phytol. 2022, 236, 2019–2036. [Google Scholar] [CrossRef]
  46. Isasa, E.; Link, R.M.; Jansen, S.; Tezeh, F.R.; Kaack, L.; Sarmento Cabral, J.; Schuldt, B. Addressing controversies in the xylem embolism resistance–vessel diameter relationship. New Phytol. 2023, 238, 283–296. [Google Scholar] [CrossRef]
  47. Pritzkow, C.; Brown, M.J.M.; Carins-Murphy, M.R.; Bourbia, I.; Mitchell, P.J.; Brodersen, C.; Choat, B.; Brodribb, T.J. Conduit position and connectivity affect the likelihood of xylem embolism during natural drought in evergreen woodland species. Ann. Bot. 2022, 130, 431–444. [Google Scholar] [CrossRef]
  48. Carlquist, S. Xylem heterochrony: An unappreciated key to angiosperm origin and diversifications. Bot. J. Linn. Soc. 2009, 161, 26–65. [Google Scholar] [CrossRef]
  49. Lens, F.; Sperry, J.S.; Christman, M.A.; Choat, B.; Rabaey, D.; Jansen, S. Testing hypotheses that link wood anatomy to cavitation resistance and hydraulic conductivity in the genus Acer. New Phytol. 2011, 190, 709–723. [Google Scholar] [CrossRef]
  50. Trifilò, P.; Barbera, P.M.; Raimondo, F.; Nardini, A.; Lo Gullo, M.A. Coping with drought-induced xylem cavitation: Coordination of embolism repair and ionic effects in three Mediterranean evergreens. Tree Physiol. 2014, 34, 109–122. [Google Scholar] [CrossRef] [PubMed]
  51. Levionnois, S.; Jansen, S.; Wandji, R.T.; Beauchêne, J.; Ziegler, C.; Coste, S.; Stahl, C.; Delzon, S.; Authier, L.; Heuret, P. Linking drought-induced xylem embolism resistance to wood anatomical traits in Neotropical trees. New Phytol. 2021, 229, 1453–1466. [Google Scholar] [CrossRef] [PubMed]
  52. Knutzen, F.; Dulamsuren, C.; Meier, I.C.; Leuschner, C. Recent climate warming-related growth decline impairs Eueopean beech in the center of its distribution range. Ecosystems 2017, 20, 1494–1511. [Google Scholar] [CrossRef]
  53. Dulamsuren, C.; Hauck, M.; Kopp, G.; Ruff, M.; Leuschner, C. European beech responds to climate change with growth decline at lower, and growth increase at higher elevations in the center of its distribution range (>SW Germany). Trees Struct. Funct. 2017, 31, 676. [Google Scholar] [CrossRef]
  54. Hacket-Pain, A.J.; Cavin, L.; Friend, A.D.; Jump, A.S. Consistent limitation of growth by high temperature and low precipitation from range core to southern edge of European beech indicates widespread vulnerability to changing climate. Europ. J. Forest Res. 2016, 135, 897–909. [Google Scholar] [CrossRef]
Figure 1. Mean monthly precipitation sums (Precipitation) and air temperature (Temperature) for the period 1960–2021 (black columns and solid line, respectively) and 2022 (white columns and dash line) as recorded in the three study sites, (a) Cittanova (750 m a.s.l.), (b) Ostello (976 m a.s.l., (c) Santo Stefano in Aspromonte (1450 m a.s.l.). Data derived from Arpacal Calabria, https://www.meteoincalabria.com/tag/arpacal/, accessed on 20 January 2023.
Forests 14 02058 g001
Figure 2. Mean values ± SD of (a) stomatal conductance at water vapor, gL, and (b) leaf water potential, −ΨL, as recorded in the three study sites in June, July and September. Values were recorded from 11:00 to 14:00. Different letters indicate statistically significant differences between groups. Χ2 and p values, as obtained by the LMMs, are reported. Significant p-values are in bold. Study sites (Site, i.e., 750 m a.s.l., 976 m a.s.l. and 1450 m a.s.l.) and the month in which measurements have been performed (Month) (i.e., June, July and September) are the explanatory variables.
Forests 14 02058 g002
Figure 3. Relationships between the values of stomatal conductance to water vapor, gL, and leaf water potential, −ΨL and the vapor pressure deficit, VPD ((a) and (d), respectively), temperature, T ((b) and (e), respectively) and relative humidity, RH ((c) and (f), respectively) as recorded from 11:00 to 14:00 in plants of F. sylvatica growing at three different altitudes in June (circle), July (triangle) and September (square). Black solid and short dotted lines show the regression curve and associated 95% Cis, respectively. Long dotted lines show very weak correlations. R2 and p values are reported. Significant p-values are in bold. Cit: Cittanova (750 m a.s.l.); Ost: Ostello (976 m a.s.l.); SSA: Santo Stefano in Aspromonte (1450 m a.s.l.).
Forests 14 02058 g003
Table 1. Mean ± SD of leaf water potential at turgor loss point (Ψtlp), osmotic potential at full turgor (πo) and elastic modulus at full turgor (ε) as recorded in the study sites in June and September 2022. Different letters indicate statistically different values as recorded by a two-way ANOVA. The p-values are also reported. Significant p-values are in bold. Cit: Cittanova; Ost: Ostello; SSA: Santo Stefano in Aspromonte.
Study SiteMonth−Ψtlp (MPa)−πo (MPa)ε (MPa)
750 m a.s.l. (Cit)June2.30 ± 0.05 a1.69 ± 0.04 a24.5 ± 1.7
September2.64 ± 0.10 b1.82 ± 0.02 bc30.5 ± 9.2
976 m a.s.l. (Ost)June2.19 ± 0.1 a1.66 ± 0.09 a23.5 ± 11.3
September2.16 ± 0.09 a1.72 ± 0.11 ac20.1 ± 7.5
1450 m a.s.l. (SSA)June2.20 ± 0.04 a1.78 ± 0.08 a17.9 ± 5.9
September2.59 ± 0.09 b1.88 ± 0.11 b32.1 ± 6.9
p-valueSite<0.00010.0541.779
Month<0.00010.0021.297
Site × Month<0.00010.3411.187
Table 2. Mean ± SD of anatomical traits measured in September in F. sylvatica samples growing at three different altitude sites, i.e., 750 m a.s.l., 976 m a.s.l. and 1450 m a.s.l. Different letters indicate statistically different values recorded among the three study sites on the basis of a one-way ANOVA test. The p-values are also reported. Significant p-values are in bold. Cit: Cittanova; Ost: Ostello; SSA: Santo Stefano in Aspromonte; AL: leaf surface area (n = 12); LMA: leaf mass area (n = 12); Ax: xylem surface area (n = 3); Σπr2: potential cross-sectional conductive area (n = 3); Σπr2/Ax: relative xylem conduit area (n = 3); Vd: vessel density (n = 3); D: mean xylem conduit diameter (n = 3); Dh: hydraulically weighted mean xylem conduit diameter (n = 3); Σr4: efficiency of water transport (n = 3); Vs: solitary vessel index (n = 3); VG: vessel grouping index (n = 3); FVM: vessel multiple fraction (n = 3).
750 m a.s.l. (Cit)976 m a.s.l. (Ost)1450 m a.s.l. (SSA)p-Value
AL (cm2)19.2 ± 6.615.7 ± 5.518.5 ± 6.40.352
LMA (g m−2)42.9 ± 9.3 a30.0 ± 2.6 b32.4 ± 8.1 b<0.001
Ax (mm2)8.2 ± 0.610.4 ± 2.17.7 ± 1.31.0
Vd375.8 ± 19.1 a564.5 ± 30.7 b869.6 ± 17.6 c<0.001
D (μm)24.3 ± 1.3 a22.8 ± 0.2 a19.7 ± 0.3 b<0.001
Dh (μm)30.8 ± 2.3 a30.8 ± 0.2 a27.2 ± 0.7 b0.017
Σπr2 (mm2)1.45 ± 0.09 a2.78 ± 0.64 b2.24 ± 0.40 b0.002
Σπr2/Ax (%)17.7 ± 2.0 a26.7 ± 2.9 b29.0 ± 0.4 b<0.001
Σr4 E-6 (mm2)98.9 ± 18.7173.6 ± 42.2 b113.7 ± 25.50.052
Vs0.69 ± 0.05 a0.69 ± 0.006 a0.5 ± 0.03 b<0.001
VG1.44 ± 0.08 a1.88 ± 0.08 b2.43 ± 0.06 c<0.001
FVM0.49 ± 0.07 a0.61 ± 0.01 b0.80 ± 0.01 c<0.001
Disclaimer/Publisher’s Note: The statements, opinions and data contained in all publications are solely those of the individual author(s) and contributor(s) and not of MDPI and/or the editor(s). MDPI and/or the editor(s) disclaim responsibility for any injury to people or property resulting from any ideas, methods, instructions or products referred to in the content.

