Abstract
Stand structure, which links function and management, plays a crucial role in regulating forest ecosystems and influencing biodiversity. Nevertheless, knowledge of the effect of climate change on stand structure and plant diversity is still poorly understood on a large scale. To explore the effects of various climate conditions on stand structure–plant diversity, we conducted a comprehensive analysis of data from 1272 plots across China’s temperate and subtropical forests. Leveraging the structural equation model (SEM), we explored the direct and indirect effects of climate, topography, and tree diversity on understory woody and herbaceous plants with respect to stand structure. Furthermore, we evaluated the effect size of stand structure on understory vegetation diversity under different climatic zones. Our results showed that tree size variation (CV DBH) and stem density (SD) were the key drivers for understory woody plants, while the stand structure complexity index (SSCI) was more important for understory herbaceous diversity. Furthermore, the positive effects of stand structure differed across various climate zones and were enhanced with an increase in the climatic gradient. For instance, the impact of SD on understory woody plants, as well as the influence of the SSCI on the diversity of understory herbaceous vegetation, were both strengthened. These findings raise our awareness of the pressing need to manage stand structure heterogeneity differently across different climate zones, and different management also needs to be implemented among different understory plant types. It becomes evident that distinct forest management measures must be applied under future climate change and forest management practices in order to preserve biodiversity.
1. Introduction
Maintaining diversity in native ecosystems is recognized as a critical factor for the sustainable management of the goods and services desired by society [1]. However, in the years since Dasmann’s [2] work on biological diversity, the relative roles of abiotic and biotic factors in determining forest plant diversity at a large scale are still widely debated. Numerous studies have focused on describing how overstory, site, and understory vegetation interact in the forest environment [3]. These interactions have been long understood to be both complex and dynamic, and they have profound effects on the composition, structure, and productivity of understory vegetation [4]. However, the conclusions of different studies can vary, particularly for understory plant diversity [5,6]. Some studies have concluded that climate is one of the most important abiotic factors controlling the distribution of organisms and community structures [7,8], whereas other studies show that different overstory compositions may lead to different understory covers and diversity [9,10]. These varying conclusions suggest the existence of multiple interaction mechanisms, which have been often overlooked from a species-specific response to the environmental gradient.
Indeed, a major issue that has hampered attempts to resolve these conflicting patterns is that most approaches have only accounted for a direct effect, without acknowledging that biotic factors (e.g., climate) widely affect biodiversity through indirect effects. Furthermore, indirect effects may vary in the strength of their responses to interaction processes across different environmental gradients [11]. On the one hand, different climatic zones represent different thresholds for climate features, such as temperature, precipitation, and sunshine duration; on the other hand, different climatic conditions form different tree diversity compositions and stand structures, which further affect the understory microclimate through the transmittance of light and precipitation [12]. However, climate change may alter the effect of structure on understory species diversity [13], which, though still unclear, may impact stand structure–plant diversity across difference climate gradients.
The stand structure is a direct object of research for forest management, thereby serving as the link between management and function. Stand structure also constitutes a significant component of habitat complexity and plays a foundational role in the conservation of biodiversity [14]. The responses of understory plant diversity to climate change are strongly linked to stand structure heterogeneity. In fact, the climate directly impacts tree diversity, with different tree species exhibiting distinct morphological characteristics, such as maximum potential height, leaf arrangement, crown architecture, etc. Different sites have different tree species compositions, which form a differentiated forest stand structure. Stand structure directly affects light transmittance, water holding, and uptake [13]. Under similar climate regions, understory vegetation development may differ because of the stand structure [15]. The stand structure may also govern interspecies relationships through its affect on the availability of resources. Therefore, understanding the interplay between climate, stand structure, and plant diversity is crucial in predicting and managing the impacts of climate change on forest ecosystems [16]. Although the link between forest structure and biodiversity has been recognized for decades [17,18,19,20], the primary factors determining these direct and indirect processes and effect sizes remain unresolved [21].
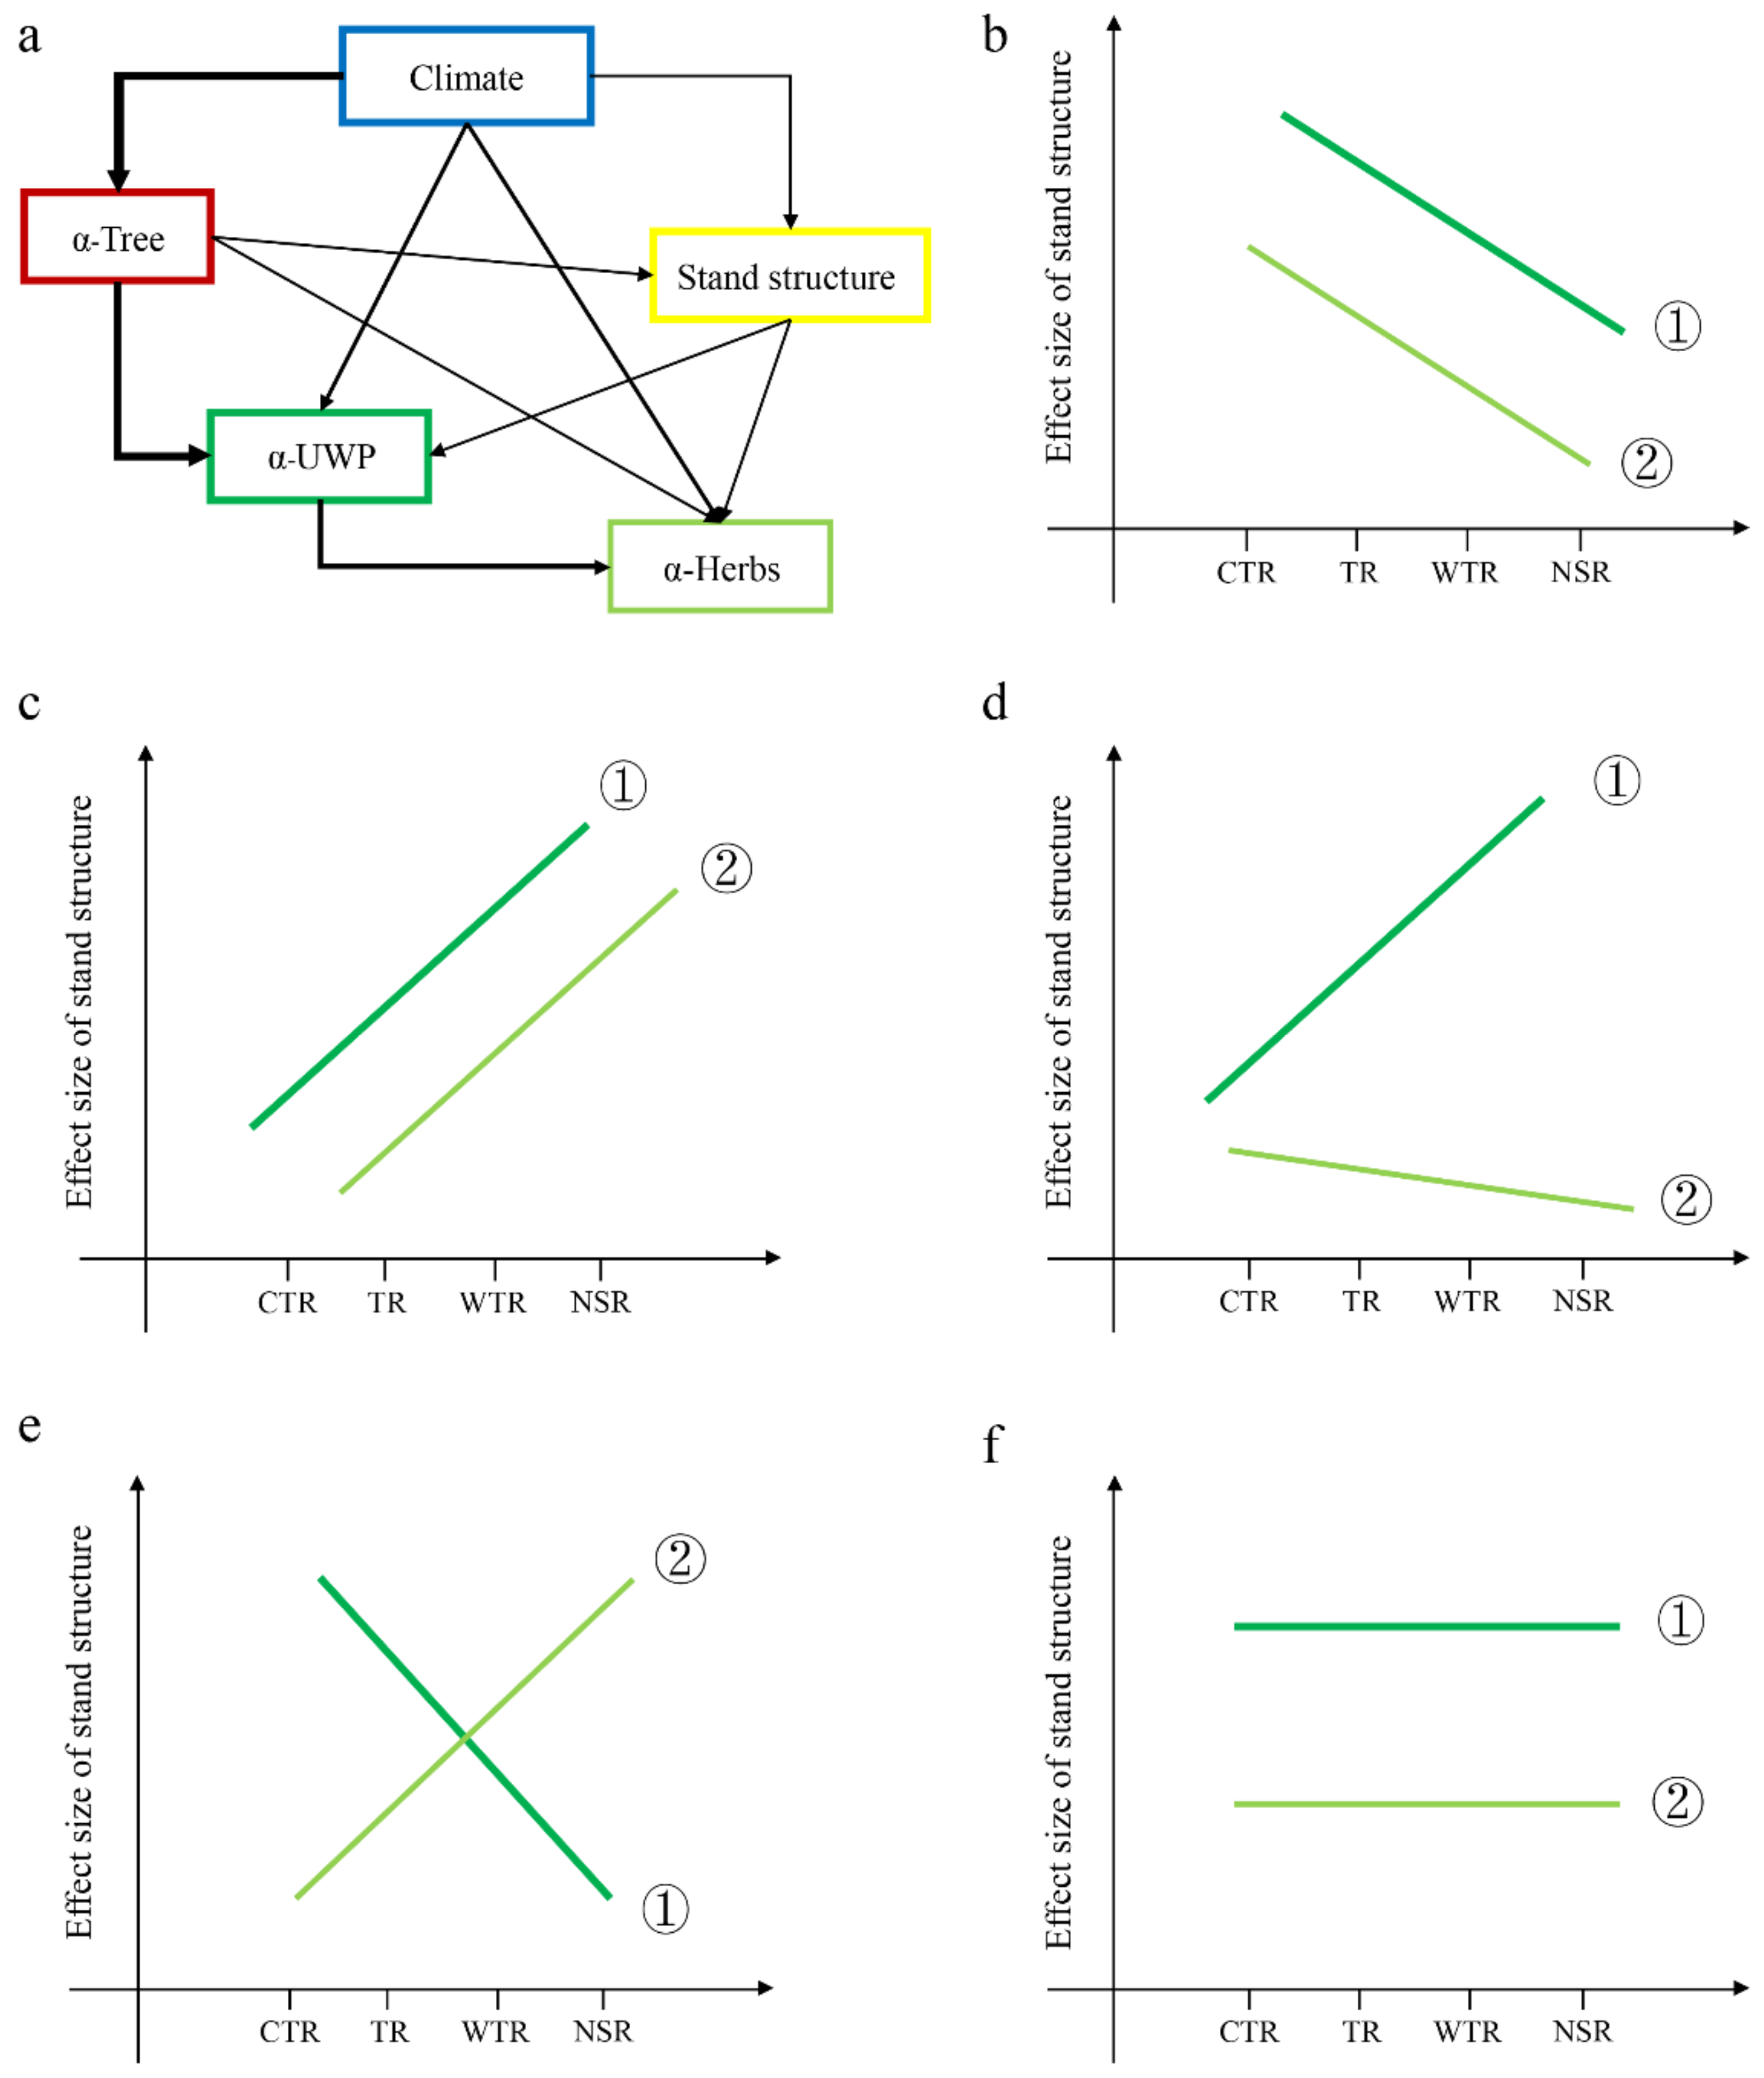
Here, we investigated the direct and indirect effects of climate, topography, and tree diversity on understory plant species diversity via stand structure. We also evaluated the effect sizes of the stand structures between temperate region stands—including the cold temperate region (CTR), temperate region (TR), warm temperate region (WTR), and northern subtropical region (NSR) stands—across China, where these climate zones represent the comprehensive effects of climate factors, and different climate regions represent climate gradients, wherein the thresholds of multiple climate variables are considered when delimiting climate zones (Table S1). In considering how the stand structure affects light transmittance, water holding, and uptake, it can be said that different climate zones show different stand structural complexities. We hypothesized that (1) climate has a direct and indirect effect on understory plant diversity (Figure 1a) and (2) the indirect effect size of climate on understory plant diversity via stand structure should vary in different climate zones. If climate weakens the indirect effects on understory plant diversity (Figure 1b,d,e), the effect size of stand structure on plant diversity will exhibit a different response in a different climate zone. We predicted that CTR stands would display a larger effect size of stand structure on understory plant diversity. Specifically, the CTR stand was expected to display a simpler structure, whereas the WTR stand was more likely expected to show a more complex structure and a lower effect size of stand structure on understory plant diversity. Conversely, if climate strengthens the positive effects of stand structure and understory plant diversity (Figure 1c), WTR stands were expected to have a higher effect size of stand structure on understory plant diversity. Finally, the stand structure effect on understory plant diversity also may remain unchanged with increasing climate zones (Figure 1f). WTR stands were expected to have the most complex stand structure, even though the stand structure effect value is not the highest for the WTR stand.
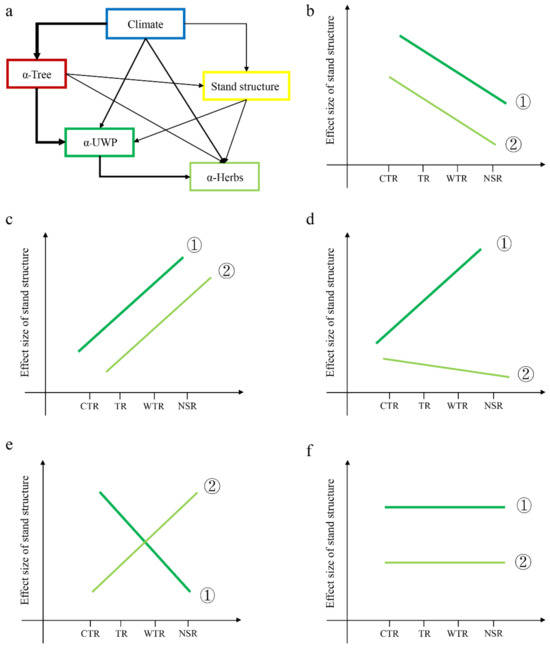
Figure 1.
Conceptual model of direct and indirect effects on understory plant diversity (a) and the relative contribution of climate and stand structure to plant diversity (b–f). α-Tree: tree diversity. α-UWP: understory woody plants diversity (includes tree regeneration (DBH < 3 cm), shrubs, and woody lianas). α-Herbs: all herbaceous vegetation diversity. CTR: cold temperature region. TR: temperature region. WTR: warm temperature region. NSR: northern subtropical region. The slopes of stand structure and the dependent variables (α-UWP and α-Herbs) in the multiple regression were quantified as the effect sizes. If the slope is >0, the contribution of stand structure becomes stronger with the change of climate zone from CTR to NSR; conversely, the contribution of stand structure becomes weaker with the change of climate zone from CTR to NSR. ① is the stand structure effect size for understory woody plants, and ② is the stand structure effect size for understory herbs. (b) The stand structure effect size for both understory woody plants and herbs gradually decreases with increasing climate gradients. (c) Conversely, the stand structure effect for both understory woody plants and herbs gradually strengthens. (d) The stand structure effect for understory herbs declines, while the stand structure effect for understory woody plants gradually increases. (e) The stand structure effect for understory woody plants weakens, while the stand structure effect for understory herbs gradually strengthens. (f) The stand structure effect for both understory woody plants and herbs remains unchanged with increasing climate change.
We tested these scenarios using a unique data set of forest communities in China’s temperate and subtropical region. First, we assessed whether climate had direct and indirect effects on understory plants. Second, we investigated the key driving factors regarding the direct and indirect effects of stand structure when they varied between understory plant lifeforms. More specifically, we evaluated whether climate indirect effects via stand structure would converge towards a similar effect size as the climate changed from a cold temperate region (CTR) to a warm temperate region (WTR), as well as whether the observed patterns would be different from those expected by chance. Finally, because understory woody plants and herbaceous plants belong to two different functional groups [22], we expected that the species diversity responses to different climate zones were likely to differ when considering the direct and indirect effects. Thus, we examined the last questions by comparing the patterns observed for understory woody and herbaceous plants (Figure 1b–f).
2. Material and Methods
2.1. Study Area and Data Collection
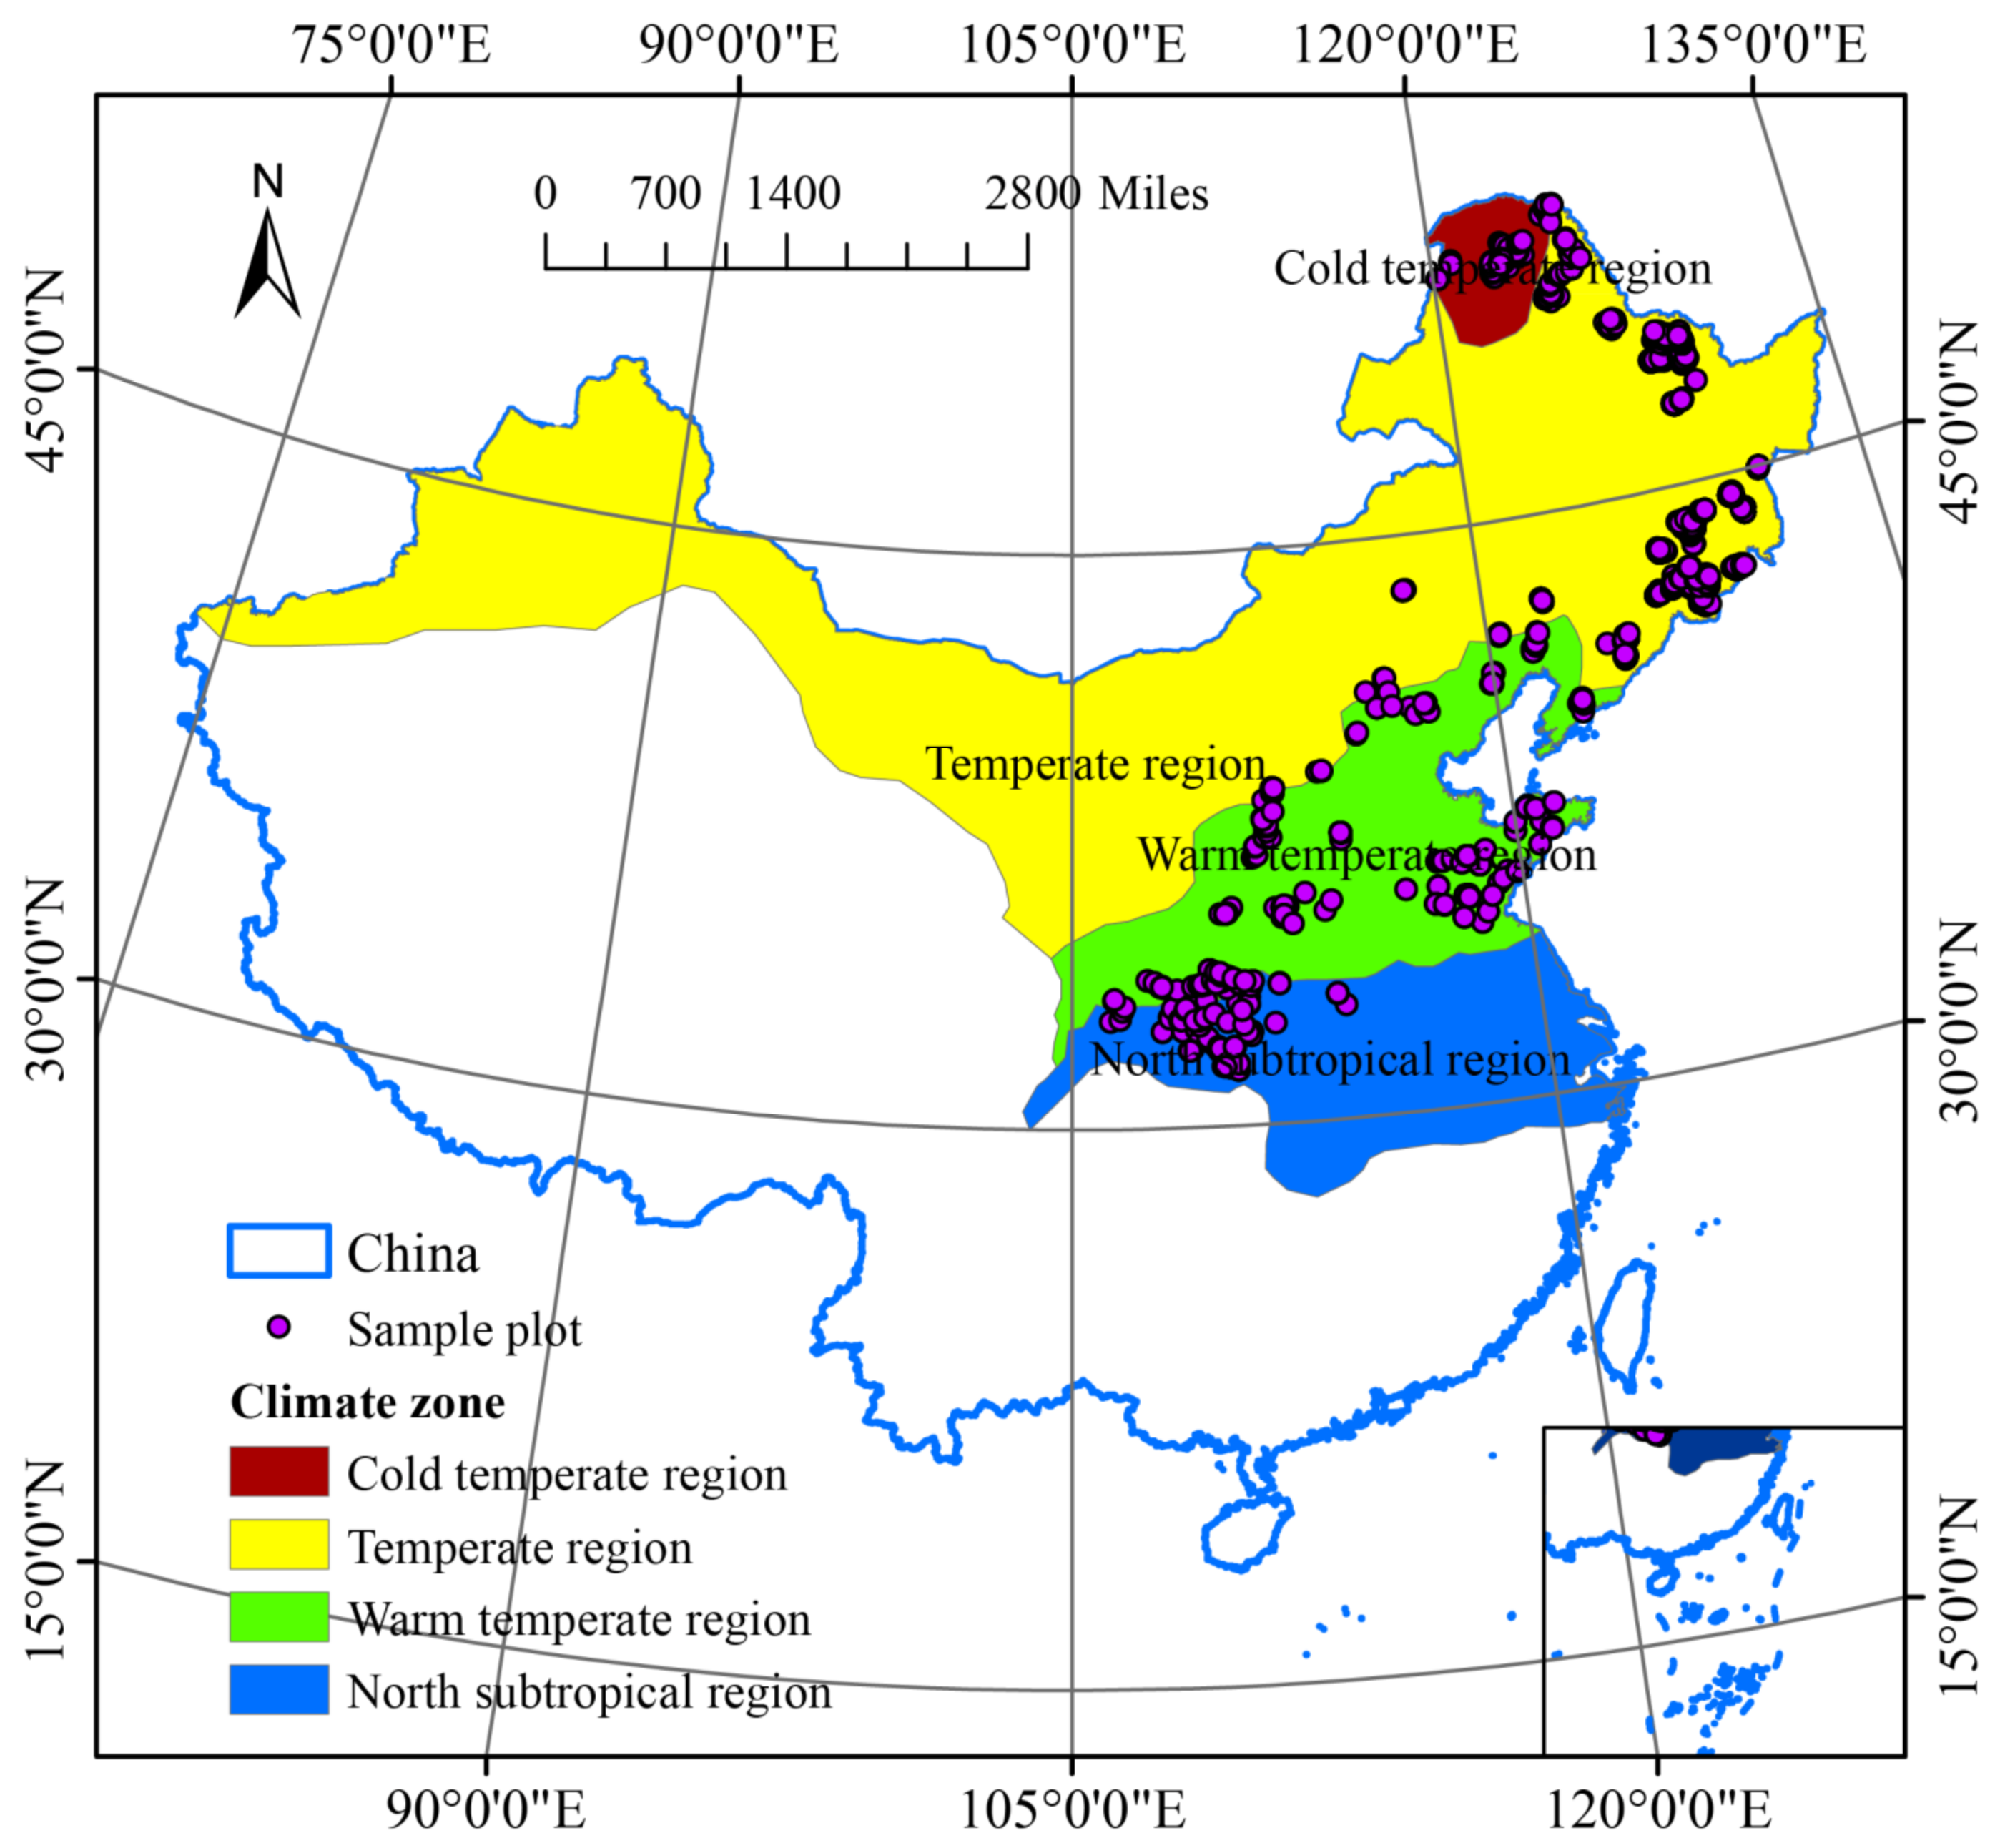
The study was conducted in northeast and north China, which are regions situated in the temperature and subtropical areas of China (Figure 2). They consist of the Heilongjiang, Jilin, Liaoning, Hebei, Beijing, Shanxi, Shaanxi, Shandong, Henan, Hubei, and Chongqing provinces, as well as the eastern part of the Inner Mongolia Autonomous Region. They include all the major forest types in temperate East Asia. For this study, we used publicly available data from the National Ecosystem Science Data Center via the National Science and Technology Infrastructure Program of China (http://www.nesdc.org.cn, accessed on 5 September 2019) and the National Earth System Science Data Center, also via the National Science and Technology Infrastructure Program of China (http://www.geodata.cn/, accessed on 21 January 2018). In the database, different types of forest plots were set up within different climate zones in China [23,24,25]; the sample plots span a latitude of 32.62–44.79 E and a longitude of 110.14–125.32 N. The data set was filtered using several criteria: (i) if data were missing for any measured values or variables, the plot was excluded; (ii) sample plots were excluded if they were imported and fell outside land boundaries; and (iii) the field survey rules were formulated according to LY/T3128-2019 (The Regulations for Classification, Survey, and Mapping of the Forest Vegetation through the Forestry Industry Standard of the People’s Republic of China). Each field plot was further filtered following three rules: (1) it should be in a natural vegetation site that is rarely disturbed; (2) it should be representative of the corresponding vegetation formation or subformation segment; and (3) it was included in the vegetation survey performed in 2014–2018. In total, 1272 plots met these criteria, including the cold temperate region (CTR, n = 157), temperate region (TR, n = 572), warm temperate region (WTR, n = 426), and northern subtropical region (NSR, n = 117). Climatic zones are divided according to Zheng et al. [26] and Yu et al. [27]; for climate variable thresholds in each climate zone, see Table S1.

Figure 2.
Study area and location of sample plots. Observation sites (purple dots) were located across China’s forest distribution area and monitored during the period 2014–2018. The background color indicates the climate zone: cold temperate region (CTR, n = 157), temperate region (TR, n = 572), warm temperate region (WTR, n = 426), and northern subtropical region (NSR, n = 117). Climatic zones are divided according to [26] and Yu et al. [27].
In this data set, vegetation surveys that were conducted during the periods of peak vegetation cover from July to October 2014–2018. The tree species, diameter at breast height (DBH) of all stems ≥ 3 cm, and height were recorded in 236 plots of 0.06 ha each, 863 plots of 0.09 ha each, 28 plots of 0.1 ha each, and 145 plots of 0.12 ha each (Table S2). In particular, understory woody and herbaceous vegetation quadrat sizes and numbers varied according to the size of the sample plot, and we summed species across all quadrats as the species in the plot. The understory woody plants (including tree regeneration DBH < 3 cm, as well as shrub and woody liana) were documented in two quadrats measuring 10 × 10 m, and they were set up in plot sizes of 0.06 and 0.1 ha, respectively. Additionally, ten quadrats of the same size were set up in a plot measuring 0.09 ha, while five quadrats of 10 × 10 m were established in a plot measuring 0.12 ha. The species, DBH, and height of each understory woody plant, hereafter referred to as ‘UWP,’ within each quadrat were recorded. The herbaceous vegetation, hereafter referred to as ‘herbs,’ were identified in five 1 × 1 m quadrats set up in plots measuring 0.06 and 0.1 ha, respectively. Additionally, ten 1 × 1 m quadrats were established in a plot measuring 0.09 ha, while five 2 × 2 m quadrats were set up in plots measuring 0.06 and 0.1 ha, respectively. The species, average height, coverage, and other relevant information of the herbs within each quadrat were examined (LY/T 3128–2019).
2.2. Climatic and Topography Variables
For each selected plot, we collected the following climate data (Table 1): mean annual temperature (MAT) and precipitation (MAP) (1980–2013), (1 km spatial resolution, available at Resource and Environment Science and Data Center https://www.resdc.cn/, accessed on 9 September 2022), photosynthetically active radiation (PAR) (1984–2010) (10 km spatial resolution), annual effective accumulated temperature > 10 °C (EAT) (1971–2000), mean annual January minimum temperature (T-min) (1971–2000) (1 km spatial resolution, available at National Ecosystem Science Data Center http://www.nesdc.org.cn), and actual evapotranspiration (AET) (2001–2010) (0.05° spatial resolution, available at National Earth System Science Data Center at http://www.geodata.cn/, accessed on 5 July 2023). Topographic data (Table 1), i.e., elevation, were accessed directly using a digital elevation model (DEM) (30 m spatial resolution, available at Geospatial Data Cloud at https://www.gscloud.cn/, accessed on 23 April 2023). Topography data were crucial, as they can influence meso- and microclimatic variations. Elevation was also used to calculate additional topographic variables, including slope, aspect, and topographic position index (TPI). The TPI represents the disparity between the elevation value of a specific point on the ground and the average elevation value of the surrounding points in its vicinity.

Table 1.
List of independent variables and the distributions of these variables.
2.3. Characterization of Tree Diversity and Stand Structure
Tree species diversity (hereafter α-Tree) was defined the number of tree species in each plot. In addition, we quantified seven stand structure variables, including stand density (SD), stand basal area (SBA, computed as the sum of basal area of all live trees within a site), mean DBH (m-DBH), tree size variation (CV DBH, measured by the coefficient of variation of tree DBH values within a site) [21], tree height variation (CV H, calculated by the coefficient of variation of tree heights within a site), and the stand structural complexity index (SSCI), which aimed to quantify the distribution of canopies in three-dimensional space (SSCI data were obtained from Ehbrecht et al. [28]; they are available online at https://zenodo.org/records/4295910, accessed on 2 December 2020). We also measured understory woody plants density (UWPD, individuals ha−1), which may be a potential influencing factor with respect to understory herbaceous vegetation diversity. These features were grouped by different spatial scales and calculated as the mean or sum for all individuals on the sample plot (Table 1).
Particularly, the α-Tree is associated with the alteration of resource composition (light, soil water, and nutrients) and an increase in microhabitat diversity [14]. Significant variations in light transmittance through the overstory can occur among different tree species, and water uptake by roots also varies depending on the species [10]. Tree diversity had stronger effects on functioning in forests with soils that had higher nutrient and water-holding capacities [29]. The SD is linked to canopy cover and can decrease light/radiation, thereby impacting understory vegetation niche diversity [30,31]. The SBA is closely associated with tree abundance, which negatively affects understory vegetation diversity. Mean DBH, serving as a proxy for stand age in natural forests, influences the chemical and structural properties of the soil, thus consequently affecting understory vegetation niche diversity [32]. CV DBH is expected to enhance niche diversity in the horizontal structure and can also influence the variation of stand microclimate. CV H is an essential attribute for estimating forest biomass [33] and can increase niche diversity for groups utilizing vertical space. SSCI is based on the shape complexity of cross-sectional polygons derived from 3D point clouds of the canopy, which is defined by the degree of heterogeneity in spatial patterns and the efficiency of canopy space occupation [13]. It is closely related to variations in understory light, air temperature, and soil water [10]. Finally, understory woody and herbaceous plant diversity are closely related through a series of interactions, such as allelopathic effects [15,34]. WPD may further the transmittance of light, water, and radiation to the understory woody plant.
2.4. Statistical Analysis
We employed a piecewise structural equation model (SEM) [35] based on linear mixed-effects model to evaluate the direct effects of climate on understory plant diversity and the indirect effects of altering the stand structure when considering climate zones as random effects. To make model coefficients comparable in SEM and multipredictor regressions, we standardized the response variables and all predictors using the z score (overall mean of 0 and SD of 1) before analyses [36]. We accounted for collinearity among environmental variables and stand structure using separate analyses (Figures S1, S3 and S4), and we removed variables that were highly correlated with other variables (Pearson r > 0.60) [12]. To assess correlations among variables or to synthesize correlated variables in uncorrelated principal components, we performed principal component analysis (PCA) (Figures S2 and S5) [21]. Hence, three climate variables (MAT, MAP, and PAR), four topography variables (DEM, slope, aspect, and TPI), five stand structure variables (SD, m-DBH, CV DBH, SSCI, and WPD), and tree diversity (α-Tree) were included in the SEM for predicting two understory plant diversities (α-UWP and α-Herbs) (Table 1. Response variables were summarized to the plot level for analysis. We then considered a number of alternative reduced models sharing the same causal structure as the initial model; models were constructed by eliminating nonsignificant variables one by one [21]. The decision to remove a path was based on the performance of the overall model fit and the p value for the path (p > 0.05). We used the Fisher’s C test to judge the goodness of fit of the modeling results. Model evaluation was determined by the following two criteria: (1) pathway significance (p < 0.05) (p > 0.05 for a satisfactory fit) and (2) the goodness of fit of the model (0 ≤ Fisher’s C/df ≤ 2 and 0.05 < p ≤ 1.00) [37,38,39]. The Bayesian information criterion also was used to select the best model from models with a satisfactory fit [40].
We analyzed differences in responses of understory woody and herbaceous plant diversity to stand structure. In order to evaluate the effect size of stand structure on understory vegetation in different climate zones, we used multiple regressions [41] to compare the relative effects of stand structure on understory plant diversity across 1272 sampling sites within different climate zones (CTR, TR, WTR, and NSR). Second, the slopes of stand structure and the dependent variables (α-UWP and α-Herbs) in the multiple regression were quantified as the effect sizes [42]. The analyses were carried out in the RStudio 4.3.3 (Rstudio Inc, Boston, MA, USA) environment (R Core Team, [43]). The SEM analysis was implemented using the ‘piecewiseSEM 2.1.0’ package [44], and the ‘nlme 3.1–162’ package [45]. All of these results were visualized with the ‘ggplot2’ package [46].
3. Results
3.1. Direct and Indirect Effects of CLimate on Understory Plant Diversity
Overall, across the entire study area, we detected direct effects of climate, topography and tree diversity on the understory woody and herbaceous plant diversity and indirect effects through the stand structure. Tree size variation (CV DBH) was the key driver for understory woody plants diversity, while the stand structural complexity index (SSCI) was more dominant for the understory herbaceous vegetation diversity than the CV DBH. Specifically, the understory woody plants diversity (α-UWP) was directly driven by the tree diversity (α-Tree), stem density (SD), and CV DBH rather than other structural features. Furthermore, the α-UWP was affected by the climate, topography, tree diversity, and stand structure via four paths as follows (Figure 3a): (1) the mean annual precipitation (MAP) and photosynthetically active radiation (PAR) positive influenced the α-UWP, while the DEM negatively influenced α-UWP; (2) the MAP positively influenced the α-Tree, while the mean annual temperature (MAT) and PAR negatively influenced the α-Tree; the MAT first negatively influenced the CV DBH, while the MAP positive influenced the CV DBH; the MAT and DEM first positively influenced the SD, while the MAP and PAR negatively influenced the SD; (3) the increase in the α-Tree further positively influenced the α-UWP, stand structure SD, and CV DBH; and (4) the increase in the SD and CV DBH further positively influenced the α-UWP.
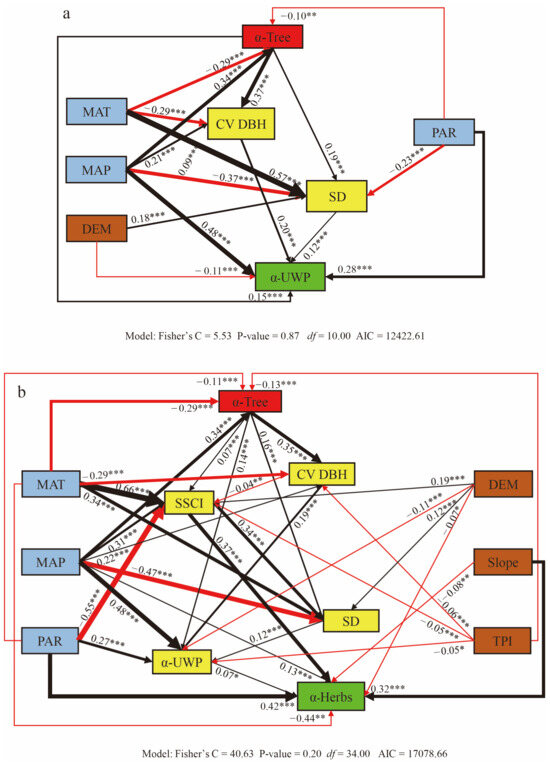
Figure 3.
Structural equation model illustrating the direct and indirect pathways of diversity (plant α diversity), climate (mean annual temperature (MAT), mean annual precipitation (MAP), and photosynthetically active radiation (PAR)), topography DEM (elevation), slope, TPI (topography position index), tree diversity (α-Tree), tree size variation (CV DBH), stem density (SD), and stand structure complexity index (SSCI) affecting understory woody plants (UWP) and herbs. The thickness of the line indicates the relative size of the value affecting the diversity of understory woody plants (α-UWP, (a)) and herbs (α-Herbs, (b)). The black line indicates that the path coefficient is positive, while the red line indicates that the path coefficient is negative. Numbers near the solid arrows indicate the standardized path coefficients with significance levels of p < 0.001 (***), p < 0.01 (**), and p < 0.05 (*).
The understory herbaceous diversity (α-Herbs) was affected by the climate, topography, tree diversity, and stand structure via five paths as follows (Figure 3b): (1) the MAP and PAR slopes directly positively influenced the herbs diversity (α-Herbs), while the MAT negatively influenced the α-Herbs; (2) the MAP and DEM first positively influenced the α-Tree, while the MAT, PAR, and TPI negatively influenced the α-Tree; the MAT, MAP, and DEM and first positively influenced the SSCI, while the PAR and TPI negatively influenced the SSCI; the MAP first positively influenced the CV DBH, while the MAT and TPI negatively influenced the CV DBH; the MAT and DEM first positively influenced the SD, while the MAP negatively influenced the SD; the MAP and PAR first increased the UWP, while the DEM and TPI negatively influenced the α-UWP; (3) the increase in the α-Tree further positively influenced the SSCI, CV DBH, SD, and α-UWP; (4) the enhancement to the SSCI further positively influenced the SD and α-Herbs, the enhancement to the CV DBH further increased the α-UWP; and (5) the enhancement to the SD further positively influenced the α-Herbs; as well, the enhancement to the α-UWP further positively influenced the α-Herbs. The model evaluation for the structural equation models (SEMs) across the forest plots is depicted in Figure 3. In the final model, all of the path coefficients were determined to be significant (p < 0.05).
3.2. Difference in Indirect Impact of Climate on Understory Plant Diversity
Across the temperate regions in China, we found that the effects of the stand structure on understory vegetation diversity differed in different climate zones (Figure 4). Moreover, our results showed that the effect of the SD on the α-UWP gradually increased, with the highest effect observed in the warm temperature region (WTR, effect size: 0.11) and the lowest in the cold temperature region (CTR, effect size: 0.20) (Figure 4a2). The effect of the SSCI on the α-Herbs also gradually increased, with the highest effect observed in the WTR (effect size: −0.001) and the lowest in the CTR (effect size: −0.23) (Figure 4a3). However, the effect of the CV DBH on the α-UWP did not show an obvious regularity in different climate zones (Figure 4a1). Finally, our study also found that the effect of the SD on the α-UWP, as well as the effect of the SSCI on the α-Herbs, changed significantly from the temperate regions to the subtropical region.
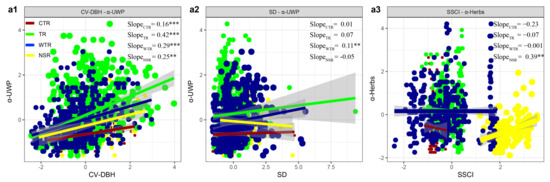
Figure 4.
Effect size of stand structure on understory woody plant diversity (a1,a2) and understory herbaceous plant diversity (a3) in different climatic regions; the slopes of the independent variables and the dependent variables in the multiple regression were quantified as the effect sizes, with point size indicating the effect size of the value. CTR: cold temperate region, TR: temperate region, WTR: warm temperate region, NSR: northern subtropical region. Statistical analysis was performed using t tests and least-squares regressions, with significance levels of p < 0.001 (***), p < 0.01 (**), p < 0.05 (*), and p < 0.1 (^).
4. Discussion
In contrast to the traditional perspective that climate plays a dominant role in driving plant diversity [7], our study provided extensive evidence that climate, topography, and tree diversity directly and indirectly influenced stand structure, rather than just directly influencing understory plant diversity. In addition, the response of the understory vegetation to stand structure was different. The understory woody plant diversity (α-UWP) was more affected by the coefficient of variation for the DBH (CV DBH) and stem density (SD), while the understory herbaceous diversity (α-Herbs) was more affected by the stand structure complexity index (SSCI). More importantly, the magnitude of these positive indirect effects varied with the changes in climatic zone. The SD effect on the α-UWP and the SSCI effects on the α-Herbs were enhanced, and this result improves our ability to predict the consequences of losses in multiscale stand structures across a range of contrasting environments. Overall, this study highlighted different management measures that need to be implemented in different climate zones and for different lifeforms for biodiversity enhancement.
4.1. Effects of Climate, Topography, and Tree Diversity on Understory Plant Diversity
Our results showed that the understory plant diversity was primarily directly driven by the climate, topography, and tree diversity, and it was indirectly driven by the stand structure. This result was particularly surprising, given the traditional predictions that the climate is one of the most important large-scale abiotic factors controlling the distributions of organisms and community structures across multiple spatiotemporal scales [7]. The results supported the finding that the stand structure has a substantial effect on the understory plant diversity, although other recent studies have mainly demonstrated this for small-scale beta diversity [47]. The findings are valid for boreal forests [48], temperate deciduous stands [49], mixed forests [50], and tropical forests [51]. This was also confirmed by the European-level study of Ampoorter et al. [52]. This result may be due to the fact that the stand structure varies according to the climate on a large scale, as well as according to microenvironmental heterogeneity and biotic factors, such as topography, on a small scale. Variations in precipitation and temperature create difference resource conditions [53,54,55] and differences in the size of regional species pools. Variations in elevation and other topography create fine-scale mosaics of resource heterogeneity, as well as differences in species composition and arrangement. Various tree species also contribute different heights, crown architectures, and structural complexities, which directly influence the ecological niches and microclimates in understory communities. Various tree species characteristics, such as differentiated leaf and other morphological characteristics, growth rate, and resource sensitivity, further contribute to the differences in stand structure. Finally, different stand structures may result in distinct microresource conditions (e.g., light, soil nutrients, soil moisture, and substrate diversity), which in turn can lead to different understory covers and diversity values [9,10]. Overall, our results suggest that large-scale climate variation plays multiple roles in understory plant diversity, thereby indirectly affecting understory vegetation diversity through the stand structure. Additionally, in our study, the weak effects of other stand structure variables and the strong effects of the coefficient of variation for the DBH (CV DBH), stem density (SD), and stand structure complexity index (SSCI) seemed to be explained by two aspects. On the one hand, the current work in temperate forests has shown the positive effect of the stand structure on understory plant diversities owing to different local site conditions such as light [56,57]. The stand structure variables CV DBH, SD, and SSCI all reflect the availability or heterogeneity of light and water in understory vegetation from different angles. On the other hand, other recent studies have shown that tree diversity positively affects structural complexity [58,59,60], which enhances the positive effect of tree diversity on understory plant diversity.
4.2. The Relative Role of Stand Structure in Understory Plant Diversity
Our results showed that the understory woody plant and herbaceous plant diversity values (α-UWP and α-Herbs) were affected by different stand structure variables. In particular, the SD and CV DBH enhanced the diversity of the understory woody plants, while the SSCI enhanced the diversity of the herbaceous vegetation. In addition, the diversity of the tree diversity directly or indirectly affected the diversity of the understory vegetation, while the understory woody plant diversity directly affected the diversity of the herbaceous vegetation. The understory woody plants and herbs showed distinct differences in their responses to the key driver of stand structure, which agreed with the results reported by Wang et al. [61]. This may reflect differences in the life history strategies and environments in which the two different understory plant types grow. Wang’s [62] research consistently showed that the CV DBH had a more significant impact on undergrowth woody plants. This reflects that woody plants are more sensitive to physical growth space. Compared to woody plants, herbs species were smaller, shorter in life span, and more tolerant of environmental requirements [62]. Forest stratification also may be affected by different construction mechanisms and ecological processes [63], and there may be differences in response to stand structure effects. A strong correlation was observed between the coverage of the understory plants and the canopy structure [64]. We speculate that a complex canopy structure (reflected by the SSCI in this paper) improved the efficiency of the gap light utilization in the lower forest layer [65,66], and this may have controlled the intensity and frequency of the solar radiation, as well as the spatial distribution of the precipitation, which affected the light and moisture heterogeneity (resource heterogeneity) of the understory herbs, as well as the diversity of the understory herbs. Compared to the SSCI, the SD reflects resource availability more than resource heterogeneity.
4.3. Variation in the Effect Size of Stand Structure on Understory Plannt Diversity in Different Climate Zones
Our findings demonstrate that the indirect effect of climate on understory plant diversity varies in magnitude across different climatic regions. Furthermore, our study revealed that the positive effects of the SD on the understory woody plant diversity, as well as the effect of the SSCI on understory herbs, were both enhanced. Several studies have shown that resources such as light and water are among of the most important drivers of understory vegetation [67,68,69], thereby influencing the patterns of total cover, as well as the abundance of individual species and the regional species pool [22]. The climate variation in the rate of evolution and biotically driven niche specialization described above was probably driven by climate effects [19]. When considering multiple factors together, the regional resource effectiveness (precipitation, temperature, and light) increased with the climate zones, with generally high levels of soil moisture and year-long growing seasons [70,71,72]. More specifically, the biological rates tended to increase with temperature through the effects of the temperature on the kinetics of the biochemical reactions underlying metabolism [22]. These interactions promote species specialization, niche differences [73], and species coexistence [74]. We acknowledge that the assertion that the climate enhances the impact of the stand structure on understory vegetation is limited to temperate regions. It is important to note that our study solely considered the variation in the stand structure effect along the climatic zone. Our research also only considered limited climate variables. Given that there are so many climate variables, and their interactions are complex, e.g., the mean annual temperature (MAT) being negatively correlated with the CV DBH while being positively correlated with the SD, as well as the mean annual precipitation (MAP) being positively correlated with the CV DBH while being negatively correlated with the SD in our SEMs. Therefore, we did not consider the impact of single climate variable effects on the stand structure, such as temperature or precipitation, nor the interactions of multiple climate factors, but we instead regarded the interactions of multiple climate factors as a climate zone. As the climate transitions from temperate to subtropical, the influence of the stand structure on the understory vegetation diversity undergoes a shift. Consequently, it is imperative to conduct additional research into the effects of climate change on the stand structure.
5. Conclusions and Management Implications
Our work is an important step forward in exploring the importance of the climate’s direct and indirect effects on understory plant diversity according to the stand structure, as well as the dependence of the stand structure on the climate gradient at a given temperate region. This study’s findings demonstrated that plant diversity was promoted by climate, topography, tree diversity and stand structure factors. On the other hand, the response of the understory vegetation to the stand structure varied among different lifeforms. Moreover, we showed that the climate could strengthen the effects of the stand structure on understory woody plants and herbs by increasing the tree diversity and causing biotic community heterogeneity. At different climate zone, the urgency of managing stand structure heterogeneity varies, and different forest management measures must be applied for different understory plant biodiversity conservation approaches. An increased number of tree species indirectly promotes more stand structure heterogeneity, which benefits understory plant diversity. This further emphasizes the importance of the establishment of mixed forests and plantation tree species structure conversion in terms of biodiversity conservation. Taken together, these findings highlight the urgency of maintaining stand structure heterogeneity to increase ecosystem function when setting broad guidelines for management. We also highlight that more conservation efforts should be made to prevent biotic community homogenization, especially in cold and temperate regions, which are necessary not only for local diversity loss, but also for the maintenance and restoration of ecosystem functioning when facing ongoing climate change.
Supplementary Materials
The following supporting information can be downloaded at: https://www.mdpi.com/article/10.3390/f14112138/s1, Table S1: Climate variable thresholds in each climate zone; Table S2. A comprehensive description of the survey sites for plant assessment; Figure S1: Bivariate relationships among climate variables for SEMs analyses; Figure S2: Principal component analysis (PCA) for three climate variables; Figure S3: Bivariate relationships among topography variables for SEMs analyses; Figure S4: Bivariate relationships among stand structure variables for SEMs analyses; Figure S5: Principal component analysis (PCA) for three climate variables.
Author Contributions
T.W.: writing, methodology, data curation, and software. L.D.: conceptualization, and supervision. Z.L.: conceptualization, funding acquisition, project administration, and supervision. All authors have read and agreed to the published version of the manuscript.
Funding
This study was supported by the National Key R&D Program of China [grant number 2022YFD2200502], the Northeast Forestry University 2022 Doctoral Candidate Independent Innovation Fund Project Program (2572022AW08), and the Fundamental Research Funds for the Central Universities of China [grant number 2572021DT07].
Data Availability Statement
Sample plot data are available at the National Ecosystem Science Data Center, the National Science and& Technology Infrastruc-ture of China, (http://www.nesdc.org.cn, accessed on 31 August 2019 and 5 September 2019), the National Earth System Science Data Center, the National Science and Technology Infrastructure of China (http://www.geodata.cn, accessed on 21 January 2018).
Acknowledgments
We acknowledge data support from the National Ecosystem Science Data Center, the National Science and Technology Infrastructure of China, (http://www.nesdc.org.cn, accessed on 5 September 2019), the National Earth System Science Data Center, the National Science and Technology Infrastructure of China (http://www.geodata.cn, accessed on 21 January 2018), and the Resource and Environment Science and Data Center (https://www.resdc.cn/, accessed on 9 September 2022). We thank Leonie Seabrook, from Liwen Bianji (Edanz) (http://www.liwenbianji.cn, accessed on 28 March 2023), for editing the English text of a draft of this manuscript.
Conflicts of Interest
The authors declare that they have no known competing financial interest or personal relationships that could have appeared to influence the work reported in this paper.
References
- Brooks, T.M.; Mittermeier, R.A.; Da Fonseca, G.A.; Gerlach, J.; Hoffmann, M.; Lamoreux, J.F.; Mittermeier, C.G.; Pilgrim, J.D.; Rodrigues, A.S.L. Global biodiversity conservation priorities. Science 2006, 313, 58–61. [Google Scholar] [CrossRef] [PubMed]
- Dasmann, R.F. A Different Kind of Country; Cambridge University Press: Cambridge, UK, 1968. [Google Scholar]
- Bauhus, J.; Aubin, I.; Messier, C.; Connell, M. Composition, structure, light attenuation and nutrient content of the understorey vegetation in a Eucalyptus sieberi regrowth stand 6 years after thinning and fertilization. For. Ecol. Manag. 2001, 144, 275–286. [Google Scholar] [CrossRef]
- Krebs, M.A.; Reeves, M.C.; Baggett, L.S. Predicting understory vegetation structure in selected western forests of the United States using FIA inventory data. For. Ecol. Manag. 2019, 448, 509–527. [Google Scholar] [CrossRef]
- Halpern, C.B.; Spies, T.A. Plant-species diversity in natural and managed forests of the Pacific-Northwest. Ecol. Appl. 1995, 5, 913–934. [Google Scholar] [CrossRef]
- Echiverri, L.; Macdonald, S.E. Utilizing a topographic moisture index to characterize understory vegetation patterns in the boreal forest. For. Ecol. Manag. 2019, 447, 35–52. [Google Scholar] [CrossRef]
- Zhang, Y.; Chen, H.Y.H.; Taylor, A.R. Multiple drivers of plant diversity in forest ecosystems. Glob. Ecol. Biogeogr. 2014, 23, 885–893. [Google Scholar] [CrossRef]
- Wu, A.C.; Deng, X.W.; Ren, X.L.; Xiang, W.H.; Zhang, L.; Ge, R.; Niu, Z.G.; He, H.L.; He, L. Biogeographic patterns and influencing factors of the species diversity of tree layer community in typical forest ecosystems in China. Acta Ecol. Sin. 2018, 38, 7727–7738. [Google Scholar]
- Hart, S.A.; Chen, H.Y.H. Understory vegetation dynamics of North American boreal forests. Crit. Rev. Plant Sci. 2006, 25, 381–397. [Google Scholar] [CrossRef]
- Stéphane, B.; Frédéric, G.; Balandier, P. Influence of tree species on understory vegetation diversity and mechanisms involved—A critical review for temperate and boreal forests. For. Ecol. Manag. 2008, 254, 1–15. [Google Scholar]
- Wright, S.J.; Kitajima, K.; Kraft, N.J.B.; Reich, P.B.; Wright, I.J.; Bunker, D.E.; Condit, R.; Daling, J.W.; Davies, S.J.; Diaz, S.; et al. Functional traits and the growth–mortality trade-off in tropical trees. Ecology 2010, 91, 3664–3674. [Google Scholar] [CrossRef] [PubMed]
- Myers, J.A.; Chase, J.M.; Jiménez, I.; Jørgensen, P.M.; Araujo-Murakami, A.; Paniagua-Zambrana, N.; Seidel, R. Beta-diversity in temperate and tropical forests reflects dissimilar mechanisms of community assembly. Ecol. Lett. 2013, 16, 151–157. [Google Scholar] [CrossRef] [PubMed]
- Ehbrecht, M.; Seidel, D.; Annighöfer, P.; Kreft, H.; Köhler, M.; Zemp, D.C.; Puettmann, K.; Nilus, R.; Babweteera, F.; Willm, K.; et al. Global patterns and climatic controls of forest structural complexity. Nat. Commun. 2021, 12, 519. [Google Scholar] [CrossRef] [PubMed]
- Penone, C.; Allan, E.; Soliveres, S.; Felipe-Lucia, M.R.; Gossner, M.M.; Seibold, S.; Simons, N.K.; Schall, P.; van der Plas, F.; Manning, P.; et al. Specialisation and diversity of multiple trophic groups are promoted by different forest features. Ecol. Lett. 2019, 22, 170–180. [Google Scholar] [CrossRef] [PubMed]
- Su, X.P.; Li, S.J.; Wan, X.H.; Huang, Z.Q.L.B.; Fu, S.L.; Kumar, P.; Chen, H.Y.H. Understory vegetation dynamics of Chinese fir plantations and natural secondary forests in subtropical China. For. Ecol. Manag. 2021, 483, 118750. [Google Scholar] [CrossRef]
- Fibich, P.; Novotný, V.; Ediriweera, S.; Gunatilleke, S.; Gunatilleke, N.; Molem, K.; Weiblen, G.D.; Lepš, J. Common spatial patterns of trees in various tropical forests: Small trees are associated with increased diversity at small spatial scales. Ecol. Evol. 2021, 11, 8085–8095. [Google Scholar] [CrossRef] [PubMed]
- Gaston, K. Global patterns in biodiversity. Nature 2000, 405, 220–227. [Google Scholar] [CrossRef] [PubMed]
- Brown, J.H. Why are there so many species in the tropics? J. Biogeogr. 2014, 41, 8–22. [Google Scholar] [CrossRef]
- Ricklefs, R.E.; He, F. Region effects influence local tree species diversity. Proc. Natl. Acad. Sci. USA 2016, 113, 674–679. [Google Scholar] [CrossRef] [PubMed]
- Bell, F.W.; Lamb, E.G.; Sharma, M.; Hunt, S.; Anand, M.; Dacosta, J.; Newmaster, S.G. Relative influence of climate, soils, and disturbance on plant species richness in northern temperate and boreal forests. For. Ecol. Manag. 2016, 381, 93–105. [Google Scholar] [CrossRef]
- Chu, C.; Lutz, J.A.; Král, K.; Vrška, T.; Yin, X.; Myers, J.A.; Abiem, I.; Alonso, A.; Bourg, N.; Burslem, D.F.R.P.; et al. Direct and indirect effects of climate on richness drive the latitudinal diversity gradient in forest trees. Ecol. Lett. 2019, 22, 245–255. [Google Scholar] [CrossRef] [PubMed]
- Zhang, X.H.; Zhang, B.Q.; Yao, Y.H.; Liu, J.J.; Wang, J.; Yu, F.Q.; Li, J.Y. Variation model of north-south plant species diversity in the Qinling-Daba Mountains in China. Glob. Ecol. Conserv. 2022, 38, e02190. [Google Scholar] [CrossRef]
- Liu, H.Y.; Tang, Z.Y.; Fang, J.Y.; Ji, C.Y.; Zheng, C.Y.; Jiang, Y.; Gao, X.M. North China, Forest Community Survey Quadrat Information, Arbor Layer, Shrub Layer, and Herb Layer Data. National Earth System Science Data Center, National Science and Technology Infrastructure of China. Available online: http://www.geodata.cn/ (accessed on 21 January 2018).
- Liu, F.; Jiang, M.X.; Jiang, Q.H. South-to-North Water Diversion (Middle Line) Water Source Forest Community Survey Data. National Ecosystem Science Data Center, National Science and Technology Infrastructure of China. Available online: http://www.nesdc.org.cn (accessed on 31 August 2019).
- Wang, L.H.; Cao, W.; Fan, C.N.; Wang, Q.G.; Wang, W.J.; Yu, J.H. Northeast Plant and Habitat Database-A Dataset of Plant Community Types in Northeast Forest Reserves. National Ecosystem Science Data Center, National Science and Technology Infrastructure of China 2019. Available online: http://www.nesdc.org.cn (accessed on 5 September 2019).
- Zheng, J.; Yin, Y.; Li, B. A new scheme for climate regionalization in China. Acta Geogr. Sin. 2010, 65, 3–12. (In Chinese) [Google Scholar]
- Yu, Z.; Liu, S.; Wang, J.; Wei, X.; Schuler, J.; Sun, P.; Harper, R.; Zegre, N. Natural forests exhibit higher carbon sequestration and lower water consumption than planted forests in China. Glob. Chang. Biol. 2019, 25, 68–77. [Google Scholar] [CrossRef] [PubMed]
- Ehbrecht, M.; Schall, P.; Ammer, C.; Seidel, D. Quantifying stand structural complexity and its relationship with forest management, tree species diversity and microclimate. Agric. For. Meteorol. 2017, 242, 1–9. [Google Scholar] [CrossRef]
- Ratcliffe, S.; Wirth, C.; Jucker, T.; van der Plas, F.; Scherer-Lorenzen, M.; Verheyen, K.; Eric, A.; Raquel, B.; Helge, B.; Bettina, O.; et al. Biodiversity and ecosystem functioning relations in European forests depend on environmental context. Ecol. Lett. 2017, 20, 1414–1426. [Google Scholar] [CrossRef] [PubMed]
- Zhang, Y.; Liu, T.; Guo, J.; Tan, Z.; Dong, W.; Wang, H. Changes in the understory diversity of secondary Pinus tabulaeformis forests are the result of stand density and soil properties. Glob. Ecol. Conserv. 2021, 28, e01628. [Google Scholar] [CrossRef]
- Jiang, Z.Y.; Qin, Y.H.; Liu, J.; Wen, Z.; Zheng, H.; Ouyang, Z.Y. Effects of altitude and stand density on understory plant diversity in tropical rainforests. Chin. J. Ecol. 2023, 42, 1049–1055. (In Chinese) [Google Scholar]
- Dupouey, J.L.; Dambrine, E.; Laffite, J.D.; Moares, C. Irreversible impact of past land use on forest soils and biodiversity. Ecology 2002, 83, 2978–2984. [Google Scholar] [CrossRef]
- Liu, X.Q.; Su, Y.J.; Hu, T.Y.; Yang, Q.L.; Liu, B.B.; Deng, Y.F.; Tang, H.; Tan, Z.Y.; Fang, J.Y.; Guo, Q.H. Neural network guided interpolation for mapping canopy height of China’s forests by integrating GEDI and ICESat-2 data. Remote Sens. Environ. 2022, 269, 112844. [Google Scholar] [CrossRef]
- Kumar, P.; Chen, H.Y.H.; Thomas, S.C.; Shahi, C. Linking resource availability and heterogeneity to understorey species diversity through succession in boreal forest of Canada. J. Ecol. 2018, 106, 1266–1276. [Google Scholar] [CrossRef]
- Shipley, B. A new inferential test for path models based on directed acyclic graphs. Struct. Equ. Model. 2000, 7, 206–218. [Google Scholar] [CrossRef]
- Schielzeth, H. Simple means to improve the interpretability of regression coefficients. Methods Ecol. Evol. 2010, 1, 103–113. [Google Scholar] [CrossRef]
- Huang, M.J.; Liu, X.; Zhou, S.R. Asynchrony among species and functional groups and temporal stability under perturbations: Patterns and consequences. J. Ecol. 2020, 108, 2038–2046. [Google Scholar] [CrossRef]
- Tian, P.; Liu, S.G.; Zhao, X.C.; Sun, Z.L.; Yao, X.; Niu, S.L.W.; Crowther, T.; Wang, Q.K. Past climate conditions predict the influence of nitrogen enrichment on the temperature sensitivity of soil respiration. Commun. Earth Environ. 2021, 2, 251. [Google Scholar] [CrossRef]
- Garrido, M.; Hansen, S.K.; Yaari, R.; Hawlena, H. A model selection approach to structural equation modelling: A critical evaluation and a road map for ecologists. Methods Ecol. Evol. 2022, 13, 42–53. [Google Scholar] [CrossRef]
- Wang, H.; Ding, Y.; Zhang, Y.; Wang, J.; Freedman, Z.B.; Liu, P.; Cong, W.; Wang, J.; Zang, R.; Liu, S. Evenness of soil organic carbon chemical components changes with tree species richness, composition and functional diversity across forests in China. Glob. Change Biol. 2023, 29, 2852–2864. [Google Scholar] [CrossRef] [PubMed]
- Teets, A.; Fraver, S.; Weiskittel, A.R.; Hollinger, D.Y. Quantifying climate–growth relationships at the stand level in a mature mixed-species conifer forest. Glob. Change Biol. 2018, 24, 3587–3602. [Google Scholar] [CrossRef] [PubMed]
- Zhang, R.; Tian, D.; Wang, J.; Pan, J.; Zhu, J.; Li, Y.; Yan, Y.; Song, L.; Wang, S.; Chen, C.; et al. Dryness weakens the positive effects of plant and fungal β diversities on above- and belowground biomass. Glob. Chang. Biol. 2022, 28, 6629–6639. [Google Scholar] [CrossRef]
- R Core Team. R: A Language and Environment for Statistical Computing; R Development Core Team: Auckland, New Zealand, 2022. [Google Scholar]
- Lefcheck, J.S. piecewiseSEM: Piecewise structural equation modelling in r for ecology, evolution, and systematics. Methods Ecol. Evol. 2016, 7, 573–579. [Google Scholar] [CrossRef]
- Pinheiro, J.; Bates, D.; DebRoy, S.; Sarkar, D.; R Core Team. Nlme: Linear and nonlinear mixed effects models. R Package Version 2021, 3, 1–89. [Google Scholar]
- Wickham, H. ggplot2: Elegant Graphics for Data Analysis; Springer: Berlin/Heidelberg, Germany, 2016. [Google Scholar]
- Min, Y.; Osbert, J.S. Effects of forest patch type and site on grass-layer vegetation in a temperate forest ecosystem. For. Ecol. Manag. 2013, 300, 14–20. [Google Scholar]
- Jokela, J.; Juutilainen, K.; Korpela, L.; Kouki, J.; Kuntsi, S.; Koivula, M.; Siitonen, J. Cross-taxon congruence and relationships to stand characteristics of vascular plants, bryophytes, polyporous fungi and beetles in mature managed boreal forests. Ecol. Indic. 2018, 85, 137–145. [Google Scholar] [CrossRef]
- Blasi, C.; Marchetti, M.; Chiavetta, U.; Aleffi, M.; Audisio, P.; Azzella, M.M.; Brunialti, G.; Capotorti, G.; Vico, E.D.; Lattanz, E.; et al. Multi-taxon and forest structure sampling for identification of indicators and monitoring of old-growth forest. Plant Biosyst. 2010, 144, 160–170. [Google Scholar] [CrossRef]
- Tinya, F.; Kovács, B.; Bidló, A.; Dima, B.; Király, I.; Kutszegi, G.; Lakatos, F.; Mag, Z.; Márialigeti, S.; Nascimbene, J.; et al. Environmental drivers of forest biodiversity in temperate mixed forests–A multi-taxon approach. Sci. Total Environ. 2021, 15, 795:148720. [Google Scholar] [CrossRef] [PubMed]
- Poulsen, J.R.; Koerner, S.E.; Miao, Z.; Medjibe, V.P.; Banak, L.N.; White, L.J.T. Forest structure determines the abundance and distribution of large lianas in Gabon. Glob. Ecol. Biogeogr. 2017, 26, 472–485. [Google Scholar] [CrossRef]
- Ampoorter, E.; Barbaro, L.; Jactel, H.; Baeten, L.; Boberg, J.; Carnol, M.; Castagneyrol, B.; Charbonnier, Y.; Dawud, S.M.; Deconchat, M.; et al. Tree diversity is key for promoting the diversity and abundance of forest-associated taxa in Europe. Oikos 2020, 129, 133–146. [Google Scholar] [CrossRef]
- Knapp, A.K.; Smith, M.D. Variation among biomes in temporal dynamics of aboveground primary production. Science 2001, 291, 481–484. [Google Scholar] [CrossRef]
- Dobrowski, S.Z.; Abatzoglou, J.; Swanson, A.K.; Greenberg, J.A.; Mynsberge, A.R.; Holden, Z.A.; Schwartz, M.K. The climate velocity of the contiguous United States during the 20th century. Glob. Chang. Biol. 2013, 19, 241–251. [Google Scholar] [CrossRef]
- Kane, V.R.; Bartl-Geller, B.N.; North, M.P.; Kane, J.T.; Lydersen, J.M.; Jeronimo, S.M.A.; Collins, B.M.; Monika Moskal, L. First-entry wildfires can create opening and tree clump patterns characteristic of resilient forests. For. Ecol. Manag. 2019, 454, 117659. [Google Scholar] [CrossRef]
- Marlyse, C.D.; Mark, S.A. A meta-analysis of the effect of forest management for timber on understory plant species diversity in temperate forests. For. Ecol. Manag. 2013, 303, 81–90. [Google Scholar]
- Janssen, P.; Fuhr, M.; Bouget, C. Small variations in climate and soil conditions may have greater influence on multitaxon species occurrences than past and present human activities in temperate mountain forests. Divers. Distrib. 2018, 24, 579–592. [Google Scholar] [CrossRef]
- Alex, T.F.; Timothy, H.M.; Robert, T.F.; Brady, S.H.; Gil, B.; Peter, S. Curtis. Forest structure in space and time: Biotic and abiotic determinants of canopy complexity and their effects on net primary productivity. Agric. For. Meteorol. 2018, 250, 181–191. [Google Scholar]
- Zemp, D.C.; Ehbrecht, M.; Seidel, D.; Ammer, C.; Craven, D.; Erkelenz, J.; Irawan, B.; Sundawati, L.; Hölscher, D.; Kreft, H. Mixed-species tree plantings enhance structural complexity in oil palm plantations. Agric. Ecosyst. Environ. 2019, 283, 106564. [Google Scholar] [CrossRef]
- Juchheim, J.; Ehbrecht, M.; Schall, P.; Ammer, C.; Seidel, D. Effect of tree species mixing on stand structural complexity. Forestry 2020, 93, 75–83. [Google Scholar] [CrossRef]
- Wang, Q.G.; Guo, Q.; Chi, X.L.; Zhu, S.Q.; Tang, Z.Y. Evolutionary history and climate conditions constrain the flower colours of woody plants in China. J. Plant Ecol. 2022, 15, 196–207. [Google Scholar] [CrossRef]
- Wang, X. The Roles of Forest Vertical Structure and Large-Diameter Trees on Plant Diversity Along Elevational Gradients. Ph.D. Thesis, East China Normal University, Shanghai, China, 2022. [Google Scholar]
- Luo, Y.H.; Cadotte, M.W.; Burgess, K.S.; Liu, J.; Tan, S.L.; Xu, K.; Li, D.Z. Forest community assembly is driven by different strata-dependent mechanisms along an elevational gradient. J. Biogeogr. 2019, 46, 2174–2187. [Google Scholar] [CrossRef]
- Kembel, S.W.; Dale, M.R.T. Within-stand spatial structure and relation of boreal canopy and understorey vegetation. J. Veg. Sci. 2006, 17, 783–790. [Google Scholar]
- Fahey, R.T.; Fotis, A.T.; Woods, K.D. Quantifying canopy complexity and effects on productivity and resilience in late-successional hemlock-hardwood forests. Ecol. Appl. 2015, 25, 834–847. [Google Scholar] [CrossRef]
- Sun, C.; Li, L.; Dong, X.; Qin, F.; Yang, Z. Variations and Factors Characterizing Ecological Niches of Understory Grassaceous Species in Plantation Forests. Sustainability 2022, 14, 10719. [Google Scholar] [CrossRef]
- Hedwall, P.-O.; Brunet, J.; Nordin, A.; Bergh, J. Changes in the abundance of keystone forest floor species in response to changes in forest structure. J. Veg. Sci. 2013, 24, 296–306. [Google Scholar] [CrossRef]
- Tinya, F.; Ódor, P. Congruence of the spatial pattern of light and understory vegetation in an old-growth, temperate mixed forest. For. Ecol. Manag. 2016, 381, 84–92. [Google Scholar] [CrossRef]
- Petersson, L.; Holmström, E.; Lindbladh, M.; Felton, A.; Sveriges, L. Tree species impact on understory vegetation: Vascular plant communities of Scots pine and Norway spruce managed stands in northern Europe. For. Ecol. Manag. 2019, 448, 330–345. [Google Scholar] [CrossRef]
- Malhi, Y.; Silman, M.; Salinas, N.; Bush, M.; Meir, P.; Saatchi, S. Introduction: Elevation gradients in the tropics: Laboratories for ecosystem ecology and global change research. Glob. Chang. Biol. 2010, 16, 3171–3175. [Google Scholar] [CrossRef]
- Sundqvist, M.K.; Sanders, N.J.; Wardle, D.A. Community and ecosystem responses to elevational gradients: Processes, mechanisms, and insights for global change. Annu. Rev. Ecol. Evol. Syst. 2013, 44, 261–280. [Google Scholar] [CrossRef]
- Fyllas, N.M.; Bentley, L.P.; Shenkin, A.; Asner, G.P.; Atkin, O.K.; Díaz, S.; Enquist, B.J.; Farfan-Rios, W.; Gloor, E.; Guerrieri, R.; et al. Solar radiation and functional traits explain the decline of forest primary productivity along a tropical elevation gradient. Ecol. Lett. 2017, 20, 730–740. [Google Scholar] [CrossRef] [PubMed]
- Harpole, W.S.; Sullivan, L.L.; Lind, E.M.; Firn, J.; Adler, P.B.; Borer, E.T.; Chase, J.; Fay, P.A.; Hautier, Y.; Hillebrand, H.; et al. Addition of multiple limiting resources reduces grassland diversity. Nature 2016, 537, 93–96. [Google Scholar] [CrossRef] [PubMed]
- Díaz, S.; Cabido, M. Vive la différence: Plant functional diversity matters to ecosystem processes. Trends Ecol. Evol. 2001, 16, 646–655. [Google Scholar] [CrossRef]


Disclaimer/Publisher’s Note: The statements, opinions and data contained in all publications are solely those of the individual author(s) and contributor(s) and not of MDPI and/or the editor(s). MDPI and/or the editor(s) disclaim responsibility for any injury to people or property resulting from any ideas, methods, instructions or products referred to in the content. |
© 2023 by the authors. Licensee MDPI, Basel, Switzerland. This article is an open access article distributed under the terms and conditions of the Creative Commons Attribution (CC BY) license (https://creativecommons.org/licenses/by/4.0/).