Article

Stronger Cumulative than Lagged Effects of Drought on Vegetation in Central Asia

1
College of Geography and Remote Sensing Science, Xinjiang University, Urumqi 830046, China
2
Xinjiang Key Laboratory of Oasis Ecology, Xinjiang University, Urumqi 830046, China
3
Key Laboratory of Smart City and Environment Modelling of Higher Education Institute, Xinjiang University, Urumqi 830046, China
*
Author to whom correspondence should be addressed.
Forests 2023, 14(11), 2142; https://doi.org/10.3390/f14112142
Submission received: 23 September 2023 / Revised: 21 October 2023 / Accepted: 25 October 2023 / Published: 27 October 2023
(This article belongs to the Section Forest Meteorology and Climate Change)

Abstract

:
In the context of global warming, the strength and frequency of drought events are projected to grow in the future, and the onset of drought can have dramatic effects on vegetation growth in terrestrial ecosystems. Central Asia is the largest non-territorial drought area in the world, and the response of vegetation to drought events is extremely sensitive in the area. However, few studies have quantified and compared the vegetation gross primary productivity (GPP) response to the lagged and cumulative effects of drought. In this research, the solar-induced chlorophyll fluorescence GPP and Standardized Precipitation Evaporation Index (SPEI) were used to analyze the time and space patterns of vegetation GPP and the SPEI in Central Asia and to quantify and compare the lagged and cumulative effects of drought on the GPP of various vegetation types. During the period from 2000 to 2018, the general trends of vegetation GPP showed a slight increase in Central Asia, with the ratio of variation being 1.35 g C m−2 y−1 and a spatially decreasing distribution from north to south. SPEI showed a trend of decreasing and then increasing over a period of 19 years, with a slight decreasing (drying) trend and a rate of change of −0.02 y−1, and the overall spatial pattern was drying out from north to south. In 13 months, 72.44% of regional droughts had lagged impacts on vegetation. The maximum correlation coefficients of vegetation and the lagged effectiveness of drought were concentrated in the range of 0.15–0.35, and the high correlation was distributed in southern and northwestern Kazakhstan, which are prairie regions. Of the regions in Central Asia, 75.86% showed cumulative drought effects concentrated at 9–12 months. The maximum correlation coefficients were concentrated in the range of 0.20–0.50, and the high correlation regions were primarily situated in south Kazakhstan and east Uzbekistan. Comparing the correlation coefficients of the lagged effect of vegetation GPP and SPEI with the cumulative effect shows that the cumulative rather than lagged impacts of drought on vegetation cover were found in 86.75% of the regions in Central Asia. This research enhances our comprehension of the influence of drought events on ecosystems in arid regions and has a certain reference value for helping arid region ecosystems to cope with global climate change.

1. Introduction

Vegetation is an integral element of land ecosystems and has a major role in global carbon cycling, energy exchange, geochemistry, and the restoration of surface ecosystems [1]. It can also provide a record of hydrological climate change [2]. Drought is one of the major limiting factors for terrestrial ecosystems, with significant ecological and human amenity impacts [3]. An important feature of drought is low soil water use efficiency, which is usually caused by reduced rainfall and increased evapotranspiration [4]. The future strength and frequency of global drought and heat events are expected to rise [5,6,7], and within the context of heating, a plant’s survival depends on its ability to tolerate drought [8]. Drought intensification can pose a serious threat to vegetation productivity [9], causing systematic and abrupt changes in ecosystem structure and function [10], especially in moisture-scarce arid regions [11,12]. Therefore, understanding the process of vegetation responses to drought events can help illuminate the mechanisms by which terrestrial ecosystems respond to future climate variability and suggest effective measures for ecosystem conservation [13,14,15].
Many studies have analyzed the mechanism by which drought impacts vegetation, but the majority of these have concentrated on the current month to determine the time at which drought events occurred, neglecting the fact that prior drought also has an impact on current vegetation development [16,17,18]. Previous research has found that drought has a lagged effect on vegetation development [19,20,21,22], which refers to early drought events having a certain impact on the present vegetation growth; for example, vegetation growth is more sensitive to drought at specific earlier time points than at current time points [23,24,25]. However, the drought effect on vegetation lag has reached inconsistent conclusions in different regional studies, and relatively few research in arid areas where drought events are frequent have been conducted. Thus, studying the lagged effect of drought can offer a scientific foundation for local eco-environmental protection in arid areas.
In assessing the responses of vegetation to drought, drought duration is an essential aspect of the response of vegetated ecosystems; therefore, the cumulative drought effect cannot be ignored [26,27,28]. Cumulative drought effects consider drought conditions in the previous consecutive time period based on a lagged effect, which means that the currently developing vegetation has been affected by the cumulative effect of drought in the past few months [29,30,31]; for example, the accumulation of drought can have a doubling effect on vegetation density and leaf abundance [32]. The cumulative effect of drought can be used to more fully comprehend the responses of vegetation to drought [33,34]. The majority of previous studies only considered a single cumulative drought effect and drought-lagged effect, and they have rarely synthesized lagged effects in comparison to cumulative effects [32,35,36]. Therefore, this study compared lagged and cumulative effects of drought on vegetation and determined which drought effect had a greater impact on vegetation cover.
Gross primary productivity (GPP) of terrestrial ecosystems is the total amount of carbon fixed by terrestrial vegetation ecosystems through vegetation photosynthesis and is a fundamental component of the global carbon cycle [37,38]. Recently, an increasing number of studies have used GPP to assess vegetation productivity [39,40,41]. The results of these evaluations vary for each product. For example, the MODIS GPP shows a high correlation with flux tower GPP in terms of vegetation types, but it underestimates GPP for eight vegetation types, whereas the solar-induced chlorophyll fluorescence (SIF) dataset’s GOSIF data show higher accuracy in estimating single-tower GPP and the seasonal cycle of GOSIF is consistent with flux tower GPP. The GOSIF dataset demonstrated better performance than MODIS GPP in evaluating GPP [42]. In addition, the SIF GPP captures changes in photosynthesis induced by hydrothermal stress better than the vegetation index, especially compared to GOME-2 SIF, and the finer spatial and temporal resolution of the GOSIF data allows for good monitoring of the crop’s drought response [43]. Therefore, GOSIF GPP data were selected in this study to analyze the space and time changes in vegetation.
Numerous outstanding drought indices have been developed and commercialized for drought surveillance, including the Standardized Precipitation Index (SPI), the Reclamation Drought Index (RDI), the Drought Severity Index (DSI), the Standardized Drought Index (SDI), and the Standardized Precipitation Evapotranspiration Index (SPEI), etc. [44,45,46,47,48]. However, only the SPEI and SPI are commonly utilized for drought expression on multiple time scales [49,50,51]. Compared to the SPI, the SPEI considers the key contribution of temperature change in drought monitoring and is inferred from precipitation and temperatures in the formalism of water balance [52]. Therefore, the SPEI was chosen to represent drought conditions in this study.
There has never been a unique standard for the demarcation of the borders of Central Asia [53,54]. Since Xinjiang, China, shares similar climatic characteristics with the five Central Asian countries, Kazakhstan, Kyrgyzstan, Tajikistan, Uzbekistan, and Turkmenistan, they are collectively referred to as Central Asia in this study [55,56]. Central Asia is the biggest non-territorial drought area in the world, with temperatures rising higher than the global mean, a lack and uneven distribution of water resources, an extremely vulnerable ecological environment, and an extremely sensitive response to climate change [57,58,59]. Systematic evaluation of the lagged and cumulative effects of drought on vegetation GPP can contribute vital references for alleviating the impacts of drought on vegetation productivity in Central Asia. The objectives of this study were to (1) analyze the time and space patterns of vegetation GPP and the SPEI in Central Asia, (2) characterize the spatial and temporal responses of vegetation GPP to drought-lagged and cumulative effects in Central Asia, and (3) determine whether the main impacts of drought on vegetation are lagged or cumulative effects. In this study, the correlation coefficients of GPP and the SPEI were used as an essential parameter to analyze the response of vegetation GPP to drought between 2000 and 2018 in Central Asia.

2. Materials and Methods

2.1. Study Area

Central Asia is a transportation hub through Asia and Europe due to its location in the hinterland of the continent and includes Kazakhstan (KAZ), Kyrgyzstan (KGZ), Tajikistan (TJK), Uzbekistan (UZB), Turkmenistan (TKM), and the Xinjiang region of China (CHN_XJ) (Figure 1) [60]. Central Asia is one of the world’s most arid areas, with high relief in the southeast and low relief in the northwest, mainly consisting of hills and plains. The ecosystem types in this region mainly include grasslands, shrubs, oases, mountains, and deserts, and the response to global climate change is characterized by specificity and complexity [61]. The altitudes of the desert and oasis zones in the west range from about 200 to 400 m. The altitude of the hills and grassland distribution areas in the north-central part ranges from about 300 to 500 m, and the altitude of the mountainous areas in the east is mostly above 1000 m. The wet and warm air from the Indian and Pacific Oceans can be obstructed by the high mountains on the southeastern fringe of the region. The climate of the region is a typical temperate desert and grassland continental climate, with little precipitation and drastic temperature changes, strong solar radiation, high temperatures and high evapotranspiration in the interior of the continent.

2.2. Data Sources

All the data and data information used in this study are shown in Table 1.

2.2.1. GPP Data

SIF has been utilized as an indicator of photosynthesis in terrarium vegetation worldwide [62,63], and it has advantages over traditional vegetation indices in monitoring vegetation (e.g., the Enhanced Vegetation Index (EVI)) [64]. Studies have shown that SIF and GPP have a strong linear relationship [65]. Therefore, SIF can predict GPP well [66]. The GOSIF GPP dataset, which was created using the linear relationship between GPP and GOSIF, is a more refined SIF product based on the Orbiting Carbon Observatory-2 (OCO-2) derivation [67]. Many studies have successfully applied the GOSIF GPP to characterize space and time changes in vegetation productivity and have shown great potential for monitoring vegetation responses to climate [43,68,69]. In this study, monthly GOSIF GPP data, which have a spatial resolution of 0.05°, for the vegetation growing seasons (March to October in Central Asia) in the period 2000 to 2018 were used to analyze the effects of drought on vegetation GPP (https://globalecology.unh.edu/ (accessed on 22 March 2022)).

2.2.2. SPEI Data

In this research, drought intensity and duration were estimated using SPEI based on the climate water balance [51]. Global drought conditions were obtained from the global SPEI database SPEI base v2.6 (https://spei.csic.es/database.html (accessed on 22 March 2022)), a dataset with a cumulative time span of 1–48 months. An SPEI > 0 indicates sufficient moisture, while an SPEI < 0 indicates insufficient moisture. In addition, the dataset had multi-scale characteristics. The n-month SPEI provides flexibility in reflecting drought at diverse time scales, and it is the accumulated climate water balance for the prior n months (inclusive of the present month) [70]. In contrast to the SPI, the SPEI considers not only precipitation but also the role of temperature and thus can more accurately represent the sensitivity of drought to global warming [51]. The SPEI has been demonstrated to be effective in assessing drought and vegetation growth [41,71,72]. In this study, we chose SPEI data for 1–12 months from 2000 to 2018 and resampled the SPEI data from a spatial resolution of 0.5° to 0.05° to match the time and space resolution of the GPP data.

2.2.3. Vegetation Type Data

The Moderate Resolution Imaging Spectroradiometer (MODIS) Land Cover Types product (MCD12Q1) (https://ladsweb.modaps.eosdis.nasa.gov/search/order/1/MCD12Q1-6 (accessed on 16 April 2022)) provides the distribution of land cover types globally on a yearly basis, with a spatial resolution of 500 m. According to the International Geosphere-Biosphere Program (IGBP), global surfaces are classified into 17 land cover types [73]. In this study, the main vegetation types were selected for analysis, including forest, shrubland, grassland, and cropland. To avoid the disturbance of vegetation type changes, areas with unchanged land cover types in 2001 and 2018 were selected for analysis.

2.2.4. Elevation Data

The elevation data used in this study are derived from Shuttle Radar Topography Mission (SRTM) data (https://www.resdc.cn/ (accessed on 8 May 2022)), which are mainly measured jointly by the National Aeronautics and Space Administration (NASA) and the National Mapping Agency (NIMA) of the Department of Defense. These data have full coverage of the terrestrial part with a spatial resolution of 30 m. In this study, the elevation of Central Asia was selected for the production of Figure 1.

2.3. Research Methodology

2.3.1. Calculation of the Lagged Effect

To account for the lagged effect of drought on vegetation, correlation coefficients (R) were calculated using correlation analysis of time series in IDRISI software, with correlation coefficients ranging from −1 to 1, characterizing negative to positive correlations [30,74]. In order to preserve more useful data information, outliers in the non-standardized series that may interfere with the results were eliminated in this study. We calculated the correlation coefficient between the GPP for each month of the growing season and the 1-month SPEI for the previous i months, and each pixel had 12 correlation coefficients (Equation (1)). Then, the highest correlation coefficients (i.e., Rmax_lag) and corresponding months were chosen as the quantitative and temporal scales of the lagged effect of drought on vegetation (Equation (2)). For example, if the correlation coefficient between monthly GPP and 1-month SPEI from 3 months ago was the largest, then a lag time scale of 3 months suggests that drought conditions 3 months ago had the greatest impact on current vegetation GPP.
ri = corr(GPP,SPEIi) 1 ≤ i ≤ 12,
Rmax_lag = max(ri) 1 ≤ i ≤ 12,
where ri is the coefficient of the correlation between GPP and the SPEI, with a lag of i months; i is a lag of i months, which takes values in the range of 1–12; GPP is the monthly GPP for the growing seasons in 2000–2018; SPEIi is SPEI-1 with a lag of i months; and Rmax_lag is the maximum value of ri.

2.3.2. Calculation of the Cumulative Effect

The cumulative effect of drought on vegetation was also treated by first removing outliers that might interfere with the results, and then calculating the correlation coefficients through the time series of the IDRISI software [30,74]. To calculate the cumulative effect, the accumulation of the SPEI for 1 to 12 months was required; this is different from the lagged effect calculated using only SPEI01. Therefore, the Pearson coefficients of the correlation between growing season GPP values and month-by-month SPEI values on a 1–12 month time scale from 2000 to 2018 were used as candidate indicators of the cumulative effect of drought on vegetation in this study (Equation (3)). The largest correlation coefficients (i.e., Rmax_cum) and the corresponding month scales were considered the cumulative effect of drought on vegetation (Equation (4)). For example, if the correlation coefficient between monthly GPP and the SPEI for the previous 4 months is the largest, then a cumulative time scale of 4 months indicates that the current vegetation GPP is most affected by the previous cumulative 4 months of drought.
rm = corr(GPP,mSPEI) 1 ≤ m ≤ 12,
Rmax_cum = max(rm) 1 ≤ m ≤ 12,
where rm is the coefficient of the correlation between GPP and the SPEI with a cumulative effect of m months; m is the cumulative total of m months, ranging from 1 to 12; GPP is the monthly GPP for the growing seasons in 2000–2018; mSPEI is the cumulative SPEI for 1–12 months; and Rmax_cum is the maximum value of rm.
The steps for calculating the lagged and cumulative effects of drought on vegetation GPP are shown in Figure 2.

2.3.3. Classification of Drought Intensity Based on Vegetation

This study utilized SPEI-12 from 2000 to 2018 as the mean annual water balance conditions to analyze the time and space characteristics of drought in Central Asia, as well as the distribution pattern of the lagged and cumulative effects in response to changes in drought conditions. The SPEI was used to characterize the drought conditions of a region by calculating the degree of deviation from the mean state of the difference between precipitation and potential evapotranspiration, and the drought conditions of an area were characterized by the difference in SPEI. An SPEI less than 0 indicated the occurrence of drought, and the smaller the value, the more severe the drought. In this research, drought magnitude was categorized according to Bae et al. and Wang et al., as shown in Table 2 [75,76].

3. Results

3.1. Characteristics of Spatial and Temporal Changes in Vegetation Cover in Central Asia

In this research, the annual mean value of GPP in the growing season was used to represent the distribution of vegetation in Central Asia from 2000 to 2018, as shown in Figure 3. The vegetation GPP in Central Asia showed obvious spatial differences, with values varying from 0 to 2413.16 g C m−2 y−1, and the average value of GPP during the 19-year period was 337.75 g C m−2 y−1. Vegetation showed a gradual decrease from north to south. In Central Asia, the overall GPP values were small, and some areas near the northern and eastern mountain ranges had relatively high GPP values, mostly above 600 g C m−2 y−1, accounting for 18% of the total. The specific performance showed that the northern vegetation of Kazakhstan had a high GPP, which gradually decreased from north to south. Uzbekistan had a high GPP in small areas in the east and center of the country, and Turkmenistan had a low overall vegetation GPP, with 58% of the area having GPP values of less than 200 g C m−2 y−1. Kyrgyzstan had an overall high vegetation GPP, especially in the western part of the country, with lush vegetation. Tajikistan had low vegetation cover in the east, gradually increasing from east to west. Vegetation cover was high around the Tian Shan Mountains and Altai Mountains in Xinjiang, China, and very low in the Junggar Basin.
Temporally, a one-dimensional linear regression model was established, as shown in Figure 4, using the data of the mean GPP from March to October of the growing seasons in Central Asia to represent the vegetation growth in each year. Based on the interannual trend of vegetation change, the vegetation fluctuated but was more stable and had more fluctuation above and below 345 g C m−2 y−1. The GPP reached a maximum value of 439.04 g C m−2 y−1 and a minimum value of 282.94 g C m−2 y−1 in 2016 and 2008, respectively. The rate of change in the GPP during the 19-year period was 1.35 g C m−2 y−1, indicating that the vegetation had a slightly increasing trend in vegetation as a whole from 2000 to 2018, and the changing trend was not significant. Among them, a drought event occurred in 2008, and the mean value of GPP showed a decreasing trend between 2000 and 2008, which changed to an increasing trend between 2008 and 2018.

3.2. Characteristics of Spatial and Temporal Changes in SPEI in Central Asia

In this research, the space distribution of the average annual SPEI of vegetation in Central Asia from 2000 to 2018 was analyzed using the annual SPEI (SPEI-12) as the average annual water balance condition, as shown in Figure 5. The space distribution of SPEI in Central Asia from 2000 to 2018 showed strong geographic variability, and the degree of aridity was characterized by a decreasing distribution from southwest to north and a wetter distribution on both sides of the mountain range. The average annual SPEI of the vegetation areas in Central Asia ranged from −1.36 to 0.38, with an average of −0.25, and 70.80% of the areas had an average annual SPEI < 0, indicating drought conditions. The wetter areas were mainly located in Tajikistan, Kyrgyzstan, and northeast Kazakhstan, and the southwest of Kazakhstan was more arid. More severe drought conditions were found in Turkmenistan, Uzbekistan, and the eastern part of Xinjiang, China, where there was less rainfall, low vegetation cover, weak ecosystem resilience, and vulnerability to drought.
Temporally, using the mean SPEI (SPEI-12) data of Central Asia to represent the drought situation of each year, the interannual change characteristics of the SPEI in Central Asia from 2000 to 2018 were obtained, and a one-dimensional linear regression model was established, as shown in Figure 6. Based on the interannual trend of SPEI, drought in Central Asia fluctuated but was more stable, with an overall decreasing trend and a decrease rate of 0.02 y−1. The analysis revealed that the corresponding SPEI value (−1.43) in 2008 was low, indicating that the Central Asia region experienced one moderate drought in the past 19 years. The wet year in 2003 corresponded to an SPEI value of 1.04, which was relatively high. The change in drought conditions in Central Asia from 2000 to 2018 was mainly divided into two periods: in the first period, the drought conditions from 2000 to 2008 changed from semi-arid and semi-wet in 2000 to moderate drought in 2008; in the second period, the drought conditions gradually changed from moderate drought in 2008 to semi-arid and semi-wet in 2018.

3.3. Lagged Effect of Drought on Vegetation GPP

The space distribution of Rmax_lag of the lagged effect of drought on vegetation GPP was obtained from the analysis of the correlation of GPP with the SPEI with a 1-month scale lag, as shown in Figure 7a. In Central Asia, 99.87% and 0.13% of the regions showed positive and negative correlations between vegetation GPP and SPEI, respectively, and 38.80% of the regions were significantly correlated (p < 0.05). Rmax_lag had a mean value of 0.25, and the Rmax_lag values in most regions were concentrated in the range of 0.15–0.35. In the lagged effect, higher correlations greater than 0.45 were mainly distributed in southern and northwestern Kazakhstan, and a small number of regions were distributed in northwestern Kyrgyzstan and northern Tajikistan. Negative correlations were mainly distributed in the northern area of Xinjiang, China.
Lagged months in Central Asia were mainly found in shorter time scales (1–3 months), as shown in Figure 7b, where a 2-month lag was more widespread, with a percentage of the area as high as 37%, followed by a 1-month lag, accounting for 23% of Central Asia. These two lag time scales were widely distributed across Central Asia. Droughts with a 5-month lag were more widespread (10%), mainly in eastern and southern Kazakhstan, western Tajikistan, eastern Uzbekistan, and western Kyrgyzstan. None of the other lag time scales exceeded 10%. The smallest lag was 10–12 months (<3%) and was prominent in northeastern Kazakhstan and the northern Xinjiang region of China. We further analyzed the response of GPP to drought lag months for different vegetation types, as shown in Figure 7c. The average number of lag months for vegetation was 3 months, and forests had the most lag months, with a mean of 4.96 months, followed by cropland (3.98 months), grassland (2.92 months), and shrubland (2.02 months).
The percentage area of the correlation coefficient ranks differed significantly on the lag time scale, as shown in Figure 8a. Rmax_lag in the range of 0.10–0.15 occurred in the 8-month lag time scale, with the largest percentage of the area of 40.43%. Across the lag time scale, 65.56% of the correlation coefficients were concentrated in the 0.10–0.25 range. Relatively few had an Rmax_lag greater than 0.40, accounting for 1.01% of the correlation areas. There was no strong correlation (Rmax_lag > 0.40) between GPP and SPEI on a long time scale (6–12 months) for multiple lagged time scales.
Accordingly, the average coefficients of the correlation with GPP and the SPEI varied across vegetation types on lagged time scales, as shown in Figure 8b. The largest correlation coefficient (r = 0.28) was for a 2-month lag, followed by the coefficients for 1- and 3-month lags (r = 0.25), and the correlation coefficients for all the other lag time series were less than 0.24, which was generally the same as the percentage variation in the area of Rmax_lag. Among them, the lagged correlation coefficients of the forest GPP and SPEI were lower overall than the mean value, and the lag to drought was relatively weak. In contrast, the lagged correlation coefficients of grassland and shrubland were mostly higher than the mean value, and the lag to drought was relatively strong.
The relationship between the average annual SPEI value, the average Rmax_lag, and the corresponding lagged monthly average is shown in Figure 9. As the SPEI increased, the mean Rmax_lag increased and then decreased (R2 = 0.66, p < 0.05), reaching a maximum when the mean annual SPEI was approaching −0.5–−0.4 and then gradually decreasing, indicating that the drought lag impact on vegetation was more pronounced in semi-arid and semi-wet areas and that the drought-lagged effect diminished with the increase or decrease in the water balance in more humid or arid areas, as shown in Figure 9a. A significant correlation between the average yearly SPEI and average lag month was also noted (R2 = 0.91, p < 0.05). The lag timescale first decreased with an increase in average annual SPEI, reached a minimum as the SPEI approached −0.5, and then gradually increased. In arid and semi-arid areas, there were fewer lag months before the response of vegetation GPP to drought, generally 2 to 4 months, as shown in Figure 9b.

3.4. Cumulative Effect of Drought on Vegetation GPP

The space distribution patterns of vegetation GPP, the cumulative SPEI correlation (Rmax_cum), and its corresponding cumulative duration of months are illustrated in Figure 10. GPP of vegetation were positively and negatively correlated with SPEI in 92.66% and 7.34% of the regions in Central Asia, respectively, and 51.03% of the regions were significantly correlated (p < 0.05). The spatial distribution of Rmax_cum showed heterogeneity, as shown in Figure 10a. Rmax_cum had a mean value of 0.33, and its values were mainly concentrated in the range of 0.20–0.50. High correlations (Rmax_cum > 0.6) were found in southern Kazakhstan, eastern Uzbekistan, southern Turkmenistan, and southwestern Tajikistan. Scattered throughout Central Asia, there was a lower correlation (Rmax_cum < 0.2). A negative correlation was mainly found in northern and eastern Kazakhstan, south-central Uzbekistan, northern Turkmenistan, southern Kyrgyzstan, and western and northern Xinjiang, China.
Cumulative droughts lasting 9–12 months covered 75.86% of Central Asia, as shown in Figure 10b, with the largest area (26.70%) occurring at the 10-month time scale, mainly in central, southern, and northeastern Kazakhstan, western Kyrgyzstan, northeastern Uzbekistan, and northern Xinjiang, China. This was followed by regions with 12 (19.94%) and 9 months of accumulation (15.15%). The shorter cumulative drought time scale (1–4 months) accounted for 13.59% of the vegetation, mainly in northern and eastern Kazakhstan, eastern Kyrgyzstan, and Xinjiang, China. The smallest proportion of the cumulative 2-month time scale was found mainly in the western and northern regions of Xinjiang, China. The responses of GPP to cumulative months of drought for different vegetation types are shown in Figure 10c, where the average number of cumulative months for vegetation was 9 months. Shrubland had the most cumulative months, with a mean of 10.65 months, followed by cropland (9.99 months), grassland (9.51 months), and forests (6.24 months).
There was a significant difference between the percent area and the average value of Rmax_cum on different cumulative time scales, as shown in Figure 11. As shown in Figure 11a, the highest percentage of area, 92.76%, was found at 1 month of accumulation and when Rmax_cum was negatively correlated. Among the positive correlations, the highest percentage of the area was 22.37% at 4 months of accumulation when Rmax_cum was in the range of 0.25–0.30. Over the entire cumulative time scale of 1–12 months, the highest percentage area was observed for Rmax_cum of 0.30–0.35 (12.55%), followed by 0.35–0.40 (11.52%) and 0.25–0.30 (11.31%). There was a close correspondence between vegetation GPP and cumulative SPEI except on the 1-month time scale. At 7–10 months, 2.96% of the vegetation had a Rmax_cum higher than 0.6.
Figure 11b shows the mean Rmax_cum values for each vegetation type for a different number of cumulative months. From the vegetation overall, the average Rmax_cum value was the largest at 7 months of accumulation, 0.41, followed by 8 and 10 months of accumulation, with values of 0.39 and 0.38, respectively. The cumulative correlation coefficients of forest GPP and the SPEI were lower than the average overall, and the lowest value of Rmax_cum of −0.02, which was relatively weak for drought, was observed at 2 months of accumulation. The cumulative nature was relatively weak. The cumulative correlation coefficients of shrubs were higher than the mean value, and the Rmax_cum was as high as 0.54 at 8 months, which was relatively strong for drought.
The relationship between the average annual SPEI, the average Rmax_cum, and the corresponding average cumulative months is shown in Figure 12. As shown in Figure 12a, the average Rmax_cum increased as the average annual SPEI increased from −1.0 to −0.5–−0.4 and then decreased rapidly as the SPEI continued to increase (R2 = 0.77, p < 0.05), suggesting that drought had the strongest cumulative effect on vegetation in semi-arid and semi-wet areas, followed by vegetation in drought areas. As shown in Figure 12b, there was a correspondence between the average cumulative months and the average annual SPEI (R2 = 0.31, p < 0.05). The findings revealed that the vegetation in arid and semi-arid areas tended to respond to SPEI on a higher time scale, and the cumulative time scales of vegetation were mainly concentrated at 8–10 months.

3.5. Comparison of Lagged and Cumulative Effects of Vegetation on Drought

To determine the main way in which drought affects vegetation GPP, this study performed a comparison between the magnitude of Rmax_lag and Rmax_cum (ΔRmax = Rmax_lag–Rmax_cum), as shown in Figure 13. As shown in Figure 13a, the cumulative effect of drought on vegetation was higher than the lagged effect in 86.75% of the areas. The mean ΔRmax value for areas where the lagged effect was higher than the cumulative effect was 0.05, and the mean ΔRmax value for areas where the lagged effect was less than the cumulative effect was 0.13. As shown by the plot of the percent area of ΔRmax, the ΔRmax was mainly concentrated on the scale of −0.15–−0.05 (39.45%), followed by −0.05–0 (14.96%) and −0.20–−0.15 (14.14%). The areas where the cumulative effect was dominant (ΔRmax < −0.20) were primarily located in southern and western Kazakhstan, eastern Uzbekistan, southwestern Tajikistan, and southern Turkmenistan. The regions where the lagged effect dominated were mainly located in southern Kyrgyzstan, central Tajikistan, south-central Uzbekistan, northern Turkmenistan, and the western region of Xinjiang, China.
In this study, the dominant effects of different vegetation types were further investigated. The results showed that the cumulative effect of drought was more powerful than the lagged effect for all vegetation types except forests, as shown in Figure 13b. Among the vegetation types with dominant cumulative effects, shrubland had the largest cumulative effect, with a mean ΔRmax of −0.22, followed by grassland and farmland. This indicates that the cumulative effect of drought is more powerful than the lagged effect for large portions of the vegetation in Central Asia.

4. Discussion

4.1. Spatial and Temporal Distribution of Vegetation and Drought

The vegetation GPP was dominated by a slight upward trend from 2000 to 2018 in Central Asia, which corresponded with the findings for the GPP in Central Asian countries estimated based on MODIS products [77]. The lowest value of vegetation GPP occurred in 2008, and this inflection point was due to the severe drought that occurred in 2008 in Central Asia, which limited vegetation growth [78]. Compared with other regions in Central Asia, the Tian Shan mountainous region has a high GPP, high altitude, and a relatively humid climate, which are favorable for vegetation growth [79]. Most Central Asian mountainous regions have snow in winter, which melts in spring to provide a year’s supply of moisture for the mountainous vegetation; thus, the vegetation in this region has better growth [80].
In the context of global warming, the SPEI is more dominant in indicating arid and semi-arid conditions, and the correlation between the SPEI and vegetation productivity is stronger under arid conditions [52,81,82]. During the 19-year period, the SPEI showed a trend of decreasing and then increasing, and there was a slight overall decreasing trend, indicating that Central Asia is gradually drying out. This finding is consistent with the composite increase in Central Asian drought and heat wave trends [83]. Some studies have also shown that Central Asia shows a warm and humid trend [84], which may be due to the different years from the present study. The phase comparison in this study found that 2002 and 2003 were wetter years, which corresponds with the conclusions of existing studies showing that extremely wet levels were reached [85]. Northern Kazakhstan, Kyrgyzstan, Tajikistan, and the western part of Xinjiang, China, generally had positive SPEI values, and the high-altitude mountains and plateaus blocked moisture from the westerly airflow, creating a large amount of rainfall as the reason for the relative wetness in the region [86]. In contrast, southern Kazakhstan, Uzbekistan, and Turkmenistan have generally negative SPEI values, and these regions have common perennial droughts. Frequent droughts lead to problems, such as reduced regional crop yield and damaged ecosystems [87,88]. At the same time, irrational water resource management due to frequent human activities also exacerbates drought [89,90].

4.2. Vegetation GPP Response to Drought

Drought has a lagged effect on most vegetation in Central Asia, which demonstrates that early soil moisture conditions largely influence current vegetation growth [91,92,93]. The correlation between vegetation and drought lag is higher in the southern and western regions of Kazakhstan, where the main vegetation type is grassland. Grassland comprises shallow-rooted plants, and the source of water during growth is mainly the soil surface water. When drought occurs, these roots are unable to absorb the water deep in the soil or groundwater, thus, grassland has a rapid response to drought, and there is a higher correlation [94], this finding is consistent with the highest sensitivity of grass EVI to drought in Huang-Huai-Hai River Basin, China [20]. The number of lagged months after drought on most of the vegetation was mainly focused on shorter time scales (1–2 months) in Central Asia, indicating that vegetation activities respond faster to wet and dry environments [95]. In forest ecosystems, the average lag time of drought reached 4.96 months, which may be because forests have a deeper root system, and annual tree rings allow water storage in the short term for tree growth; thus, the drought lag time of forests is longer than that of shrubland, grassland, and cropland.
The cumulative effect of drought reflects the combined effects of drought on vegetation processes over successive periods of time, from start to finish. In this study, vegetation GPP was positively correlated with the cumulative effect of drought in over 92% of Central Asia, indicating that hydrology is the major limiting condition for vegetation growth in Central Asia [96]. In contrast, drought was negatively correlated with vegetation GPP in a small proportion of forested areas in northeastern Central Asia, where the corresponding accumulated number of months was 1. This region is located in a high-elevation boreal forested zone with adequate soil moisture content. Temperature is the major limiting element for the growth of cold-land vegetation; thus, the forests in this region are less affected by the cumulative effect of drought [97,98]. This is consistent with the results of the cumulative effect of drought on global vegetation GPP, both of which have the shortest cumulative time scales in forested areas [27]. We found that 75.86% of the region had a cumulative drought time spanning 9 to 12 months. Central Asia has a temperate continental climate with dryness and little rainfall [99], and the vegetation has developed a certain degree of drought resistance to prolonged and intense drought over time in its long-term evolution [100]. Thus, the cumulative effect occurs on a long time scale, which is consistent with the previous study in which the cumulative drought time in this region was found between 40° and 45° N [95].
An adequate water supply promotes vegetation development, while a lack of water limits the carbon uptake and transpiration of vegetation [101]. The correlation of vegetation GPP with the SPEI in this study was stronger in relative drought regions, and the correlation of GPP with the SPEI reached the maximum when the average annual SPEI was around −0.4, indicating that moisture conditions had a greater influence on vegetation development under arid climatic conditions; thus, vegetation was more affected by drought in arid and semi-arid areas. For example, the Vegetation Anomaly Index was found to be highly correlated with precipitation in semi-arid regions of North Africa [102,103,104]. Meanwhile, the fastest-lagged response of vegetation to drought was observed in regions where the average annual SPEI was approaching −0.4, which was attributed to the fact that the soil surfaces in these areas were more active and variable in terms of moisture, and the vegetation in the area was extremely sensitive to drought and could cope with drought conditions by adjusting its physiology in a timely manner to achieve water balance [105].
By having analyzed the lagged and cumulative effects of drought on vegetation, this study clarifies the importance of considering the cumulative effect when discussing the effects of drought on vegetation GPP. In general, the adverse impacts of drought events on vegetation development can persist for some time [26]; the lagged effect only considers that the current state of vegetation is affected by an earlier drought at a specific point in time, neglecting the continuous dynamic conditions that affect vegetation development after the occurrence of a drought event [19,36]. Previous studies have also shown that vegetation growth status is closely related to the cumulative effect of climatic factors [106,107,108]; this is consistent with the findings on the effects of drought on vegetation growth on the Mongolian Plateau, and comparing the contribution of the cumulative and lagged effects of drought to vegetation Normalized Difference Vegetation Index (NDVI) after 1998, it was found that the main driver of NDVI has shifted from a lagged effect to a cumulative effect [74]. Typically, vegetation in arid zones responds to drought events for a longer period of time, as evidenced by the response to the cumulative effect of drought; the average cumulative number of months of drought in the present study reached 9 months. The ability of vegetation to tolerate prolonged periods of drought is attributed to the development of drought tolerance through physical mechanisms that reduce water runoff and enhance the root system’s ability to take up water [109,110]. Sensitivity to drought varies among vegetation types [111,112]. The cumulative effect of drought on scrub was stronger in this research because most of the scrub species in Central Asia are desert shrubs, and the main moisture for vegetation growth in this region originates from snowfall in winter. The snowmelt in spring affects the growth conditions of shrub for a year; thus, this type of shrub is more sensitive to the cumulative effect of drought. In summary, future discussions on the impacts of drought on vegetation should focus on the cumulative effect of drought to reveal the interactions between climate change and vegetation more comprehensively.

4.3. Limitations and Prospects

In exploring the vegetation GPP response to drought, a number of uncertainties still exist. First, this paper considers the responses of vegetation to drought only from the perspective of vegetation types, ignoring the phenological period of different vegetation and the possible changes within the same vegetation type. Second, SPEI cannot fully represent meteorological drought as it does not include soil surface characteristics, which do not fully represent changes in soil moisture deficit [113]; however, the fact that most of the study area is located in arid and semi-arid regions reduces uncertainty to some extent. Third, this study only considers the effect of a single meteorological drought on vegetation, ignoring the effect of compound and repeated droughts on vegetation. Finally, describing the correlation between only two variables, GPP and the SPEI, may not be sufficient, as the interaction between drought change and vegetation is complex. Therefore, in future studies, a variety of drought indicators should be used to model the vegetation index and the drought index to further quantify and analyze the effects of drought on vegetation and to assess the lagged and cumulative effects of a specific drought event in a short period of time for a more accurate understanding of the mechanism by which vegetation responds to drought.

5. Conclusions

In this research, we researched the space and time changes in vegetation GPP and SPEI from 2000 to 2018 and analyzed and compared the lagged and cumulative effects of drought on vegetation GPP in Central Asia. The results showed the following:
(1)
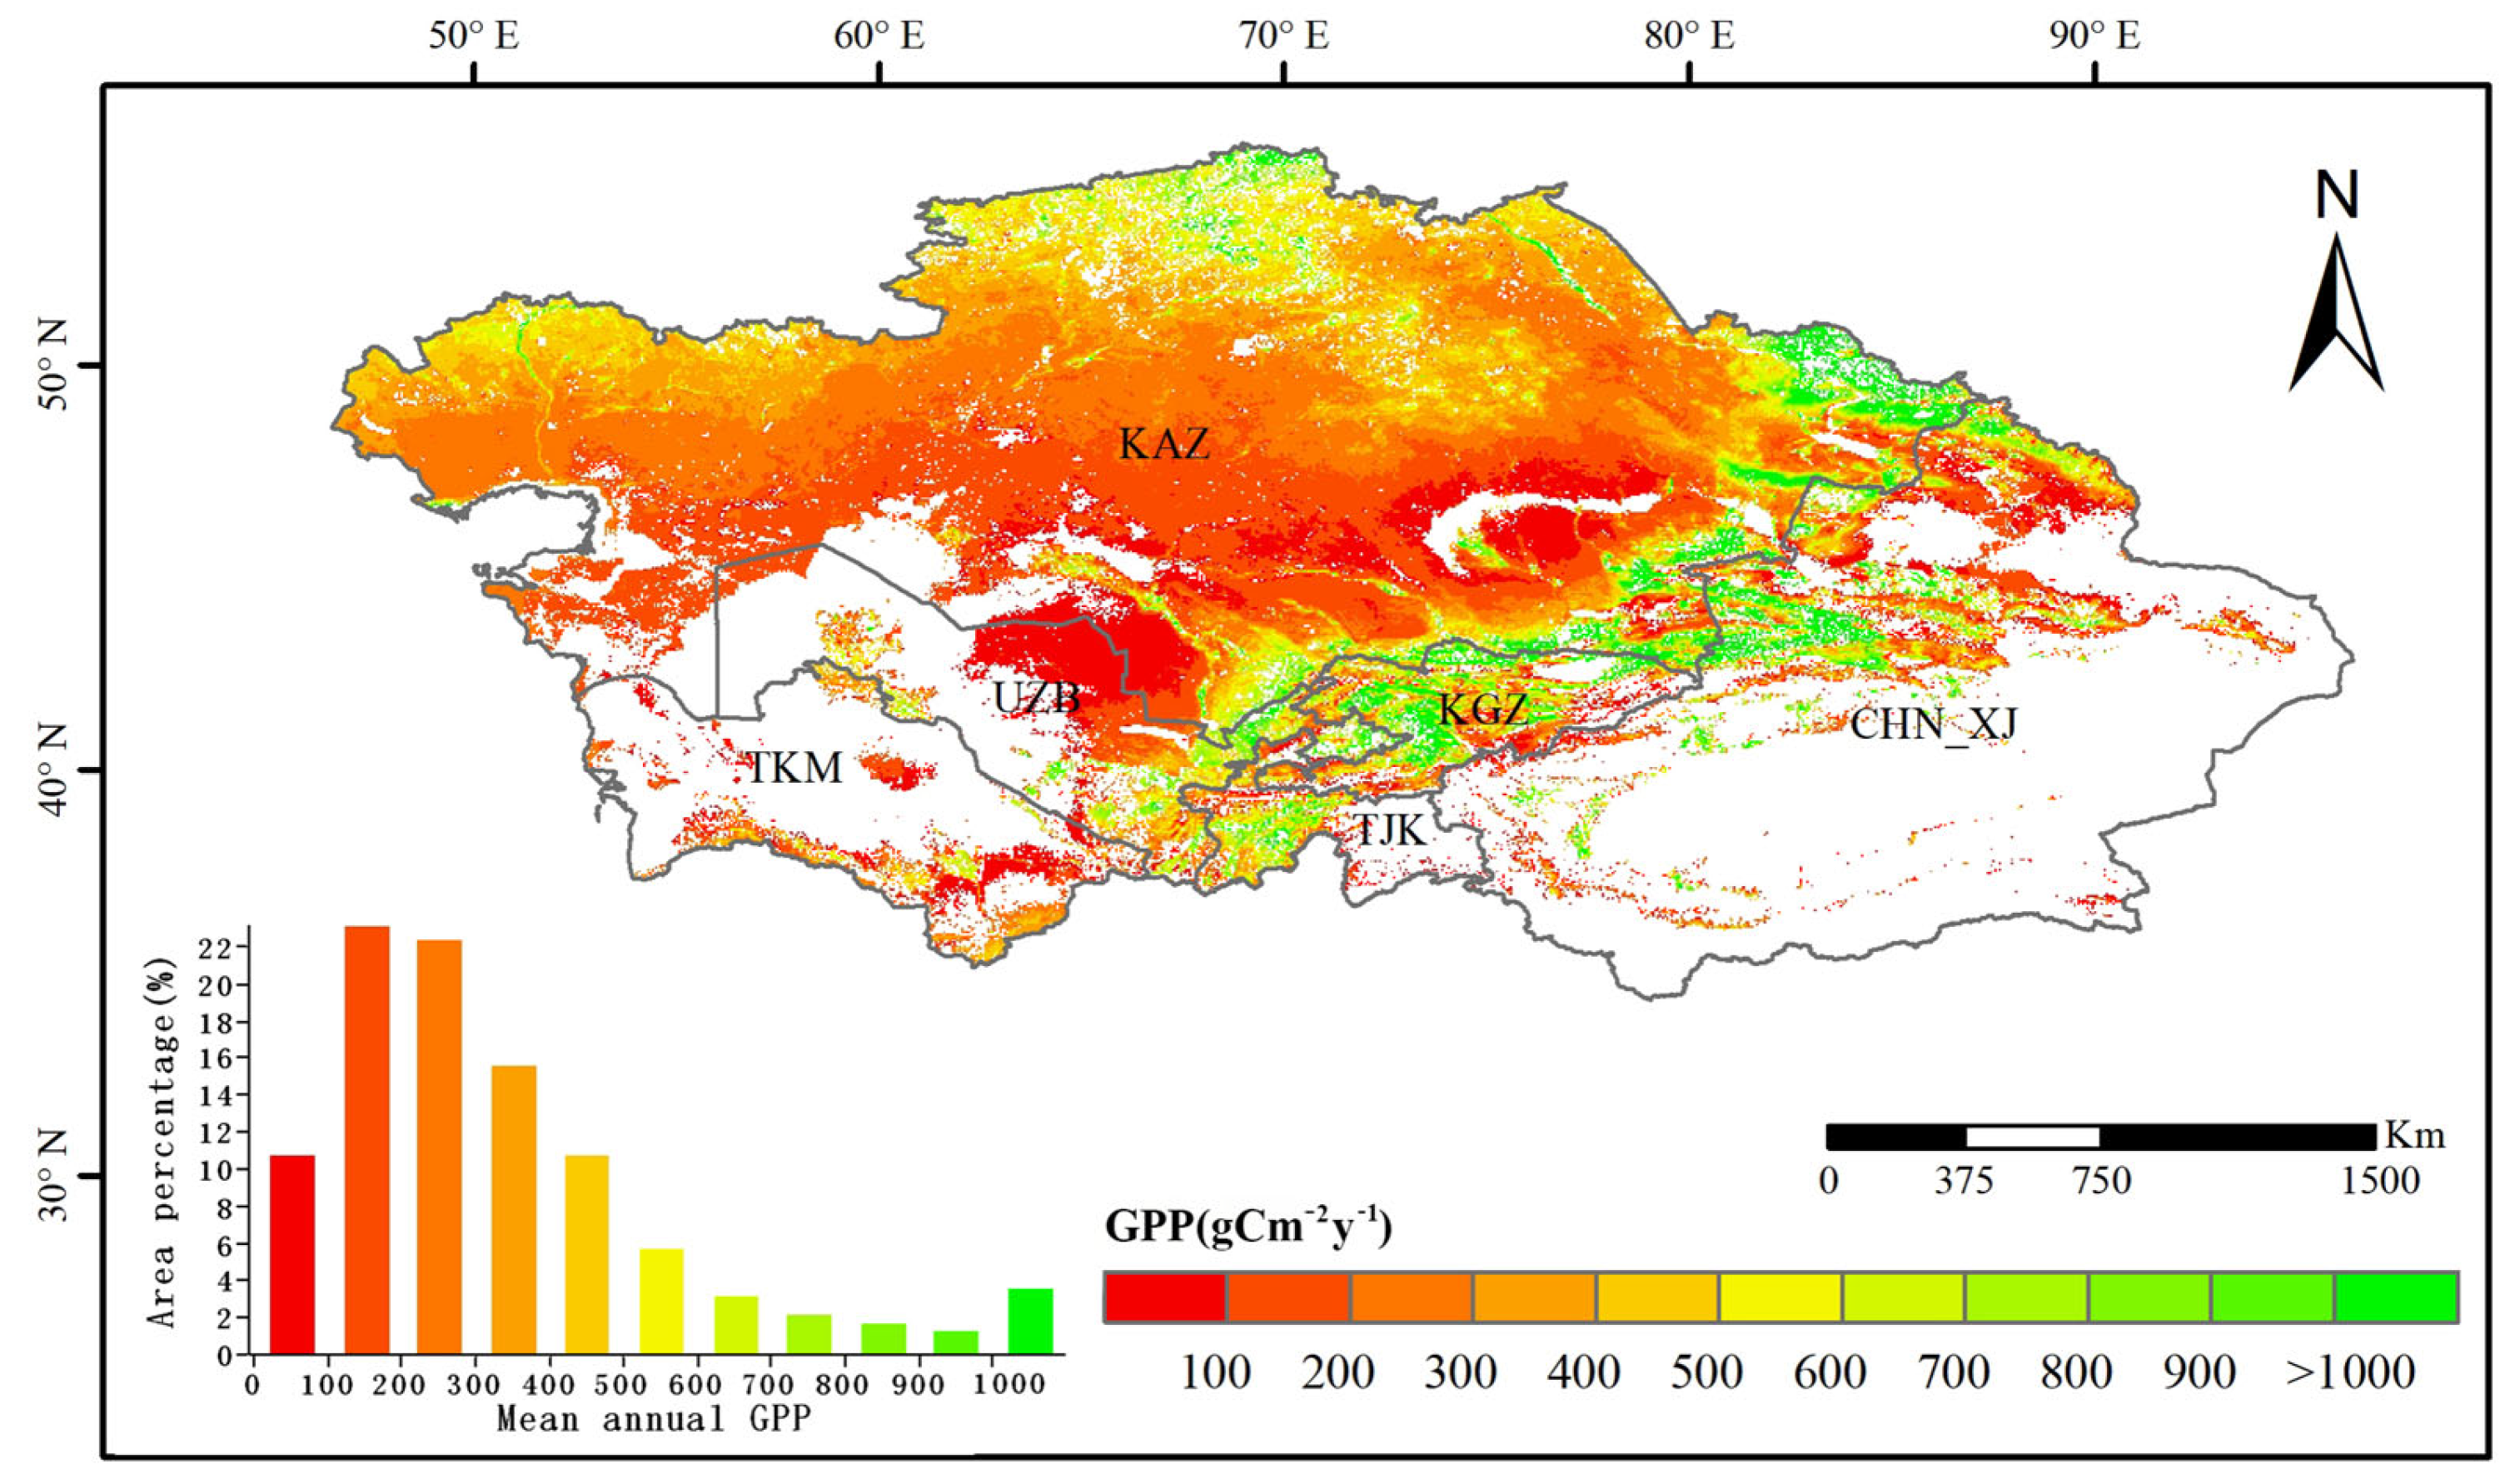
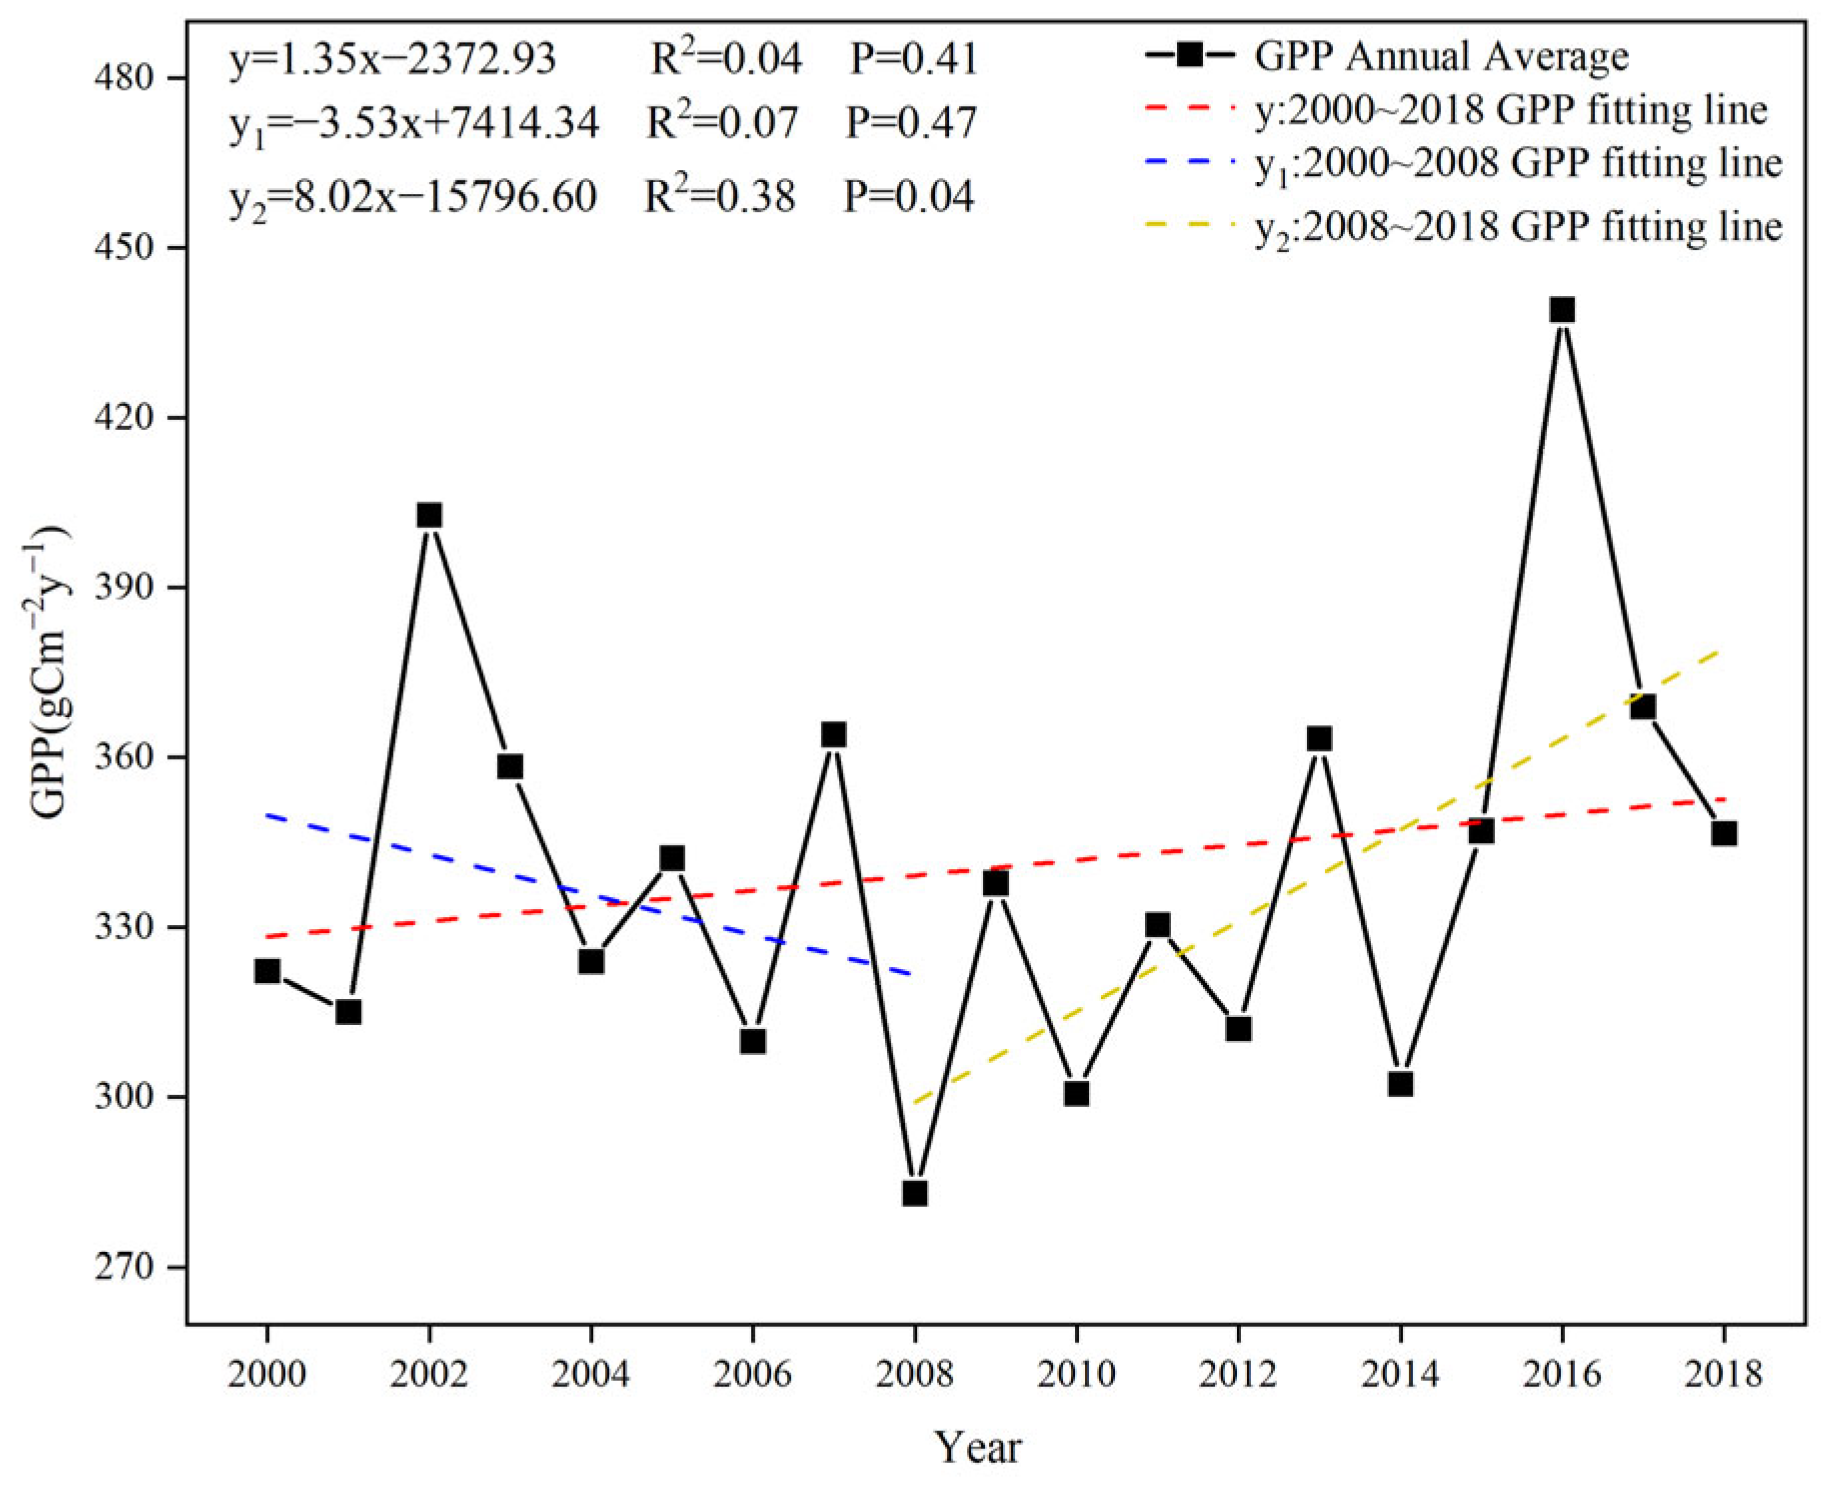
Vegetation GPP showed a slightly increasing trend, with a spatially decreasing distribution from north to south, and the SPEI showed a slightly decreasing trend, with a spatially drying distribution from north to south.
(2)
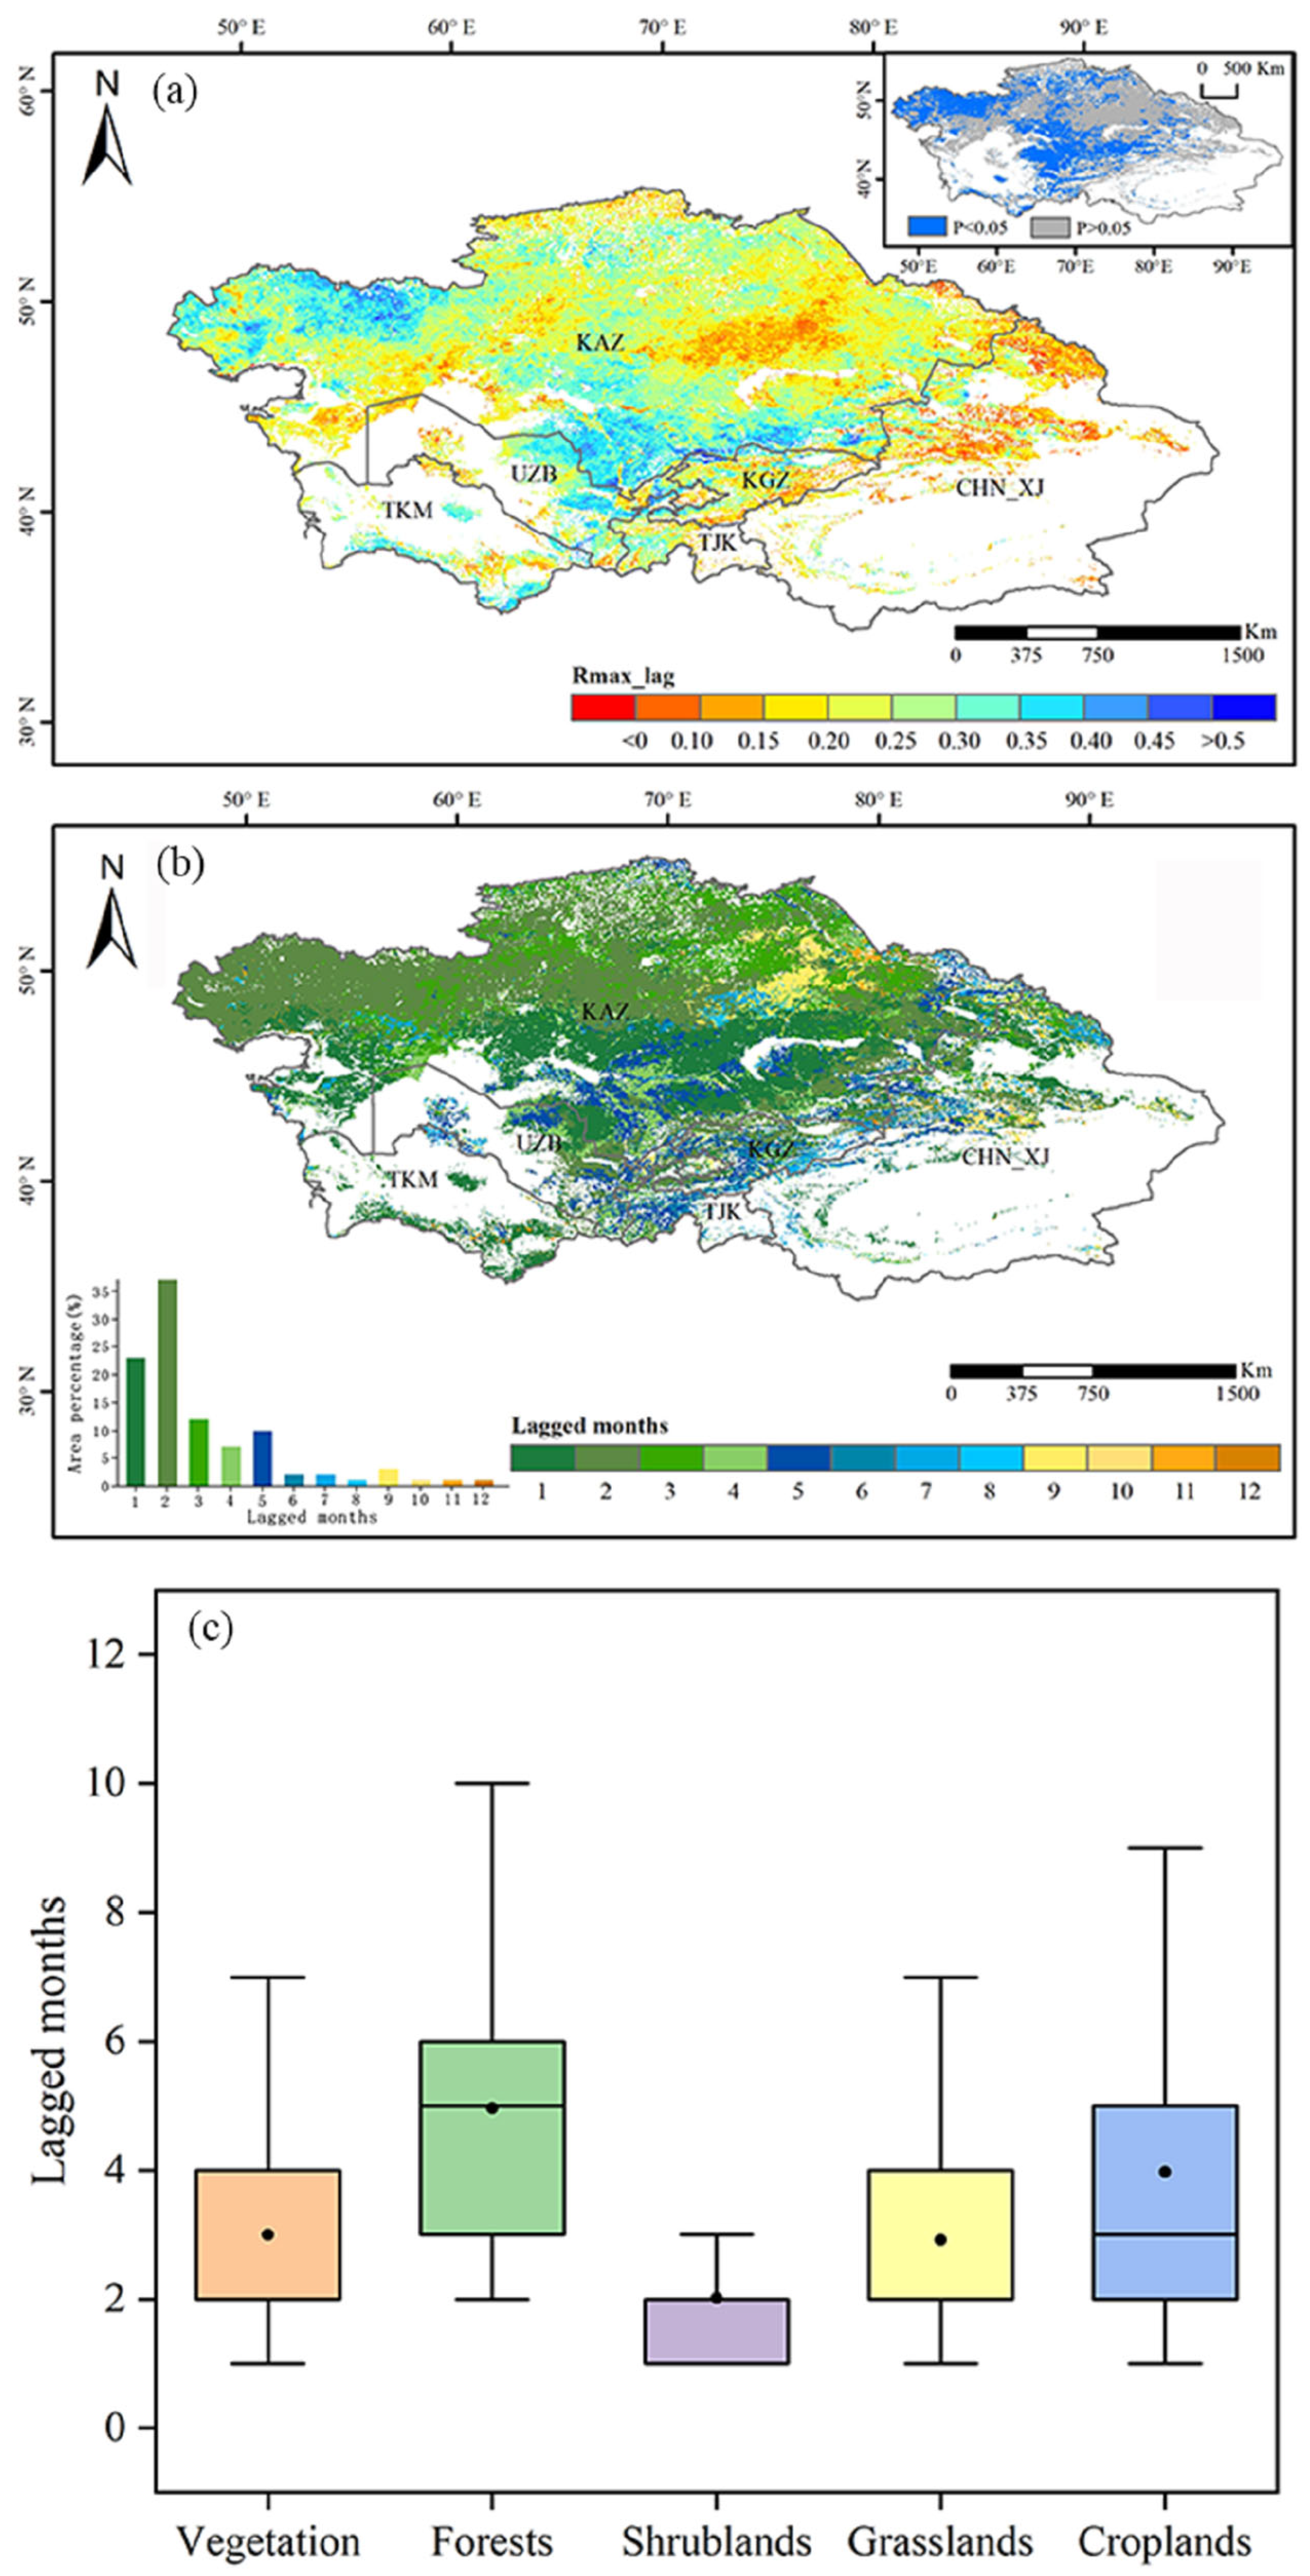
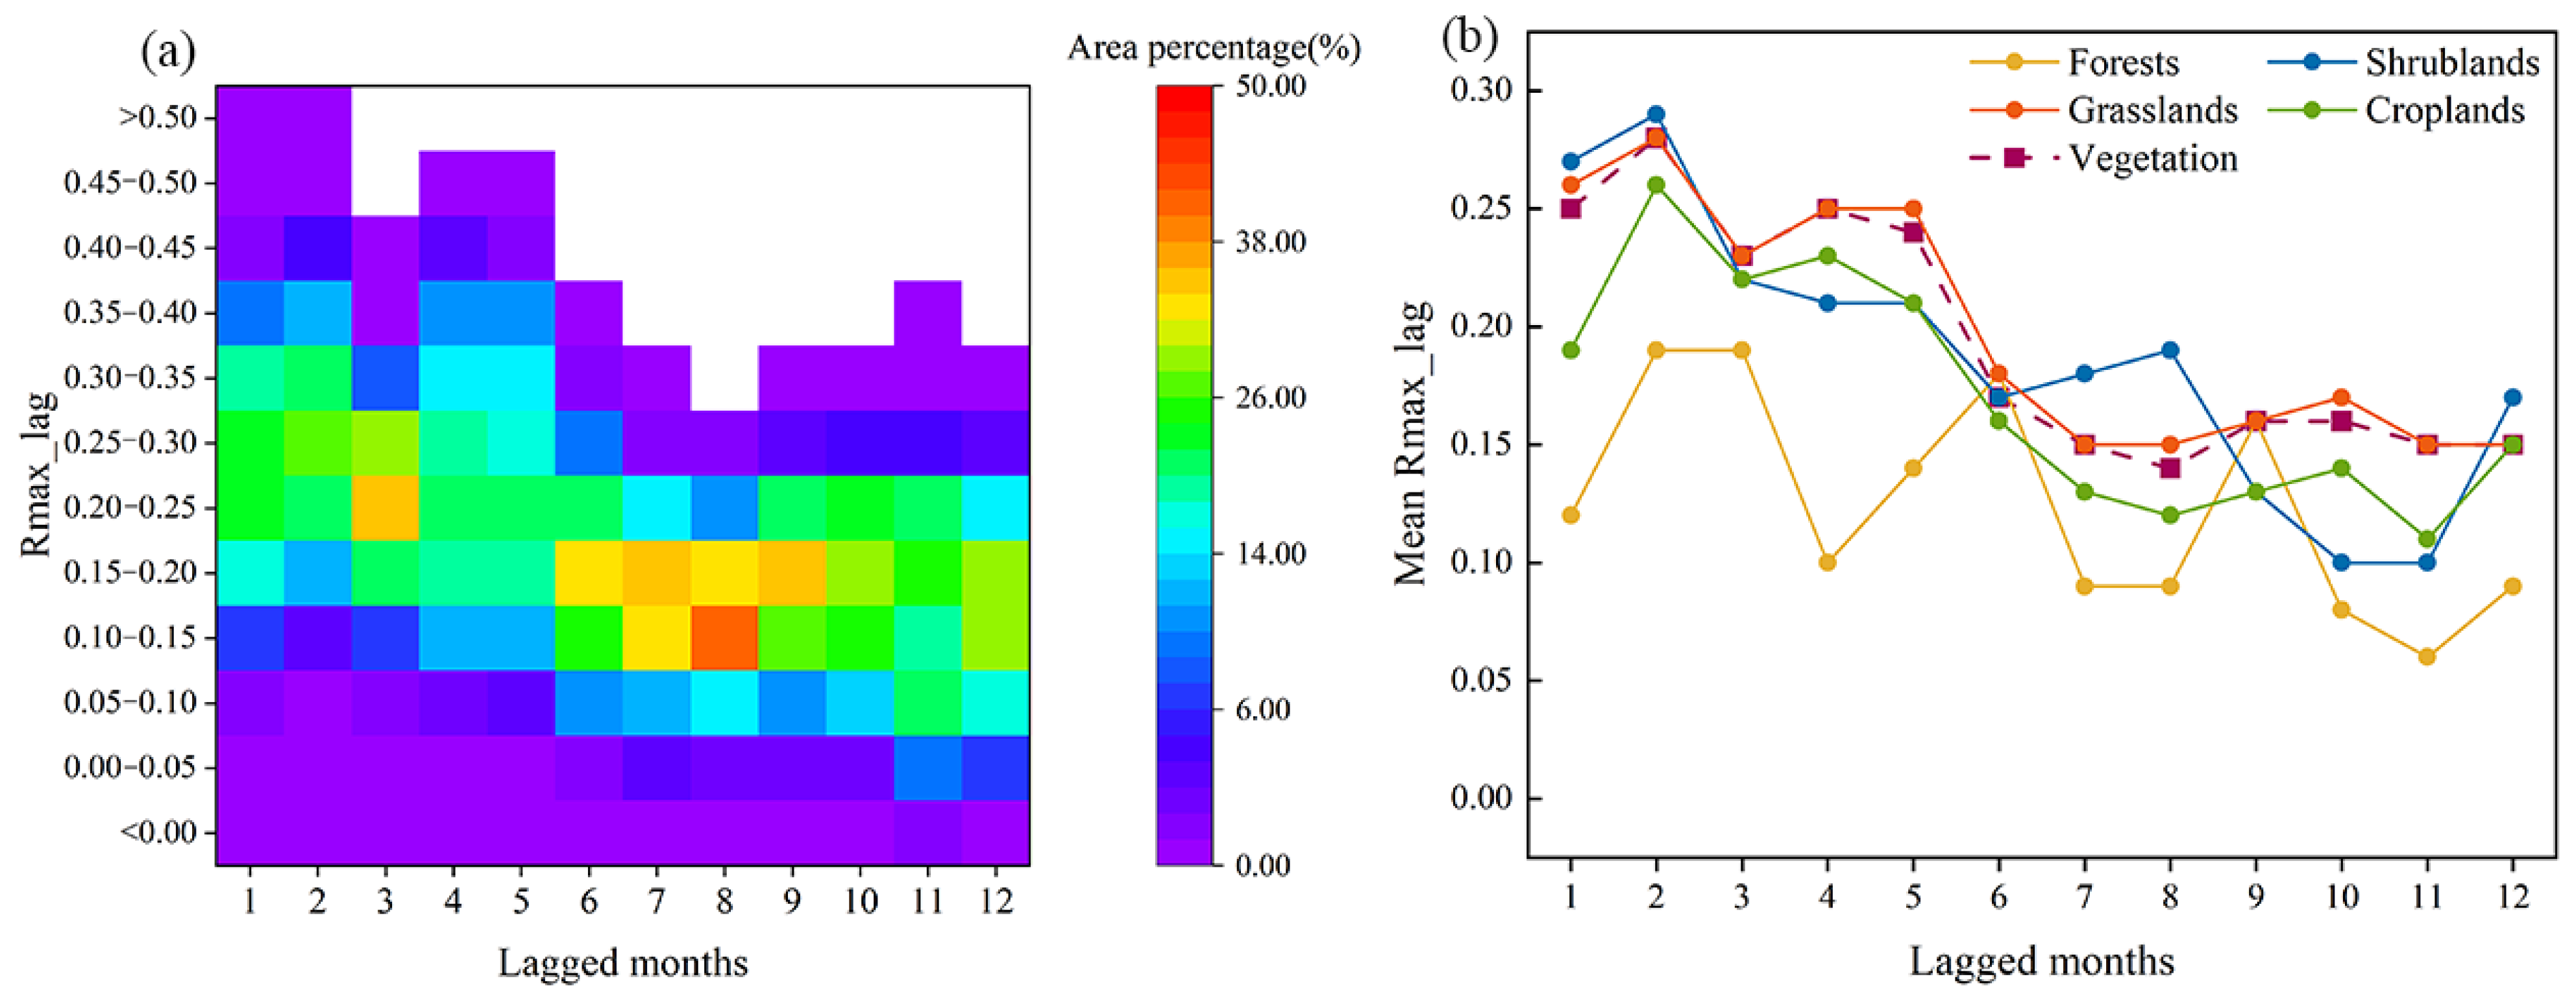
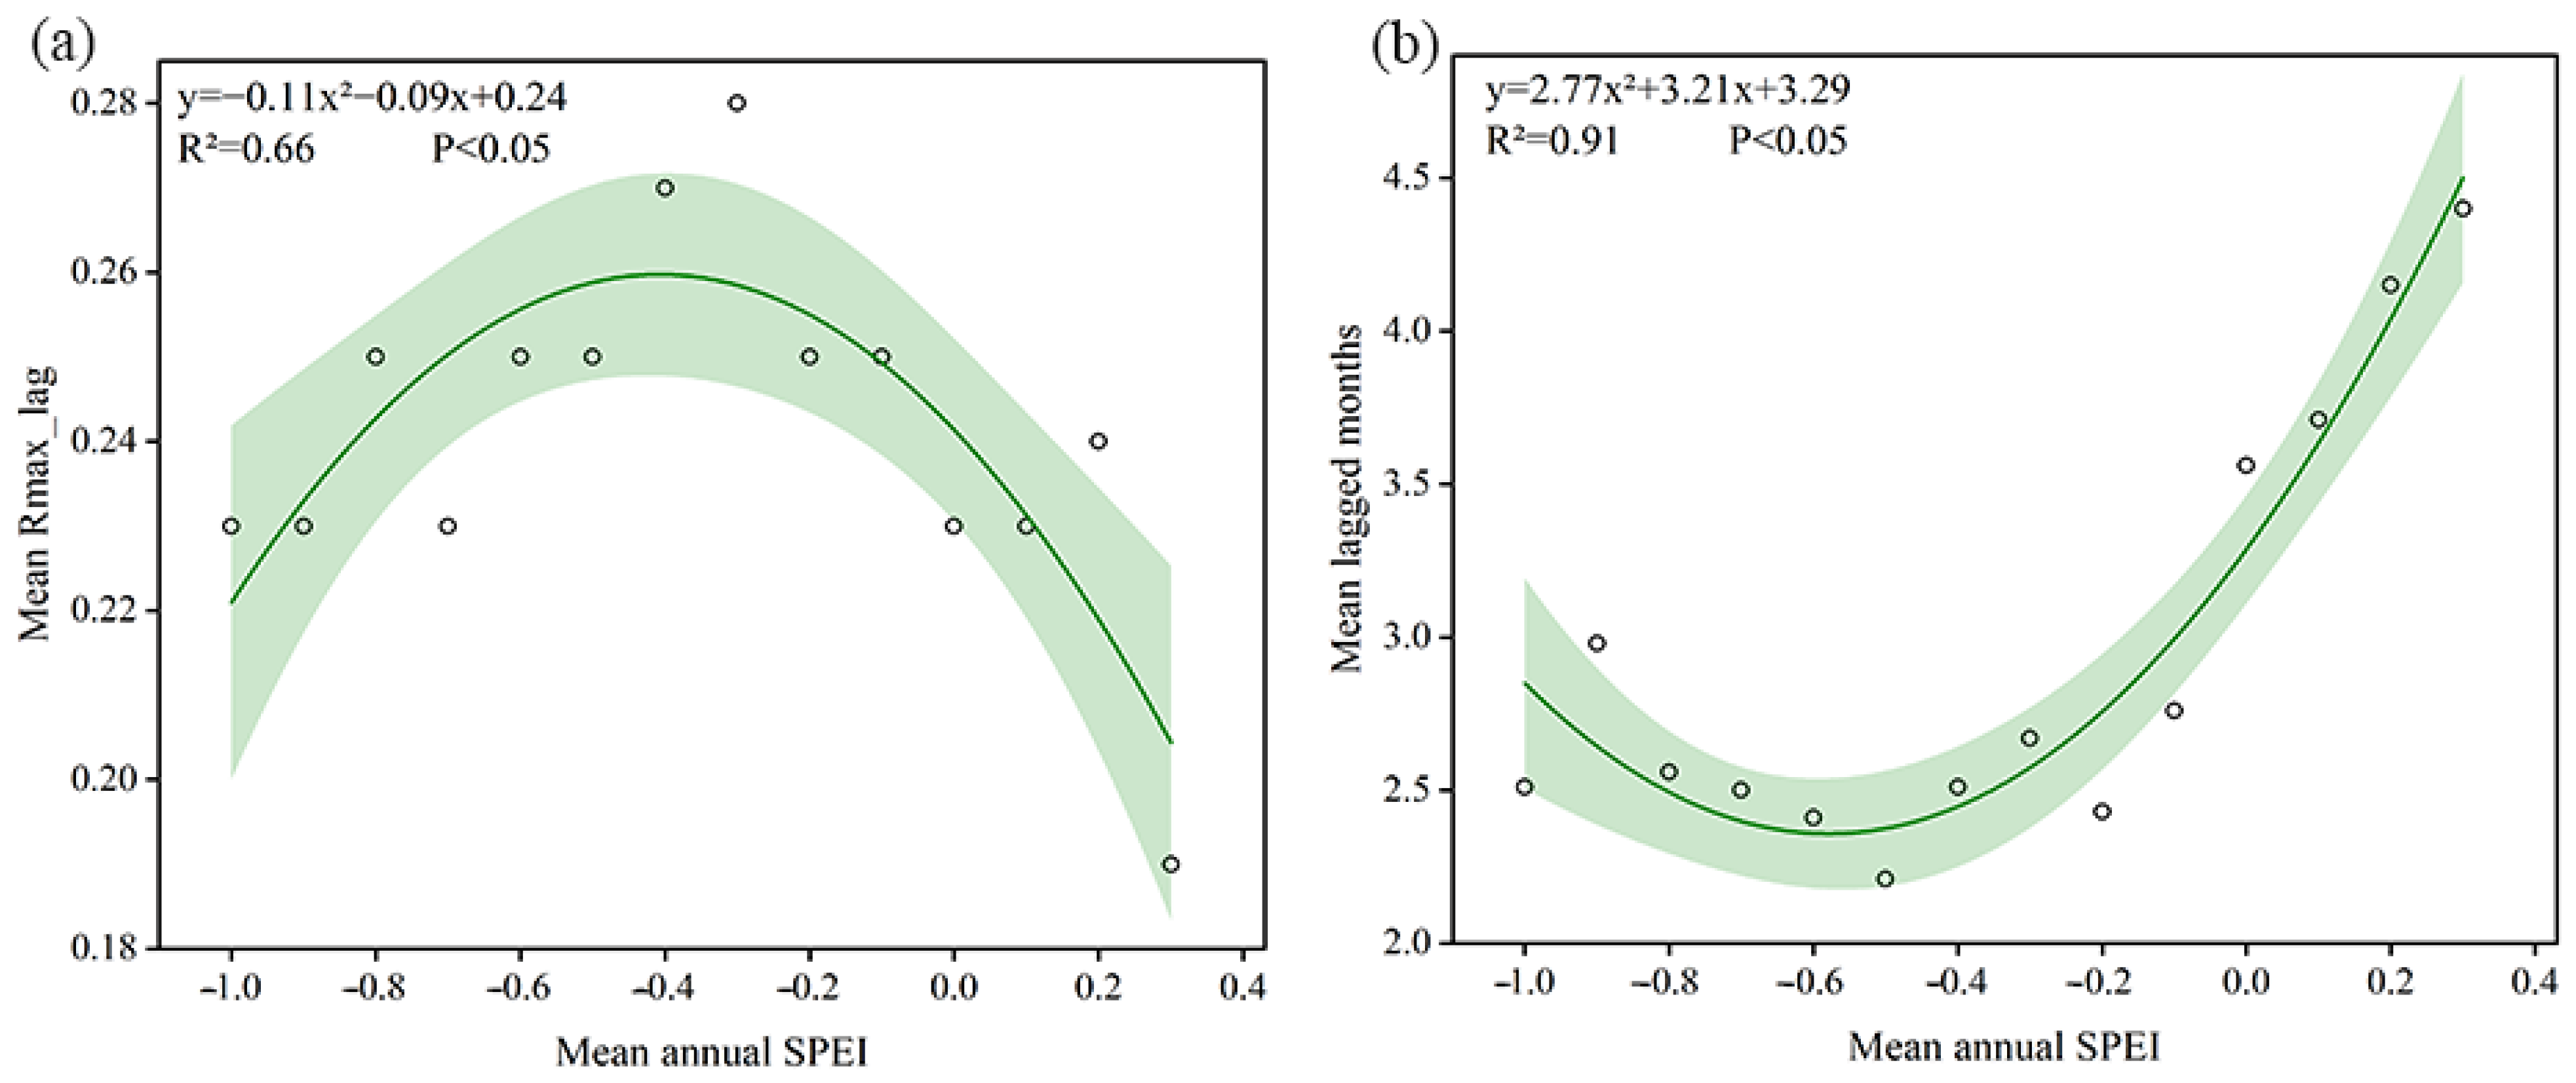
In Central Asia, 72.44% of the lagged months of drought impact on vegetation were concentrated in 1–3 months. The maximum correlation coefficient values of vegetation GPP and the 1-month SPEI were concentrated in the range of 0.15–0.35. A high correlation was distributed in southern and northwestern Kazakhstan, and the fastest vegetation response to drought was found when the average annual SPEI was around −0.5–−0.4.
(3)
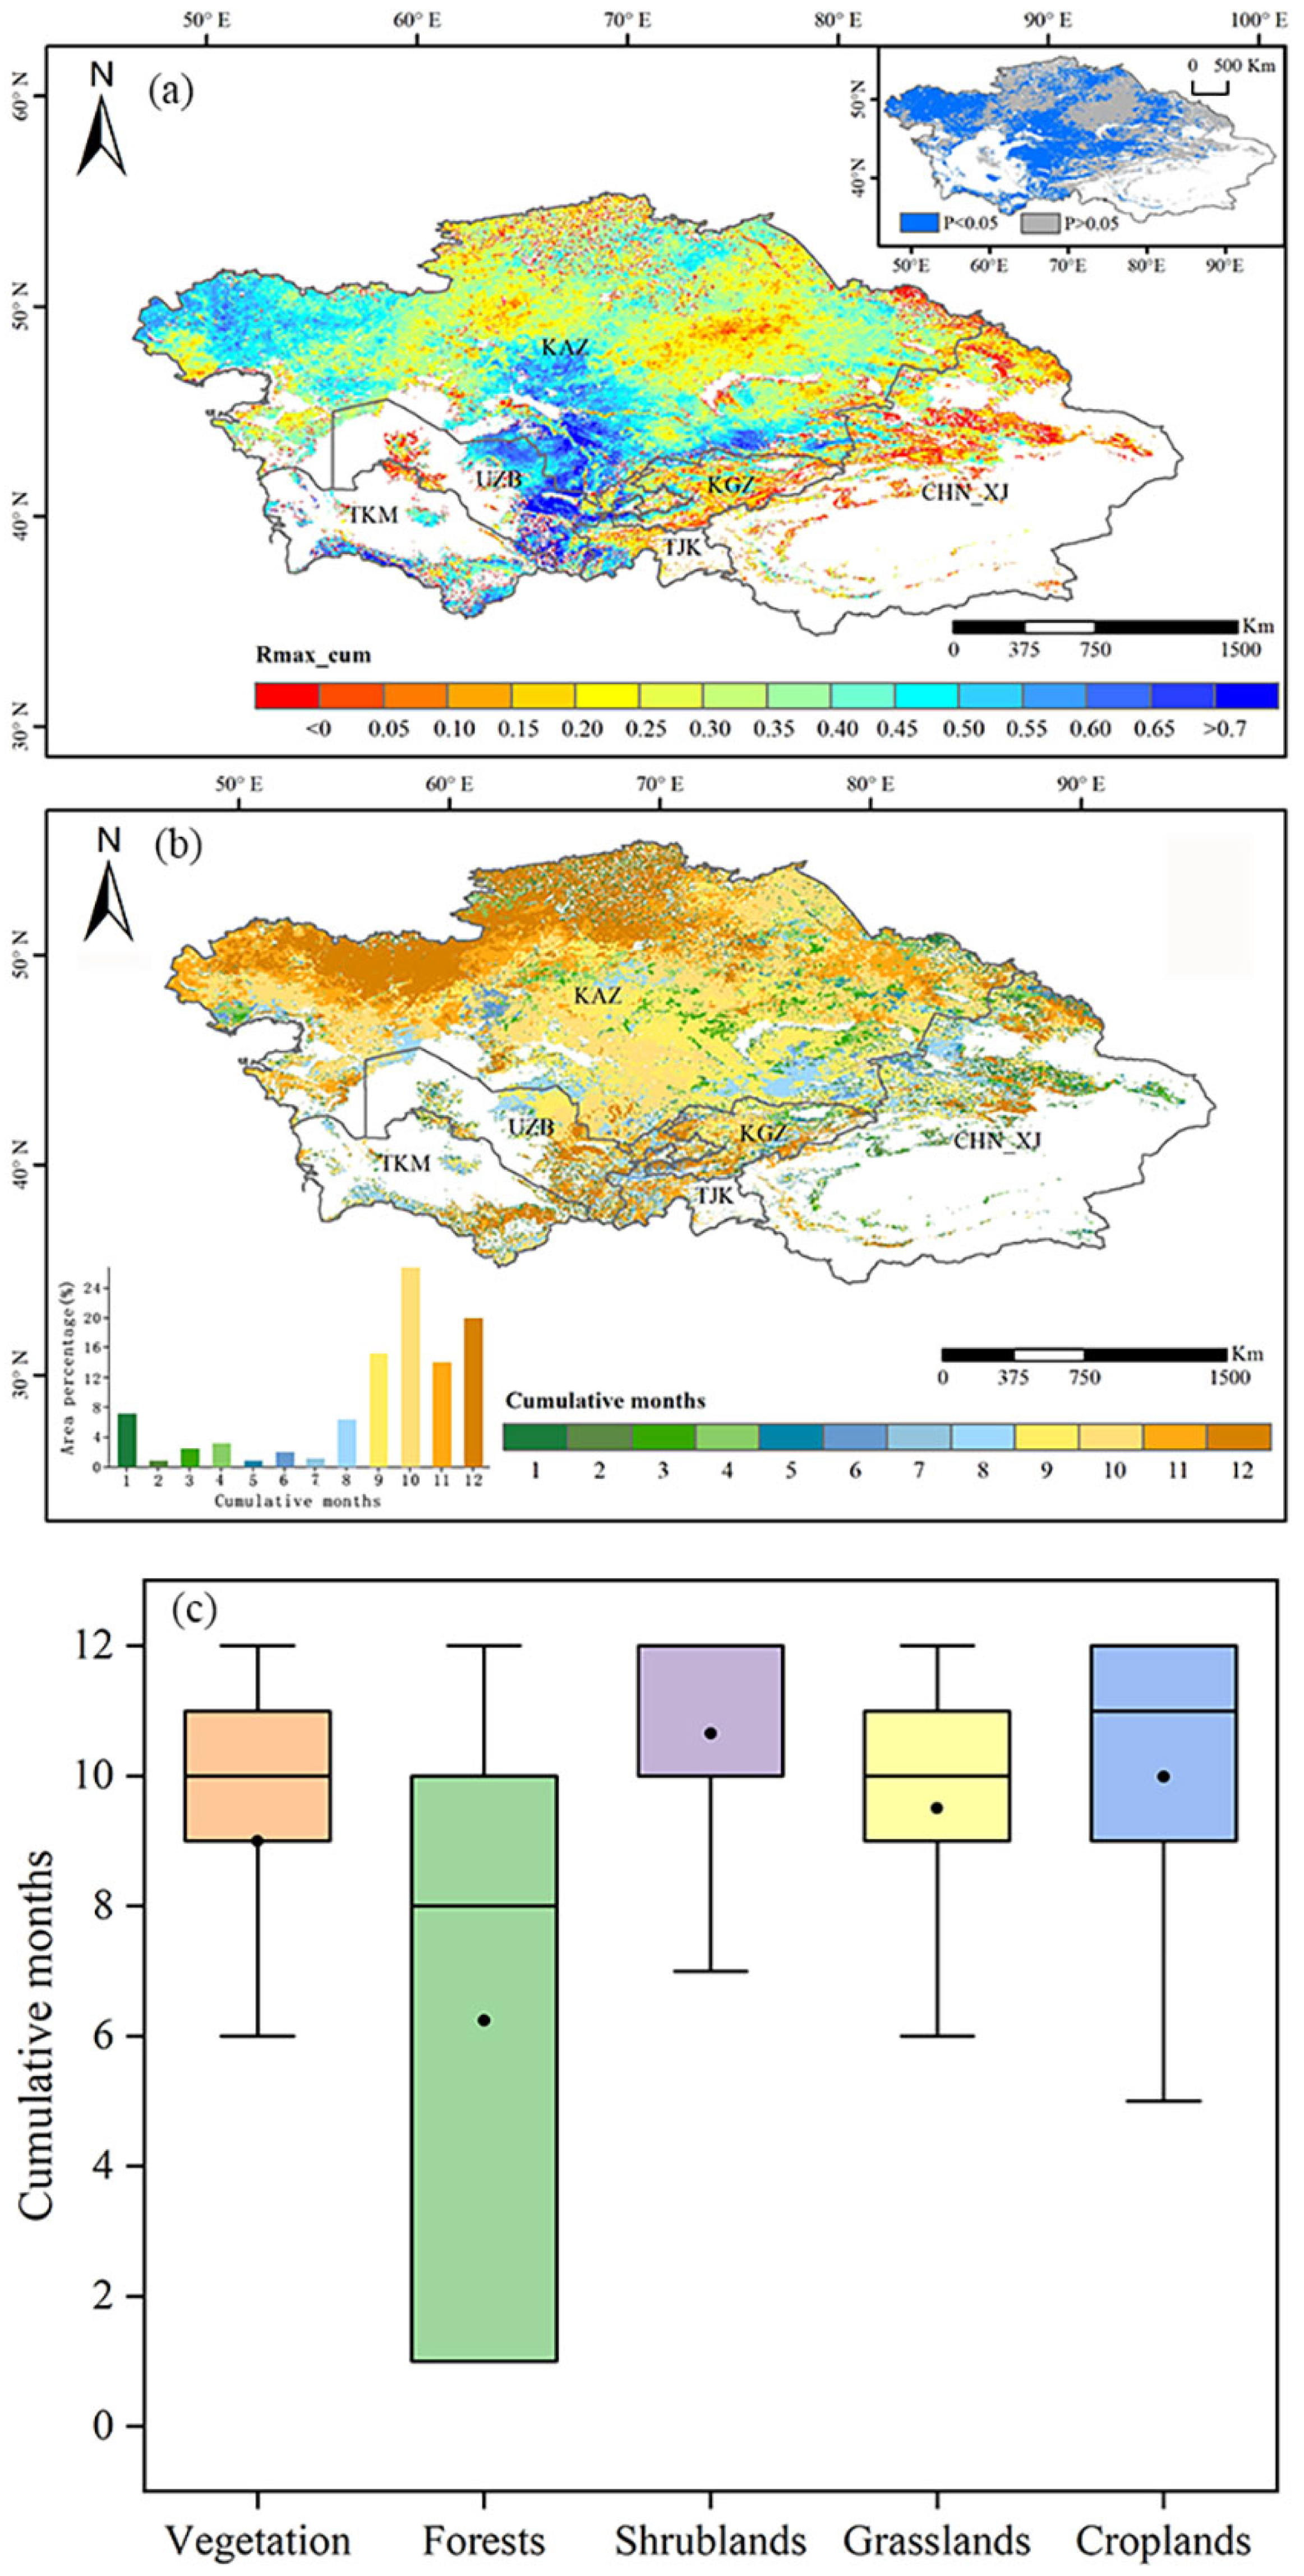
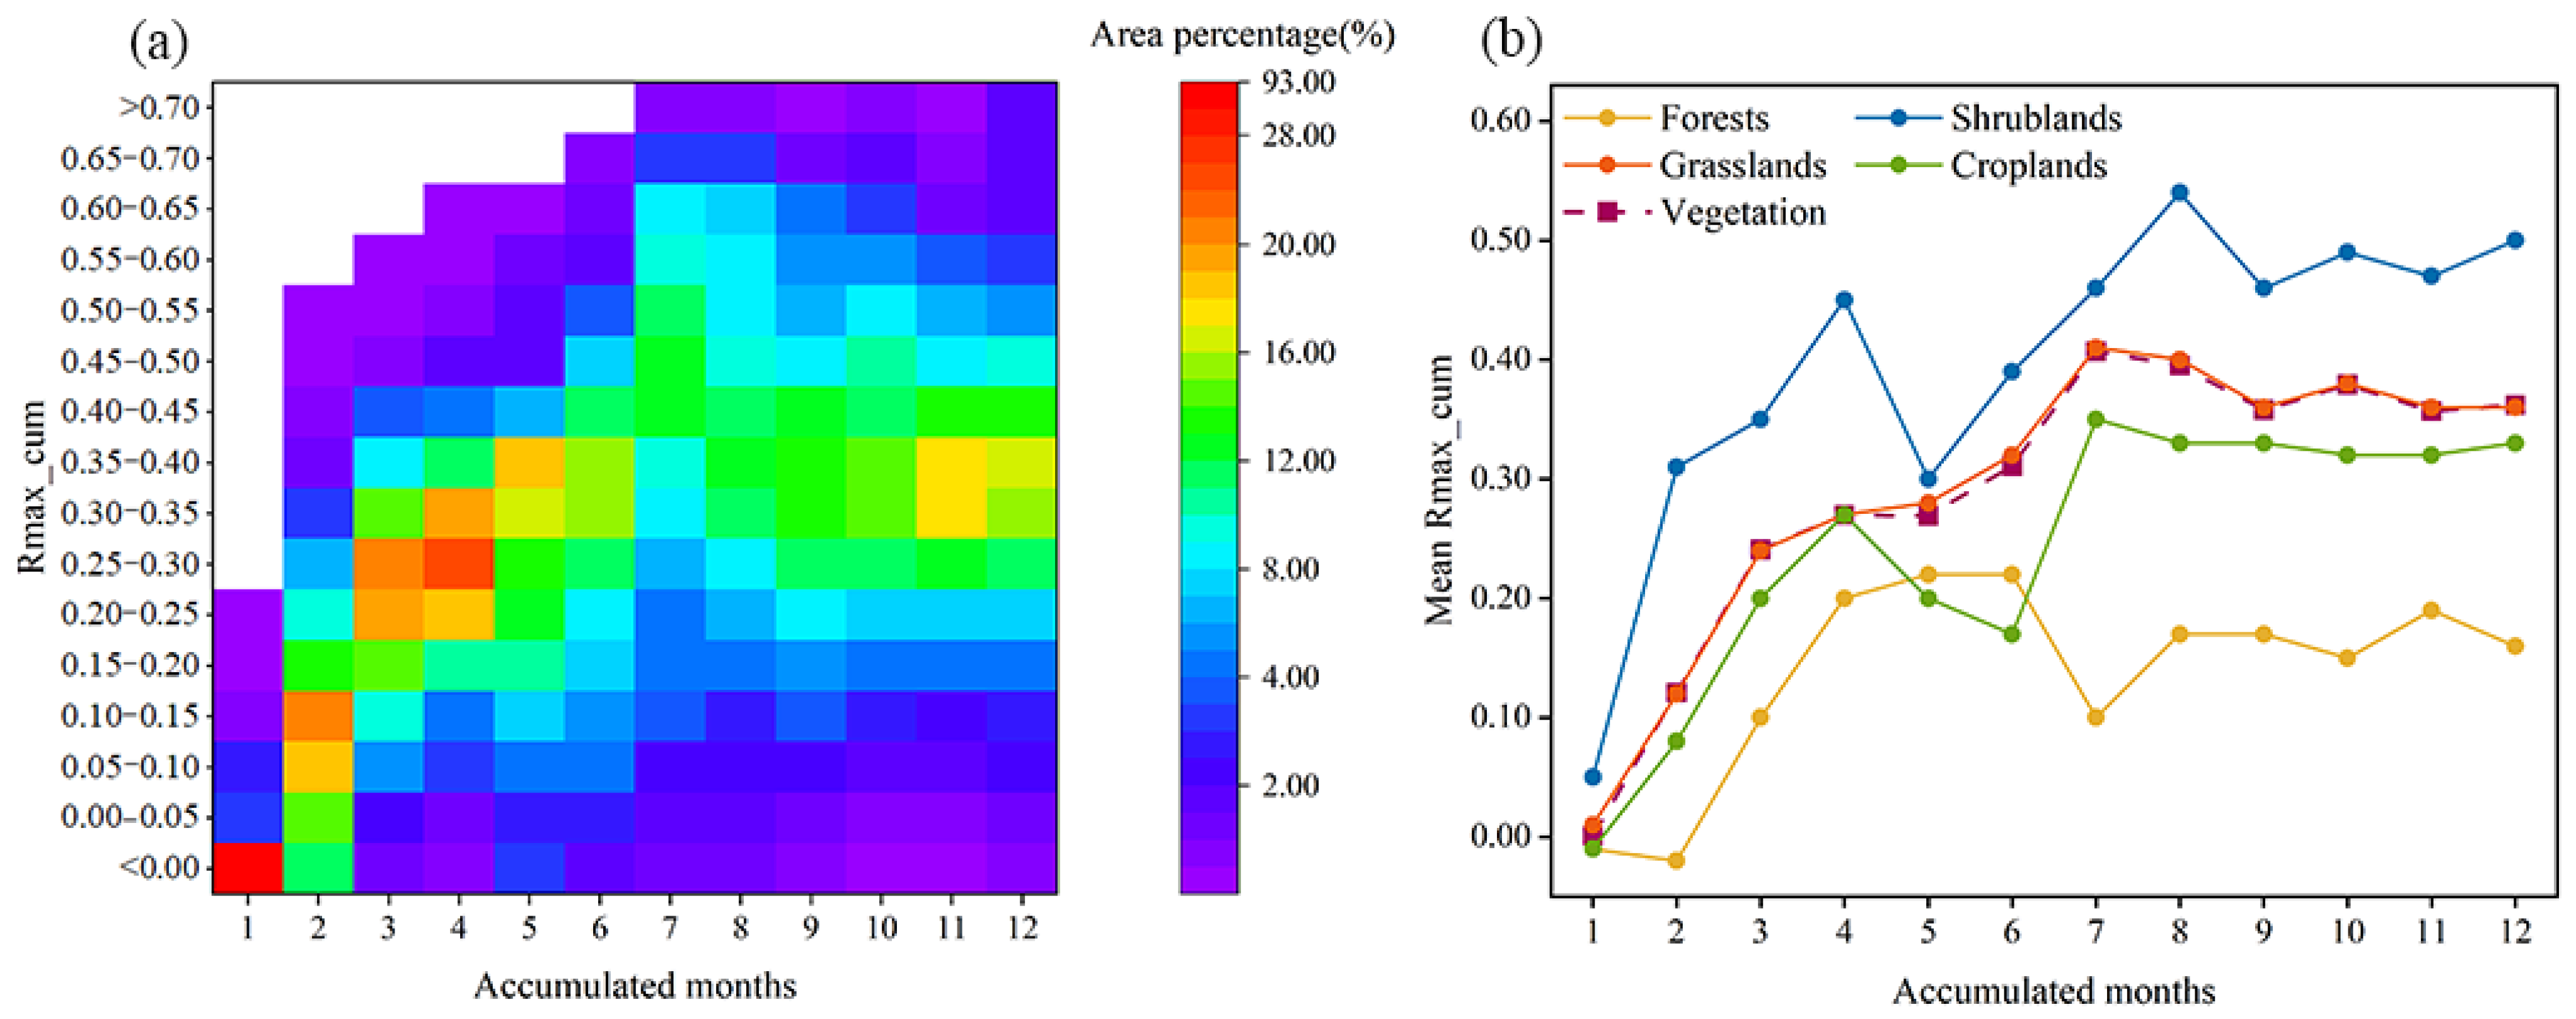
In Central Asia, 75.86% of the regional drought on vegetation accumulation months was concentrated at 9–12 months, and the maximum coefficients of the correlation between vegetation GPP and the n-month SPEI were concentrated in the range of 0.20–0.50. The coefficients of the correlation between vegetation GPP and the SPEI were largest when the average annual SPEI was close to −0.5–−0.4, and the areas of high correlation were mainly located in southern Kazakhstan and eastern Uzbekistan.
(4)
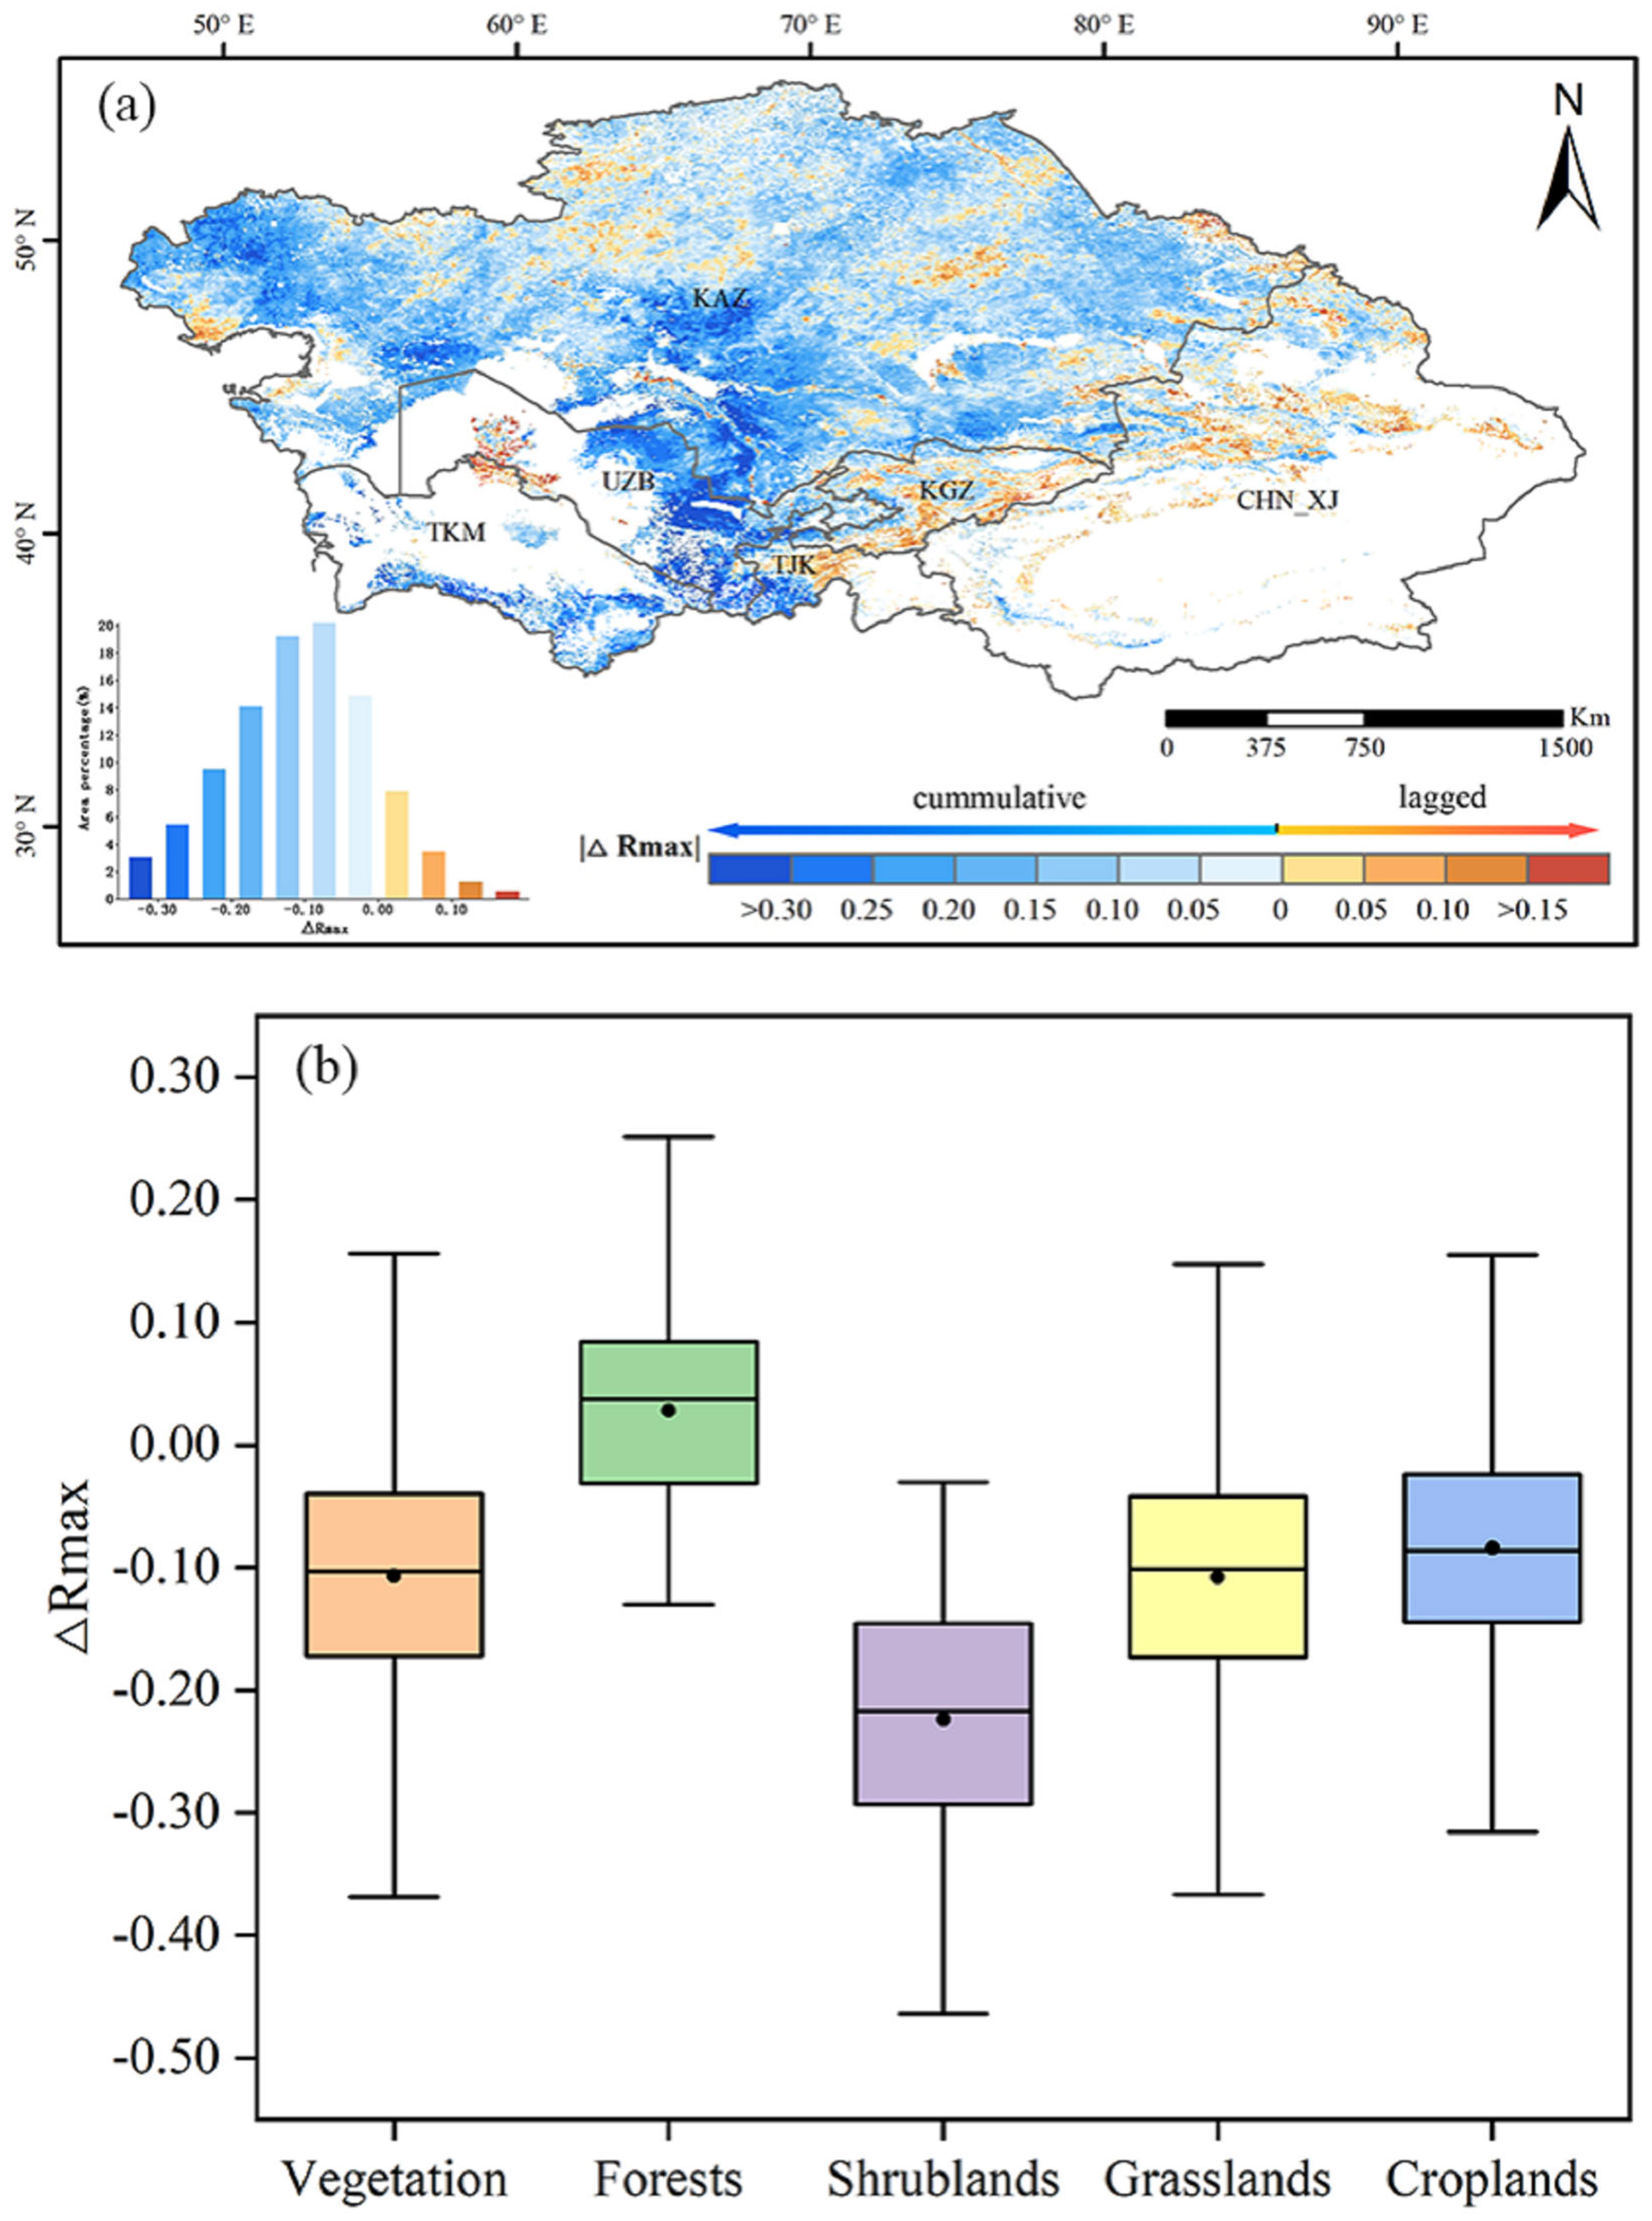
The cumulative effect of drought on vegetation was stronger than the lagged effect in 86.75% of the regions in Central Asia, with the cumulative effect being much larger than the lagged effect in scrubland and the cumulative effect being the dominant effect in southern Kazakhstan and eastern Uzbekistan.
Therefore, consideration of the cumulative effect of drought is essential in evaluating the influence of drought on vegetation growth. This research contributes to our more profound comprehension of the mechanism by which vegetation responds to drought in Central Asia and provides a helpful reference for coping with global climate change.

Author Contributions

M.Y. analyzed the data and wrote the manuscript; J.Z. conceived the ideas and revised the manuscript; J.D. contributed to the discussion and manuscript refinement; W.Z. made important contributions to the figures; H.Y. provided some of the research data. All authors have read and agreed to the published version of the manuscript.

Funding

This work was supported by the National Natural Science Foundation of China (Nos. 32260287 and 41961059), the Doctoral Research Start-up Fund Project of Xinjiang University (No. 620320025), the Sino-German interdisciplinary joint program for innovative talent training funded by the China Scholarship Council (CSC, No. 201807015008), and the Technology Innovation Team (Tianshan Innovation Team), Innovative Team for Efficient Utilization of Water Resources in Arid Regions (No. 2022TSYCTD0001).

Data Availability Statement

The data used in this study are available in the Section 2.

Conflicts of Interest

The authors declare no conflict of interest.

References

  1. Jia, L.; Li, Z.-B.; Xu, G.-C.; Ren, Z.-P.; Li, P.; Cheng, Y.-T.; Zhang, Y.-X.; Wang, B.; Zhang, J.-X.; Yu, S. Dynamic change of vegetation and its response to climate and topographic factors in the Xijiang River basin, China. Environ. Sci. Pollut. Res. 2020, 27, 11637–11648. [Google Scholar] [CrossRef]
  2. Zhang, H.; Zhan, C.; Xia, J.; Yeh, P.J.F. Responses of vegetation to changes in terrestrial water storage and temperature in global mountainous regions. Sci. Total Environ. 2022, 851, 158416. [Google Scholar] [CrossRef]
  3. Pei, T.; Hou, Q.; Chen, Y.; Ji, Z.; Wu, H.; Xie, B.; Qi, P.; Zhang, J. Vegetation in Arid Areas of the Loess Plateau Showed More Sensitivity of Water-Use Efficiency to Seasonal Drought. Forests 2022, 13, 634. [Google Scholar] [CrossRef]
  4. Nicolai-Shaw, N.; Zscheischler, J.; Hirschi, M.; Gudmundsson, L.; Seneviratne, S.I. A drought event composite analysis using satellite remote-sensing based soil moisture. Remote Sens. Environ. 2017, 203, 216–225. [Google Scholar] [CrossRef]
  5. Mpelasoka, F.; Awange, J.L.; Goncalves, R.M. Accounting for dynamics of mean precipitation in drought projections: A case study of Brazil for the 2050 and 2070 periods. Sci. Total Environ. 2018, 622–623, 1519–1531. [Google Scholar] [CrossRef] [PubMed]
  6. Wu, X.; Hao, Z.; Tang, Q.; Singh, V.P.; Zhang, X.; Hao, F. Projected increase in compound dry and hot events over global land areas. Int. J. Climatol. 2021, 41, 393–403. [Google Scholar] [CrossRef]
  7. Backhaus, S.; Kreyling, J.; Grant, K.; Beierkuhnlein, C.; Walter, J.; Jentsch, A. Recurrent Mild Drought Events Increase Resistance Toward Extreme Drought Stress. Ecosystems 2014, 17, 1068–1081. [Google Scholar] [CrossRef]
  8. Farrell, C.; Szota, C.; Arndt, S.K. Does the turgor loss point characterize drought response in dryland plants? Plant Cell Environ. 2017, 40, 1500–1511. [Google Scholar] [CrossRef]
  9. Xu, C.; McDowell, N.G.; Fisher, R.A.; Wei, L.; Sevanto, S.; Christoffersen, B.O.; Weng, E.; Middleton, R.S. Increasing impacts of extreme droughts on vegetation productivity under climate change. Nat. Clim. Change 2019, 9, 948–953. [Google Scholar] [CrossRef]
  10. Berdugo, M.; Delgado-Baquerizo, M.; Soliveres, S.; Hernández-Clemente, R.; Zhao, Y.; Gaitán, J.J.; Gross, N.; Saiz, H.; Maire, V.; Lehmann, A.; et al. Global ecosystem thresholds driven by aridity. Science 2020, 367, 787–790. [Google Scholar] [CrossRef]
  11. Wei, X.; He, W.; Zhou, Y.; Cheng, N.; Xiao, J.; Bi, W.; Liu, Y.; Sun, S.; Ju, W. Increased Sensitivity of Global Vegetation Productivity to Drought Over the Recent Three Decades. J. Geophys. Res. Atmos. 2023, 128, e2022JD037504. [Google Scholar] [CrossRef]
  12. Herberich, M.M.; Schädle, J.E.; Tielbörger, K. Plant community productivity and soil water are not resistant to extreme experimental drought in temperate grasslands but in the understory of temperate forests. Sci. Total Environ. 2023, 891, 164625. [Google Scholar] [CrossRef] [PubMed]
  13. Zhou, Z.; Liu, S.; Ding, Y.; Fu, Q.; Wang, Y.; Cai, H.; Shi, H. Assessing the responses of vegetation to meteorological drought and its influencing factors with partial wavelet coherence analysis. J. Environ. Manag. 2022, 311, 114879. [Google Scholar] [CrossRef] [PubMed]
  14. Zhao, A.; Zhang, A.; Cao, S.; Liu, X.; Liu, J.; Cheng, D. Responses of vegetation productivity to multi-scale drought in Loess Plateau, China. CATENA 2018, 163, 165–171. [Google Scholar] [CrossRef]
  15. Thi, N.Q.; Govind, A.; Le, M.-H.; Linh, N.T.; Anh, T.T.M.; Hai, N.K.; Ha, T.V. Spatiotemporal characterization of droughts and vegetation response in Northwest Africa from 1981 to 2020. Egypt. J. Remote Sens. Space Sci. 2023, 26, 393–401. [Google Scholar] [CrossRef]
  16. Liu, X.; Ren, L.; Yuan, F.; Xu, J.; Liu, W. Assessing vegetation response to drought in the Laohahe catchment, North China. Hydrol. Res. 2012, 43, 91–101. [Google Scholar] [CrossRef]
  17. Vicente-Serrano, S.M. Evaluating the Impact of Drought Using Remote Sensing in a Mediterranean, Semi-arid Region. Nat. Hazards 2007, 40, 173–208. [Google Scholar] [CrossRef]
  18. Shinoda, M.; Nachinshonhor, G.U.; Nemoto, M. Impact of drought on vegetation dynamics of the Mongolian steppe: A field experiment. J. Arid Environ. 2010, 74, 63–69. [Google Scholar] [CrossRef]
  19. Ji, L.; Peters, A.J. Assessing vegetation response to drought in the northern Great Plains using vegetation and drought indices. Remote Sens. Environ. 2003, 87, 85–98. [Google Scholar] [CrossRef]
  20. Shi, X.; Ding, H.; Wu, M.; Zhang, N.; Shi, M.; Chen, F.; Li, Y. Effects of different types of drought on vegetation in Huang-Huai-Hai River Basin, China. Ecol. Indic. 2022, 144, 109428. [Google Scholar] [CrossRef]
  21. Zhao, Z.; Zhang, Y.; Liu, L.; Hu, Z. The impact of drought on vegetation conditions within the Damqu River Basin, Yangtze River Source Region, China. PLoS ONE 2018, 13, e0202966. [Google Scholar] [CrossRef] [PubMed]
  22. Liu, S.; Zhang, Y.; Cheng, F.; Hou, X.; Zhao, S. Response of Grassland Degradation to Drought at Different Time-Scales in Qinghai Province: Spatio-Temporal Characteristics, Correlation, and Implications. Remote Sens. 2017, 9, 1329. [Google Scholar] [CrossRef]
  23. Zeng, Z.; Wu, W.; Ge, Q.; Li, Z.; Wang, X.; Zhou, Y.; Zhang, Z.; Li, Y.; Huang, H.; Liu, G.; et al. Legacy effects of spring phenology on vegetation growth under preseason meteorological drought in the Northern Hemisphere. Agric. For. Meteorol. 2021, 310, 108630. [Google Scholar] [CrossRef]
  24. Papagiannopoulou, C.; Miralles, D.G.; Dorigo, W.A.; Verhoest, N.E.C.; Depoorter, M.; Waegeman, W. Vegetation anomalies caused by antecedent precipitation in most of the world. Environ. Res. Lett. 2017, 12, 074016. [Google Scholar] [CrossRef]
  25. He, B.; Huang, L.; Chen, Z.; Wang, H. Weakening sensitivity of global vegetation to long-term droughts. Sci. China Earth Sci. 2018, 61, 60–70. [Google Scholar] [CrossRef]
  26. Gouveia, C.; Trigo, R.M.; DaCamara, C.C. Drought and vegetation stress monitoring in Portugal using satellite data. Nat. Hazards Earth Syst. Sci. 2009, 9, 185–195. [Google Scholar] [CrossRef]
  27. Zhang, Z.; Ju, W.; Zhou, Y.; Li, X. Revisiting the cumulative effects of drought on global gross primary productivity based on new long-term series data (1982–2018). Glob. Change Biol. 2022, 28, 3620–3635. [Google Scholar] [CrossRef]
  28. Yin, Y.; Liu, H.; Liu, G.; Hao, Q.; Wang, H. Vegetation responses to mid-Holocene extreme drought events and subsequent long-term drought on the southeastern Inner Mongolian Plateau, China. Agric. For. Meteorol. 2013, 178–179, 3–9. [Google Scholar] [CrossRef]
  29. Ding, Y.; Li, Z.; Peng, S. Global analysis of time-lag and -accumulation effects of climate on vegetation growth. Int. J. Appl. Earth Obs. Geoinf. 2020, 92, 102179. [Google Scholar] [CrossRef]
  30. Peng, J.; Wu, C.; Zhang, X.; Wang, X.; Gonsamo, A. Satellite detection of cumulative and lagged effects of drought on autumn leaf senescence over the Northern Hemisphere. Glob. Change Biol. 2019, 25, 2174–2188. [Google Scholar] [CrossRef]
  31. Ma, Y.; Guan, Q.; Sun, Y.; Zhang, J.; Yang, L.; Yang, E.; Li, H.; Du, Q. Three-dimensional dynamic characteristics of vegetation and its response to climatic factors in the Qilian Mountains. CATENA 2022, 208, 105694. [Google Scholar] [CrossRef]
  32. Jiao, T.; Williams, C.A.; De Kauwe, M.G.; Medlyn, B.E. Limited Evidence of Cumulative Effects From Recurrent Droughts in Vegetation Responses to Australia’s Millennium Drought. J. Geophys. Res. Biogeosci. 2023, 128, e2022JG006818. [Google Scholar] [CrossRef]
  33. Yuan, Y.; Bao, A.; Liu, T.; Zheng, G.; Jiang, L.; Guo, H.; Jiang, P.; Yu, T.; De Maeyer, P. Assessing vegetation stability to climate variability in Central Asia. J. Environ. Manag. 2021, 298, 113330. [Google Scholar] [CrossRef] [PubMed]
  34. Orth, R.; Destouni, G.; Jung, M.; Reichstein, M. Large-scale biospheric drought response intensifies linearly with drought duration in arid regions. Biogeosciences 2020, 17, 2647–2656. [Google Scholar] [CrossRef]
  35. Zhu, R.; Wu, F.; Zhou, S.; Hu, T.; Huang, J.; Gao, Y. Cumulative effects of drought–flood abrupt alternation on the photosynthetic characteristics of rice. Environ. Exp. Bot. 2020, 169, 103901. [Google Scholar] [CrossRef]
  36. Wu, C.; Wang, T. Evaluating Cumulative Drought Effect on Global Vegetation Photosynthesis Using Numerous GPP Products. Front. Environ. Sci. 2022, 10, 908875. [Google Scholar] [CrossRef]
  37. Lin, S.; Li, J.; Liu, Q.; Gioli, B.; Paul-Limoges, E.; Buchmann, N.; Gharun, M.; Hörtnagl, L.; Foltýnová, L.; Dušek, J.; et al. Improved global estimations of gross primary productivity of natural vegetation types by incorporating plant functional type. Int. J. Appl. Earth Obs. Geoinf. 2021, 100, 102328. [Google Scholar] [CrossRef]
  38. Schickling, A.; Matveeva, M.; Damm, A.; Schween, J.H.; Wahner, A.; Graf, A.; Crewell, S.; Rascher, U. Combining Sun-Induced Chlorophyll Fluorescence and Photochemical Reflectance Index Improves Diurnal Modeling of Gross Primary Productivity. Remote Sens. 2016, 8, 574. [Google Scholar] [CrossRef]
  39. Pickering, M.; Cescatti, A.; Duveiller, G. Sun-induced fluorescence as a proxy for primary productivity across vegetation types and climates. Biogeosciences 2022, 19, 4833–4864. [Google Scholar] [CrossRef]
  40. Song, Y.; Jiao, W.; Wang, J.; Wang, L. Increased Global Vegetation Productivity Despite Rising Atmospheric Dryness Over the Last Two Decades. Earth’s Future 2022, 10, e2021EF002634. [Google Scholar] [CrossRef]
  41. Ge, W.; Han, J.; Zhang, D.; Wang, F. Divergent impacts of droughts on vegetation phenology and productivity in the Yungui Plateau, southwest China. Ecol. Indic. 2021, 127, 107743. [Google Scholar] [CrossRef]
  42. Qiu, R.; Han, G.; Ma, X.; Xu, H.; Shi, T.; Zhang, M. A Comparison of OCO-2 SIF, MODIS GPP, and GOSIF Data from Gross Primary Production (GPP) Estimation and Seasonal Cycles in North America. Remote Sens. 2020, 12, 258. [Google Scholar] [CrossRef]
  43. Qiu, R.; Li, X.; Han, G.; Xiao, J.; Ma, X.; Gong, W. Monitoring drought impacts on crop productivity of the U.S. Midwest with solar-induced fluorescence: GOSIF outperforms GOME-2 SIF and MODIS NDVI, EVI, and NIRv. Agric. For. Meteorol. 2022, 323, 109038. [Google Scholar] [CrossRef]
  44. Waseem, M.; Ajmal, M.; Kim, T.-W. Development of a new composite drought index for multivariate drought assessment. J. Hydrol. 2015, 527, 30–37. [Google Scholar] [CrossRef]
  45. Rahiz, M.; New, M. Does a rainfall-based drought index simulate hydrological droughts? Int. J. Climatol. 2014, 34, 2853–2871. [Google Scholar] [CrossRef]
  46. Zarei, A.R. Evaluation of Drought Condition in Arid and Semi- Arid Regions, Using RDI Index. Water Resour. Manag. 2018, 32, 1689–1711. [Google Scholar] [CrossRef]
  47. Liu, Q.; Zhang, S.; Zhang, H.; Bai, Y.; Zhang, J. Monitoring drought using composite drought indices based on remote sensing. Sci. Total Environ. 2020, 711, 134585. [Google Scholar] [CrossRef] [PubMed]
  48. Tsakiris, G.; Pangalou, D.; Vangelis, H. Regional Drought Assessment Based on the Reconnaissance Drought Index (RDI). Water Resour. Manag. 2007, 21, 821–833. [Google Scholar] [CrossRef]
  49. Liu, X.; Pan, Y.; Zhu, X.; Yang, T.; Bai, J.; Sun, Z. Drought evolution and its impact on the crop yield in the North China Plain. J. Hydrol. 2018, 564, 984–996. [Google Scholar] [CrossRef]
  50. Yu, H.; Wang, L.; Zhang, J.; Chen, Y. A global drought-aridity index: The spatiotemporal standardized precipitation evapotranspiration index. Ecol. Indic. 2023, 153, 110484. [Google Scholar] [CrossRef]
  51. Vicente-Serrano, S.M.; Beguería, S.; López-Moreno, J.I. A Multiscalar Drought Index Sensitive to Global Warming: The Standardized Precipitation Evapotranspiration Index. J. Clim. 2010, 23, 1696–1718. [Google Scholar] [CrossRef]
  52. Tirivarombo, S.; Osupile, D.; Eliasson, P. Drought monitoring and analysis: Standardised Precipitation Evapotranspiration Index (SPEI) and Standardised Precipitation Index (SPI). Phys. Chem. Earth Parts A/B/C 2018, 106, 1–10. [Google Scholar] [CrossRef]
  53. Cowan, P.J. Geographic usage of the terms Middle Asia and Central Asia. J. Arid Environ. 2007, 69, 359–363. [Google Scholar] [CrossRef]
  54. Hu, Z.; Zhang, C.; Hu, Q.; Tian, H. Temperature Changes in Central Asia from 1979 to 2011 Based on Multiple Datasets. J. Clim. 2014, 27, 1143–1167. [Google Scholar] [CrossRef]
  55. Pyarali, K.; Peng, J.; Disse, M.; Tuo, Y. Development and application of high resolution SPEI drought dataset for Central Asia. Sci. Data 2022, 9, 172. [Google Scholar] [CrossRef] [PubMed]
  56. Luo, M.; Sa, C.; Meng, F.; Duan, Y.; Liu, T.; Bao, Y. Assessing extreme climatic changes on a monthly scale and their implications for vegetation in Central Asia. J. Clean. Prod. 2020, 271, 122396. [Google Scholar] [CrossRef]
  57. Yu, Y.; Pi, Y.; Yu, X.; Ta, Z.; Sun, L.; Disse, M.; Zeng, F.; Li, Y.; Chen, X.; Yu, R. Climate change, water resources and sustainable development in the arid and semi-arid lands of Central Asia in the past 30 years. J. Arid Land 2019, 11, 1–14. [Google Scholar] [CrossRef]
  58. Dou, X.; Ma, X.; Zhao, C.; Li, J.; Yan, Y.; Zhu, J. Risk assessment of soil erosion in Central Asia under global warming. CATENA 2022, 212, 106056. [Google Scholar] [CrossRef]
  59. Zhang, T.; Liu, K.; Fan, Y.; Yu, S.; Zhang, R.; Shang, H.; Yuan, Y.; Wei, W.; He, Q.; Zhang, H.; et al. Status and prospects of tree-ring research in Central Asia. Dendrochronologia 2023, 78, 126069. [Google Scholar] [CrossRef]
  60. Yuan, X.; Wang, W.; Cui, J.; Meng, F.; Kurban, A.; De Maeyer, P. Vegetation changes and land surface feedbacks drive shifts in local temperatures over Central Asia. Sci. Rep. 2017, 7, 3287. [Google Scholar] [CrossRef]
  61. Jiang, L.; Jiapaer, G.; Bao, A.; Guo, H.; Ndayisaba, F. Vegetation dynamics and responses to climate change and human activities in Central Asia. Sci. Total Environ. 2017, 599–600, 967–980. [Google Scholar] [CrossRef]
  62. Yang, P.; van der Tol, C. Linking canopy scattering of far-red sun-induced chlorophyll fluorescence with reflectance. Remote Sens. Environ. 2018, 209, 456–467. [Google Scholar] [CrossRef]
  63. Liu, X.; Liu, Z.; Liu, L.; Lu, X.; Chen, J.; Du, S.; Zou, C. Modelling the influence of incident radiation on the SIF-based GPP estimation for maize. Agric. For. Meteorol. 2021, 307, 108522. [Google Scholar] [CrossRef]
  64. Zhang, L.; Qiao, N.; Huang, C.; Wang, S. Monitoring Drought Effects on Vegetation Productivity Using Satellite Solar-Induced Chlorophyll Fluorescence. Remote Sens. 2019, 11, 378. [Google Scholar] [CrossRef]
  65. Yang, P.; van der Tol, C.; Campbell, P.K.E.; Middleton, E.M. Unraveling the physical and physiological basis for the solar- induced chlorophyll fluorescence and photosynthesis relationship using continuous leaf and canopy measurements of a corn crop. Biogeosciences 2021, 18, 441–465. [Google Scholar] [CrossRef]
  66. Lu, X.; Liu, Z.; Zhao, F.; Tang, J. Comparison of total emitted solar-induced chlorophyll fluorescence (SIF) and top-of-canopy (TOC) SIF in estimating photosynthesis. Remote Sens. Environ. 2020, 251, 112083. [Google Scholar] [CrossRef]
  67. Li, X.; Xiao, J. A Global, 0.05-Degree Product of Solar-Induced Chlorophyll Fluorescence Derived from OCO-2, MODIS, and Reanalysis Data. Remote Sens. 2019, 11, 517. [Google Scholar] [CrossRef]
  68. Marsh, H.; Zhang, W. Direct and Legacy Effects of Spring Temperature Anomalies on Seasonal Productivity in Northern Ecosystems. Remote Sens. 2022, 14, 2007. [Google Scholar] [CrossRef]
  69. Marandi, M.; Parida, B.R.; Ghosh, S. Retrieving vegetation biophysical parameters and GPP using satellite-driven LUE model in a National Park. Environ. Dev. Sustain. 2022, 24, 9118–9138. [Google Scholar] [CrossRef]
  70. Potop, V.; Boroneanţ, C.; Možný, M.; Štěpánek, P.; Skalák, P. Observed spatiotemporal characteristics of drought on various time scales over the Czech Republic. Theor. Appl. Climatol. 2014, 115, 563–581. [Google Scholar] [CrossRef]
  71. Bento, V.A.; Gouveia, C.M.; DaCamara, C.C.; Trigo, I.F. A climatological assessment of drought impact on vegetation health index. Agric. For. Meteorol. 2018, 259, 286–295. [Google Scholar] [CrossRef]
  72. Bai, Y.; Li, S. Growth peak of vegetation and its response to drought on the Mongolian Plateau. Ecol. Indic. 2022, 141, 109150. [Google Scholar] [CrossRef]
  73. Friedl, M.A.; Sulla-Menashe, D.; Tan, B.; Schneider, A.; Ramankutty, N.; Sibley, A.; Huang, X. MODIS Collection 5 global land cover: Algorithm refinements and characterization of new datasets. Remote Sens. Environ. 2010, 114, 168–182. [Google Scholar] [CrossRef]
  74. Gu, X.; Guo, E.; Yin, S.; Wang, Y.; Mandula, N.; Wan, Z.; Yun, X.; Li, H.; Bao, Y. Differentiating cumulative and lagged effects of drought on vegetation growth over the Mongolian Plateau. Ecosphere 2022, 13, e4289. [Google Scholar] [CrossRef]
  75. Bae, S.; Lee, S.-H.; Yoo, S.-H.; Kim, T. Analysis of Drought Intensity and Trends Using the Modified SPEI in South Korea from 1981 to 2010. Water 2018, 10, 327. [Google Scholar] [CrossRef]
  76. Wang, Q.; Zeng, J.; Qi, J.; Zhang, X.; Zeng, Y.; Shui, W.; Xu, Z.; Zhang, R.; Wu, X.; Cong, J. A multi-scale daily SPEI dataset for drought characterization at observation stations over mainland China from 1961 to 2018. Earth Syst. Sci. Data 2021, 13, 331–341. [Google Scholar] [CrossRef]
  77. Ma, W.; Ding, J.; Wang, J.; Zhang, J. Effects of aerosol on terrestrial gross primary productivity in Central Asia. Atmos. Environ. 2022, 288, 119294. [Google Scholar] [CrossRef]
  78. Xu, H.-J.; Wang, X.-P.; Zhang, X.-X. Decreased vegetation growth in response to summer drought in Central Asia from 2000 to 2012. Int. J. Appl. Earth Obs. Geoinf. 2016, 52, 390–402. [Google Scholar] [CrossRef]
  79. Li, S.; He, S. The variation of net primary productivity and underlying mechanisms vary under different drought stress in Central Asia from 1990 to 2020. Agric. For. Meteorol. 2022, 314, 108767. [Google Scholar] [CrossRef]
  80. Wang, X.; Wang, T.; Guo, H.; Liu, D.; Zhao, Y.; Zhang, T.; Liu, Q.; Piao, S. Disentangling the mechanisms behind winter snow impact on vegetation activity in northern ecosystems. Glob. Change Biol. 2018, 24, 1651–1662. [Google Scholar] [CrossRef]
  81. Byakatonda, J.; Parida, B.P.; Moalafhi, D.B.; Kenabatho, P.K. Analysis of long term drought severity characteristics and trends across semiarid Botswana using two drought indices. Atmos. Res. 2018, 213, 492–508. [Google Scholar] [CrossRef]
  82. Liu, Y.; Zhou, R.; Wen, Z.; Khalifa, M.; Zheng, C.; Ren, H.; Zhang, Z.; Wang, Z. Assessing the impacts of drought on net primary productivity of global land biomes in different climate zones. Ecol. Indic. 2021, 130, 108146. [Google Scholar] [CrossRef]
  83. Wang, C.; Li, Z.; Chen, Y.; Li, Y.; Liu, X.; Hou, Y.; Wang, X.; Kulaixi, Z.; Sun, F. Increased Compound Droughts and Heatwaves in a Double Pack in Central Asia. Remote Sens. 2022, 14, 2959. [Google Scholar] [CrossRef]
  84. Yan, X.; Cheng, P.; Zhang, Q.; Li, X.; He, J.; Yan, X.; Zhao, W.; Wang, L. Comparisons of climate change characteristics in typical arid regions of the Northern Hemisphere. Front. Environ. Sci. 2022, 10, 1033326. [Google Scholar] [CrossRef]
  85. Zou, J.; Ding, J.; Huang, S.; Liu, B. Ecosystem Resistance and Resilience after Dry and Wet Events across Central Asia Based on Remote Sensing Data. Remote Sens. 2023, 15, 3165. [Google Scholar] [CrossRef]
  86. Ta, Z.; Yu, R.; Chen, X.; Mu, G.; Guo, Y. Analysis of the Spatio-Temporal Patterns of Dry and Wet Conditions in Central Asia. Atmosphere 2018, 9, 7. [Google Scholar] [CrossRef]
  87. Schwalm, C.R.; Anderegg, W.R.L.; Michalak, A.M.; Fisher, J.B.; Biondi, F.; Koch, G.; Litvak, M.; Ogle, K.; Shaw, J.D.; Wolf, A.; et al. Global patterns of drought recovery. Nature 2017, 548, 202–205. [Google Scholar] [CrossRef]
  88. Zhang, J.; Campana, P.E.; Yao, T.; Zhang, Y.; Lundblad, A.; Melton, F.; Yan, J. The water-food-energy nexus optimization approach to combat agricultural drought: A case study in the United States. Appl. Energy 2018, 227, 449–464. [Google Scholar] [CrossRef]
  89. Zhang, R.; Zhao, C.; Ma, X.; Brindha, K.; Han, Q.; Li, C.; Zhao, X. Projected Spatiotemporal Dynamics of Drought under Global Warming in Central Asia. Sustainability 2019, 11, 4421. [Google Scholar] [CrossRef]
  90. Sun, Y.; Chen, X.; Yu, Y.; Qian, J.; Wang, M.; Huang, S.; Xing, X.; Song, S.; Sun, X. Spatiotemporal Characteristics of Drought in Central Asia from 1981 to 2020. Atmosphere 2022, 13, 1496. [Google Scholar] [CrossRef]
  91. Huang, M.; Wang, X.; Keenan, T.F.; Piao, S. Drought timing influences the legacy of tree growth recovery. Glob. Change Biol. 2018, 24, 3546–3559. [Google Scholar] [CrossRef] [PubMed]
  92. Zhang, W.; Wei, F.; Horion, S.; Fensholt, R.; Forkel, M.; Brandt, M. Global quantification of the bidirectional dependency between soil moisture and vegetation productivity. Agric. For. Meteorol. 2022, 313, 108735. [Google Scholar] [CrossRef]
  93. Li, S.; Sawada, Y. Soil moisture-vegetation interaction from near-global in-situ soil moisture measurements. Environ. Res. Lett. 2022, 17, 114028. [Google Scholar] [CrossRef]
  94. Tong, S.; Bao, Y.; Te, R.; Ma, Q.; Ha, S.; Lusi, A. Analysis of Drought Characteristics in Xilingol Grassland of Northern China Based on SPEI and Its Impact on Vegetation. Math. Probl. Eng. 2017, 2017, 5209173. [Google Scholar] [CrossRef]
  95. Wei, X.; He, W.; Zhou, Y.; Ju, W.; Xiao, J.; Li, X.; Liu, Y.; Xu, S.; Bi, W.; Zhang, X.; et al. Global assessment of lagged and cumulative effects of drought on grassland gross primary production. Ecol. Indic. 2022, 136, 108646. [Google Scholar] [CrossRef]
  96. Zhang, W.; Li, Y.; Wu, X.; Chen, Y.; Chen, A.; Schwalm, C.R.; Kimball, J.S. Divergent Response of Vegetation Growth to Soil Water Availability in Dry and Wet Periods Over Central Asia. J. Geophys. Res. Biogeosci. 2021, 126, e2020JG005912. [Google Scholar] [CrossRef]
  97. Li, J.; Song, F.; Jin, Y.; Yun, R.; Chen, Z.; Lyu, Z.; Zhao, Y.; Cui, D. Critical temperatures controlling the phenology and radial growth of Pinus sylvestris var. Mongolica on the southern margin of a cold temperate coniferous forest. Ecol. Indic. 2021, 126, 107674. [Google Scholar] [CrossRef]
  98. Zhou, R.; Liu, Y.; Cui, M.; Lu, J.; Shi, H.; Ren, H.; Zhang, W.; Wen, Z. Global Assessment of Cumulative and Time-Lag Effects of Drought on Land Surface Phenology. GIScience Remote Sens. 2022, 59, 1918–1937. [Google Scholar] [CrossRef]
  99. Zhang, J.; Hao, X.; Hao, H.; Fan, X.; Li, Y. Climate Change Decreased Net Ecosystem Productivity in the Arid Region of Central Asia. Remote Sens. 2021, 13, 4449. [Google Scholar] [CrossRef]
  100. Wang, D.; Yue, D.; Zhou, Y.; Huo, F.; Bao, Q.; Li, K. Drought Resistance of Vegetation and Its Change Characteristics before and after the Implementation of the Grain for Green Program on the Loess Plateau, China. Remote Sens. 2022, 14, 5142. [Google Scholar] [CrossRef]
  101. Miller, D.L.; Alonzo, M.; Roberts, D.A.; Tague, C.L.; McFadden, J.P. Drought response of urban trees and turfgrass using airborne imaging spectroscopy. Remote Sens. Environ. 2020, 240, 111646. [Google Scholar] [CrossRef]
  102. Amri, R.; Zribi, M.; Lili-Chabaane, Z.; Duchemin, B.; Gruhier, C.; Chehbouni, A. Analysis of Vegetation Behavior in a North African Semi-Arid Region, Using SPOT-VEGETATION NDVI Data. Remote Sens. 2011, 3, 2568–2590. [Google Scholar] [CrossRef]
  103. Özcan, Z.; Kentel, E.; Alp, E. Evaluation of the best management practices in a semi-arid region with high agricultural activity. Agric. Water Manag. 2017, 194, 160–171. [Google Scholar] [CrossRef]
  104. O, S.; Park, S.K. Flash drought drives rapid vegetation stress in arid regions in Europe. Environ. Res. Lett. 2023, 18, 014028. [Google Scholar] [CrossRef]
  105. Tang, G.; Carroll, R.W.H.; Lutz, A.; Sun, L. Regulation of precipitation-associated vegetation dynamics on catchment water balance in a semiarid and arid mountainous watershed. Ecohydrology 2016, 9, 1248–1262. [Google Scholar] [CrossRef]
  106. Wen, Y.; Liu, X.; Xin, Q.; Wu, J.; Xu, X.; Pei, F.; Li, X.; Du, G.; Cai, Y.; Lin, K.; et al. Cumulative Effects of Climatic Factors on Terrestrial Vegetation Growth. J. Geophys. Res. Biogeosci. 2019, 124, 789–806. [Google Scholar] [CrossRef]
  107. Yuan, Y.; Bao, A.; Jiapaer, G.; Jiang, L.; De Maeyer, P. Phenology-based seasonal terrestrial vegetation growth response to climate variability with consideration of cumulative effect and biological carryover. Sci. Total Environ. 2022, 817, 152805. [Google Scholar] [CrossRef]
  108. Liu, N.; Ding, Y.; Peng, S. Temporal effects of climate on vegetation trigger the response biases of vegetation to human activities. Glob. Ecol. Conserv. 2021, 31, e01822. [Google Scholar] [CrossRef]
  109. de Dato, G.D.; Micali, M.; Abou Jaoudé, R.; Liberati, D.; De Angelis, P. Earlier summer drought affects leaf functioning of the Mediterranean species Cistus monspeliensis L. Environ. Exp. Bot. 2013, 93, 13–19. [Google Scholar] [CrossRef]
  110. Dong, H.; Hao, J.; Chen, Z.; Zhang, G.; Yan, M.; Wang, J. Root Water Uptake Patterns for Nitraria during the Growth Period Differing in Time Interval from a Precipitation Event in Arid Regions. Sustainability 2022, 14, 8203. [Google Scholar] [CrossRef]
  111. Wu, M.; Manzoni, S.; Vico, G.; Bastos, A.; de Vries, F.T.; Messori, G. Drought Legacy in Sub-Seasonal Vegetation State and Sensitivity to Climate Over the Northern Hemisphere. Geophys. Res. Lett. 2022, 49, e2022GL098700. [Google Scholar] [CrossRef]
  112. Zhang, Y.; Hong, S.; Liu, D.; Piao, S. Susceptibility of vegetation low-growth to climate extremes on Tibetan Plateau. Agric. For. Meteorol. 2023, 331, 109323. [Google Scholar] [CrossRef]
  113. Hoffmann, D.; Gallant, A.J.E.; Arblaster, J.M. Uncertainties in Drought From Index and Data Selection. J. Geophys. Res. Atmos. 2020, 125, e2019JD031946. [Google Scholar] [CrossRef]
Figure 1. Map of the study area. (a) Land cover types in the study area; (b) Elevation of the study area.
Forests 14 02142 g001
Figure 2. Steps for calculating the lagged and cumulative effects of drought on vegetation GPP.
Forests 14 02142 g002
Figure 3. Spatial distribution of average annual GPP of vegetation in Central Asia from 2000 to 2018.
Forests 14 02142 g003
Figure 4. Change in the average annual GPP of vegetation over time in Central Asia from 2000 to 2018.
Forests 14 02142 g004
Figure 5. Spatial distribution of annual mean SPEI of vegetation in Central Asia from 2000 to 2018.
Forests 14 02142 g005
Figure 6. Change in average annual SPEI over time in Central Asia from 2000 to 2018.
Forests 14 02142 g006
Figure 7. Distribution of the lagged effect of drought on vegetation. (a) Spatial distribution of Rmax_lag of vegetation GPP and 1-month SPEI from 2000 to 2018. The blue areas indicate statistically significant correlations (p < 0.05) and gray areas indicate statistically insignificant correlations (p > 0.05); (b) Spatial distribution and percentage area of lag months corresponding to Rmax_lag; (c) Distribution of lag months corresponding to Rmax_lag for different vegetation types.
Forests 14 02142 g007
Figure 8. Change in lagged effect correlation. (a) Percentage of area with different correlation coefficient classes in different lag months; (b) Mean correlation coefficients of different vegetation types in different lag months.
Forests 14 02142 g008
Figure 9. Relationship of annual mean SPEI with the (a) mean maximum correlation coefficient and (b) corresponding mean lagged months.
Forests 14 02142 g009
Figure 10. Distribution of the cumulative effect of drought on vegetation. (a) Characteristics of Rmax_cum spatial distribution of vegetation GPP and cumulative 1–12-month SPEI from 2000 to 2018. The blue areas indicate statistically significant correlations (p < 0.05) and gray areas indicate statistically insignificant correlations (p > 0.05); (b) Spatial distribution of cumulative months and percentage of area corresponding to Rmax_cum; (c) Distribution of cumulative months corresponding to Rmax_lag for different vegetation types.
Forests 14 02142 g010
Figure 11. Change in cumulative effect correlation. (a) Percentage of area with different correlation coefficient classes at different cumulative months; (b) Mean correlation coefficients of different vegetation types at different cumulative months.
Forests 14 02142 g011
Figure 12. Relationship of annual mean SPEI with (a) mean maximum correlation coefficient and (b) corresponding mean accumulated months.
Forests 14 02142 g012
Figure 13. Comparing lagged and cumulative effects. (a) Spatial distribution and area percentage of ΔRmax. (b) Comparison of ΔRmax across vegetation types. ΔRmax is the difference between Rmax_lag and Rmax_cum. ΔRmax > 0, lagged effect dominates; ΔRmax < 0, cumulative effect dominates.
Forests 14 02142 g013
Table 1. The data used in this study, including spatial and temporal resolutions, availability, and sources of acquisition.
DataSpatial ResolutionTemporal ResolutionAvailabilitySources of Acquisition
GPP data0.05°monthpublicly availablehttps://globalecology.unh.edu/ (accessed on 22 March 2022)
SPEI data0.5°monthpublicly availablehttps://spei.csic.es/database.html (accessed on 22 March 2022)
Vegetation Type data500 mannualpublicly availablehttps://ladsweb.modaps.eosdis.nasa.gov/search/order/1/MCD12Q1-6 (accessed on 16 April 2022)
Elevation data30 m---publicly availablehttps://dwtkns.com/srtm30m/ (accessed on 8 May 2022)
Table 2. SPEI-based drought and wet classification.
SPEIDrought and Wet Classification
>1.50Severe wet
1.00~1.49Moderately wet
0.50~0.99Mild wet
−0.49~0.49Normal
−0.99~−0.50Mild drought
−1.49~−1.00Moderately drought
<−1.50Severe drought
Disclaimer/Publisher’s Note: The statements, opinions and data contained in all publications are solely those of the individual author(s) and contributor(s) and not of MDPI and/or the editor(s). MDPI and/or the editor(s) disclaim responsibility for any injury to people or property resulting from any ideas, methods, instructions or products referred to in the content.

