Article

Influence of Phoebe bournei (Hemsl.) Replanting on Soil Carbon Content and Microbial Processes in a Degraded Fir Forest

1
Carbon Sink Center, Jiangxi Academy of Forestry, Nanchang 330013, China
2
Research Centre for Eco-Environmental Sciences, Chinese Academy of Sciences, Beijing 100085, China
3
Jiangxi Transportation Institute, Nanchang 330200, China
4
School of Agriculture and Biology, Shanghai Jiao Tong University, Shanghai 200240, China
5
Nanchang Urban Ecosystem Research Station, Jiangxi Academy of Forestry, Nanchang 330013, China
*
Author to whom correspondence should be addressed.
Forests 2023, 14(11), 2144; https://doi.org/10.3390/f14112144
Submission received: 20 September 2023 / Revised: 25 October 2023 / Accepted: 26 October 2023 / Published: 28 October 2023
(This article belongs to the Topic Forest Carbon Sequestration and Climate Change Mitigation)

Abstract

:
Replanting is a widely used method for improving the health and carbon sequestration capacity of degraded forests. However, its impact on soil carbon pools remains controversial. This study investigated the effects of replanting broadleaf Phoebe bournei (Hemsl.) Yang in a typical degraded fir forest. Soil carbon content, nutrient levels, and microbial community structure and function were measured at 0, 5, 8, and 12 years after replanting. The degraded fir forests were originally limited in nitrogen and phosphorus. Phoebe bournei replanting significantly increased soil total carbon but reduced total nitrogen and phosphorus levels, resulting in increased soil carbon:nitrogen, carbon:phosphorus, and nitrogen:phosphorus ratios. Microbial biomass carbon, nitrogen, and phosphorus were all significantly reduced, whereas microbial carbon:phosphorus and nitrogen:phosphorus ratios were enhanced. Enzyme activities related to nutrient cycling and carbon decomposition (acidic invertase, polyphenol oxidase, peroxidase, urase, nitrate reductase, and acidic phosphatase activities) were significantly lowered by replanting. Microbial richness and diversity significantly increased, and microbial community composition changed significantly due to replanting. Structural equation modeling revealed the significant role of total phosphorus in microbial biomass, microbial community composition, and enzyme activity, highlighting it as the main factor accelerating soil carbon accumulation. Network analysis identified Leifsonia, Bradyrhizobium, and Mycolicibacterium members as key microbial players in the soil carbon cycle. In summary, P. bournei replanting exacerbated soil phosphorus deficiency, leading to a decrease in soil microbial biomass and changes in community structure, reduced nutrient cycling and carbon-decomposition-related enzyme activities, less litter decomposition, and increased organic carbon accumulation. These findings demonstrate the importance of nutrient limitation in promoting soil carbon accumulation and offer new insights for soil carbon regulation strategies in forestry.

1. Introduction

Since the beginning of the industrial age, the burning of fossil fuels and changes in land use have rapidly increased atmospheric carbon concentration, leading to global warming and more frequent extreme climate events [1,2]. Forests play an irreplaceable role in absorbing atmospheric carbon dioxide (CO2) and mitigating climate change [3]. Currently, global forests store nearly 1146 PgC, with approximately 70% of the carbon accumulated as soil carbon [4]. Even minor changes in the soil carbon pool can have a significant impact on the atmospheric carbon pool [3,4]. Soil carbon pools are closely related to soil fertility, plant productivity, and ecosystem health, making the improvement of forest soil carbon pools essential for building sustainable forestry carbon sinks [5,6].
Modification of vegetation communities is a widely used method for regulating forest carbon sinks [7]. For instance, replanting trees in degraded forests can increase the overall photosynthetic rate of the forest, alter forest biodiversity, and regulate nutrient cycling [8]. Importantly, replanting can influence the abundance, composition, and function of soil microbial communities by providing higher quality and greater quantities of litter and rhizosphere exudates [9,10]. Microbial communities play a critical role in regulating the composition and size of soil carbon pools through microbial anabolic and catabolic processes [11]. The microbial anabolic process converts unstable organic carbon (such as plant litter) into more stable organic carbon (such as microbial residues) through the decomposition, uptake, assimilation, and death of microbial cells [12,13]. However, the catabolic process involves microbial respiration, converting organic carbon into CO2 and releasing it back into the atmosphere [14]. The ratio of these processes depends on microbial community characteristics, including substrate utilization efficiency and metabolic activity [12,13,14].
The impact of replanting on soil carbon pools remains controversial owing to potentially diverse microbial responses. Some studies have suggested that replanting broadleaf trees in degraded coniferous forests increases litter diversity, promoting microbial carbon turnover and improving soil organic matter accumulation [15,16,17]. However, the provision of high-quality broadleaf litter may also induce priming effects, accelerating the decomposition of previously recalcitrant carbon and hindering soil carbon accumulation [18,19]. Additionally, replanting may accelerate soil nutrient cycling in degraded coniferous forests; for instance, legume plants increase soil nitrogen content, promoting microbial carbon utilization efficiency and leading to an increase in soil carbon content [20,21]. Nevertheless, new replanted trees also require nutrients from the soil, potentially exacerbating soil nutrient limitations and increasing nutrient competition between plants [22,23]. This could lead to unpredictable effects on microbial carbon turnover and soil carbon sequestration. According to ecological stoichiometry theory, microbes tend to use carbon less efficiently when nitrogen and phosphorus are limited, resulting in more carbon being released as CO2 [24]. However, nutrient limitations also hinder the complete decomposition of plant litter, leading to greater accumulation of organic matter in the soil as particulate organic matter [25]. Thus, further studies from different regions and forest types are needed to fully understand the effects of replanting on soil carbon pools.
Chinese fir, Cunninghamia lanceolata (Lamb.) Hook, has become a popular coniferous timber species owing to its high yield and fast-growing properties, with over 12 million hectares planted in China alone [26,27]. However, fir forests have been reported to suffer from degradation. Generally, the forest degradation may be attributed to the pollution, excessive afforestation, or unreasonable fertilization caused by anthropogenic activities [28,29]. The soil nutrient depletion [30], pathogens, disease, and deaths [31] due to climate change were also reported as main reasons for forest degradation. Chinese fir forest degradation was mainly caused by long-term consecutive monoculture, resulting in reduced soil fertility [28,29], decreased primary productivity [32], and less soil organic matter accumulation [33]. This issue cannot be solved solely by using chemical fertilizers, and microbial communities may hold the key to mitigating degradation [34]. Replanting broadleaf trees in degraded fir forests has been reported to help mitigate monoculture-induced degradation, but its effects on soil carbon pools and the corresponding microbial ecological mechanisms remain unclear.
The objective of this study was to determine the effects of broadleaf replanting on soil carbon pools in degraded fir forests. Additionally, the aim was to analyze the potential microecological mechanisms by investigating variations in soil carbon content, nutrient content, and microbial community in degraded fir forests with different ages after broadleaf replanting. We hypothesized that soil carbon is enhanced by replanting due to the increased input of higher quantity and quality of organic matter into the soil, which activates the microbial community and its nutrient cycling and organic carbon turnover functions, ultimately leading to increased soil organic carbon accumulation.

2. Materials and Methods

2.1. Sampling Site

The sampling site is located at Guanshan Forestry Farm, Yongfeng County, Jiangxi Province, China (E 115°30′34.56″, N 26°39′33.12″). The site is humid and is in a mid-subtropical zone, with a mean annual temperature of 18.2 °C and mean annual precipitation of 1627 mm. To improve forest yield, the degraded monocultured Chinese fir forest was replanted with 2-year-old Phoebe bournei (Hemsl.) Yang seedlings (approximately 50 cm high) starting in 1998. Detailed forest information is provided in Table 1.

2.2. Sampling

The forest areas were sampled 0 (U), 5 (S1), 8 (S2), and 12 (S3) years after replanting (Figure 1). Four subsites (20 × 20 m) were designated in each forest, and 10 subsamples (2 m apart from each other) were randomly collected from each subsite. Topsoil samples (0–20 cm) weighing 1000 g were taken from the subsites and passed through 2 mm sieves. The samples were mixed to create one composite sample and immediately transported to the lab, then stored under 4 °C. Subsequently, they were divided into two parts: one for biomolecular analysis stored at −80 °C, and the other for physiochemical analysis stored at 4 °C. Enzyme activity measurements were taken within a week after sampling.

2.3. Measurement of Basic Physiochemical and Enzyme Activity

Soil pH was measured by testing the soil–water mixture in a mass/volume ratio of 1.0:2.5 (FE20-FiveEasyTM pH, MettlerToledo, Berlin, Germany) [35]. Soil total carbon content (TC) and total nitrogen content (TN) were determined using an element analyzer (Vario MACRO cube, Elementar Inc., Berlin, Germany). Soil total phosphorus content (TP) was measured using the Sommers–Nelson method [36]. Microbial carbon (MBC), microbial nitrogen (MBN), and microbial phosphorus (MBP) were measured using the chloroform fumigation–extraction method. For MBC [37] and MBN [38], soil samples were extracted with 0.5 mol L−1 K2SO4 at a ratio of 4:1 (v/w) and tested using a CN-analyzer (Multi N/C 3100, HT1300, Analytik Jena, Berlin, Germany). For MBP [39], soil samples were extracted with 0.5 mol L−1 NaHCO3 at a ratio of 4:1 (v/w) and tested using Mo–Sb antiluminosity. Urase activity was determined by measuring the production of ammonia (indophenol blue colorimetry) 2 h after adding urea. Acidic phosphatase activity was measured according to the production of phenol one day after adding organic phosphate (disodium phenyl phosphate colorimetry). The 5 g of soil sample (dry weight) was added to a 50 mL bottle; then, 1 mL methylbenzene, 5 mL disodium benzene phosphate (6.75 g dissolved in 1 L water), and 5 mL NaAc-HAc buffer (pH 5.0) were added and evenly mixed. Another control sample was added with water instead of the mixed solution. After a 24 h incubation at 37 °C, the mixed soil and solution were filtrated. An amount of 1 mL of filtrated solution was transferred to a 100 mL bottle and added with 5 mL pH 9.0 boric acid buffer, 3 mL 2.5% potassium ferricyanide and 3 mL 0.5% 4-aminoantipyrine. After even mixing, the solution was measured colorimetrically under 570 nm by an ultraviolet photometer (Shimatsu, Kyoto, Japan, UV1900i). The activity of cellulase, nitrate reductase, acidic invertase, peroxidase, and polyphenol oxidase were all measured using an appropriate kit (Comin Biotechnology Co., Ltd., Suzhou, China) according to the manufacturer’s instructions.

2.4. Shotgun Metagenomic Sequencing

DNA was extracted following the FastDNATM SPIN Kit (MP Biomedicals, Los Angeles, CA, USA) protocol. Approximately 1 μg of DNA per sample was obtained for further analysis. Sequencing libraries were prepared using the NEB Next® Ultra™ DNA Library Prep Kit. Illumina sequence data for each sample were individually assembled using MEGAHIT with a k-mer range of 21–99, generating sample-derived assemblies [40]. The unmapped reads of each sample were pooled for reassembly using MEGAHIT to generate a mixed assembly [40]. The sample-derived assembly and mixed assembly were then combined to obtain the final assembly for further analysis [40]. The sequencing results can be found in the GSA-CRA (Sequence Read Archive), with accession number CRA011664 for the metagenome.

2.5. Statistical Analysis

Structural equation modeling (SEM) was conducted using Amos v18.0 and SPSS v24, and the extraction of SEM factors was based on Pearson correlation metrics [41]. Network analysis was performed using MENA (http://ieg4.rccc.ou.edu/MENA/login.cgi (accessed on 26 June 2023)) and visualized using Cytoscape.v3.3.0. [42]. The construction parameters were set as follows: majority = 12; missing_fill = fill_paired (0.0100); logarithm = n; similarity = spearman2; and cutoff threshold = 0.90. The significance of different stages was determined using one-way ANOVA followed by Tukey’s HSD test via SPSS v24. Using the online platform https://cloud.majorbio.com (accessed on 20 May 2023), the Richness, Shannon index, the analysis of similarities among microbial communities (PERMENOVA) and the principal coordinates analysis (PCoA) based on Bray-Curtis distances at OTU-level were all conducted.

3. Results

3.1. Soil and Microbial Carbon, Nitrogen, and Phosphorus Content and Stoichiometry of Different Stages

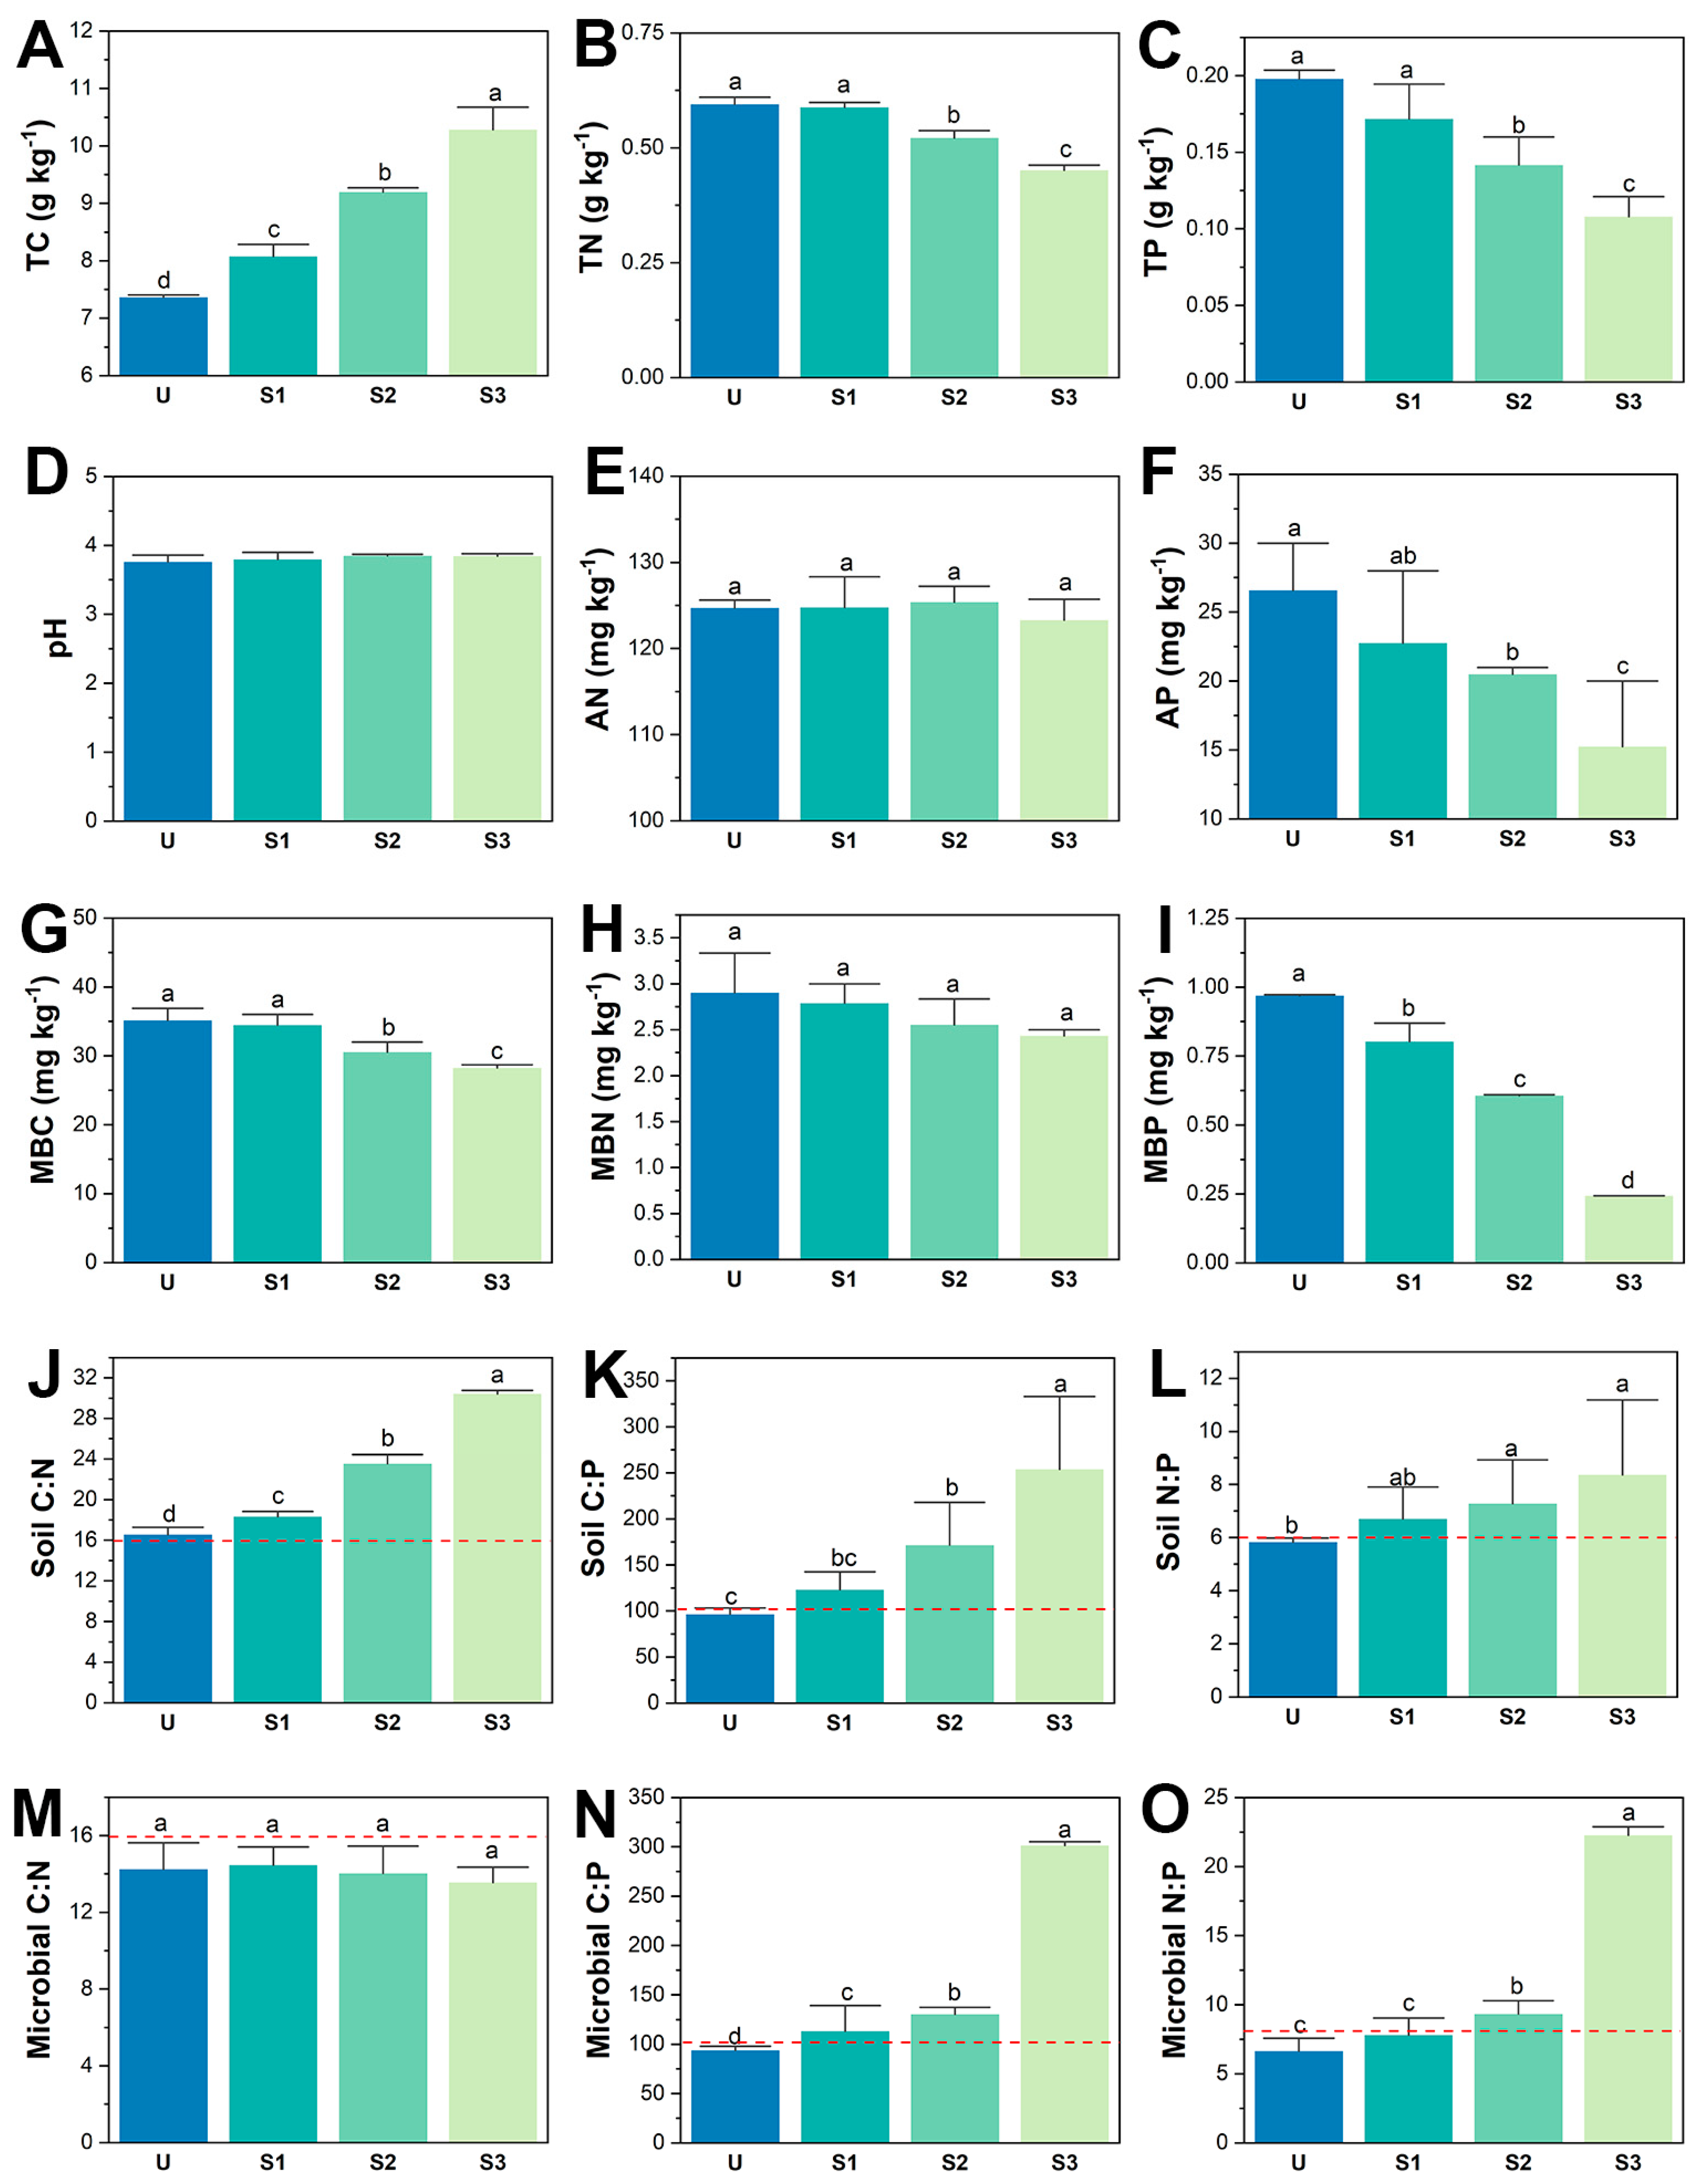
As shown in Figure 2A, P. bournei replanting significantly increased soil TC from 7.36 ± 0.05 g kg−1 at U to 10.28 ± 0.36 g kg−1 at S3 (p < 0.05). Soil TN significantly decreased from 0.59 ± 0.02 g kg−1 at U to 0.45 ± 0.01 g kg−1 at S3 (p < 0.05), with a nearly 23.8% proportional decrement, although no significant differences were found between U and S1 (Figure 2B). Soil TP also significantly decreased by almost half, from 0.20 ± 0.01 g kg−1 at U to 0.11 ± 0.02 g kg−1 at S3 (p < 0.05) (Figure 2C). Soil pH ranged from 3.76 ± 0.10 (S1) to 3.85 ± 0.03 (S3), with no significant differences among the four stages (p > 0.05) (Figure 2D). There were no significant differences in alkaline-hydrolytic nitrogen (AN) among the stages (p > 0.05), with AN ranging between 123.3 ± 2.44 mg kg−1 (S3) and 125.4 ± 2.71 mg kg−1 (S2) (Figure 2E). Available phosphorus (AP) showed an approximate 40% reduction, from 25.56 ± 2.59 mg kg−1 (U) to 15.24 ± 3.41 mg kg−1 (S3) (p < 0.05) (Figure 2F). MBC, MBN, and MBP all decreased due to replanting. MBC decreased significantly from 35.15 ± 1.43 mg kg−1 at U to 28.23 ± 0.42 mg kg−1 at S3, indicating a significant 20% reduction (p < 0.05) (Figure 2G). MBN also showed a decreasing trend, from 2.90 ± 0.01 mg kg−1 (U) to 2.43 ± 0.08 mg kg−1 (S3), although no significant differences were observed among the stages (p > 0.05) (Figure 2H). MBP showed a sharp reduction, decreasing by nearly 75%, from 0.97 ± 0.006 mg kg−1 (U) to 0.24 ± 0.001 mg kg−1 (S3) (p < 0.05) (Figure 2I).
The soil carbon:nitrogen (C:N), carbon:phosphorus (C:P), and nitrogen:phosphorus (N:P) ratios were originally 16.52 ± 0.55, 96.30 ± 4.83, and 5.83 ± 0.11, respectively, at the U stage, which were all close to the top threshold of the Redfield ratio. These ratios gradually increased to 30.40 ± 0.44, 253.6 ± 55.0, and 8.36 ± 1.93, respectively, at the S3 stage (p < 0.05), and were significantly higher than the Redfield ratio (Figure 2J–L). The microbial C:N ratio remained relatively stable after replanting, ranging from 14.45 ± 0.66 (S1) to 13.55 ± 0.59 (S3) (p > 0.05), just below the Redfield ratio threshold. However, microbial C:P and N:P ratios increased significantly (p < 0.05). Microbial C:P was 301.3 ± 4.28 at S3, nearly three times higher than at U (93.71 ± 3.72). Microbial N:P was 22.26 ± 0.74 at S3 and increased to nearly twice this value at U (6.63 ± 0.80). The greatest increase in microbial C:P and N:P (almost doubling) occurred between S2 and S3, resulting in ratios much higher than the Redfield ratio (Figure 2M–O).

3.2. Soil Enzyme Activity of Different Stages

Enzyme activity significantly decreased, except for cellulase activity (Figure 3). The activity of cellulase was lowest at S1 (83.45 ± 2.32 μg d−1 g−1) and highest at U (86.24 ± 0.95 μg d−1 g−1), with no significant differences among the stages (p > 0.05) (Figure 3A). The activity of acidic invertase decreased significantly, with the value at S3 (3.40 ± 0.03 mg d−1 g−1) being about 35% of that at U (10.04 ± 0.11 mg d−1 g−1; p < 0.05) (Figure 3B). The activity of polyphenol oxidase also significantly decreased from 2.73 ± 0.65 U (U) to 0.58 ± 0.22 U (S3) (Figure 3C). However, the activity of peroxidase showed a nonsignificant decrease from 284.2 ± 0.65 μmol h−1 g−1 at U to 276.2 ± 0.66 μmol h−1 g−1 at S2 (p > 0.05), whereas peroxidase activity significantly decreased from S2 to S3 (238.2 ± 10.19 μmol h−1 g−1; p < 0.05) (Figure 3D). Urase exhibited similar variation to peroxidase, ranging from 46.2 ± 3.56 μg min−1 g−1 at U to 47.85 ± 2.06 μg min−1 g−1 at S1 (p > 0.05), but sharply decreased to 19.5 ± 3.00 μg min−1 g−1 at S3 (p < 0.05) (Figure 3E). The activities of nitrate reductase and acidic phosphatase were originally 0.65 ± 0.01 μg d−1 g−1 and 2.03 ± 0.08 μg d−1 g−1 at U, respectively, but they gradually decreased to 0.39 ± 0.01 μg d−1 g−1 and 1.09 ± 0.11 μg d−1 g−1 at S3, respectively, reduced by nearly 50% (p < 0.05) (Figure 3F,G).

3.3. Variation in Soil Enzyme Activity

Phoebe bournei replanting enhanced the Chao1 index and Shannon index of the soil microbial community in degraded fir forests. The lowest Chao1 was 539 ± 60 for U, significantly lower than 577 ± 35, 642 ± 55, and 619 ± 35 for S1, S2, and S3, respectively (p < 0.05), but no significant differences were found among S1, S2, and S3 (Figure 4A). Similarly, the Shannon index at the S1, S2, and S3 stages was 4.20 ± 0.24, 4.43 ± 0.08, and 4.31 ± 0.11, respectively, significantly higher than at the U stage (3.87 ± 0.12; p < 0.05) (Figure 4B). The most prominent number of reads belonged to the taxa Acidobacteria and Actinobacteria as well as “Others” (identified taxa but not Acidobacteria and Actinobacteria) and “Unclassified” (taxa cannot be identified). The relative abundance (RA) of Acidobacteria was 8.60% ± 0.23% at U. It significantly increased to 12.45% ± 0.42% at S1 but returned to 8.07% ± 1.42% at S3 (Figure 4C). The RA of Actinobacteria decreased from 24.24% ± 5.73% at U to 19.27% ± 0.45% at S1, before returning to 24.51% ± 1.81% at S3, although there were no significant differences among the stages (p > 0.05) (Figure 4D). The RA of “Others” showed an increasing trend, with the highest RA at S2 (35.95% ± 1.41%), which was significantly higher than that at S1 (33.66% ± 0.57%) and U (30.27% ± 0.78%) (Figure 4E). The RA of “Unclassified” showed a weak decrease from 36.88% ± 4.93% at U to 31.46% ± 1.50% at S3 (p > 0.05) (Figure 4F). Principal coordinate analysis performed at the species level revealed that the microbial community composition was significantly altered by replanting (PERMENOVA, p < 0.05), with the two axes explaining 20.92% and 17.89% of the variation in composition, respectively (Figure 4G).

3.4. SEM for Soil Carbon Accumulation

The SEM results indicate that TP was the main driver of soil carbon accumulation (Figure 5). TP exhibited the highest (−0.89) standard total effects on TC, whereas microbial biomass, microbial community composition, and enzyme activity had standard total effects of only −0.53, −0.42, and −0.56, respectively. Moreover, TP contributed 0.90, 0.76, and 0.88 standard total effects to enzyme activity, microbial community composition, and microbial biomass, respectively, which were significantly higher effects compared with other factors. The R2 of TC was 0.96, suggesting that TP lowered microbial biomass, altered community composition, and reduced enzyme activity, thereby accelerating the accumulation of soil carbon.

3.5. Network Analysis on Microbial Community

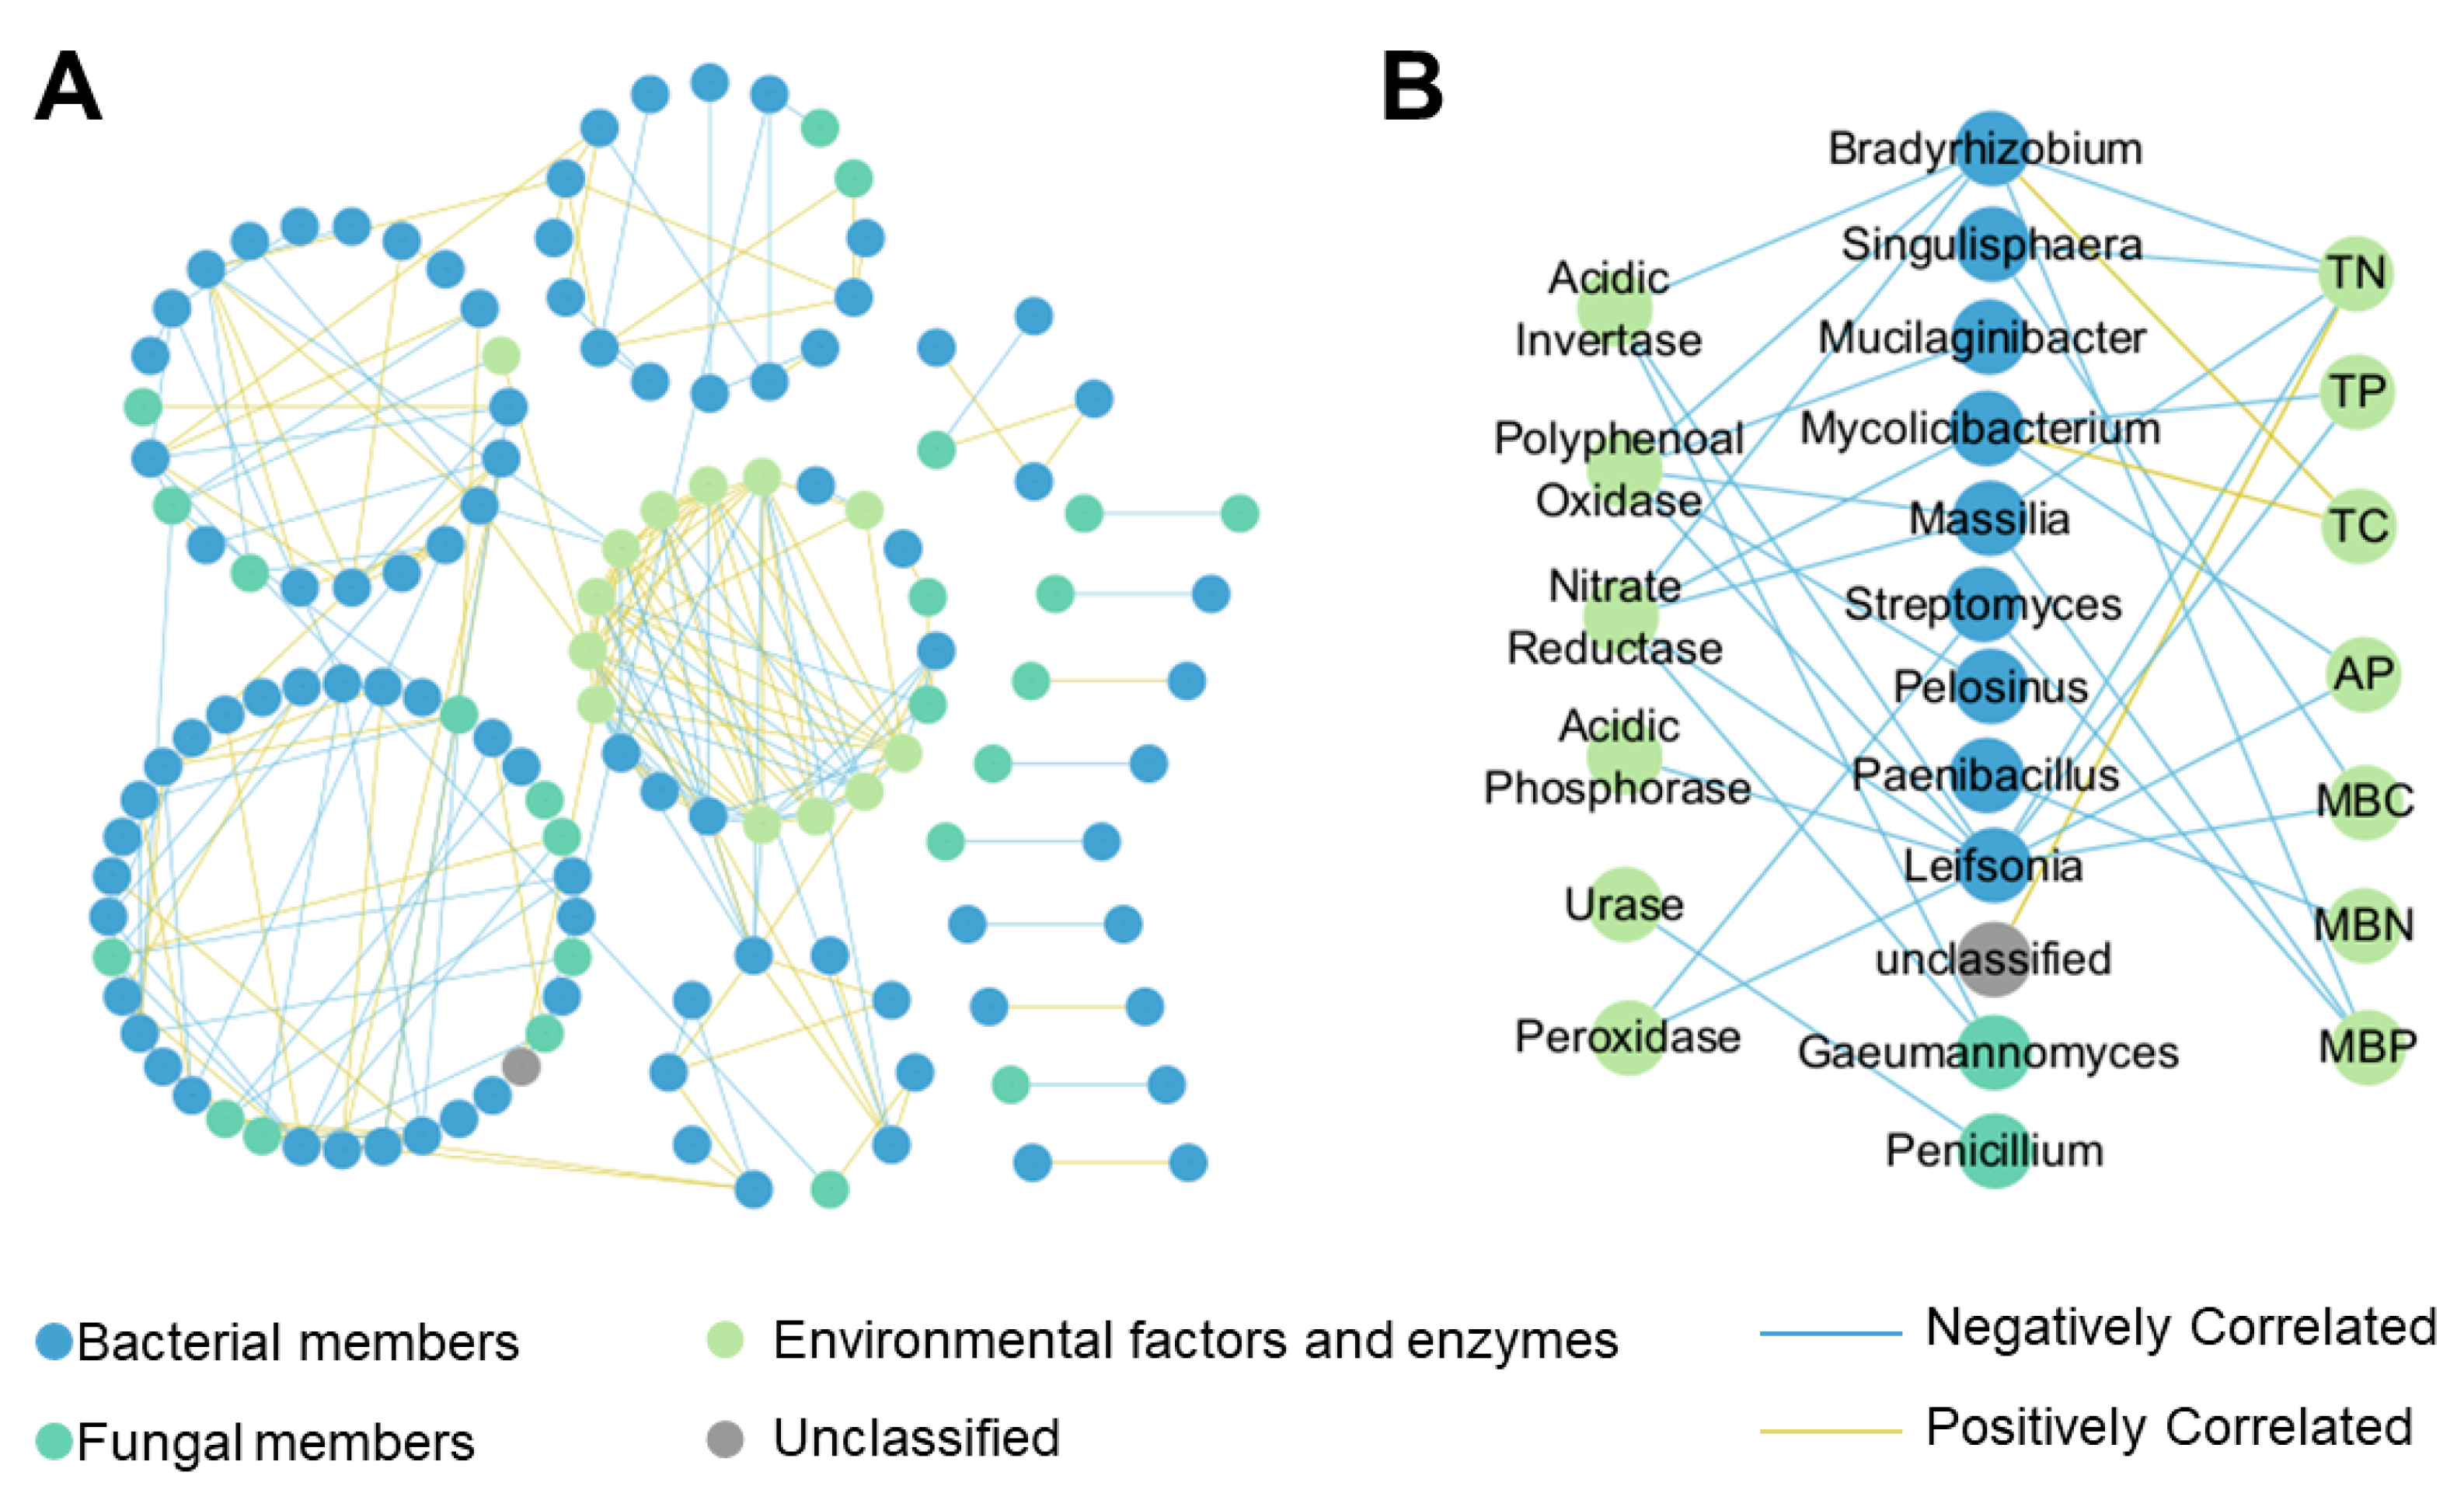
In the co-occurrence network analysis, most environmental factors and enzymes were found in a middle module (Figure 6A). Nine bacterial genera, two fungal genera, and unclassified taxa were directly linked to environmental factors and enzymes. Leifsonia possessed the highest number of links to acidic invertase, polyphenol oxidase, nitrate reductase, acidic phosphatase, TN, TP, AP, and MBC, suggesting that Leifsonia might play a functional hub role in the network. In contrast, Penicillium was only linked to urase, Mucilaginibacter was only linked to polyphenol oxidase, and unclassified taxa were only linked to TN. TC was directly and positively linked to Bradyrhizobium and Mycolicibacterium. Bradyrhizobium was also linked to acidic invertase, polyphenol oxidase, and nitrate reductase, and Mycolicibacterium was also linked to nitrate reductase (Figure 6B). These findings suggest that Bradyrhizobium and Mycolicibacterium are potentially important for carbon accumulation.

4. Discussion

4.1. P. bournei Replanting Enhances Soil Nitrogen and Phosphorus Limitation

In this study, the impact of P. bournei replanting on soil nitrogen and phosphorus content was significant (Figure 2B,C). In general, changes in vegetation can influence soil nutrient content through alterations in nutrient cycling flux and nutrient distribution between soil and plants. For example, during an ecological invasion, the intruder plant could lower soil pH by releasing litter and rhizosphere acidic exudates [43]. This not only affects physicochemical processes, such as phosphorus mobilization/demobilization and leaching [44], but also directly alters phosphatase activity, thereby regulating the phosphorus cycling rate and soil phosphorus content [43,44]. The introduction of broadleaf trees into a coniferous forest also changes the quantity and quality of soil organic matter [45,46], influencing the flux of the nitrogen cycle and soil nitrogen content by altering the strength of ammonia oxidization, nitrification, and denitrification processes [47,48]. Replanting affects nutrient distribution between soil and plants, as the total demands of the plant community are varied by the newly replanted members [49]. The competition for nutrients between the soil microbial community and aboveground community could also lower soil nitrogen and phosphorus content [22,23,50,51]. Notably, AN and AP are the nitrogen and phosphorus components most readily removed and assimilated [52,53]. In the present study, AN was not significantly altered by replanting, whereas AP was significantly reduced (Figure 2E,F), suggesting that replanting primarily influenced the phosphorus cycle rather than the nitrogen cycle flux.
Soil C:N, C:P, and N:P ratios were approximately at the top threshold of the Redfield ratio (Figure 2J–L), indicating potential nitrogen and phosphorus limitations on the microbial community [24]. The Redfield ratio defines the most balanced CNP stoichiometry ratio suitable for microbial growth and colonization [24]. Deviations from this ratio indicate relative limitations on certain nutrients, requiring microbes to expend extra energy to obtain limited nutrients [54]. In south China’s red soil, nitrogen and phosphorus are generally lacking and recognized as major limiting factors for forest ecosystem primary productivity [26]. In the present study, replanting further increased the ratios beyond the Redfield ratio top threshold, signifying an increased limitation of soil nitrogen and phosphorus. The microbial C:N ratio remained relatively unaffected by replanting (Figure 2M), suggesting that microbes exhibited a higher capability to maintain carbon and nitrogen stoichiometry balance, potentially through changes in carbon and nitrogen utilization efficiency [55,56,57]. Despite a slight decrease in TN (around 23.8%) and no significant changes in AN, we suggest that nitrogen did not significantly limit microbial community activity, although soil TN was reduced by replanting. In contrast, the soil C:P ratio nearly doubled, and the N:P ratio was also enhanced. Additionally, MBP exhibited a higher reduction compared with MBC and MBN, leading to increased C:P and N:P ratios beyond the Redfield ratio top threshold, especially at S3 (Figure 2N,O). These findings support the notion that TP was more limited than nitrogen following replanting.

4.2. Effects of P. bournei Replanting on Microbial Community Properties

Replanting enhanced the richness and diversity of the soil microbial community (Figure 4A,B), possibly due to improved litter quality [58,59] and increased nutrient limitation [60]. An increase in the number of plant species in a forest can enhance litter diversity, providing more substrates for microbes, thereby promoting higher microbial richness [58,59]. Higher soil fertility tends to enrich certain microbial taxa, increase the dominance of main taxa, and decrease microbial community diversity [60]. In the current study, replanting led to a decrease in nitrogen and phosphorus levels, potentially enhancing microbial competition and benefiting the survival of rare species [61], thereby increasing microbial community diversity [60]. The RA of other taxa increased due to replanting, further supporting this notion. Metagenome analysis revealed that the microbial community was dominated by Acidobacteria [62,63,64] and Actinobacteria [65,66], which are widely reported as the main taxa in red soil coniferous forests (Figure 3C,D). Acidobacteria prefer acidic environments [62,63], and Actinobacteria exhibit higher decomposition rates on coniferous tree litter [65,66]. The RA of both Acidobacteria and Actinobacteria were significantly altered initially but recovered at S3. Considering that pH remained relatively unchanged, the RA variation of Acidobacteria and Actinobacteria might be attributed to the disturbance caused by replanting, indicating that replanting benefits rare taxa rather than dominant taxa.
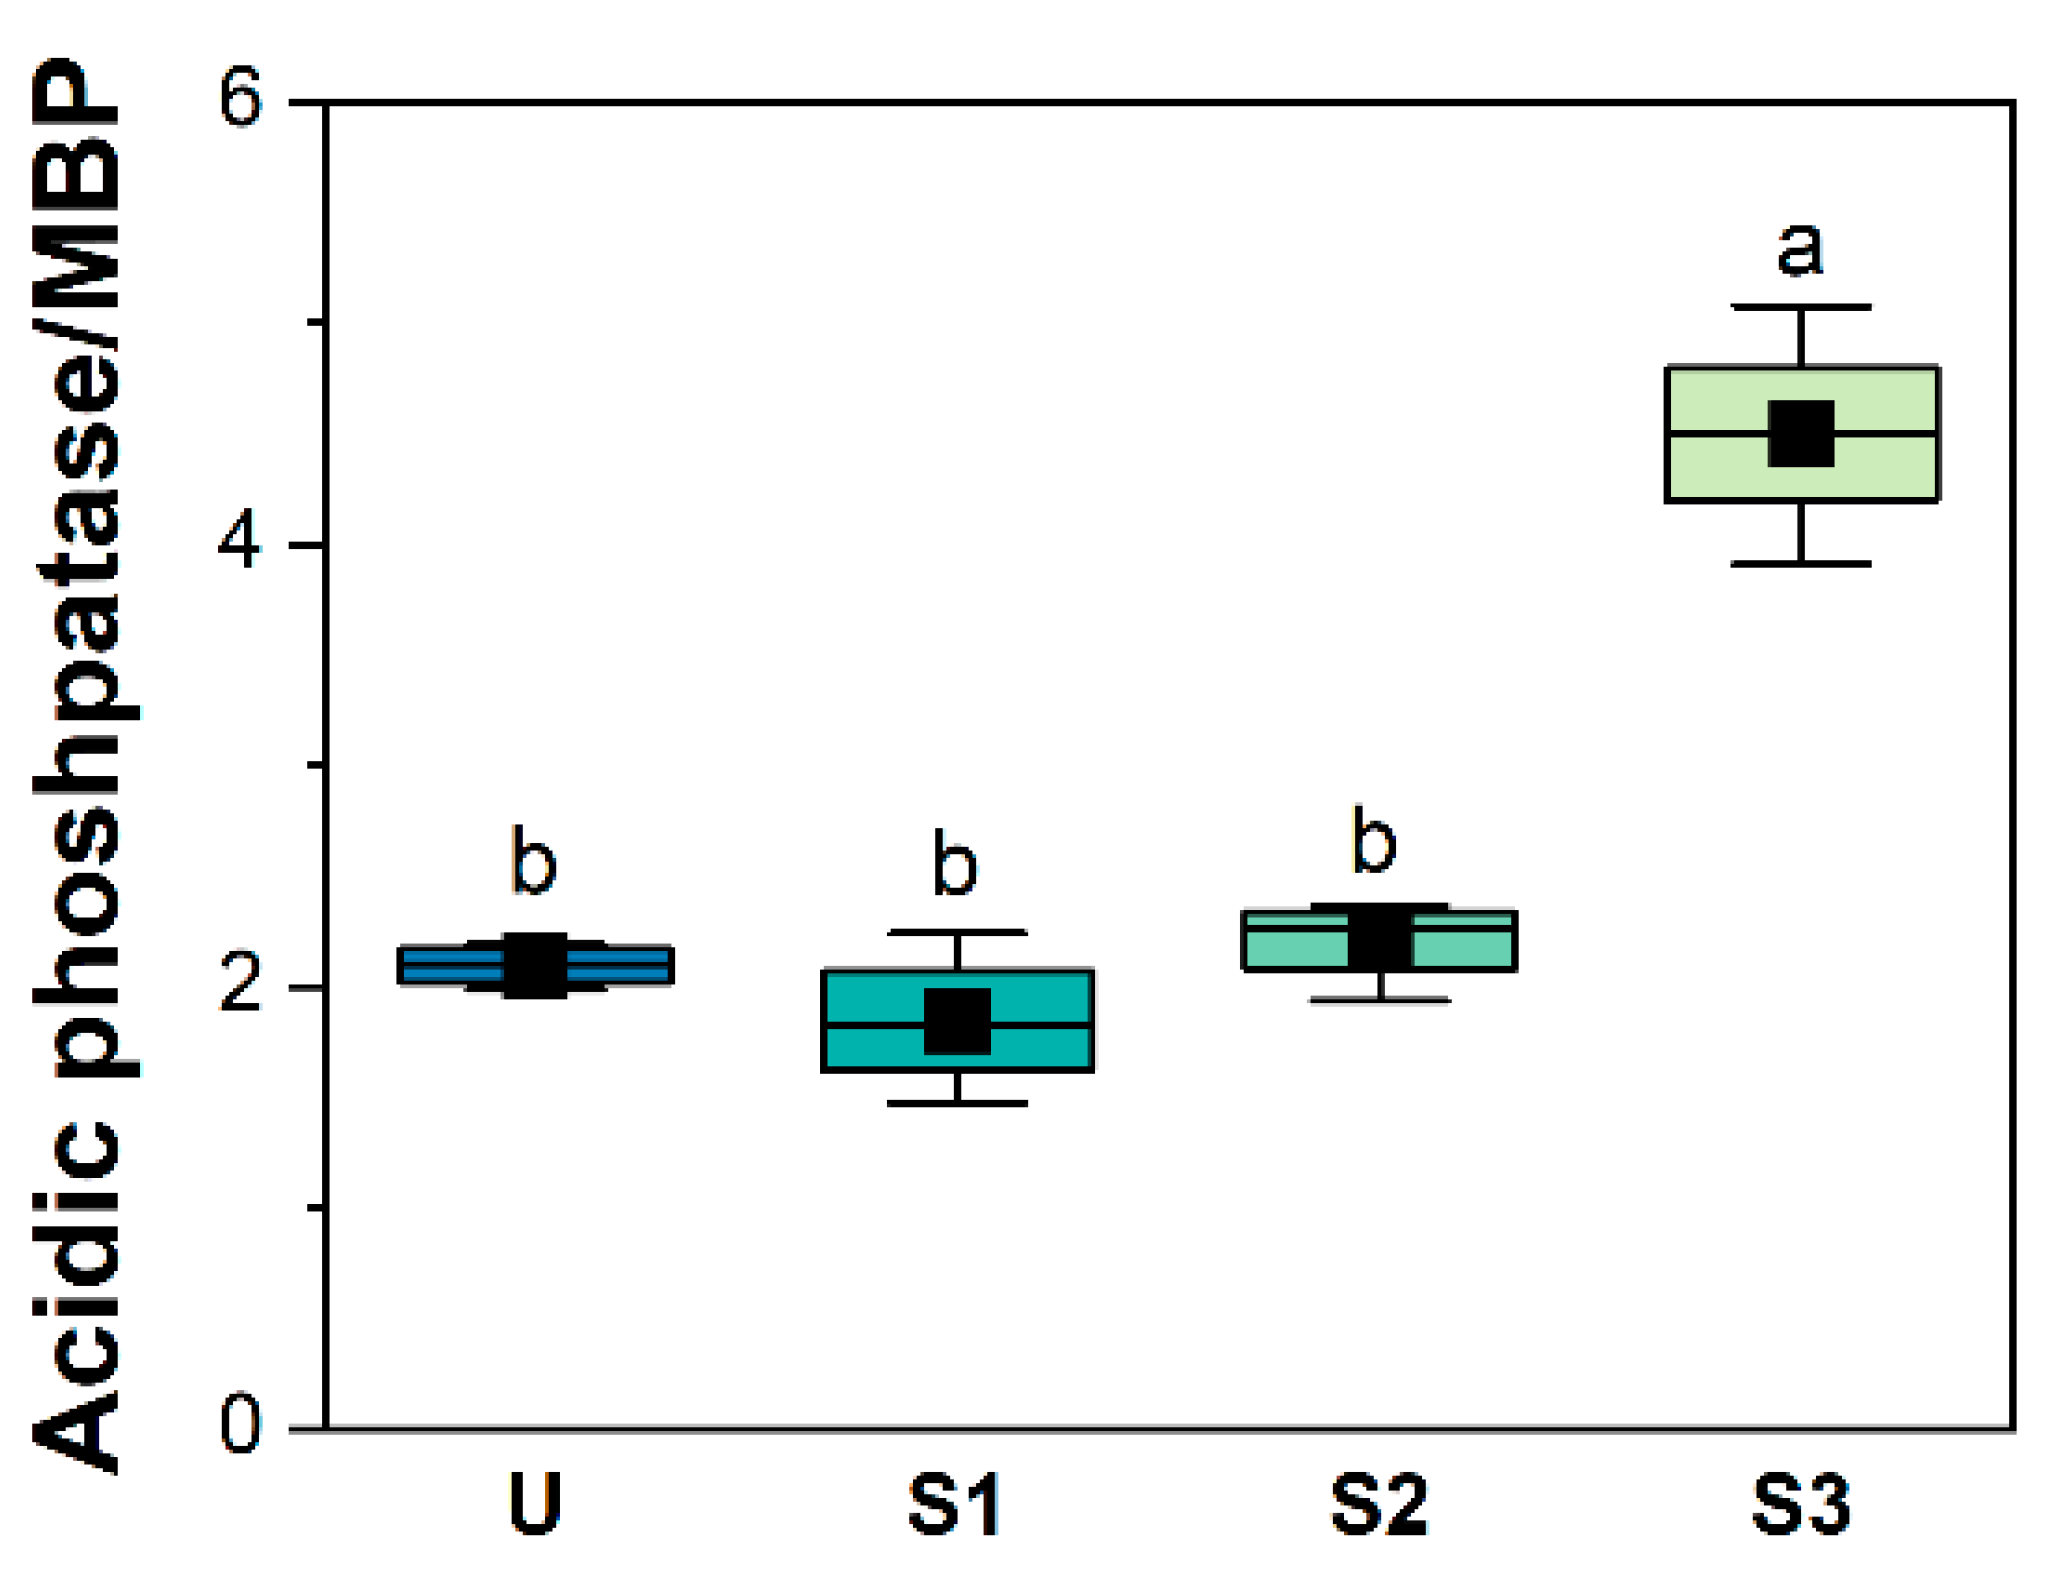
Replanting resulted in a decrease in microbial biomass, as indicated by reductions in MBC, MBN, and MBP (Figure 2G–I). Although broadleaf trees can offer high-quality litter and enhance microbial biomass [67,68], the intensified nutrient competition between plants and microbes may lead to reduced microbial activity and biomass [50,51]. Several enzymes related to the carbon, nitrogen, and phosphorus cycles were found to be active in the microbial community. For example, cellulase, acidic invertase, polyphenol oxidase, and peroxidase are related to the carbon cycle [69]. Acidic invertase, polyphenol oxidase, and peroxidase are responsible for decomposing soluble sugars, lignin, and hydrocarbons in plant litter and microbial necromass [70,71]. The decrease in the activity of these enzymes reflects the reduced decomposition capacity of the carbon sources and a slower turnover rate of soil organic matter [70,71]. Soil enzymes are primarily secreted by soil microorganisms, and their activities are regulated by both environmental factors and microbial biomass. For example, when encountering increased recalcitrant carbon, microorganisms tend to increase the activity of polyphenol oxidase and lignin peroxidase [72,73,74]. Increased labile carbon and soluble sugar have been reported to stimulate acidic invertase activity [70,71]. However, despite the observed increase in TC in the present study, the activity of acidic invertase, polyphenol oxidase, and peroxidase decreased due to replanting. We suggest that their reduced activity resulted from a decrease in microbial biomass and enzyme secretion under enhanced nutrient limitation. The activity of enzymes representing the nitrogen and phosphorus cycles also decreased with replanting (Figure 3E–G). Urease and nitrate reductase are key enzymes controlling the organic nitrogen mineralization and denitrification processes in the soil nitrogen cycle [52]. They play an important role in regulating the turnover and residence of soil nitrogen by limiting nitrogen from entering the soil in inorganic forms and leaving the soil in gaseous forms [52,75]. The activity of urase and nitrate reductase is sensitive to environmental factors, including pH, AN, and TC [52,75]. However, soil pH and AN remained nearly unchanged in the present study, suggesting that their activities were primarily governed by microbial biomass and community composition. Urase activity was significantly reduced only at the S3 stage, indicating that phosphorus limitation may have occurred first, followed by possible nitrogen limitation. Acidic phosphatase is the main catalyst responsible for transforming organic phosphorus into inorganic phosphate in red soils [76,77]. Contrary to our results, ecosystems have been found to increase acidic phosphatase levels to maintain N:P stoichiometry under phosphorus limitation [78,79,80]. However, the ratio of acidic phosphorus activity to MBP (a simple ratio removing the units) tended to increase in this study (Figure 7), indicating that the system sustains higher acidic phosphatase activity to maintain MBP when phosphorus becomes increasingly limited, despite the overall decrease in acidic phosphatase activity due to the reduction in microbial biomass.
Microbial community composition is a crucial indicator of microbial activities. According to our SEM results, composition contributed slightly more than microbial biomass to overall microbial activity (Figure 5). The variation in microbial composition arises from the trade-offs among different functional taxa in response to changing environmental conditions. For example, ammonia-oxidizing archaea (AOA) exhibit greater stress tolerance compared with ammonia-oxidizing bacteria, leading to AOA prevalence under stressful conditions, such as high salinity [81], heavy-metal pollution [82], and drought [83,84]. The activities of different taxa also vary owing to their distinct functional efficiencies [81,82,83,84]. Additionally, nutrient limitation shapes microbial taxa, favoring those with greater stoichiometric elasticity or optimal stoichiometric points compatible with current environmental conditions [24,85]. When facing nutrient limitation, microbial communities adopt a conservation strategy to prioritize the use of limited nutrients by regulating specific activities [55,56,57]. For example, when electron acceptors are scarce, the RA of nosZ-containing taxa in the denitrification functional group increases, enabling the conversion of more nitrates to N2, sparing the use of electron acceptors. Conversely, when facing a shortage of electron donors, nosZ genes are downregulated, resulting in the release of more nitrogen in the form of N2O [86]. The significant enhancement of phosphorus limitation observed in the present study suggests that the functional group responsible for the phosphorus cycle may contribute to adjusting the corresponding enzyme activity to increase the efficiency of phosphorus utilization [44,77].

4.3. P. bournei Replanting Enhances Soil Carbon Accumulation

Phoebe bournei replanting had a positive impact on soil TC accumulation in degraded fir forests, potentially due to increased plant inputs of organic matter and reduced rates of microbial decomposition. In another study, replanting heather in degraded fir forests expanded the area available for photosynthesis and enhanced the overall photosynthetic rate of the plant community, resulting in higher amounts of litter and rhizosphere exudates [7]. However, microbial biomass and enzyme activity have been shown to decrease with the age of replanted trees, suggesting a decline in the heterotrophic respiratory output of soil organic matter [4]. This combined effect resulted in the accumulation of soil organic carbon through replanting.
The present study also suggests an increase in the soil carbon pool in the form of particulate organic matter (POM) in degraded fir forests. Soil carbon pools can be broadly categorized into two groups: POM and mineral-associated organic matter (MAOM) [5]. POM represents plant residues that have not been fully decomposed by microorganisms and have a shorter residence time in the soil [87]. In contrast, MAOM is formed by mineral adsorption after microbial turnover and has a much longer residence time, often embedded in soil aggregates smaller than 50 μm [6]. Studies have shown that increasing MAOM content is an effective strategy for boosting soil carbon stocks and improving carbon pool quality [6,88,89]. However, the formation of MAOM is closely associated with microbial decomposition activity and mineral–organic binding capacity, introducing uncertainties when inputting high-quality litter into the soil [5]. In some cases, inputting high-quality litter reduces TC. For example, promoting plants with high-quality litter or greater root exudation in carbon-saturated soils could diminish MAOM pools owing to exudation-induced priming [67]. POM pools could also be decreased by more complete decomposition of plant litter and mineralization of plant-derived carbon [18]. In environments with low microbial activity, such as anaerobic wetland soil, organic matter also accumulates mainly in the form of POM [90]. An unexpected finding in the present study was an enhanced nutrient limitation caused by heather replanting in a degraded fir forest, leading mainly to the accumulation of TC in the form of POM.
Based on co-occurrence network analysis, Leifsonia exhibited the most links in the network, and TC was directly associated with Bradyrhizobium and Mycolicibacterium, suggesting their potential importance as key factors in soil organic matter accumulation (Figure 5B). Bradyrhizobium is a common bacterial lineage in soils, with some of its members being capable of nitrogen fixation through symbiotic nodules with host plants. Additionally, NapA/B, NirK, and other denitrification-related genes have been found in the genomes of Bradyrhizobium members, indicating their potential denitrification activity [91]. Many Bradyrhizobium isolates contain active ribulose-1,5-bisphosphate carboxylase oxygenase, which catalyzes the first stage of the Calvin–Benson–Bassham cycle (CBB) involved in carbon fixation [92]. Transketolase, an important enzyme that catalyzes the interconversion of sugars in both the CBB cycle and the pentose phosphate pathway, is also found in most Bradyrhizobium members [93,94]. The diverse metabolism in both nitrogen and carbon cycles may explain the intrinsic role of Bradyrhizobium in the determined networks. Mycolicibacterium sp. Pyr9 possesses the ability to degrade pyrene and support host survival in polluted areas [95], indicating the species’ potential for transforming aromatic carbons. Additionally, certain Mycolicibacterium members are fast-growing, suggesting higher carbon turnover capability compared with slow-growing microbes [96]. Our results indicate that Mycolicibacterium members may play unexpected roles in coupling the carbon, nitrogen, and phosphorus cycles in the red soil of south China, as they are closely linked to TC, TN, and TP in the co-occurrence network. Leifsonia, however, links most soil physiochemical and enzyme factors. Some Leifsonia members can promote plant growth [97] and enhance host resistance to drought stress [98], whereas others have been reported as specific pathogens [99]. Interestingly, Leifsonia xyli HS0904 can produce carbonyl reductase and has been genetically modified to improve industrial catalytic efficiency [100], and other Leifsonia members can produce bacterial cellulose [101]. Thus, Leifsonia members offer potential litter degradation functions, which may explain their prominence in the determined network.

5. Conclusions

Replanting P. bournei in degraded fir forests in the red soil region of southern China proved to be an effective approach for improving forest quality. We conducted a comprehensive study to monitor changes in soil carbon pools, nutrients, and microbial community composition and function at different stages after replanting. Our results partially supported our hypothesis, revealing an increase in soil TC due to replanting. However, the increase in soil TC was not solely driven by enhanced nutrient cycling and carbon turnover through microbial communities (as expected for MAOM accumulation). Instead, P. bournei uptake of soil nitrogen and phosphorus resulted in a relative increase in nitrogen and phosphorus limitations (mainly phosphorus) on the microbial community. This, in turn, led to a decline in microbial biomass and a shift in community structure. Consequently, there was a significant decrease in the activities of various enzymes and a slowdown in the turnover of litter by microorganisms, ultimately accelerating the accumulation of soil carbon, mainly in the form of POM. Future studies will further explore the effects of replanting on SOM of degraded forest, especially focusing on the changes in MAOM and POM composition distributed on soil profile and aggregate structures and resolving the relationship to microbial communities. These results will offer a comprehensive understanding on the micro-ecological mechanism of carbon sequestration in forest in red soil regions and provide theoretical guidance for enhancing the soil carbon sink of degraded forests. Overall, this study highlights the potential mechanisms involved in nutrient limitation enhancing soil carbon pool accumulation during forest improvement in degraded areas. Moreover, these findings provide new insights into soil carbon sink regulation strategies in forestry.

Author Contributions

Conceptualization, T.L. and L.W.; methodology, T.L. and J.X.; software, H.Z. (Hanchang Zhou), J.X. and T.L.; validation, H.Z. (Hong Zhao), J.S. and T.L.; formal analysis, H.Z. (Hong Zhao) and J.S.; investigation, L.W. and C.L.; resources, L.W.; data curation, H.Z. (Hong Zhao), J.S. and T.L.; writing—original draft preparation, T.L. and L.W.; writing—review and editing, T.L., J.X. and L.W.; visualization, L.W., H.Z. (Hong Zhao), J.S. and T.L.; supervision, L.W.; project administration, J.X. and L.W.; funding acquisition, L.W. and H.Z. (Hanchang Zhou). All authors have read and agreed to the published version of the manuscript.

Funding

This research was funded by the National Key R&D Program of China, grant number 2017YFC0505502 and the Program of Young Scientist Cultivation, grant number 2023520804.

Data Availability Statement

The sequencing results can be found in the GSA-CRA (Sequence Read Archive) with accession number CRA011664 for the metagenome.

Conflicts of Interest

The authors declare no conflict of interest.

References

  1. Le Quéré, C.; Raupach, M.R.; Canadell, J.G.; Marland, G.; Bopp, L.; Ciais, P.; Conway, T.J.; Doney, S.C.; Feely, R.A.; Foster, P.; et al. Trends in the sources and sinks of carbon dioxide. Nat. Geosci. 2009, 2, 831–836. [Google Scholar] [CrossRef]
  2. Cavicchioli, R.; Ripple, W.J.; Timmis, K.N.; Azam, F.; Bakken, L.R.; Baylis, M.; Behrenfeld, M.J.; Boetius, A.; Boyd, P.W.; Classen, A.T.; et al. Scientists’ warning to humanity: Microorganisms and climate change. Nat. Rev. Microbiol. 2019, 17, 569–586. [Google Scholar] [CrossRef] [PubMed]
  3. Pan, Y.; Birdsey, R.A.; Fang, J.; Houghton, R.; Kauppi, P.E.; Kurz, W.A.; Phillips, O.L.; Shvidenko, A.; Lewis, S.L.; Canadell, J.G.; et al. A large and persistent carbon sink in the world’s forests. Science 2011, 333, 988–993. [Google Scholar] [CrossRef] [PubMed]
  4. Dixon, R.K.; Solomon, A.M.; Brown, S.; Houghton, R.A.; Trexier, M.C.; Wisniewski, J. Carbon pools and flux of global forest ecosystems. Science 1994, 263, 185–190. [Google Scholar] [CrossRef] [PubMed]
  5. Angst, G.; Mueller, K.E.; Castellano, M.J.; Vogel, C.; Wiesmeier, M.; Mueller, C.W. Unlocking complex soil systems as carbon sinks: Multi-pool management as the key. Nat. Commun. 2023, 14, 2967. [Google Scholar] [CrossRef] [PubMed]
  6. Lehmann, J.; Hansel, C.M.; Kaiser, C.; Kleber, M.; Maher, K.; Manzoni, S.; Nunan, N.; Reichstein, M.; Schimel, J.P.; Torn, M.S.; et al. Persistence of soil organic carbon caused by functional complexity. Nat. Geosci. 2020, 13, 529–534. [Google Scholar] [CrossRef]
  7. Thompson, I.D.; Okabe, K.; Parrotta, J.A.; Brockerhoff, E.; Jactel, H.; Forrester, D.I.; Taki, H. Biodiversity and ecosystem services: Lessons from nature to improve management of planted forests for REDD-plus. Biodivers. Conserv. 2014, 23, 2613–2635. [Google Scholar] [CrossRef]
  8. Bongers, F.J.; Schmid, B.; Bruelheide, H.; Bongers, F.; Li, S.; von Oheimb, G.; Li, Y.; Cheng, A.; Ma, K.; Liu, X. Functional diversity effects on productivity increase with age in a forest biodiversity experiment. Nat. Ecol. Evol. 2021, 5, 1594–1603. [Google Scholar] [CrossRef]
  9. Delgado-Baquerizo, M.; Maestre, F.T.; Reich, P.B.; Jeffries, T.C.; Gaitan, J.J.; Encinar, D.; Berdugo, M.; Campbell, C.D.; Singh, B.K. Microbial diversity drives multifunctionality in terrestrial ecosystems. Nat. Commun. 2016, 7, 10541. [Google Scholar] [CrossRef]
  10. Zhou, J.; Deng, Y.; Shen, L.; Wen, C.; Yan, Q.; Ning, D.; Qin, Y.; Xue, K.; Wu, L.; He, Z.; et al. Temperature mediates continental-scale diversity of microbes in forest soils. Nat. Commun. 2016, 7, 12083. [Google Scholar] [CrossRef]
  11. Liang, C.; Schimel, J.P.; Jastrow, J.D. The importance of anabolism in microbial control over soil carbon storage. Nat. Microbiol. 2017, 2, 17105. [Google Scholar] [CrossRef] [PubMed]
  12. Liang, C.; Balser, T.C. Microbial production of recalcitrant organic matter in global soils: Implications for productivity and climate policy. Nat. Rev. Microbiol. 2011, 9, 75. [Google Scholar] [CrossRef]
  13. Cotrufo, M.F.; Wallenstein, M.D.; Boot, C.M.; Denef, K.; Paul, E. The Microbial Efficiency-Matrix Stabilization (MEMS) framework integrates plant litter decomposition with soil organic matter stabilization: Do labile plant inputs form stable soil organic matter? Glob. Chang. Biol. 2013, 19, 988–995. [Google Scholar] [CrossRef] [PubMed]
  14. Schimel, J.; Schaeffer, S. Microbial control over carbon cycling in soil. Front. Microbiol. 2012, 3, 348. [Google Scholar] [CrossRef]
  15. Rui, Y.; Jackson, R.D.; Cotrufo, M.F.; Sanford, G.R.; Spiesman, B.J.; Deiss, L.; Culman, S.W.; Liang, C.; Ruark, M.D. Persistent soil carbon enhanced in Mollisols by well-managed grasslands but not annual grain or dairy forage cropping systems. Proc. Natl. Acad. Sci. USA 2022, 119, e2118931119. [Google Scholar] [CrossRef] [PubMed]
  16. Meier, C.L.; Bowman, W.D. Links between plant litter chemistry, species diversity, and below-ground ecosystem function. Proc. Natl. Acad. Sci. USA 2008, 105, 19780–19785. [Google Scholar] [CrossRef]
  17. Liang, C.; Amelung, W.; Lehmann, J.; Kästner, M. Quantitative assessment of microbial necromass contribution to soil organic matter. Glob. Chang. Biol. 2019, 25, 3578–3590. [Google Scholar] [CrossRef]
  18. Keiluweit, M.; Bougoure, J.J.; Nico, P.S.; Pett-Ridge, J.; Weber, P.K.; Kleber, M. Mineral protection of soil carbon counteracted by root exudates. Nat. Clim. Chang. 2015, 5, 588–595. [Google Scholar] [CrossRef]
  19. Chari, N.R.; Taylor, B.N. Soil organic matter formation and loss are mediated by root exudates in a temperate forest. Nat. Geosci. 2022, 15, 1011–1016. [Google Scholar] [CrossRef]
  20. Chen, X.; Taylor, A.R.; Reich, P.B.; Hisano, M.; Chen, H.Y.H.; Chang, S.X. Tree diversity increases decadal forest soil carbon and nitrogen accrual. Nature 2023, 618, 94–101. [Google Scholar] [CrossRef]
  21. Chen, X.; Chen, H.Y.H. Plant mixture balances terrestrial ecosystem C:N:P stoichiometry. Nat. Commun. 2021, 12, 4562. [Google Scholar] [CrossRef]
  22. Ben Keane, J.; Hartley, I.P.; Taylor, C.R.; Leake, J.R.; Hoosbeek, M.R.; Miglietta, F.; Phoenix, G.K. Grassland responses to elevated CO2 determined by plant–microbe competition for phosphorus. Nat. Geosci. 2023, 16, 704–709. [Google Scholar] [CrossRef]
  23. Zhu, Q.; Riley, W.J.; Tang, J.; Koven, C.D. Multiple soil nutrient competition between plants, microbes, and mineral surfaces: Model development, parameterization, and example applications in several tropical forests. Biogeosciences 2016, 13, 341–363. [Google Scholar] [CrossRef]
  24. Cleveland, C.C.; Liptzin, D. C:N:P stoichiometry in soil: Is there a “Redfield ratio” for the microbial biomass? Biogeochemistry 2007, 85, 235–252. [Google Scholar] [CrossRef]
  25. Averill, C.; Waring, B. Nitrogen limitation of decomposition and decay: How can it occur? Glob. Chang. Biol. 2018, 24, 1417–1427. [Google Scholar] [CrossRef]
  26. Wang, Q.; Wang, S.; Zhang, J. Assessing the effects of vegetation types on carbon storage fifteen years after reforestation on a Chinese fir site. For. Ecol. Manag. 2009, 258, 1437–1441. [Google Scholar] [CrossRef]
  27. Chen, L.-C.; Wang, S.-L. Allelopathic behaviour of Chinese fir from plantations of different ages. For. Int. J. For. Res. 2013, 86, 225–230. [Google Scholar] [CrossRef]
  28. Bennett, A.J.; Bending, G.D.; Chandler, D.; Hilton, S.; Mills, P. Meeting the demand for crop production: The challenge of yield decline in crops grown in short rotations. Biol. Rev. Camb. Philos. Soc. 2012, 87, 52–71. [Google Scholar] [CrossRef]
  29. Liu, L.; Duan, Z.; Xu, M.; Hu, J.; Wang, S.; Hu, Z.; Zhang, Q.; Wang, S. Effect of monospecific and mixed Cunninghamia lanceolata plantations on microbial community and two functional genes involved in nitrogen cycling. Plant Soil 2010, 327, 413–428. [Google Scholar] [CrossRef]
  30. Zhou, H.; Ma, A.; Zhou, X.; Chen, X.; Zhang, J.; Zhang, Q.; Qi, X.; Liu, G.; Zhuang, G. Phosphorus shapes soil microbial community composition and network properties during grassland expansion into shrubs in Tibetan dry valleys. Front. Plant Sci. 2022, 13, 704–709. [Google Scholar] [CrossRef]
  31. Kpemoua, T.P.I.; Leclerc, S.; Barré, P.; Houot, S.; Pouteau, V.; Plessis, C.; Chenu, C. Are carbon-storing soils more sensitive to climate change? A laboratory evaluation for agricultural temperate soils. Soil Biol. Biochem. 2023, 183, 109043. [Google Scholar] [CrossRef]
  32. Wang, Z.; Zhang, X.; Chhin, S.; Zhang, J.; Duan, A. Disentangling the effects of stand and climatic variables on forest productivity of Chinese fir plantations in subtropical China using a random forest algorithm. Agric. For. Meteorol. 2021, 304–305, 108412. [Google Scholar] [CrossRef]
  33. Wang, Q.-K.; Wang, S.-L.; Zhong, M.-C. Ecosystem carbon storage and soil organic carbon stability in pure and mixed stands of Cunninghamia lanceolata and Michelia macclurei. Plant Soil 2013, 370, 295–304. [Google Scholar] [CrossRef]
  34. Wardle, D.A.; Bardgett, R.D.; Klironomos, J.N.; Setälä, H.; van der Putten, W.H.; Wall, D.H. Ecological linkages between aboveground and belowground biota. Science 2004, 304, 1629–1633. [Google Scholar] [CrossRef] [PubMed]
  35. Sumner, M.E. Measurement of soil pH: Problems and solutions. Commun. Soil Sci. Plant Anal. 1994, 25, 859–879. [Google Scholar] [CrossRef]
  36. Sommers, L.E.; Nelson, D.W. Determination of total phosphorus in soils: A rapid perchloric acid digestion procedure. Soil Sci. Soc. Am. J. 1972, 36, 902–904. [Google Scholar] [CrossRef]
  37. Vance, E.D.; Brookes, P.C.; Jenkinson, D.S. An extraction method for measuring soil microbial biomass C. Soil Biol. Biochem. 1987, 19, 703–707. [Google Scholar] [CrossRef]
  38. Brookes, P.C.; Landman, A.; Pruden, G.; Jenkinson, D.S. Chloroform fumigation and the release of soil nitrogen: A rapid direct extraction method to measure microbial biomass nitrogen in soil. Soil Biol. Biochem. 1985, 17, 837–842. [Google Scholar] [CrossRef]
  39. Brookes, P.C.; Powlson, D.S.; Jenkinson, D.S. Measurement of microbial biomass phosphorus in soil. Soil Biol. Biochem. 1982, 14, 319–329. [Google Scholar] [CrossRef]
  40. Li, D.; Liu, C.-M.; Luo, R.; Sadakane, K.; Lam, T.-W. MEGAHIT: An ultra-fast single-node solution for large and complex metagenomics assembly via succinct de Bruijn graph. Bioinformatics 2015, 31, 1674–1676. [Google Scholar] [CrossRef]
  41. Barrett, P. Structural equation modelling: Adjudging model fit. Personal. Individ. Differ. 2007, 42, 815–824. [Google Scholar] [CrossRef]
  42. Deng, Y.; Jiang, Y.-H.; Yang, Y.; He, Z.; Luo, F.; Zhou, J. Molecular ecological network analyses. BMC Bioinform. 2012, 13, 113. [Google Scholar] [CrossRef] [PubMed]
  43. Chapuis-Lardy, L.; Vanderhoeven, S.; Dassonville, N.; Koutika, L.S.; Meerts, P. Effect of the exotic invasive plant Solidago gigantea on soil phosphorus status. Biol. Fertil. Soils 2006, 42, 481–489. [Google Scholar] [CrossRef]
  44. Chen, C.R.; Condron, L.M.; Davis, M.R.; Sherlock, R.R. Effects of plant species on microbial biomass phosphorus and phosphatase activity in a range of grassland soils. Biol. Fertil. Soils 2004, 40, 313–322. [Google Scholar] [CrossRef]
  45. Cong, J.; Wang, X.; Liu, X.; Zhang, Y. The distribution variation and key influencing factors of soil organic carbon of natural deciduous broadleaf forests along the latitudinal gradient. Acta Ecol. Sin. 2016, 36, 333–339. [Google Scholar] [CrossRef]
  46. Chiti, T.; Díaz-Pinés, E.; Rubio, A. Soil organic carbon stocks of conifers, broadleaf and evergreen broadleaf forests of Spain. Biol. Fertil. Soils 2012, 48, 817–826. [Google Scholar] [CrossRef]
  47. Ehrenfeld, J.G. Effects of exotic plant invasions on soil nutrient cycling processes. Ecosystems 2003, 6, 503–523. [Google Scholar] [CrossRef]
  48. Geddes, P.; Grancharova, T.; Kelly, J.J.; Treering, D.; Tuchman, N.C. Effects of invasive Typha × glauca on wetland nutrient pools, denitrification, and bacterial communities are influenced by time since invasion. Aquat. Ecol. 2014, 48, 247–258. [Google Scholar] [CrossRef]
  49. Yuan, Y.; Guo, W.; Ding, W.; Du, N.; Luo, Y.; Liu, J.; Xu, F.; Wang, R. Competitive interaction between the exotic plant Rhus typhina L. and the native tree Quercus acutissima Carr. in Northern China under different soil N:P ratios. Plant Soil 2013, 372, 389–400. [Google Scholar] [CrossRef]
  50. Dunn, R.M.; Mikola, J.; Bol, R.; Bardgett, R.D. Influence of microbial activity on plant–microbial competition for organic and inorganic nitrogen. Plant Soil 2006, 289, 321–334. [Google Scholar] [CrossRef]
  51. Moreau, D.; Pivato, B.; Bru, D.; Busset, H.; Deau, F.; Faivre, C.; Matejicek, A.; Strbik, F.; Philippot, L.; Mougel, C. Plant traits related to nitrogen uptake influence plant-microbe competition. Ecology 2015, 96, 2300–2310. [Google Scholar] [CrossRef] [PubMed]
  52. Stein, L.Y.; Klotz, M.G. The nitrogen cycle. Curr. Biol. 2016, 26, R94–R98. [Google Scholar] [CrossRef] [PubMed]
  53. Hou, E.; Chen, C.; Luo, Y.; Zhou, G.; Kuang, Y.; Zhang, Y.; Heenan, M.; Lu, X.; Wen, D. Effects of climate on soil phosphorus cycle and availability in natural terrestrial ecosystems. Glob. Chang. Biol. 2018, 24, 3344–3356. [Google Scholar] [CrossRef] [PubMed]
  54. Ferenci, T. Regulation by nutrient limitation. Curr. Opin. Microbiol. 1999, 2, 208–213. [Google Scholar] [CrossRef]
  55. Waring, B.G.; Weintraub, S.R.; Sinsabaugh, R.L. Ecoenzymatic stoichiometry of microbial nutrient acquisition in tropical soils. Biogeochemistry 2014, 117, 101–113. [Google Scholar] [CrossRef]
  56. Manzoni, S.; Taylor, P.; Richter, A.; Porporato, A.; Ågren, G.I. Environmental and stoichiometric controls on microbial carbon-use efficiency in soils. New Phytol. 2012, 196, 79–91. [Google Scholar] [CrossRef]
  57. Mooshammer, M.; Wanek, W.; Hämmerle, I.; Fuchslueger, L.; Hofhansl, F.; Knoltsch, A.; Schnecker, J.; Takriti, M.; Watzka, M.; Wild, B.; et al. Adjustment of microbial nitrogen use efficiency to carbon:nitrogen imbalances regulates soil nitrogen cycling. Nat. Commun. 2014, 5, 3694. [Google Scholar] [CrossRef]
  58. Kominoski, J.S.; Hoellein, T.J.; Kelly, J.J.; Pringle, C.M. Does mixing litter of different qualities alter stream microbial diversity and functioning on individual litter species? Oikos 2009, 118, 457–463. [Google Scholar] [CrossRef]
  59. Thoms, C.; Gattinger, A.; Jacob, M.; Thomas, F.M.; Gleixner, G. Direct and indirect effects of tree diversity drive soil microbial diversity in temperate deciduous forest. Soil Biol. Biochem. 2010, 42, 1558–1565. [Google Scholar] [CrossRef]
  60. Wang, C.; Liu, D.; Bai, E. Decreasing soil microbial diversity is associated with decreasing microbial biomass under nitrogen addition. Soil Biol. Biochem. 2018, 120, 126–133. [Google Scholar] [CrossRef]
  61. Vellend, M. Effects of diversity on diversity: Consequences of competition and facilitation. Oikos 2008, 117, 1075–1085. [Google Scholar] [CrossRef]
  62. Liu, C.; Dong, Y.; Hou, L.; Deng, N.; Jiao, R. Acidobacteria Community Responses to Nitrogen Dose and Form in Chinese Fir Plantations in Southern China. Curr. Microbiol. 2017, 74, 396–403. [Google Scholar] [CrossRef] [PubMed]
  63. Zhang, Y.; Ding, K.; Yrjälä, K.; Liu, H.; Tong, Z.; Zhang, J. Introduction of broadleaf species into monospecific Cunninghamia lanceolata plantations changed the soil Acidobacteria subgroups composition and nitrogen-cycling gene abundances. Plant Soil 2021, 467, 29–46. [Google Scholar] [CrossRef]
  64. Wang, Q.; Wang, C.; Yu, W.; Turak, A.; Chen, D.; Huang, Y.; Ao, J.; Jiang, Y.; Huang, Z. Effects of nitrogen and phosphorus inputs on soil bacterial abundance, diversity, and community composition in Chinese fir plantations. Front. Microbiol. 2018, 9, 1543. [Google Scholar] [CrossRef] [PubMed]
  65. Xia, Z.-C.; Kong, C.-H.; Chen, L.-C.; Wang, S.-L. Allelochemical-mediated soil microbial community in long-term monospecific Chinese fir forest plantations. Appl. Soil Ecol. 2015, 96, 52–59. [Google Scholar] [CrossRef]
  66. Meng, M.; Lin, J.; Guo, X.; Liu, X.; Wu, J.; Zhao, Y.; Zhang, J. Impacts of forest conversion on soil bacterial community composition and diversity in subtropical forests. CATENA 2019, 175, 167–173. [Google Scholar] [CrossRef]
  67. Córdova, S.C.; Olk, D.C.; Dietzel, R.N.; Mueller, K.E.; Archontouilis, S.V.; Castellano, M.J. Plant litter quality affects the accumulation rate, composition, and stability of mineral-associated soil organic matter. Soil Biol. Biochem. 2018, 125, 115–124. [Google Scholar] [CrossRef]
  68. Cornwell, W.K.; Cornelissen, J.H.C.; Amatangelo, K.; Dorrepaal, E.; Eviner, V.T.; Godoy, O.; Hobbie, S.E.; Hoorens, B.; Kurokawa, H.; Pérez-Harguindeguy, N.; et al. Plant species traits are the predominant control on litter decomposition rates within biomes worldwide. Ecol. Lett. 2008, 11, 1065–1071. [Google Scholar] [CrossRef]
  69. Trivedi, P.; Delgado-Baquerizo, M.; Trivedi, C.; Hu, H.; Anderson, I.C.; Jeffries, T.C.; Zhou, J.; Singh, B.K. Microbial regulation of the soil carbon cycle: Evidence from gene–enzyme relationships. ISME J. 2016, 10, 2593–2604. [Google Scholar] [CrossRef]
  70. Fischer, M.S.; Stark, F.G.; Berry, T.D.; Zeba, N.; Whitman, T.; Traxler, M.F. Pyrolyzed substrates induce aromatic compound metabolism in the post-fire fungus, pyronema domesticum. Front. Microbiol. 2021, 12, 729289. [Google Scholar] [CrossRef]
  71. Wang, Z.; Ma, S.; Hu, Y.; Chen, Y.; Jiang, H.; Duan, B.; Lu, X. Links between chemical composition of soil organic matter and soil enzyme activity in alpine grassland ecosystems of the Tibetan Plateau. CATENA 2022, 218, 106565. [Google Scholar] [CrossRef]
  72. Zhou, J.; Xue, K.; Xie, J.; Deng, Y.; Wu, L.; Cheng, X.; Fei, S.; Deng, S.; He, Z.; Van Nostrand, J.D.; et al. Microbial mediation of carbon-cycle feedbacks to climate warming. Nat. Clim. Chang. 2012, 2, 106–110. [Google Scholar] [CrossRef]
  73. Zhou, H.; Di, L.; Hua, X.; Deng, T.; Wang, X. Bacterial community drives the carbon source degradation during the composting of Cinnamomum camphora leaf industrial extracted residues. Microbiol. Res. 2023, 14, 229–242. [Google Scholar] [CrossRef]
  74. Zhou, H.; Di, L.; Hua, X.; Deng, T.; Wang, X. The addition of a small dose of Cinnamomum camphora biomass unexpectedly enhanced lignocellulose degradation during the compost of Stropharia rugosoannulata cultivation materials. Sustainability 2023, 15, 10483. [Google Scholar] [CrossRef]
  75. Frostegård, Å.; Vick, S.H.W.; Lim, N.Y.N.; Bakken, L.R.; Shapleigh, J.P. Linking meta-omics to the kinetics of denitrification intermediates reveals pH-dependent causes of N2O emissions and nitrite accumulation in soil. ISME J. 2022, 16, 26–37. [Google Scholar] [CrossRef] [PubMed]
  76. Filippelli, G.M. The global phosphorus cycle: Past, present, and future. Elements 2008, 4, 89–95. [Google Scholar] [CrossRef]
  77. Dick, W.A.; Cheng, L.; Wang, P. Soil acid and alkaline phosphatase activity as pH adjustment indicators. Soil Biol. Biochem. 2000, 32, 1915–1919. [Google Scholar] [CrossRef]
  78. Peng, Z.; Wu, Y.; Guo, L.; Yang, L.; Wang, B.; Wang, X.; Liu, W.; Su, Y.; Wu, J.; Liu, L. Foliar nutrient resorption stoichiometry and microbial phosphatase catalytic efficiency together alleviate the relative phosphorus limitation in forest ecosystems. New Phytol. 2023, 238, 1033–1044. [Google Scholar] [CrossRef]
  79. Keane, J.B.; Hoosbeek, M.R.; Taylor, C.R.; Miglietta, F.; Phoenix, G.K.; Hartley, I.P. Soil C, N and P cycling enzyme responses to nutrient limitation under elevated CO2. Biogeochemistry 2020, 151, 221–235. [Google Scholar] [CrossRef]
  80. Luo, M.; Moorhead, D.L.; Ochoa-Hueso, R.; Mueller, C.W.; Ying, S.C.; Chen, J. Nitrogen loading enhances phosphorus limitation in terrestrial ecosystems with implications for soil carbon cycling. Funct. Ecol. 2022, 36, 2845–2858. [Google Scholar] [CrossRef]
  81. Zhen, Z.; Li, G.; Chen, Y.; Wei, T.; Li, H.; Huang, F.; Huang, Y.; Ren, L.; Liang, Y.; Zhang, D.; et al. Accelerated nitrification and altered community structure of ammonia-oxidizing microorganisms in the saline-alkali tolerant rice rhizosphere of coastal solonchaks. Appl. Soil Ecol. 2023, 189, 104978. [Google Scholar] [CrossRef]
  82. Ruyters, S.; Nicol, G.W.; Prosser, J.I.; Lievens, B.; Smolders, E. Activity of the ammonia oxidising bacteria is responsible for zinc tolerance development of the ammonia oxidising community in soil: A stable isotope probing study. Soil Biol. Biochem. 2013, 58, 244–247. [Google Scholar] [CrossRef]
  83. Krüger, M.; Potthast, K.; Michalzik, B.; Tischer, A.; Küsel, K.; Deckner, F.F.K.; Herrmann, M. Drought and rewetting events enhance nitrate leaching and seepage-mediated translocation of microbes from beech forest soils. Soil Biol. Biochem. 2021, 154, 108153. [Google Scholar] [CrossRef]
  84. Fuchslueger, L.; Kastl, E.M.; Bauer, F.; Kienzl, S.; Hasibeder, R.; Ladreiter-Knauss, T.; Schmitt, M.; Bahn, M.; Schloter, M.; Richter, A.; et al. Effects of drought on nitrogen turnover and abundances of ammonia-oxidizers in mountain grassland. Biogeosciences 2014, 11, 6003–6015. [Google Scholar] [CrossRef]
  85. Mulder, C.; Elser, J. Soil pH, ecological stoichiometry, and allometric scaling in soil biota. Nat. Preced. 2010. [Google Scholar] [CrossRef]
  86. Fuchsman, C.A.; Devol, A.H.; Saunders, J.K.; McKay, C.; Rocap, G. Niche partitioning of the N cycling microbial community of an offshore oxygen deficient zone. Front. Microbiol. 2017, 8, 2384. [Google Scholar] [CrossRef]
  87. Von Lützow, M.; Kögel-Knabner, I.; Ekschmitt, K.; Flessa, H.; Guggenberger, G.; Matzner, E.; Marschner, B. SOM fractionation methods: Relevance to functional pools and to stabilization mechanisms. Soil Biol. Biochem. 2007, 39, 2183–2207. [Google Scholar] [CrossRef]
  88. Kleber, M.; Bourg, I.C.; Coward, E.K.; Hansel, C.M.; Myneni, S.C.B.; Nunan, N. Dynamic interactions at the mineral–organic matter interface. Nat. Rev. Earth Environ. 2021, 2, 402–421. [Google Scholar] [CrossRef]
  89. Jilling, A.; Keiluweit, M.; Contosta, A.R.; Frey, S.; Schimel, J.; Schnecker, J.; Smith, R.G.; Tiemann, L.; Grandy, A.S. Minerals in the rhizosphere: Overlooked mediators of soil nitrogen availability to plants and microbes. Biogeochemistry 2018, 139, 103–122. [Google Scholar] [CrossRef]
  90. Mueller, C.W.; Rethemeyer, J.; Kao-Kniffin, J.; Löppmann, S.; Hinkel, K.M.; Bockheim, J.G. Large amounts of labile organic carbon in permafrost soils of northern Alaska. Glob. Chang. Biol. 2015, 21, 2804–2817. [Google Scholar] [CrossRef]
  91. Tao, J.; Wang, S.; Liao, T.; Luo, H. Evolutionary origin and ecological implication of a unique nif island in free-living Bradyrhizobium lineages. ISME J. 2021, 15, 3195–3206. [Google Scholar] [CrossRef] [PubMed]
  92. Gourion, B.; Delmotte, N.; Bonaldi, K.; Nouwen, N.; Vorholt, J.A.; Giraud, E. Bacterial RuBisCO is required for efficient Bradyrhizobium/Aeschynomene symbiosis. PLoS ONE 2011, 6, e21900. [Google Scholar] [CrossRef] [PubMed]
  93. Horecker, B.L.; Hurwitz, J.; Smyrniotis, P.Z. The role of xylulose 5-phosphate in the transketolase reaction. J. Biol. Chem. 1956, 223, 1009–1019. [Google Scholar] [CrossRef]
  94. Fullam, E.; Pojer, F.; Bergfors, T.; Jones, T.A.; Cole, S.T. Structure and function of the transketolase from Mycobacterium tuberculosis and comparison with the human enzyme. Open Biol. 2012, 2, 110026. [Google Scholar] [CrossRef] [PubMed]
  95. Yang, J.; Gu, Y.; Chen, Z.; Song, Y.; Sun, F.; Liu, J.; Waigi, M.G. Colonization and performance of a pyrene-degrading bacterium Mycolicibacterium sp. Pyr9 on root surfaces of white clover. Chemosphere 2021, 263, 127918. [Google Scholar] [CrossRef] [PubMed]
  96. Huang, R.-R.; Yang, S.-R.; Zhen, C.; Ge, X.-F.; Chen, X.-K.; Wen, Z.-Q.; Li, Y.-N.; Liu, W.-Z. Genomic molecular signatures determined characterization of Mycolicibacterium gossypii sp. nov., a fast-growing mycobacterial species isolated from cotton field soil. Antonie Van Leeuwenhoek 2021, 114, 1735–1744. [Google Scholar] [CrossRef]
  97. Kang, S.M.; Khan, A.L.; You, Y.H.; Kim, J.G.; Kamran, M.; Lee, I.J. Gibberellin production by newly isolated strain Leifsonia soli SE134 and its potential to promote plant growth. J. Microbiol. Biotechnol. 2014, 24, 106–112. [Google Scholar] [CrossRef]
  98. Garcia, F.H.S.; Barros, T.H.d.S.; Coelho, R.D.; Laborde, M.C.F.; Azevedo, R.A.; Lyra, D.H.; Kluge, R.A. Impact of the colonization of Leifsonia xyli subsp. xyli in a susceptible sugarcane genotype on water status and physiological traits. Eur. J. Plant Pathol. 2021, 159, 839–849. [Google Scholar] [CrossRef]
  99. Zavaglia, A.C.; Cia, M.C.; Popin, R.V.; Camargo, L.E.A. No alternative hosts of the sugarcane pathogen Leifsonia xyli subsp. xyli were identified among grass and non-grass species using novel PCR primers. Trop. Plant Pathol. 2016, 41, 336–339. [Google Scholar] [CrossRef]
  100. Wang, N.-Q.; Sun, J.; Huang, J.; Wang, P. Cloning, expression, and directed evolution of carbonyl reductase from Leifsonia xyli HS0904 with enhanced catalytic efficiency. Appl. Microbiol. Biotechnol. 2014, 98, 8591–8601. [Google Scholar] [CrossRef]
  101. Rastogi, A.; Banerjee, R. Production and characterization of cellulose from Leifsonia sp. Process Biochem. 2019, 85, 35–42. [Google Scholar] [CrossRef]
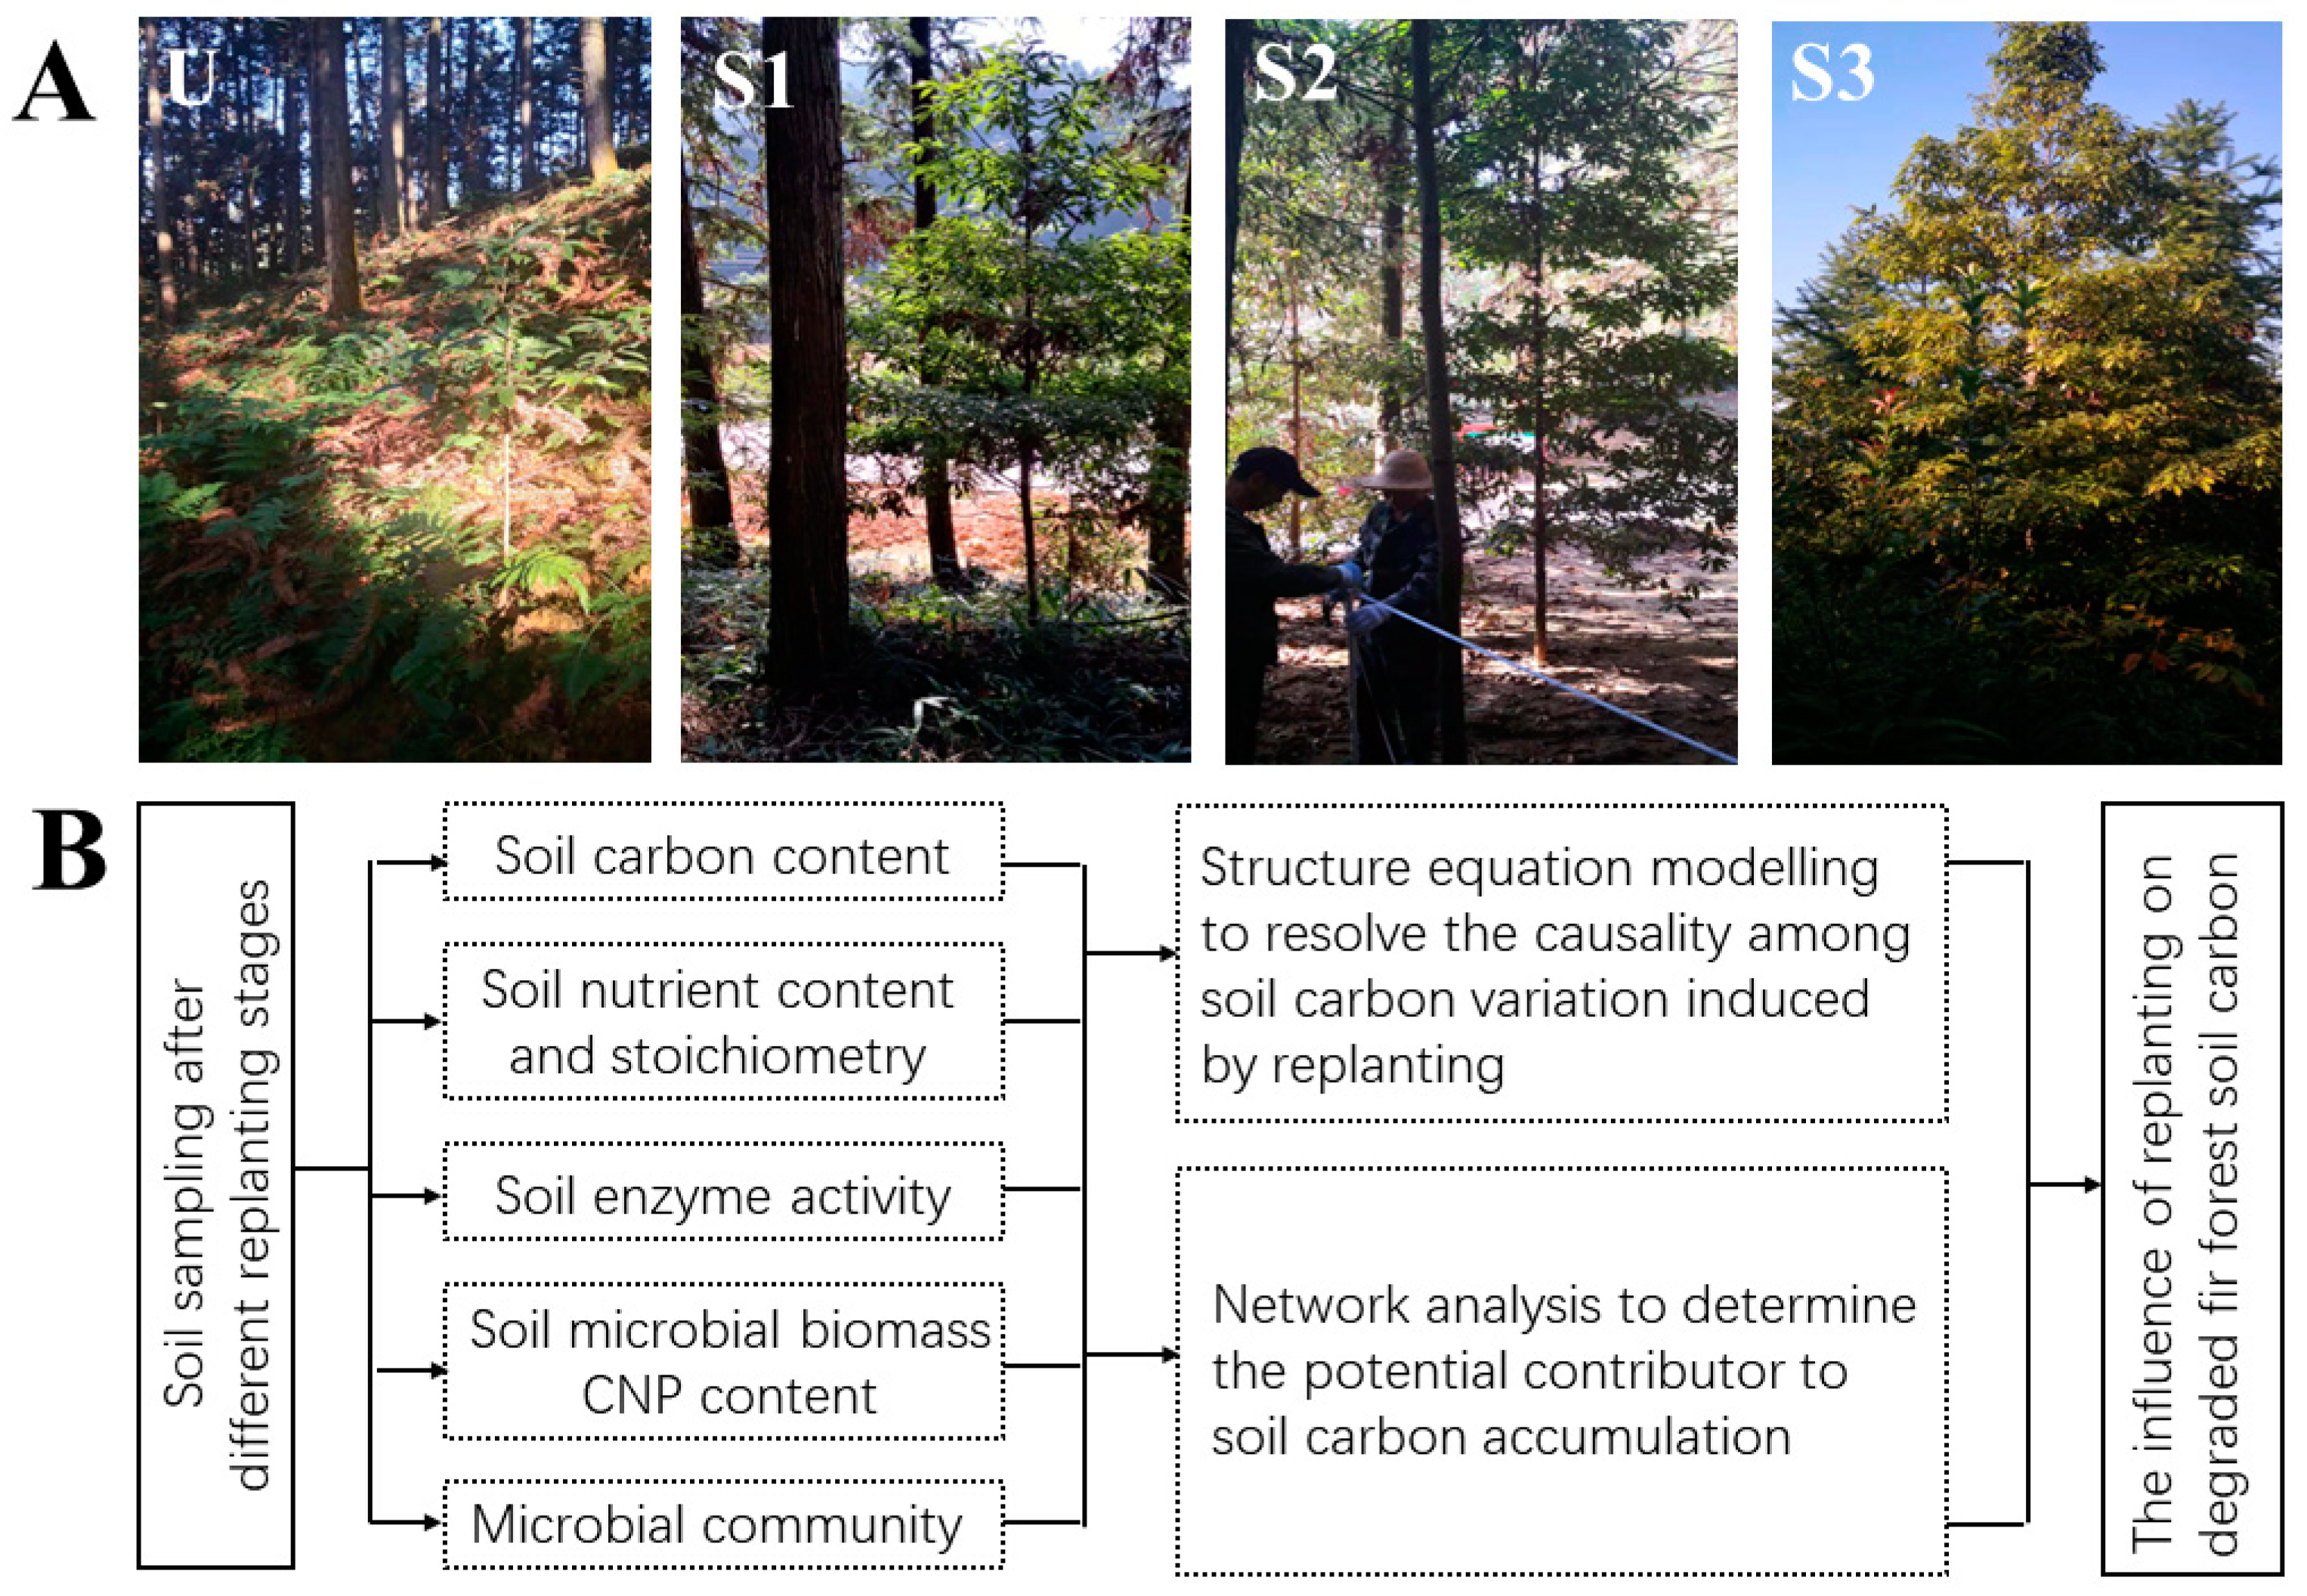
Figure 1. The sampling sites (A) and work flowchart (B).
Forests 14 02144 g001
Figure 2. Variation in soil and microbial carbon, nitrogen, and phosphorus content and stoichiometry ratios. The x-axis represents different stages after replanting: U (0 years), S1 (5 years), S2 (8 years), and S3 (12 years). The different letters above the bars indicate significant differences between stages (Tukey’s HSD test, one-tailed: p < 0.05, n = 4). The red dotted line in panels (JO) indicates the corresponding top threshold of the Redfield ratio. TC, TN, and TP indicate total carbon, total nitrogen, and total phosphorus, respectively. MBC, MBN, and MBP indicate microbial carbon, microbial nitrogen, and microbial phosphorus content, respectively. AN and AP indicate alkaline-hydrolytic nitrogen and available phosphorus, respectively.
Forests 14 02144 g002
Figure 3. Soil enzyme activity of different stages. The x-axis represents different stages after replanting: U (0 years), S1 (5 years), S2 (8 years), and S3 (12 years). The different letters above the bars indicate significant differences between stages (Tukey’s HSD test, one-tailed: p < 0.05, n = 4).
Forests 14 02144 g003
Figure 4. Variation in microbial community diversity and composition. In panels (AF), U, S1, S2, and S3 on the x-axis indicate 0, 5, 8, and 12 years after replanting, respectively. The different letters above the bars indicate significant differences between stages (Tukey’s HSD test, one-tailed: p < 0.05, n = 4). Panel (G) shows principal coordinate analysis performed at the species level.
Forests 14 02144 g004
Figure 5. Structural equation modeling resolving the various contributions to soil total carbon (TC). Panel (A) depicts the model; panel (B) depicts the standard effects. *, ** and *** indicate significantly correlated under p < 0.05, p < 0.01 and p < 0.001 levels, respectively.
Forests 14 02144 g005
Figure 6. Co-occurrence network analysis. Blue, dark green, and gray dots indicate bacterial members, fungal members, and unclassified members, respectively. Light green dots indicate environmental factors and enzymes. Blue and yellow lines indicate negative and positive links, respectively.
Forests 14 02144 g006
Figure 7. Variation in acidic phosphatase per unit of microbial biomass phosphorus. The x-axis represents different stages after replanting: U (0 years), S1 (5 years), S2 (8 years), and S3 (12 years). The different letters above the bars indicate significant differences between stages (Tukey’s HSD, one-tailed: p < 0.05, n = 4).
Forests 14 02144 g007
Table 1. Basic forestry information regarding the sampling sites.
AgeAltitude
(m)
Slope
(°)
Tree SpeciesMean Tree Height
(m)
Mean Diameter at Breast Height
(cm)
Stand Density
(n/ha)
U0a17424C. Lanceolata19.5324.831190
S15a 16521P. bournei1.743.521150
C. Lanceolata20.1725.15765
S28a 17023P. bournei3.225.241190
C. Lanceolata21.8324.72792
S312a 17024P. bournei5.658.151180
C. Lanceolata22.3425.31788
Note: The letter “a” in column “Age” indicates “years”; “U”, “S1”, “S2”, and “S3” are the abbreviations of different groups 0, 5, 8, and 12 years after replanting, respectively.
Disclaimer/Publisher’s Note: The statements, opinions and data contained in all publications are solely those of the individual author(s) and contributor(s) and not of MDPI and/or the editor(s). MDPI and/or the editor(s) disclaim responsibility for any injury to people or property resulting from any ideas, methods, instructions or products referred to in the content.