Article

Effects of Chemical Soil Characteristics, Air Temperature and Precipitation on Pinus pinea Growth in Southern Inland Portugal

MED—Mediterranean Institute for Agriculture, Environment and Development & CHANGE—Global Change and Sustainability Institute, Instituto de Investigação e Formação Avançada, Departamento de Engenharia Rural, Escola de Ciências e Tecnologia, Universidade de Évora, Apartado 94, 7002-544 Évora, Portugal
*
Author to whom correspondence should be addressed.
Forests 2023, 14(11), 2160; https://doi.org/10.3390/f14112160
Submission received: 6 October 2023 / Revised: 23 October 2023 / Accepted: 26 October 2023 / Published: 30 October 2023
(This article belongs to the Section Forest Ecology and Management)

Abstract

:
Pinus pinea is widely distributed in the Mediterranean basin. In Portugal, it is predominantly located in the southwestern coastal area. Yet, there are also forest areas of Pinus pinea in inland southern Portugal. Four plots were settled to study the effects of soil chemical characteristics, air temperature and precipitation on Pinus pinea growth. In these plots, stand structure, soil texture, soil organic matter, soil content on macronutrients and micronutrients, air temperature and precipitation were analysed. The results indicate that the greatest growth was achieved in the plots with good availability of nutrients and the highest precipitation, whereas the lowest growth was observed in the plots with the lowest precipitation. There seems to be a trend toward the main limiting factor to Pinus pinea growth being the availability of water.

1. Introduction

Umbrella pine (Pinus pinea) is an autochthone species of the Mediterranean basin, which is distributed from Portugal to Turkey [1] with both ancient and recent areas [2]. The dissemination of this species is probably explained by the plasticity of its traits. It develops well in a wide range of elevations, more frequently below 1000 m, but is found in Lebanon at 1500 m and in Chile at 2000 m [3]. The mean annual precipitation thresholds range from 300 mm to 1500 mm [4], with accumulated precipitations in the driest months (June to September) from 15 mm to 125 mm [3]. It is well adapted to the inter-annual precipitation variability typical of the Mediterranean climate [3]. The thresholds for temperature are 10–18 °C for mean annual temperature, −2–7 °C for mean minimum temperature, 27–32 °C for mean maximum temperature, −19 °C for absolute minimum temperature and 41 °C for absolute maximum temperature [4]. It is well adapted to coastal areas supporting salty wind ([4] and references therein). It is considered a pioneer species, being able to develop in poor sites due to its well-developed root system, thus accessing water in different soil depth layers [5]. More frequently, the stands of Pinus pinea are located in incipient soils, Arenosols, Regosols, Leptosols or, in the best sites, in Cambisols or Luvisols [3]. Though it seems that it prefers neutral soils, it can grow in soils with pH ranging from 5 to 9. It prefers soils of light texture, such as sandy to sandy loam and gravelly. Heavy soils with proportions of sand, silt and loam, <40%, ≥40% and >30%, respectively, constrain the root system development [3]. Yet, umbrella pine develops in heavy soils as long as they are not waterlogged and inter-specific competition is low [1]. This species prefers soils with water retention capacity higher than 60 mm [3]. However, the increase in temperature and the decrease in precipitation might result in the expansion of suitable conditions for this species’ development northward of the Mediterranean basin. For Portugal, the suitable and very suitable areas correspond to central and southern Portugal [6].
Alentejo corresponds to about 30% of the area of continental Portugal (Figure 1). It is characterised by plains and soft rolling hills in the west and south and hills in the northeast. The elevation ranges between about 200 m and 1010 m. The region has a Mediterranean climate (Csa, according to Koppen classification) with mild, wet winters; warm, dry summers and a dry season between May and September. The Atlantic influence on climate is stronger in the coastal areas and higher elevations and is reflected in the higher annual precipitations and milder air temperatures. The continental (Iberian) influence on climate is marked in eastern Alentejo, denoted by lower annual precipitation and higher thermal amplitudes (colder winters and warmer summers).
The areas better suited for umbrella pine are predominantly in Alentejo Litoral, near the coast [4] (cf., Figure 1). The umbrella pine area has been increasing in continental Portugal. There were 120.2 × 10³ ha in 1995 and 193.5 × 10³ ha in 2015, corresponding to an increase of circa 60%, with most of the stands pure, 160 × 103 ha. About 68% of the stands are located in Alentejo (131.5 × 10³ ha), the majority in Alentejo Litoral (42.3%) and Baixo Alentejo (38.0%), followed by Alentejo Central (16.7%) and Alto Alentejo (9.1%) [7].
Several studies addressed growth in diameter and height for umbrella pine in the areas better suited for its development and production [8,9]. In these areas, with a mean annual precipitation of about 600 mm, a mean annual air temperature of circa 16 °C, air humidity between 70% and 90% [10] and a dry season between May and September, the mean annual increment in diameter ranged from 0.9 cm to 1.7 cm, and the height increment between 0.2 m and 0.3 m in mature trees [8,9]. Moreover, growth was promoted by mild air temperature and precipitation, the latter both in the autumn of the prior year and spring of the current year. The younger the trees, the more sensitive they were to precipitation [8]. Furthermore, drought had a negative effect on growth due to the decrease in precipitation (especially in spring) and the increase in air temperature and, thus, the increase in water stress [11,12,13]. The effects of drought might be mitigated in years of high precipitation that enhance the resistance and recovery of umbrella pine individuals [14] and by the increase of soil moisture [15]. Inversely, the increase in temperature, with the consequent increase in evapotranspiration, can have a negative effect on growth [13,16].
The availability of water and nutrients, as well as their absorption by trees, is influenced by the soil. Typically, growth increases with greater water and nutrient availability [17]. This is linked to the allocation of biomass in trees. In sites where water and/or nutrients are scarce, trees tend to allocate resources to their root systems, facilitating the acquisition of water and nutrients from a larger volume of soil [18]. Furthermore, nutrient uptake is connected to the availability of soil water, with higher soil moisture levels promoting nutrient absorption [19]. Precipitation and temperature also exert an influence on growth. Precipitation affects the amount of water that reaches the soil and, thus, the water available to trees, while temperature impacts the suitable thermal conditions for photosynthesis [20]. Generally, a decrease in the availability of water and nutrients enhances competition among trees within a stand and leads to diminished growth [21,22,23].
Several thousand hectares of umbrella pine have been planted in inland southern Portugal, yet to the authors’ best knowledge, no study regarding the effects of soil chemical characteristics, air temperature and precipitation on its growth has been conducted. This study’s goals are the evaluation of the influence of soil chemical characteristics (texture, soil organic carbon, cation exchange capacity, carbon/nitrogen ratio and macronutrients and micronutrients), air temperature and precipitation in tree growth. The specific objectives are as follows: (i) Do the patterns of tree growth and stand development show similar trends for all the study plots? (ii) Are soil chemical characteristics indicative of limitations in nutrients uptake?; (iii) Are air temperature and precipitation constraining tree development?

2. Materials and Methods

Four plots were settled to represent the variability of soil and climate in Alentejo Central and Baixo Alentejo (Table 1, Figure 1). Using the national forest inventory [7], all areas of umbrella pine were identified in inland Alentejo. A stratified random sampling design was used to select the stands. The four plots were established in stands of circa 30 years, in Evoramonte (DEV01) in 2018, Torre de Coelheiros (DTC01, DTC02) in 2019 and Mértola (DME01) in 2020. All plots at the year of establishment were surveyed for the dendrometric variables and soil variables. The dendrometric variables measured for all the umbrella pine trees in each plot were the diameter at breast height (at 1.3 m), total height, the height of the beginning of the crown and four crown radii in the four main cardinal directions (north, south, east and west) [24].
Plot stand structure was evaluated with absolute density measures, namely the number of trees (N, trees ha−1), basal area (G, m2 ha−1), crown cover (CC, %) and mean quadratic diameter (dg, cm). Mean crown radii (rm, m) was defined as the arithmetic mean of the four crown radii measured and crown length (lc, m) as the difference between total height and height of the beginning of the crown. The diameter and height distributions, in classes of 2.5 cm and 1 m, respectively, were used to characterise the plots. To evaluate tree stability, potential photosynthetic ability and vigour, five structure indices were calculated: hd ratio (hd), the ratio between total height and diameter at breast height both in the same units; crown ratio (cr, %), the relation between the crown length and total height; crown spread ratio (csr), the quotient between crown diameter and total height; linear crown index (lci, %), the quotient between crown diameter and diameter at breast height and crown thickness index (cfi, %), the quotient between crown diameter and crown length. The differences between the trees of the plots for diameter at breast height, total height and structure indices were evaluated with the Wilcoxon non-parametric test, as normality assumptions were not met (evaluated with the Shapiro–Wilk normality test). The statistical analysis was performed with R project version 4.0.3 [26]. The level of significance used was 0.05.
According to the mapped units at a scale of 1:50,000 [27], three plots (DEV01, DTC01 and DMEV01) had complex soil patterns, and one (DTC02) was established in a single soil map unit (Table 1). All soils were submitted to deep tillage before tree planting; thus, the original soil horizons in the first half meter depth or more were disturbed and mixed. This human-made soil change, as well as soil diversity at the field scale, explained soil data collected (cf., Section 3.2, [25]) from soil units in each plot (Table 1).
One composite soil sample per plot was collected for two layers: 0–20 cm and 20–50 cm depth. Soil was sampled twenty times, below the limit of the crown projection of ten sampled trees (two samples per tree), starting with the north–south direction, changing to the west–east direction in the second tree, and alternating consecutively until the 10th tree. Composite soil samples were transported to the laboratory in plastic bags, air-dried and analysed for the following soil properties and methods [28]: texture by the pipette method, soil organic carbon and total nitrogen (N) by dry combustion in furnaces equipped with an elemental analyser (LECO), pH(H2O) and pH(KCl) by potentiometry (1:2.5 soil/water ratio) as well as cation exchange capacity and exchange cations with ammonium acetate at pH 7.0. Soil macronutrients and micronutrients were also determined [28]: extractable phosphorus (P), potassium (K) and magnesium (Mg) (reported as P2O5, K2O and Mg, respectively) with ammonium lactate and acetic acid (Egnér–Riehm method); extractable iron (Fe), manganese (Mn), zinc (Zn) and copper (Cu) with ammonium acetate, acetic acid and EDTA (Lakanen and Erviö method) and extractable boron (B) by the boiling water method.
Data on air temperature and precipitation were collected from the records of the closest weather stations (Table 1), namely Estremoz (DEV01), Évora (DTC01 and DTC02) and Mértola (DME01), which are included in the national meteorological network of the Portuguese Institute for Sea and Atmosphere [10]. The (daily) records obtained covered the period between January 2014 and December 2020. Normal values of air temperature and rainfall for Évora and Mértola were obtained from the Climate Normals provided by IPMA for the period 1970–2000 [10]. As no official Climate Normals were available for Estremoz, unofficial data were collected on thematic sites [29]. Consequently, comparisons between these two data sets should be accepted with reservation.
According to Climate Normal data (1971–2000), mean annual temperatures were about 16 °C (Table 1). Mean temperatures in the coldest month (December) ranged from 8.4 °C in Estremoz to about 9.5 °C in the other two locations, whereas the hottest month (July or August) always exceeded 23 °C (slightly lower than 25 °C in Estremoz and Mértola). Mean annual thermal amplitudes ranged from 9.7 °C in Évora to 12.0 °C in Mértola. Normal annual precipitations ranged from 476 mm (Mértola) to 611 mm (Estremoz) (Table 1). December was, on average, the rainiest month (mean values ranging from 69 mm in Estremoz to 105 mm in Évora), whereas July and August are the driest months (in which the mean precipitation never exceeded 10 mm). Monthly and annual (average) temperature and (total) precipitation data for the period analysed (2014–2020) were calculated from the daily data provided. The monthly values of both parameters were grouped into quarters roughly corresponding to the four seasons: winter (1st), spring (2nd), summer (3rd) and autumn (4th). All the monthly, quarterly and annual values estimated were also averaged for the period under study.

3. Results

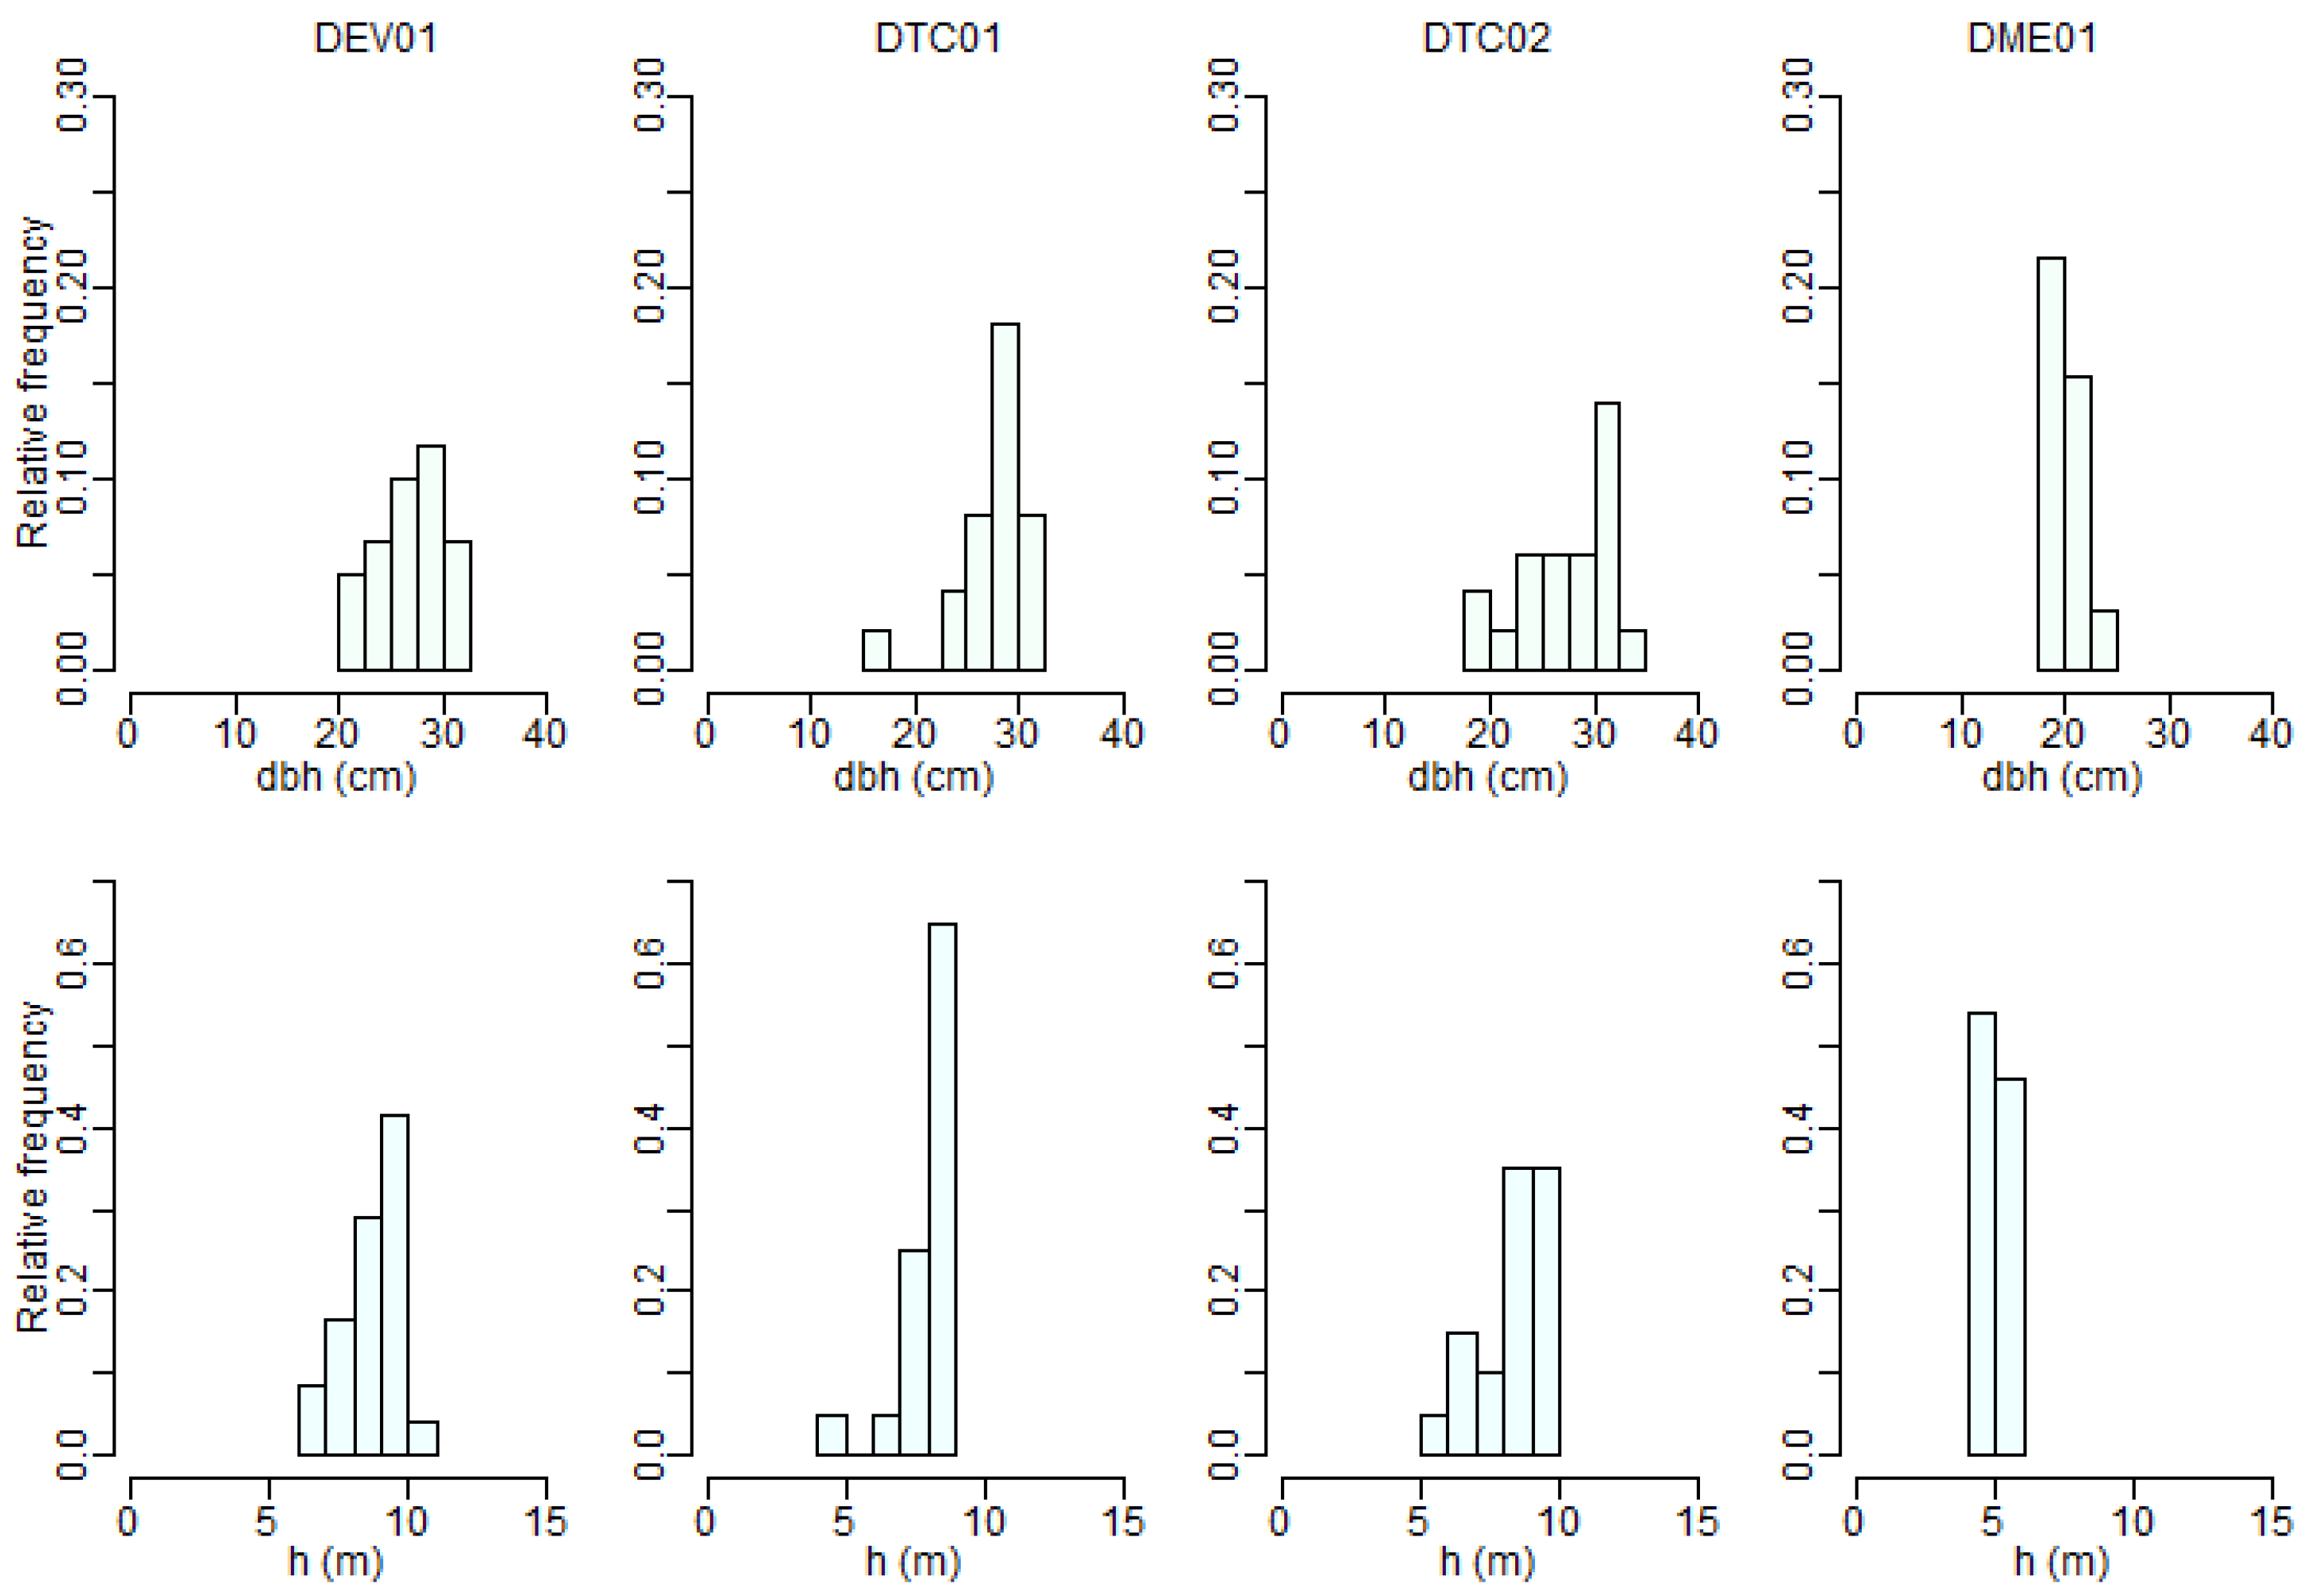
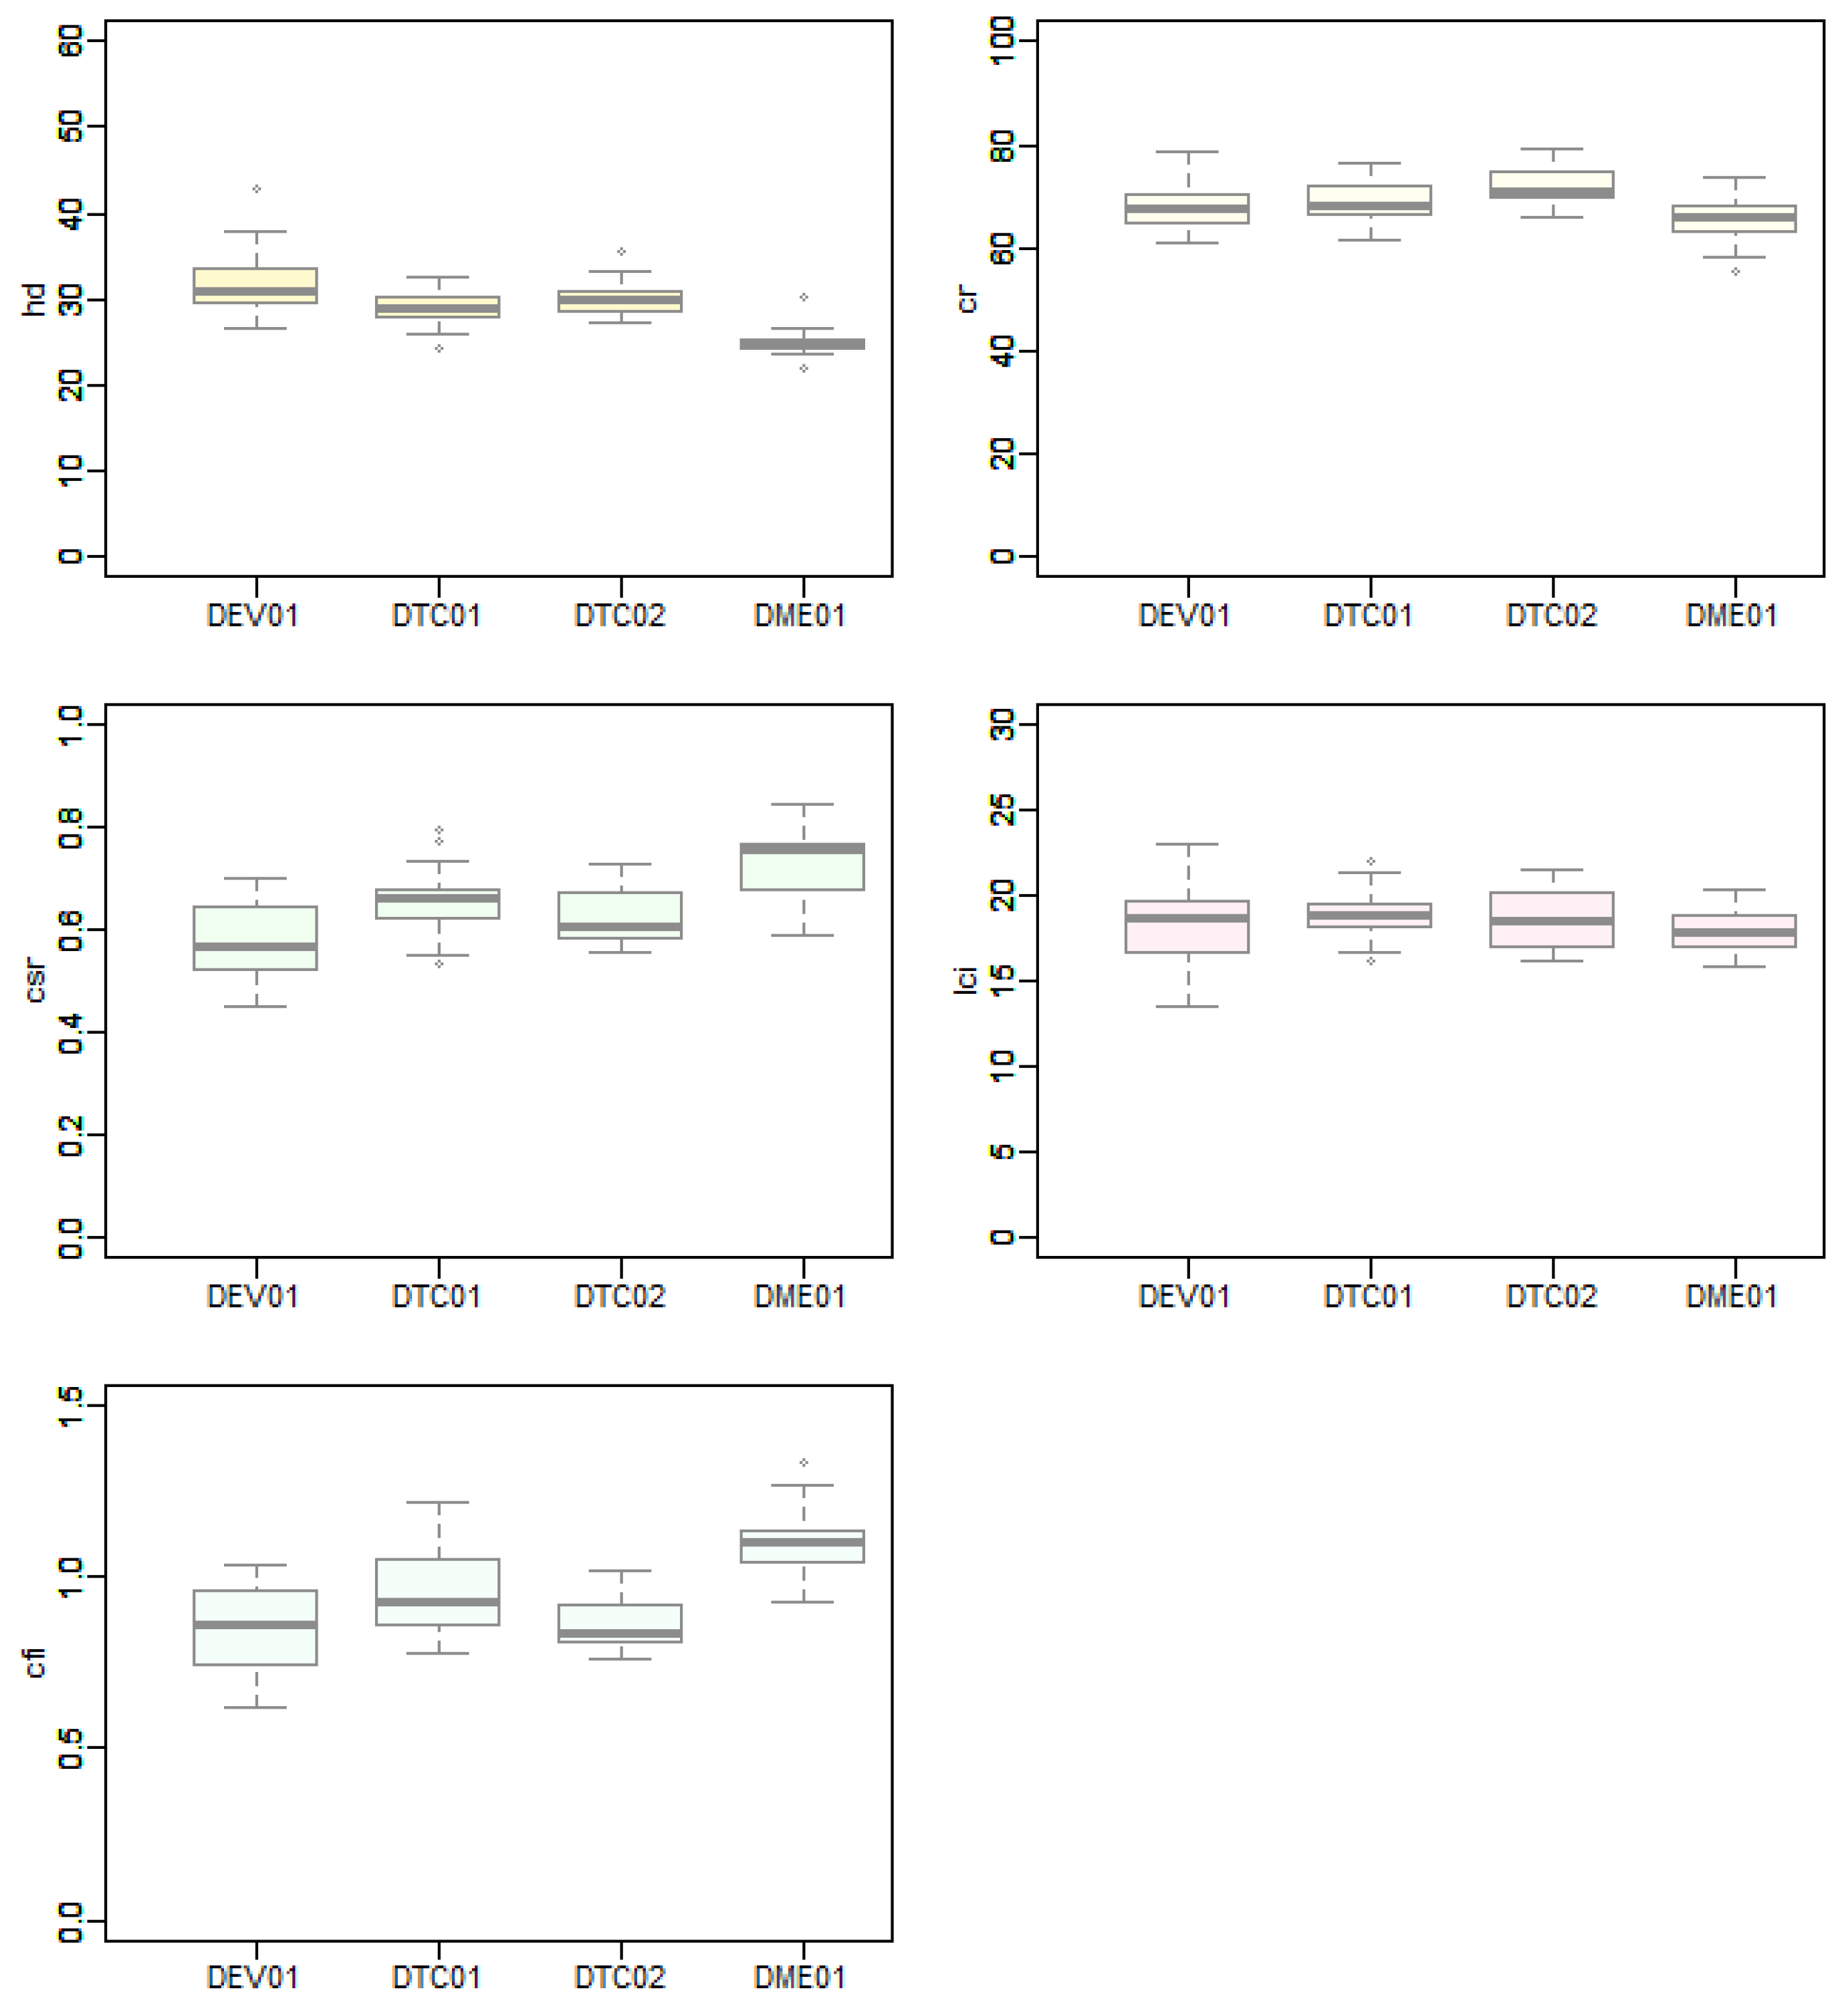
3.1. Stand Structure

The absolute density measures were similar for all plots except for DME01, which had a much lower density (Table 2). Significant differences were observed for diameter at breast height and total height between DME01 and the other three plots (all, p < 0.5) but not between the pairs of the other plots.
The diameter and height distributions were representative of even-aged stands. The plots had similar diameter and height distributions, but in DME01, the range was narrower and located leftwards when compared with the other plots (Figure A1). This was also noticed in the mean quadratic diameter (Table 2), mean crown radii and crown length (Figure A2).
The structure indices indicated that trees were stable (hd < 45 and csr >0.5), with good potential growth and vigour (cr ≥ 30%), mainly in free growth (csr ≥ 0.62), had balanced crowns (cfi between 0.6 and 1.0) and a trend to balanced stem and crown diameters (lci between 13.5 and 22.9), both at the tree (Figure A3) and plot (Table 2) level. Yet, there was a different behaviour between plots. The greatest hd was attained at DEV01, while the lowest was at DME01, though the variability was higher in the former than in the latter. Inversely, csr and cfi were the largest for DME01 and smallest for DEV01, while cr and lci were within similar ranges for all plots. Significant differences were found for hd between DEV01 and DTC01 and between DEM01 and the other three plots; for cr between DEV01 and DTC02, between DTC01 and DTC02 and between DTC2 and DME01; for csr between all plots except between DTC01 and DTC02 and for cfi for all plots except for DEV01 and DTC02. For lci, no significant differences were found between plots.

3.2. Chemical Soil Characteristics

The soils in all four plots had similar class textures in both soil layers (0–20 and 20–50 cm), three with sandy loam texture and one (DME01) with loamy soil texture (Table 3). Moreover, DTC01 showed a textural change between the two layers, from sandy loam to sandy clay loam. Soil organic carbon (SOC) concentration was the highest in DME01, especially in the 0–20 cm layer, and it also had the highest carbon-to-nitrogen ratio (C/N = 30.2), which suggested that some non-completely humified organic materials may have been present in the collected soil samples. The soils from the other three plots showed similar SOC and C/N values. All soils were neutral to slightly acidic. DEV01 and DME01 soils had the lowest pH values (approximately pH 5.5 in the 20–50 cm layers). Cation exchange capacity was similar among all soils. Its highest values were found in the second layer (20–50 cm) of DTC01 and DTC02, with 13.04 and 11.44 cmol(+) kg−1), respectively, corresponding to the layer with the highest clay content in each soil (Table 3).
The soils showed similar values of extractable nutrients and some common trends. Table 4 presents soil nutrient data and an interpretation system usually adopted in Portugal though better calibrated for agricultural crops [30]. For macronutrients, phosphorous had very low levels in all soils (and layers), though there was a difference of almost an order of magnitude from 1.80 mg kg−1 in DME01 (20–50 cm, layer) to 13.18 mg kg−1 in DTC01 (0–20 cm layer). Magnesium was very high in all soils (and layers). Potassium had high values in the upper layer and medium in the lower layer, except in DEV01 soil, which had high values in both layers. Micronutrients showed a more diverse pattern. Iron and copper were the most homogeneous among the different soils, with high or very high levels of iron and medium levels of copper in all soils. Manganese showed high levels in all soils except in DME01, which had very low values. Zinc tended to be low in all soils and very low in DME01. Except for DTC02, which had low to very low levels, the other plots’ soils had medium levels of boron (Table 4).

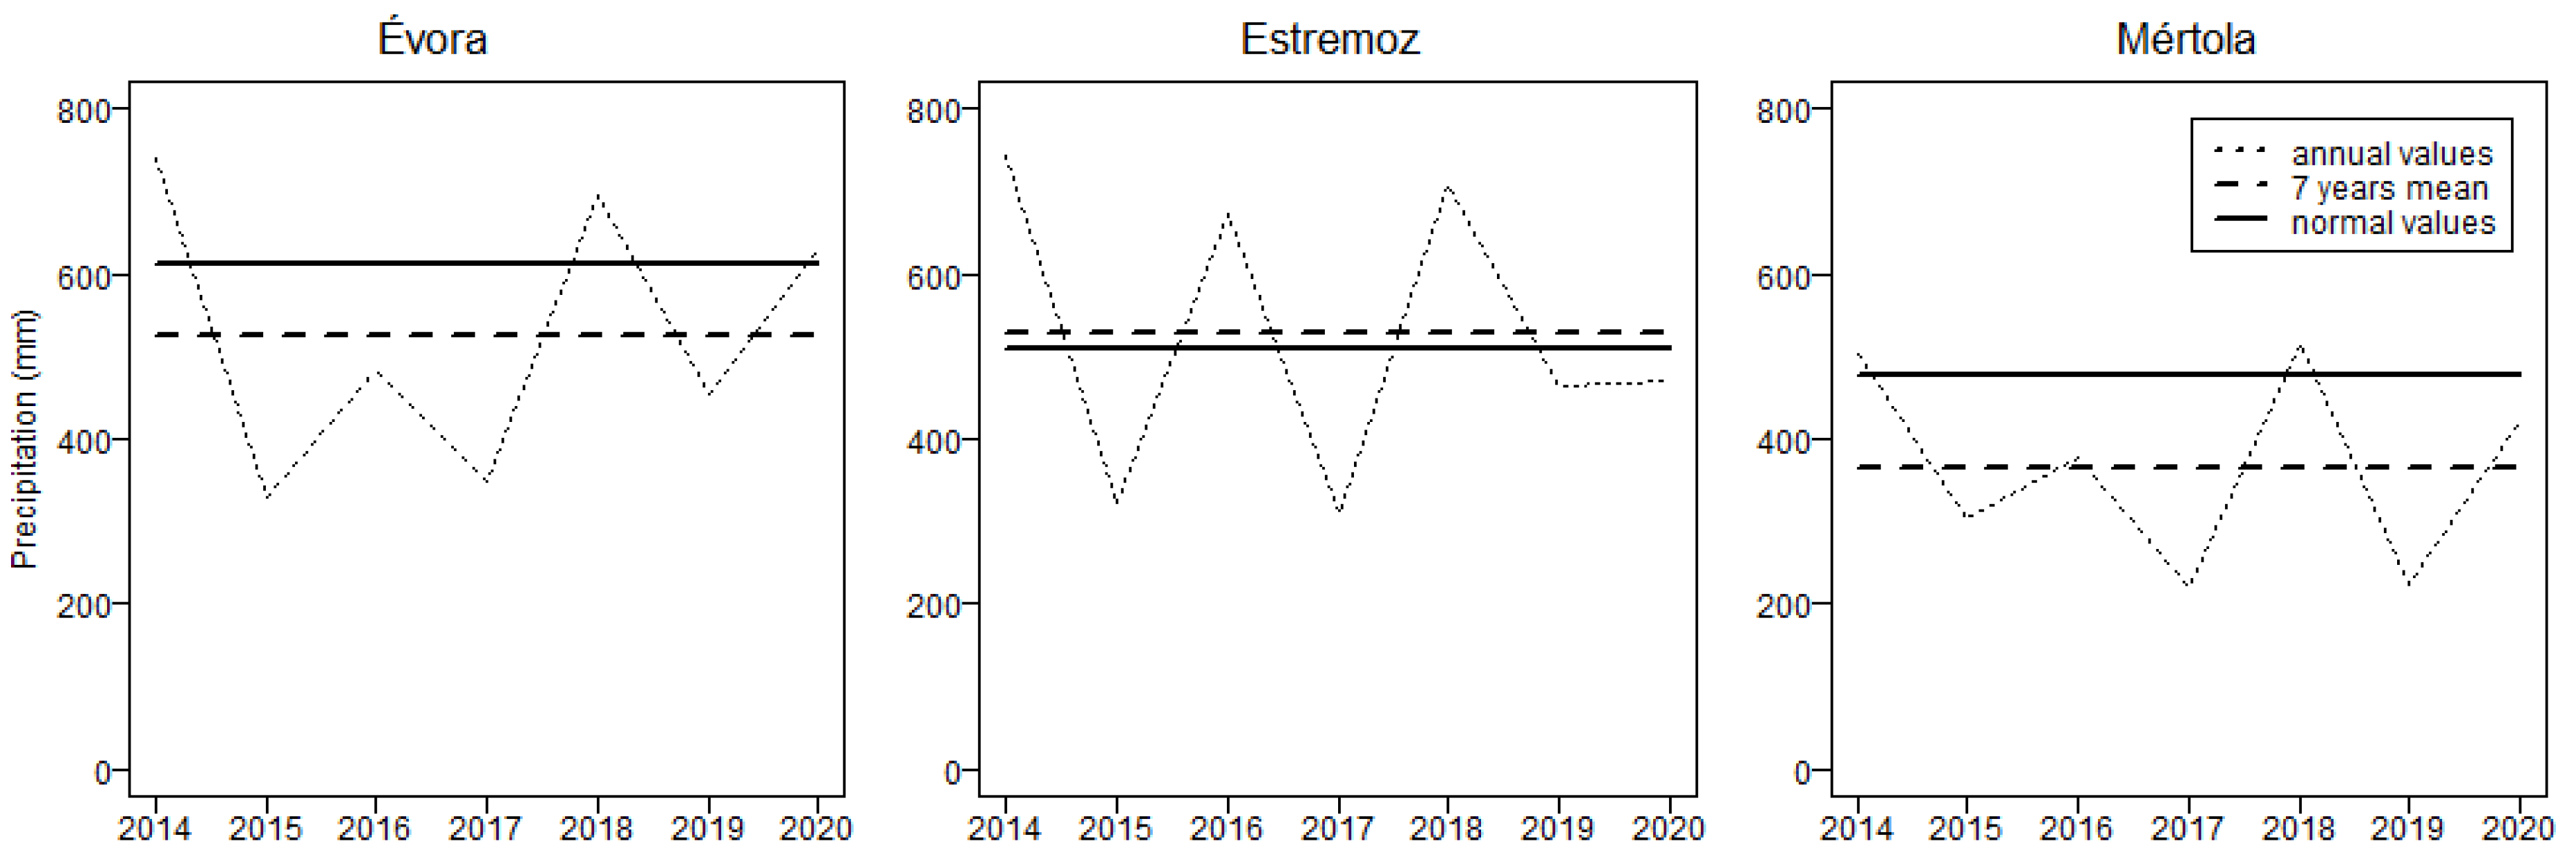
3.3. Air Temperature and Rainfall

For all periods under survey (2014–2020), Mértola was the hottest location and Estremoz the coolest. Moreover, the annual thermal amplitudes were greater in Mértola and smaller in Évora (Table 5). Although inter-annual and inter-quarterly variability in air temperature and precipitation was considerable, it did not show a clear trend. On average, mean annual air temperature exceeded normal values in Évora (by 0.5 °C) and Mértola (by 0.1 °C). This trend was not observed in one year in the former (2018) and in two years in the second (2014 and 2018). Conversely, the average air temperature in Estremoz was lower (by 0.3 °C) than the normal value in 5 years (only 2017 and 2020 were warmer than normal) (Figure 2). The average air temperatures in spring and summer were greater than normal values in Évora (≥1 °C) and Mértola (from 0.3 to 0.9 °C). On the contrary, winters were, on average, colder than normal (from 0.3 to 0.5 °C). The average in autumn had temperatures similar to normal values (differences ≤0.1 °C). In Estremoz, the first three quarters (winter, spring and summer) were colder than normal (<0.3 to <0.5 °C) (Table 5).
The year 2017 was the hottest of the 2014–2020 period, whereas 2018 was the coldest. This was mainly due to a particularly warm spring in 2017 (almost 2 °C more than the estimated average for the period under study) and a cold autumn in 2018 (≤0.5 °C than the normal value). A very mild winter in the three locations was the major reason for the average annual temperatures in 2020 to be well above reference values.
The average annual rainfall during the studied period was lower than the normal values in Évora and Mértola but very close to it in Estremoz (Figure 3). However, it presented a marked inter-annual and inter-quarter variability. In Évora and Mértola, only two years, 2014 and 2018, were rainier than the normal average, whereas in Estremoz, this occurred in the three even years (Figure 3). There was a generalised decrease in the average quarterly precipitation (Table 6) when compared to the normal values (the exception was the 1st quarter in Estremoz with +46 mm). The decrease was greater in autumn (−50 mm, −19 mm and −65 mm in Évora, Estremoz and Mértola, respectively) than in the other quarters. In the 2nd and 3rd quarters, in all locations, the decrease was smaller or equal to 10 mm, and in the 1st quarter was −14 mm and −31 mm for Évora and Mértola, respectively.
In Mértola, the normal values were lower, and it always rained less than in the other two places (only in 2015 were the values similar for the three locations). The average annual rainfall for the period analysed ranged from 366 mm in Mértola to 526–527 mm in Évora and Estremoz, respectively (Figure 3).

4. Discussion

All plots had diameter and height distributions of even-aged stands [31], yet tree dimensions were smaller in DME01, indicative of smaller growth rates [31,32]. The diameter and height variability observed between plots, denoted by the average growth in diameter, varied between 0.6 cm y−1 and 1.1 cm y−1, while height ranged between 0.1 m y−1 and 0.4 m y−1. These increments in diameter were lower than those reported for the coastal areas (from about 0.9 cm to 1.7 cm) [8,9]. Inversely, height growth was within the range or larger than the reported for the coastal areas [8,9]. The structure indices indicated very stable trees, hd < 45 [33,34,35], whether at tree level (Figure A3) or plot level (Table 2). Trees had good growth and vigour potential, cr ≥ 30%, and stability, cr > 50% [31,32], which conformed with the result attained with hd. The csr for most trees (Figure A3) and for all plots, except DEV01 (Table 2), was indicative of good stability to the wind (csr > 0.5) and free growth (csr ≥ 0.62) [36]. The lci per plot ranged between 18 and 19 (Table 2) and between 13.5 and 22.9 per tree, higher than the defined threshold for balanced stem and crown diameters for pines, 15 to 18, but closer to that of the broadleaved species, 22 [37]. Yet, the crown dimensions of Pinus pinea resemble more the broadleaved species than other pine species, such as Pinus sylvestris or Pinus nigra, which were the species used to define the thresholds [37]. The cfi per tree (Figure A3) and per plot (Table 2) had most of the values between 0.6 and 1.0, indicative of balanced crowns [32]. Despite the overall vigour and stability, the differences between the plots were indicative of lower growth and density (N and G) in DME01 than in the other three plots (less than half for N and G, and −22% for id and −33% for ih). This could be indicative of edaphic and/or climatic constraints to growth in DME01 [11,13,14,38,39].
The plots were established in Regosols and Luvisols, with pH (neutral to slightly acid) and texture (coarse to medium) (Table 3), amongst the preferred soil characteristics for umbrella pine [3,5]. DEV01 soil had the best external and internal drainage (and aeration) due to its coarse texture in the 0–50 cm depth (sandy loam) and the fragmented nature of the soil’s parent material (gneiss or similar rocks) (Table 1). Despite the general similarity in soil layers’ texture (Table 3), silt and fine sand content suggested the following ranking of the available water capacity for the 0–50 cm depth: DME01 > DTC02 > DEV01 ≌ DTC01. However, in DTC01 and DTC02 soils, the total available water capacity is likely to be higher due to their higher effective soil depth (Table 1). The soil macronutrients showed great homogeneity among all plots (Table 4): phosphorus was very low, and magnesium was very high. The weighted mean for the 0–50 cm layer gave high values of potassium in the DEV01 plot and medium values in DTC01, DTC02 and DME01 (125, 93, 76 and 74 mg kg−1 K2O, respectively). These results were similar to the levels found for phosphorus and potassium in plots near the coast but were opposite for magnesium, which had predominantly low levels in the latter areas [39]. Although the macronutrients levels seemed equal or even higher than those observed in more productive areas, the K/Mg ratio (0.59, 0.22, 0.17 and 0.26, respectively, for DEV01, DTC01, DTC02 and DME01) was much lower than that near the coast (K/Mg > 0.7) [38]. Absolute values of extractable potassium (Table 4) suggested no risk of deficiency, as reported for Pinus radiata [40], but the risk of imbalance between K and Mg should be addressed in future studies in these drier inland regions. Taking into account the critical role that potassium plays in plants’ drought resistance [41], increasing the low K/Mg ratio in these dry inland regions could improve umbrella pines’ resistance to drought. Among the micronutrients, the levels of iron, copper, zinc and boron were similar to those commonly found in coastal soils, where about 80% of the plots belonged to the medium to very high classes for iron and to the very low class for copper, zinc and boron [38,39]. Manganese was the most contrasting micronutrient, showing higher levels (except in DME01, with very low levels) than in coastal areas (90% of the plots in the very low to medium classes) [38,39]. As a consequence, the Fe/Mn ratio showed an even higher contrast than Mn, with DEV01, DTC01 and DTC02 (Fe/Mn ≌ 1) having lower values and DME01 (Fe/Mn > 100) much higher values than observed near the coast. This suggested an imbalance between iron and manganese, which might play a role in all four inland plots, though in opposite directions: too low Fe/Mn levels in DEV01, DTC01 and DTC02 and very high levels in DME01. These results should be tested with foliar analysis.
The thermal regimes and rainfall levels recorded for the studied areas showed clear similarities. The Mediterranean climate characteristics of the three locations were evident, with the existence of a particularly hot summer period (Csa-type climates). Even so, the proximity of the sea as a climatic factor at a regional scale made it possible to distinguish DME01 (inland) from the other three (further westward), either by the greater thermal amplitudes or by the lower levels of precipitation. The results also showed the same trend in annual terms and on a quarterly scale. The mean annual precipitation and the mean annual temperature were within the range of the ecological requirements for Pinus pinea ([4] and references therein). Yet, the driest month’s precipitation was close to its lower threshold, that is, 15 mm [3]. This relation between temperature and precipitation may indicate that, at least in part of the year, the trees might be under water stress, as referred to by other studies (e.g., [11,13]). Combining temperature data with precipitation for the period studied and using the methodology followed by Thornthwaite–Mather (water balance), long dry periods occurred (often lasting more than six months), even assuming available water capacities below 100 mm, as the data of the soils of the plots showed (Table 3). In Mértola, where the dryness was more effective (higher temperature and less rainfall than in the other plots), the reduction of tree growth was probably due to water stress periods considering the lower soil, as a result of the lower water availability in the soil and higher evapotranspiration. These results were consistent with those of other studies (e.g., [13,16]).
In spite of some potential nutrient imbalances, especially between potassium and magnesium, that need further studies, the availability of nutrients was within the range of that reported for the coastal area plots [38,39], where umbrella pine growth was higher than that observed in the plots of this study [8,9]. Thus, soil characteristics were not likely the main constraining factor of potential growth [17]. Inversely, air temperature and precipitation might have resulted in possible constraints to growth. In this study, the highest growth was attained in the plot with the greatest precipitation and milder air temperatures (DEV01), whereas the smallest occurred in the plot with the lowest precipitation and highest temperature (DME01). The possible causes for constraints in growth might have been water stress [11,13], unsuitable conditions for photosynthesis due to high air temperatures [20] and increased competition for water between trees [22].

5. Conclusions

Overall, the results showed a trend towards precipitation and air temperature being the main constraining factors to umbrella pine tree and stand growth, denoted by the highest growth in DEV01 with the highest precipitation and mildest air temperature and the lowest in DME01 with the lowest precipitation and highest air temperature. Soil characteristics were, in general, within the range of values or higher than those reported for the coastal areas where higher growth was attained. Yet, potential imbalances between potassium and magnesium and between iron and manganese might occur. Even though DME01 soil had the highest available water capacity, the annual precipitation did not seem to be enough to mitigate water stress and, thus, originated the lowest tree growth.
The trends observed in this study need further research. The future research should include larger spatial and temporal dendrometric and soil data sets, meteorological data closer to the study plots, foliar analysis (to evaluate the unbalances of macronutrients and micronutrients and its effect on growth); and water balance (to assess water stress).

Author Contributions

Conceptualization, A.C.G., C.A., J.A. and R.P.; methodology, A.C.G., C.A., J.A. and R.P.; formal analysis, A.C.G., C.A., J.A. and R.P.; investigation, A.C.G., C.A., J.A. and R.P.; resources, A.C.G., C.A., J.A. and R.P.; writing—original draft preparation, A.C.G., C.A., J.A. and R.P.; writing—review and editing, A.C.G., C.A., J.A. and R.P. All authors have read and agreed to the published version of the manuscript.

Funding

This work is funded by National Funds through FCT—Foundation for Science and Technology under Project UIDB/05183/2020.

Data Availability Statement

Data used in this study are available from the corresponding author upon reasonable request.

Acknowledgments

The authors are grateful to IPMA—Instituto Português do Mar e da Atmosfera, in particular to Jorge Neto, who kindly provided meteorological data for three meteorological stations (Évora, Estremoz and Mértola). The authors would also like to thank the forest producers, Correia, Silveira, Silveira and Palma, for permission to settle and sample the plots. This study was financed by GO-FERTIPINEA (PDR2020-101-031330).

Conflicts of Interest

The authors declare no conflict of interest.

Appendix A

Figure A1. Diameter and height distributions per plot.
Forests 14 02160 g0a1
Figure A2. Boxplots of diameter at breast height (dbh), total height (h), mean crown radii (rm) and crown length (lc).
Forests 14 02160 g0a2
Figure A3. Boxplots of hd ratio (hd), crown ratio (cr), crown spread ratio (csr), linear crown index (lci) and crown thickness index (cfi).
Forests 14 02160 g0a3

References

  1. Agrimi, M.; Ciancio, O. Le Pin Pignon (Pinus pinea L.); FAO: Rome, Italy, 1993. [Google Scholar]
  2. Caudullo, G.; Welk, E.; San-Miguel-Ayanz, J. Chorological maps for the main European woody species. Data Brief 2019, 12, 662–666. [Google Scholar]
  3. Mutke, S.; Calama, R.; Gonza, S.C.; Montero, G.; Gordo, F.J.; Bono, D.; Gil, L. Mediterranean Stone Pine: Botany and Horticulture; Janick, J., Ed.; Wiley-Blackwell: Hoboken, NJ, USA, 2012; pp. 153–201. [Google Scholar]
  4. Ferreira, A.G.; Gonçalves, A.C.; Pinheiro, A.C.A.; Gomes, C.P.; Ilhéu, M.; Neves, N.; Ribeiro, N.A.; Santos, P. Plano Específico de Ordenamento Florestal para o Alentejo; Universidade de Évora: Évora, Portugal, 2001. [Google Scholar]
  5. Cutini, A.; Chianucci, F.; Manetti Maria, C. Allometric relationships for volume and biomass for stone pine (Pinus pinea L.) in Italian coastal stands. iForest Biogeosci. For. 2013, 6, 331–335. [Google Scholar] [CrossRef]
  6. Akyol, A.; Örücü, Ö.K.; Arslan, E.S. Habitat suitability mapping of stone pine (Pinus pinea L.) under the effects of climate change. Biologia 2020, 75, 2175–2187. [Google Scholar]
  7. IFN6. 6.° Inventário Florestal Nacional; IFN: Lisbon, Portugal, 2019; p. 26. [Google Scholar]
  8. Natalini, F.; Correia, A.C.; Vázquez-Piqué, J.; Alejano, R. Tree rings reflect growth adjustments and enhanced synchrony among sites in Iberian stone pine (Pinus pinea L.) under climate change. Ann. For. Sci. 2015, 72, 1023–1033. [Google Scholar]
  9. Saraiva, I. Opinhão; Litexa Editora Lda.: Lisboa, Portugal, 1997. [Google Scholar]
  10. IPMA. Instituto Português do Mar e da Atmosfera. 2021. Available online: https://www.ipma.pt/pt/index.html (accessed on 15 July 2021).
  11. Castagneri, D.; Battipaglia, G.; von Arx, G.; Pacheco, A.; Carrer, M. Tree-ring anatomy and carbon isotope ratio show both direct and legacy effects of climate on bimodal xylem formation in Pinus pinea. Tree Physiol. 2018, 38, 1098–1109. [Google Scholar] [PubMed]
  12. Mechergui, K.; Saleh Altamimi, A.; Jaouadi, W.; Naghmouchi, S. Climate change impacts on spatial distribution, tree-ring growth, and water use of stone pine (Pinus pinea L.) forests in the Mediterranean region and silvicultural practices to limit those impacts. iForest 2021, 14, 104–112. [Google Scholar] [CrossRef]
  13. Piraino, S. Assessing Pinus pinea L. resilience to three consecutive droughts in central-western Italian Peninsula. iForest 2020, 13, 246–250. [Google Scholar] [CrossRef]
  14. Vergarechea, M.; Calama, R.; Pretzsch, H.; Alday, J.G.; del Río, M. Short- and long-term growth response to climate in mixed and monospecific forests of Pinus pinea and Pinus pinaster. Eur. J. For. Res. 2021, 140, 387–402. [Google Scholar]
  15. Novak, K.; de Luis, M.; Čufar, K.; Raventós, J. Frequency and variability of missing tree rings along the stems of Pinus halepensis and Pinus pinea from a semiarid site in SE Spain. J. Arid Environ. 2011, 75, 494–498. [Google Scholar] [CrossRef]
  16. Campelo, F.; Nabais, C.; Freitas, H.; Gutiérrez, E. Climatic significance of tree-ring width and intra-annual density fluctuations in Pinus pinea from a dry Mediterranean area in Portugal. Ann. For. Sci. 2007, 64, 229–238. [Google Scholar]
  17. Ameray, A.; Bergeron, Y.; Valeria, O.; Montoro Girona, M.; Cavard, X. Forest Carbon Management: A Review of Silvicultural Practices and Management Strategies Across Boreal, Temperate and Tropical Forests. Curr. For. Rep. 2021, 7, 245–266. [Google Scholar]
  18. Albaugh, T.J.; Albaugh, J.M.; Fox, T.R.; Allen, H.L.; Rubilar, R.A.; Trichet, P.; Loustau, D.; Linder, S. Tamm Review: Light use efficiency and carbon storage in nutrient and water experiments on major forest plantation species. For. Ecol. Manag. 2016, 376, 333–342. [Google Scholar]
  19. Zhang, J.; Fiddler, G.O.; Young, D.H.; Shestak, C.; Carlson, R. Allometry of tree biomass and carbon partitioning in ponderosa pine plantations grown under diverse conditions. For. Ecol. Manag. 2021, 497, 119526. [Google Scholar]
  20. Shannon, V.L.; Vanguelova, E.I.; Morison, J.I.L.; Shaw, L.J.; Clark, J.M. The contribution of deadwood to soil carbon dynamics in contrasting temperate forest ecosystems. Eur. J. For. Res. 2022, 141, 241–252. [Google Scholar]
  21. Lebourgeois, F.; Gomez, N.; Pinto, P.; Mérian, P. Mixed stands reduce Abies alba tree-ring sensitivity to summer drought in the Vosges mountains, western Europe. For. Ecol. Manag. 2013, 303, 61–71. [Google Scholar]
  22. Lévesque, M.; Walthert, L.; Weber, P. Soil nutrients influence growth response of temperate tree species to drought. J. Ecol. 2016, 104, 377–387. [Google Scholar]
  23. Ren, J.; Fang, S.; Lin, G.; Lin, F.; Yuan, Z.; Ye, J.; Wang, X.; Hao, Z.; Fortunel, C. Tree growth response to soil nutrients and neighborhood crowding varies between mycorrhizal types in an old-growth temperate forest. Oecologia 2021, 197, 523–535. [Google Scholar]
  24. Avery, T.E.; Burkhart, H.E. Measurements; Macgraw-Hill, Inc.: New York, NY, USA, 1994. [Google Scholar]
  25. IUSS Working Group WRB. World Reference Base for Soil Resources 2014, Update 2015. International Soil Classification System for Naming Soils and Creating Legends for Soil Maps; IUSS Working Group WRB: Capri, Italy, 2015; p. 192. [Google Scholar]
  26. R Core Team. R: A Language and Environment for Statistical Computing; R Foundation for Statistical Computing: Vienna, Austria, 2022. [Google Scholar]
  27. SROA. Carta dos Solos de Portugal (Esc. 1:50.000), Vol. I: Classificação e Caracterização Morfológica dos Solos; Serviço de Reconhecimento e de Ordenamento Agrário, Secretaria de Estado da Agricultura: Lisboa, Portugal, 1970. [Google Scholar]
  28. Póvoas, I.; Barral, M.F. Métodos de Análises de Solos; Instituto de Investigação Científica Tropical: Lisboa, Portugal, 1992; p. 61. [Google Scholar]
  29. Climate Data. Climate Data. 2020. Available online: https://en.climate-data.org/europe/portugal/estremoz/estremoz-6954/ (accessed on 15 July 2021).
  30. LQARS. Manual de Fertilização das Culturas, 2nd ed.; LQARS: Lisboa, Portugal, 2006; p. 282. [Google Scholar]
  31. Smith, D.M.; Larson, B.C.; Kelty, M.J.; Ashton, P.M.S. The Practice of Silviculture. Applied Forest Ecology; John Wiley & Sons, Inc.: New York, NY, USA, 1997. [Google Scholar]
  32. Oliver, C.D.; Larson, B.C. Forest Stand Dynamics; John Wiley & Sons, Inc.: New York, NY, USA, 1996. [Google Scholar]
  33. Schütz, J.P. Sylviculture 1. Principes d’Éducation des Forêts; Presses Polytechniques et Universitaires Romandes: Lausanne, Switzerland, 1990. [Google Scholar]
  34. Vospernik, S.; Monserud, R.A.; Sterba, H. Do individual-tree growth models correctly represent height:diameter ratios of Norway spruce and Scots pine? For. Ecol. Manag. 2010, 260, 1735–1753. [Google Scholar] [CrossRef]
  35. Wonn, H.T.; O’Hara, K.L. Height:Diameter Ratios and Stability Relationships for Four Northern Rocky Mountain Tree Species. West. J. Appl. For. 2001, 16, 87–94. [Google Scholar]
  36. Pommerening, A. Basic Tree Variables, Forestry Summary Characteristics and Biodiversity Measures; Swedish University of Agricultural Sciences (SLU): Umea, Sweden, 2007. [Google Scholar]
  37. Boudru, M. Forêt et Sylviculture. Le Traitement des Forêts; Presses Agronomiques de Gembloux: Gembloux, Belgium, 1989. [Google Scholar]
  38. Marcelo, M.E.; Correia, A.; Silva, C.S. Soil fertility status of stone pine (Pinus pinea) stands in Portugal. In Incredible. Innovation Networks for Cork, Resin & Edibles, FACTSHEET 20407; European Union: Luxembourg, 2020. [Google Scholar]
  39. Marcelo, M.E.; Carrasquinho, I.; Jordão, P.; Mano, R.; Calouro, F.; Gaspar, M.; Gomes, J.P.A.; Martins, S.; Silva, C.S.; Amaral, M.R.; et al. Características físicas e químicas de solos ocupados com pinheiro-manso. Revista Rural 2020, 2020, 24–27. [Google Scholar]
  40. Smethurst, P.; Knowles, A.; Churchill, K.; Wilkinson, A.; Lyons, A. Soil and foliar chemistry associated with potassium deficiency in Pinus radiata. Can. J. For. Res. 2007, 37, 1093–1105. [Google Scholar] [CrossRef]
  41. Weil, R.R.; Brady, N.C. The Nature and Properties of Soils; Pearson Education: Boston, MA, USA, 2017. [Google Scholar]
Figure 1. Location of the plots.
Forests 14 02160 g001
Figure 2. Mean annual air temperatures (°C) in Évora, Estremoz and Mértola.
Forests 14 02160 g002
Figure 3. Mean annual precipitation (in mm) in Évora, Estremoz and Mértola.
Forests 14 02160 g003
Table 1. Location and characteristics of the plots.
VariablePlot
DEV01DTC01DTC02DME01
Central coordinates38°44′42″ N
7°41′21″ W
38°30′31″ N
7°53′55″ W
38°30′35″ N
7°53′57″ W
37°42′42″ N
7°49′0″ W
Mean elevation (m)384237238153
Slope gradientSloping (5%–10%)Nearly level (0.5%–1.0%)Nearly level (0.5%–1.0%)Nearly level (0.5%–1.0%)
CompositionMixed (with Quercus suber)PurePurePure
StructureEven agedEven agedEven agedEven aged
Mean age (years)≈30≈30≈30≈30
Plot area (m2)1600155015001912
Soil map units *Pgn(d,p) + Egn (7; 3)Pmg + Pg (6; 4)PmgPx(d) + Ex
RSG corresponding to soil map units (WRB) **Regosols/Cambisols + LeptosolsLuvisols + Regosols/CambisolsLuvisolsLuvisols + Leptosols
WRB soils **Leptic Regosol (Loamic)Eutric Luvisol (Loamic)Eutric Regosols (Loamic)Leptic Regosol (Loamic)
Parent materialGneisses or similar rocksQuartz diorites or graniteQuartz dioritesSchist or grauwackes
Climate (Cl. Köppen)CsaCsaCsa
Weather stations (location)EstremozÉvoraMértola
Weather stations (Coordinates)38°52′ N
7°31′ W
38°32′ N
7°53′ W
38°45′ N
7°33′ W
Weather stations (elevation)366 m246 m190 m
Mean annual temperature15.8 °C15.9 °C16.6 °C
Mean annual precipitation611 mm509 mm476 mm
* Codes of soil families used in the soil map “Carta dos Solos de Portugal” (SROA, 1970) with codes of soil phases ((d)—shallow phase; (p)—stony phase) and soils proportion (e.g., 7; 3) in complex soil units. ** Reference Soil Groups of the WRBSR [25] of soil map units and plot soils based on soil data collected (cf. Table 3).
Table 2. Absolute density measures (where N is the number of trees, G basal area, CC crown cover, dg mean quadratic diameter, id mean increment in diameter, ih mean increment in height, dbh diameter at breast height, h total height, rm mean crown radii, lc crown length, hd hd ratio, cr crown ratio, csr crown spread ratio, lci linear crown index, cfi crown thickness index and m the arithmetic mean).
PlotN
(treesha−1)
G
(m2ha−1)
CC
(%)
dg
(cm)
id
(cm)
ih
(m)
dbhmhmrmm
(m)
lcm
(m)
hdmcrmcfimlfimcsrm
DEV011508.824.927.30.90.327.18.62.55.831.868.00.918.30.58
DTC011297.924.327.90.90.327.78.02.65.528.869.11.018.90.66
DTC021338.024.127.60.90.327.28.22.55.930.272.00.918.70.62
DME01611.95.620.00.70.220.05.01.83.324.965.61.118.00.73
Table 3. Main physical and chemical soil properties measured in composite soil samples.
PlotDepth (cm)Fine Fraction (<2 mm)Text CodeSOCNC/NpH (1:2.5)Exchange Cations
CSFSSiltClay H2OKClCa2+Mg2+K+Na+NACCECNCS
(g kg−1)(g kg−1) (cmolc kg−1)(%)
DEV010–20408266166160SL7.250.89.15.854.492.750.890.440.054.138.8646.6
DEV0120–50521197132150SL3.070.65.15.383.701.680.890.370.042.988.2436.2
DTC010–2046029490156SL8.180.99.16.124.434.411.980.210.086.688.7776.2
DTC0120–50416236117231SCL3.940.57.96.423.975.222.290.510.118.1313.0662.3
DTC020–20375366117142SL7.080.88.85.974.444.281.980.180.086.5210.5561.8
DTC0220–50420295112173SL2.780.74.06.184.164.972.60.220.097.8811.4468.9
DME010–20390184269157L18.100.630.25.804.602.191.460.400.454.510.6142.4
DME0120–50412151233204L5.860.511.75.504.001.751.460.630.614.458.8850.1
CS is coarse sand (2–0.2 mm), FS is fine sand (0.2–0.02 mm), Silt (0.02–0.002 mm), Clay (<0.002 mm); Texture code: S—sandy, L—loam, C—clay; SOC—Soil organic carbon; N—total nitrogen; NAC—Non-acid cations, CEC—cation exchange capacity, NCS—Non-acid cations saturation (NAC/CEC).
Table 4. Soil extractable macronutrients and micronutrients measured in composite samples for each plot.
PlotDepth
(cm)
MacronutrientsMicronutrients
P2O5K2OMgFeMnCuZnB
(mg kg−1/class)(mg kg−1/class)
DEV010–207.16/1118/4230/557.0/481.00/40.80/30.70/20.51/3
DEV0120–504.96/1130/4140/555.8/444.40/30.80/30.90/20.58/3
DTC010–2013.18/1122/4200/5131.0/572.00/41.90/30.90/20.89/3
DTC0120–508.79/174/3460/556.0/455.40/41.20/31.70/31.93/4
DTC020–208.88/1100/4440/5106.0/585.00/41.40/30.80/20.34/2
DTC0220–507.02/160/3340/5104.8/575.00/41.10/30.50/10.19/1
DME010–209.50/1104/4245/5185.0/51.63/14.50/30.19/10.70/3
DME0120–501.80/154/3225/5218.0/51.62/14.20/30.11/10.62/3
Phosphorous, potassium, magnesium, iron, manganese, copper, zinc and boron classes accordingly with [30] /1—very low, /2—low, /3—medium, /4—high, /5—very high.
Table 5. Quarterly and average air temperatures (in °C) between 2014 and 2020 (and normal values) (where 1st, 2nd, 3rd and 4th quarters correspond to winter, spring, summer and autumn, respectively).
YearÉvoraEstremozMértola
Quarters
1st2nd3rd4th1st2nd3rd4th1st2nd3rd4th
201410.617.822.113.29.717.321.812.511.018.122.913.6
20159.719.622.814.08.719.122.413.49.719.823.514.4
201610.317.125.013.49.616.424.612.510.117.925.313.7
201710.520.023.714.59.619.423.313.510.320.224.214.5
20189.516.524.213.18.616.223.711.59.716.724.413.3
201910.717.723.013.89.716.922.812.510.618.223.513.9
202011.518.024.313.310.717.424.213.411.618.624.713.7
2014–202010.418.123.613.69.517.523.312.810.418.524.113.9
Normal10.716.622.613.59.818.023.712.810.917.623.814.0
Table 6. Quarterly rainfall (in mm) between 2014 and 2020 (and averages) and corresponding normal values (1970–2000) in three locations (where 1st, 2nd, 3rd and 4th quarters correspond to spring, summer, autumn and winter, respectively).
YearÉvoraEstremozMértola
Quarters
1st2nd3rd4th1st2nd3rd4th1st2nd3rd4th
20142431441302223545010623214512260177
2015986211158797922144459020149
2016174124917623619211233831278161
2017167531711116228012113715465
20183361756178344133162142061381170
2019859321257971101624250606109
202011717448292131149181721241387152
2014–202017411835199200101271941139815140
Normal188128462491541063621314410126205
Disclaimer/Publisher’s Note: The statements, opinions and data contained in all publications are solely those of the individual author(s) and contributor(s) and not of MDPI and/or the editor(s). MDPI and/or the editor(s) disclaim responsibility for any injury to people or property resulting from any ideas, methods, instructions or products referred to in the content.

