Review

Fertility Variation and Gene Diversity in Forest Populations

by
Kyu-Suk Kang
1,*,
Nebi Bilir
2,
Koeun Jeon
1 and
Ye-Ji Kim
1
1
Department of Agriculture, Forestry and Bioresources, Seoul National University, Seoul 08826, Republic of Korea
2
Faculty of Forestry, Isparta University of Applied Sciences, Isparta 32260, Turkey
*
Author to whom correspondence should be addressed.
Forests 2023, 14(11), 2172; https://doi.org/10.3390/f14112172
Submission received: 29 August 2023 / Revised: 14 October 2023 / Accepted: 30 October 2023 / Published: 31 October 2023

Abstract

:
Fertility variation, defined as a difference in the ability to create progeny (i.e., reproductive success) among individuals, was reviewed using the related available theoretical and practical literature in an attempt to contribute to and improve future studies on the subject. Fertility variation is a useful guide for various purposes such as gene conservation, seed production programs, forest genetic resource (i.e., seed sources) management, other forestry practices (e.g., regeneration), and evolutional and physiological studies. Many papers and proceedings have been published, including both theoretical and practical approaches, on how fertility variation has improved in the last two decades. Large variations in fertility were widely reported among populations within species and among species. We reviewed the literature and combined our diverse knowledge to examine fertility variations and their linkage parameters. Fertility variations and their related parameters (e.g., gene diversity, status number, effective parent number, parental–balance curves) estimated based on reproductive characteristics have been studied for many years using easy and cheap surveys that are used for different purposes in forest sciences. Their importance is increasing and their use is becoming more widespread because of these advantages, leading to improvements in research papers. While many research papers have recently been published on fertility variations and linkage parameters, a review paper has not been published to date. Therefore, a review paper is needed based on a literature survey and unpublished experience, as a guide for future studies.

1. Introduction

Foresters and agriculturalists expect abundant reproductive output for the highest yield and low cost [1,2,3]. Plant growth is promoted for different treatments, such as pruning, hormone application, and soil fertilization. However, geneticists focus on the equal or acceptable contribution of individual plants to gene pool, which can produce a genetically high-quality seed crop [4,5,6]. High variations in the contribution also could help to achieve a balance using theoretical and practical tools [7,8,9], while large fertility variations were reported in different populations and years in 99 stands and 36 seed orchards of different forest tree species [10,11,12], and in Pinus brutia [13] and Cedrus libani [14].
Fertility, also referred to as fecundity, is the ability to produce progeny in the next generation through reproductive traits. Estimating fertility variations serves a multitude of purposes, such as the estimation of gene diversity in seed orchards, forest genetic resource management, gene conservation, regeneration practices, and evolutional studies. In the realm of plant genetics and breeding, the estimation of fertility variations stands as a significant tool [10,11,12,13,14,15,16,17,18,19]. Moreover, it has wide application in the selection, establishment, and management of seed sources [18]. One aspect of these applications involves considering gene diversity in order to monitor and increase genetic variation in seed crops [11,17].
Estimating fertility in plants is commonly accomplished through the assessment of pollen, flowers, cones, fruits, and seed production [20,21,22,23,24,25,26,27]. This method is widely embraced in the field of plant science due to its speed, simplicity, and cost-effectiveness, meaning that it can serve various research purposes. Additionally, the utilization of marker-assisted selection (MAS), including DNA markers such as RFLP, RAPD, AFLP, SSR, SNP, and others, has significantly enhanced the efficiency of plant breeding. This advancement has led to improvements in both the speed and the accuracy of breeding, with the mapping of numerous quantitative trait loci (QTLs) making MAS particularly valuable for identifying genes associated with fertility variations [28].
Among the various available methods, the assessment of cone production emerges as the favored option. This preference stems from the simplicity and accuracy of data collection, particularly when contrasted with the task of tallying strobili. Trees consistently produce cones year-round, rendering cone evaluation a more accessible and dependable approach [17]. Nonetheless, the species’ inflorescence biology, whether monoecious or dioecious, can influence the selection of reproductive characteristics. Additionally, the flowering phenology of the species at the specific location should also be considered when making this choice.
Theoretical studies have demonstrated the significance of female–male gametic fertility variations [29,30], and zygotic fertility variations in estimating gene diversity within plant populations. Although numerous research papers have explored fertility variations and linkage parameters in both theoretical and applied contexts, including seed orchards, seed stands, plantations, and natural populations, there has not been a comprehensive review paper published on this subject to date [31,32,33,34,35,36,37,38,39,40,41,42,43,44,45,46,47,48,49]. Furthermore, there have been no dedicated reviews focusing solely on fertility variation. Recent research papers also indicate a growing prominence of fertility variation being used as a significant keyword [50,51,52]. These studies underscore the need for a comprehensive review paper dedicated to exploring the topic of fertility variation in various aspects of plant genetics, including seed orchards.
This review paper serves as a comprehensive guide for future research, offering insights deriving from an extensive literature survey and various other sources of knowledge. It aims to contribute to the widely used estimations of fertility variation and linkage parameters. We introduce several key concepts, such as coancestry, group coancestry, gene diversity, status number, and effective parent number. We define the coancestry between a pair of individuals as the probability that genes taken at random from each of the concerned individuals are identical by descent. The group coancestry is the average of all coancestries among population members in a coancestry matrix, including self-coancestry. It is also the probability that two genes taken at random (with replacement) from a population are identical by descent [43,44]. Diversity in genes indicates that the genes are different, and this can be considered synonymous with expected heterozygosity in this review.
The status number was defined as the half of the inverse of group coancestry by Lindgren and Mullin [5], which has the same meaning as half of the inverse of the probability that two genes drawn at random from a population are identical in their descent. The status number is an intuitively appealing way of presenting group coancestry, as it connects to the familiar concept of numbers (i.e., effective population size), describing the census number of unrelated individuals corresponding to the gene diversity of the resulting seed crops. The ratio of the status number and the census number will be useful to determine the relative status number.
Additionally, the authors provide theoretical frameworks based on their research. With this in mind, our review paper addresses the crucial role of fertility variations and their linkage parameters in the field of plant science. By understanding and effectively managing fertility variations, researchers can significantly contribute to gene conservation efforts, improve seed production programs, and gain deeper insights into the evolutionary and physiological aspects of plant populations. The integration of molecular studies, specialized software, and new applications in seed source establishment for climate resilience holds great promise for advancing this field of research.

2. Materials and Methods

The published papers were surveyed using the keywords “fertility variation” and other linkage parameters such as “status number”, “gene diversity” and “sibling coefficient” from the Web of Science and Google Scholar databases. English papers were selected from the databases. They were combined according to the unpublished experience and knowledge of the authors.

3. Results

3.1. Fertility Variations Estimation

3.1.1. Variations in Female and Male Fertility

Female and male fertilities of the ith individual (denoted as ψf and ψm) were defined as the ability to produce female and male strobili, respectively. This fertility difference was estimated by calculating the relative proportion of female and male strobilus production in relation to the entire population, following the method proposed by Muller-Starck and Ziehe [53]. To assess the variations in female and male fertility, also known as female and male gametic fertility variations, the coefficient of variation (CV) for female and male strobilus production was employed, as suggested by Kang and Lindgren [32]. The estimation of ψf and ψm was carried out using the following equations:
ψ f = N i = 1 N f i 2 = C V f 2 + 1   and   ψ m = N i = 1 N m i 2 = C V m 2 + 1
In these equations, N represents the census number, fi and mi correspond to the fertilities of female and male ith individuals, and CVf and CVm denote the coefficients of variation in female and male strobilus production, respectively, among individuals in the studied population.
Moreover, the fertility variations among individuals were estimated based on the proportion of cone production (e.g., fruit, conelet, acorn, and berry) within the population. The variations in cone fertility ( Ψ C ), with the total contribution representing zygotic parents, was estimated by Kang and Lindgren [29] and by Bilir [30], as expressed by the following equation:
Ψ C = N i = 1 N C o n i 2 = C V C 2 + 1
Here, Coni represents the cone fertility of the ith individual; C V C 2 stands for the coefficient of variation in total fertility. In this paper, the fertility of the ith individual was estimated by the proportion of cone production in the population.
However, many biotic and abiotic factors can affect this proportion. For instance, a positive and significant correlation was reported between female and male strobili productions in Pinus taeda [54], opposite to that reported for P. eliotti [55], P. sylvestris [56] and P. contorta [57]. In addition, positive and significant correlations were found between the numbers of cones and filled seeds in Picea sitchensis [3], P. abies [56] and Pseudotsuga menziesii [2,25]. Bhumibhamon [57] reported a positive and significant relation between strobili production and crown volume in Pinus sylvestris [58], similar to Picea abies [59,60] while this correlation was negative in Pinus taeda [54] and P. sylvestris [61]. Low correlations were reported between tree height and strobili production in Pinus contorta [57] and Picea abies [62]. Tree age was an important factor in seed production in Pinus sylvestris [39,63]. The results also indicated the importance of genetical and traditional (i.e., pruning) practices in the proportion [64,65,66].

3.1.2. Total Fertility Variation (Sibling Coefficient)

Sibling coefficient is defined as the probability that sibs occur compared to the situation in which parents have equal fertility. It is a standardized measure that is independent of the census number of parents, and only dependent on how variable their fertility variation is [11]. The combined variations in the fertility of both females and males lead to the total fertility variation, designated by the symbol of Ψ and referred to as the sibling coefficient. The total fertility variation (Ψ) can be calculated using the equation by Kang and Lindgren [29]:
Ψ = N i = 1 N 0.5 f i f i + 0.5 m i m i 2 = 0.25 N i = 1 N f i 2 f i + N i = 1 N m i 2 m i + N i = 1 N 2 f i m i f i m i
The total fertility variation (Ψ) can be also calculated using Kang’s equation [11]:
Ψ = N i = 1 N p i 2 = N i = 1 N f i + m i 2 2 = 0.25 N i = 1 N f i 2 + m i 2 + 2 f i m i
In Equations (3) and (4), N is the census number, fi and mi are the fertilities as female and male parents of the ith individual, respectively. pi is the total fertility as the whole parent of the ith individual, which is the average of female and male gametophytes’ contribution to the offspring.
Equations (3) and (4) were simplified as follows [13]:
Ψ = C V f 2 + C V m 2 4 + 0.5 N n = 1 N f i m i f i m i + 1
If there is no correlation between female and male fertility, total fertility variation (Ψ) is calculated based on the coefficient of variations in female (CVf) and male (CVm) fertility by Kang and Lindgren [32], and based on the female fertility ( ψ f ) and male fertility ( ψ m ) variations recorded by Kang and Lindgren [29] and Bilir [30] as:
Ψ = 0.25 C V f 2 + C V m 2 + 1   and   Ψ = 0.25 ψ f + ψ m + 0.5
When equal seed harvesting is imposed in a seed stand population, Formula (6) is then described as Ψ = 0.25ψm + 0.5, where only male fertility variation remains. This can then be expressed as stated by Kamalakannan et al. [40]:
Ψ = ψ m + 2 4
Equations (3) and (5), delivered by Kang and Lindgren [32] and Bilir et al. [13], were improved under the correlation (r) between female and male fertility. The new equation was implemented for the estimation of total fertility variation (Ψ) [67] as follows:
Ψ = 0.25 ψ f + ψ m + 0.5 [ 1 + r ψ f 1 ψ m 1   ]
where r is the correlation coefficient between female and male strobilus production in the population.
Formula (9) is also improved as a theoretical framework for the estimation of total fertility variation (Ψ), as presented by Bilir and Kang [17]:
Ψ = 0.25 ψ f + ψ m + 2 N i = 1 N f i m i f i m i
where N is the census number, ψf is the female fertility, ψm is the male fertility and fi and mi are the number of female and male strobili of the ith individual, respectively.
Fertility differences among population members can be described by the coefficient of variation (CV) in fertility and the size of the sample (n), as stated by Kang [11]:
Ψ = C V 2 ( n 1 ) n + 1
When making predictions for objects that are neither juvenile nor characterized by poor flowering, a rough generalized heuristic rule is suggested: Ψ equals 2 (CV in fertility = 100%) for seed orchards and Ψ = 3 (CV = 140%) for natural stands [10,12]. According to Equation (10), the Ψ value will be larger than 1. If all individuals contribute equally, then the Ψ equals 1, and the Ψ = 2 when the probability that two individuals share a parent is twice as high compared to when parental fertility is equal across the population [18]. A Ψ lower than 2 is an acceptable level in most of the empirical studies. However, it is expected to be 1 in an idealized situation (i.e., under the Hardy–Weinberg equilibrium) where mating is random and individuals are equally fertile in a population without any disruptive circumstances (i.e., under conditions that rule out mutation, migration, genetic drift, and natural selection).
In Equations (1), (2), (5), (6) and (10), fertilities are related to the coefficient of variation (CV). Forest owners and seed source managers expect equal parental gamete contribution from all parents to decrease the CV value (Figure 1). In orchard A, all parents contribute equally, so there are no fertility variations, and the census number for the orchard is the same as the status number of the orchard crop [11,18].
Unlike agricultural crop plants, forest trees have large differences in fertility. Additionally, the reproductive capacity of trees varies greatly depending on their age. In years of good seed production, the variations in fertility smaller among individuals, and the variations are larger in poor years [15,23,30].

3.2. Linkage of Parameters of Gene Diversity

3.2.1. Coancestry and Group Coancestry

Coancestry (f, θ) is defined as a quantification of the relatedness between two individuals, representing the probability that genes taken from those individuals are identical by descent (IBD). Synonyms for coancestry include coancestry coefficient, kinship, and consanguinity.
Group coancestry (Θ) is the probability that two individuals are IBD, and this term was introduced by Cockerham in 1967 [43]. The group coancestry (Θ) of orchard crops can also be calculated from the contributions of parents (pi) using the formula by Kang [11,64]:
Θ = 0.5 i = 1 N p i 2
If all parents are assumed to be unrelated and non-inbred, all self-coancestry equals 0.5. When they are related to each other (i.e., θij), the group coancestry can be calculated as follows:
Θ = 0.5 + N 1 i = 1 N i j N θ i j Ψ N
Group coancestry (ΘΨ) is estimated by considering parental fertility (pi) male and female fertility [64] as:
Θ Ψ = 0.5 i = 1 N f i + m i 2 2 = 0.5 i = 1 N p i 2
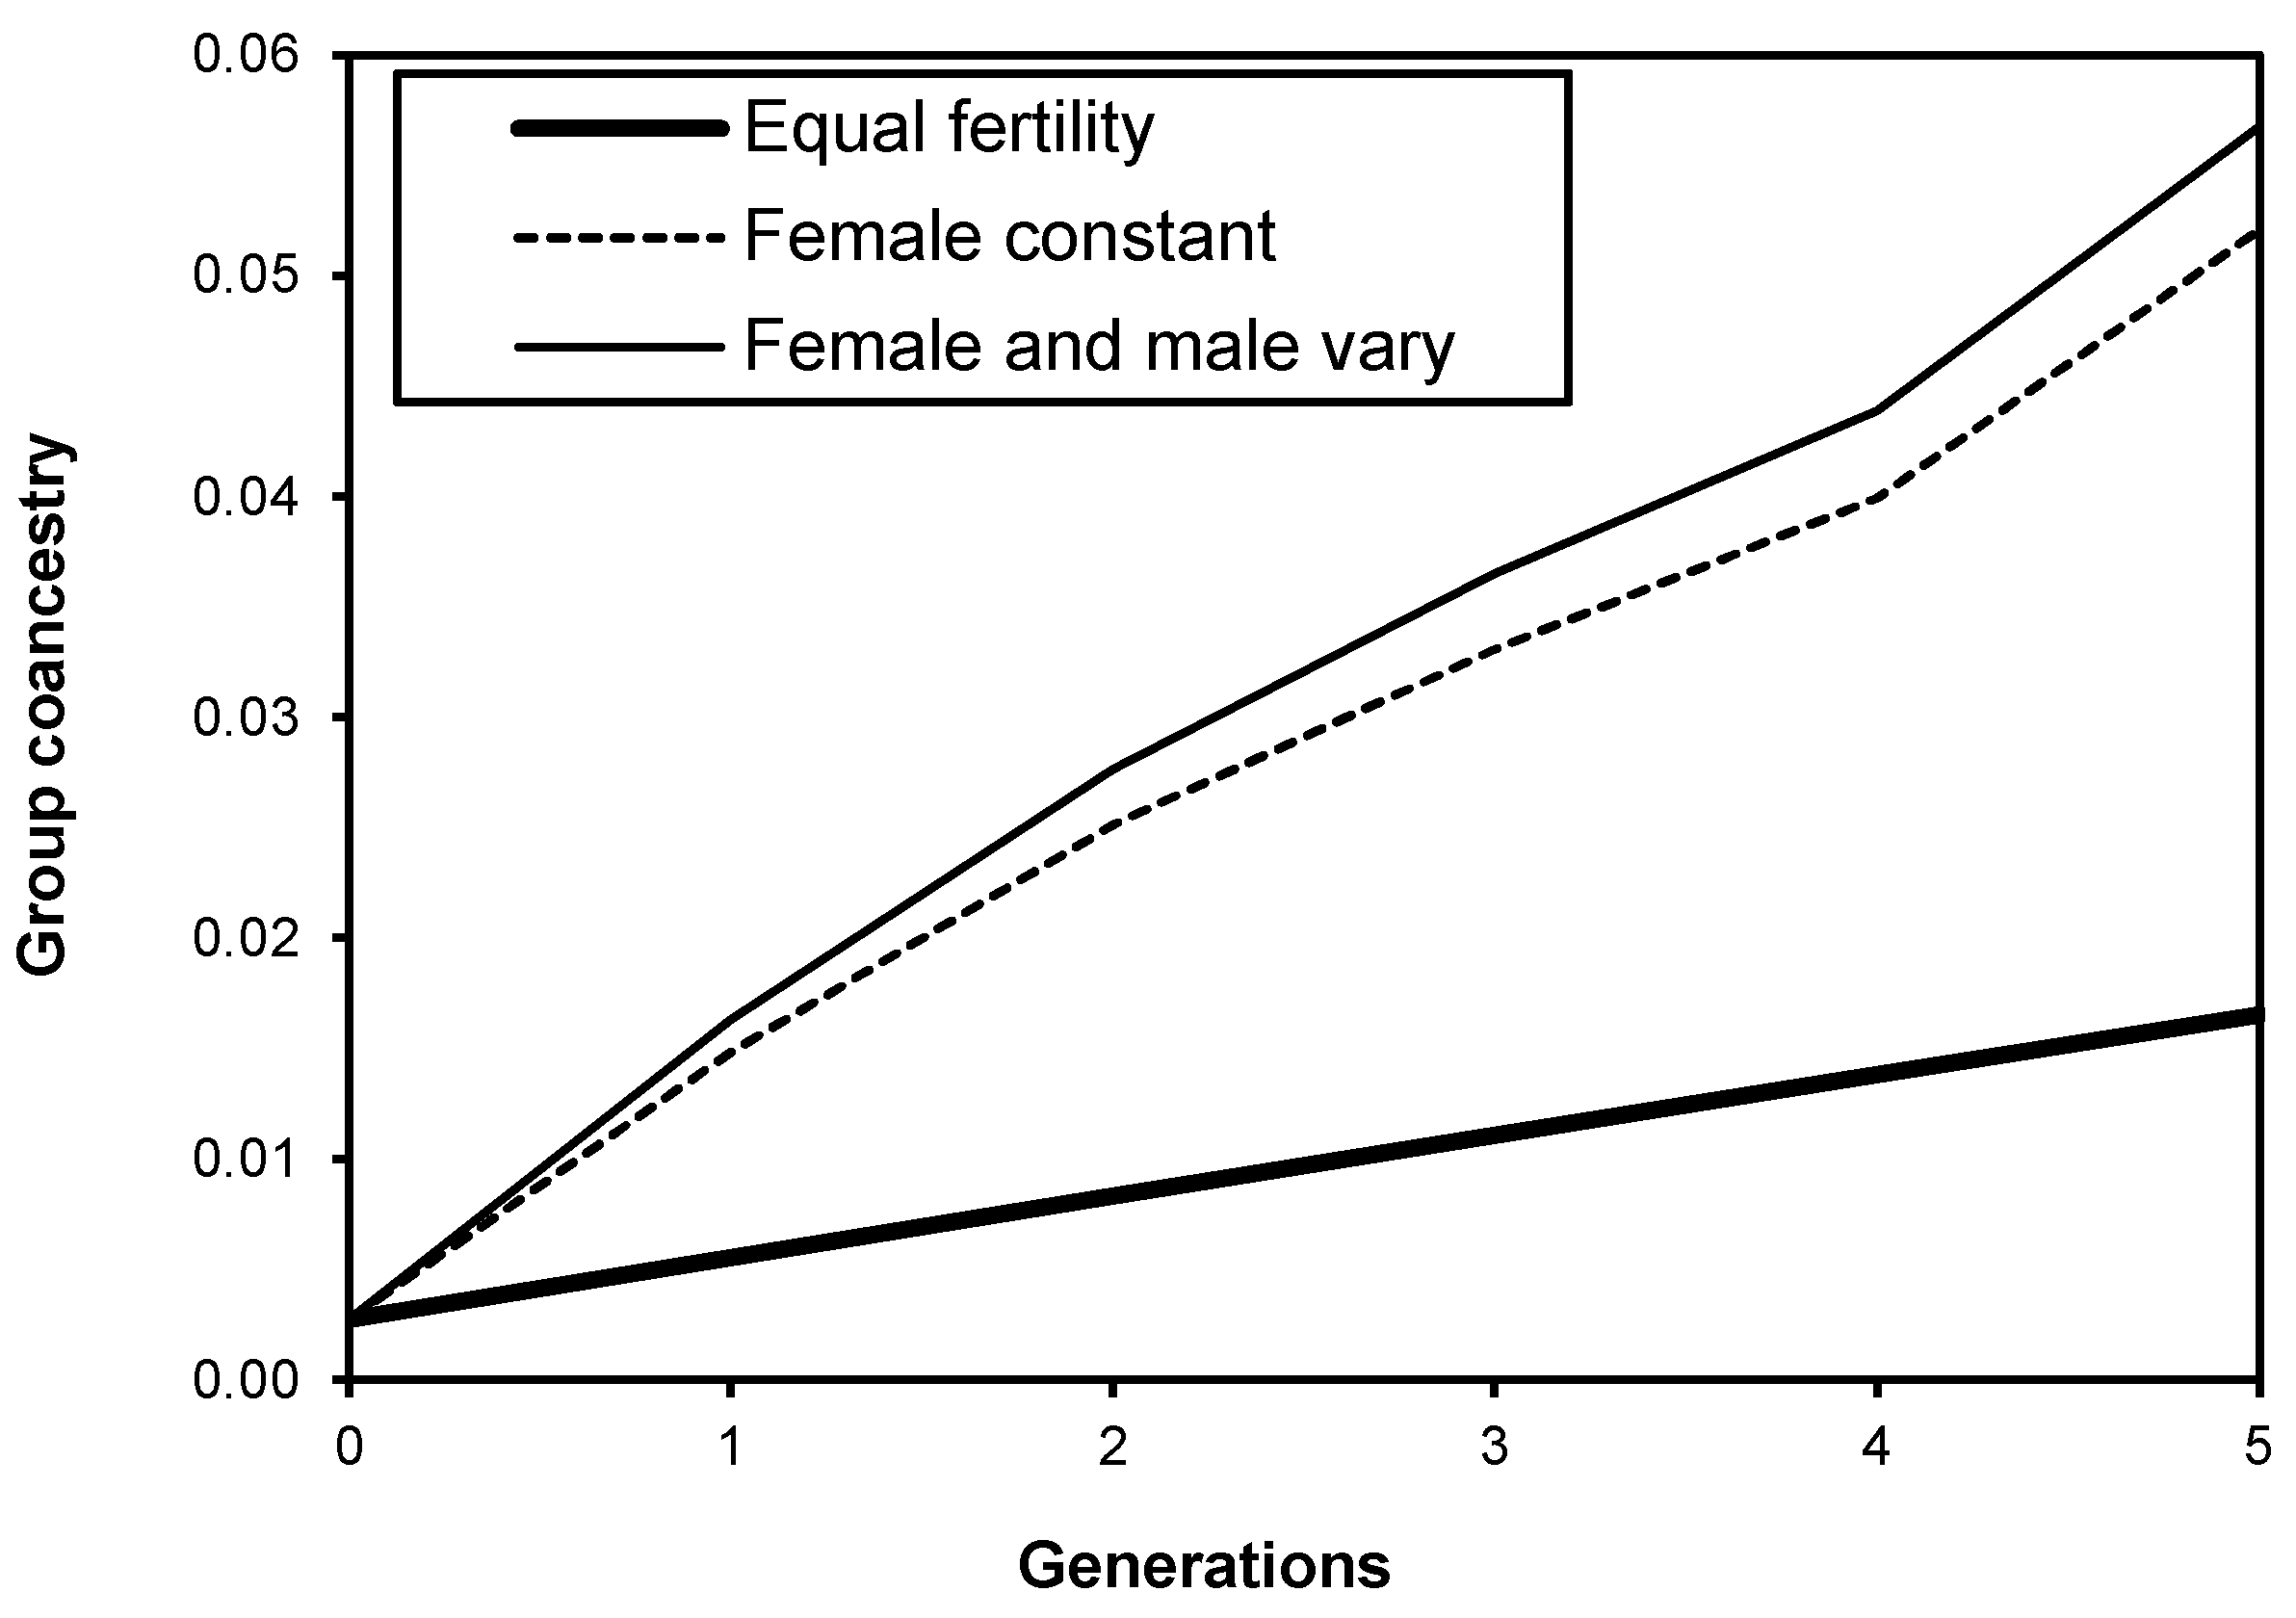
Here, N is the census number, fi is the female fertility, mi is the male fertility of the individual i, and pi is the probability that two genes in the offspring come from the same parent i. The accumulation of group coancestry is faster and higher when the fertility variation is large [10,11,33], as shown in Figure 2.

3.2.2. Gene Diversity and Status Number

Gene diversity (GD) is one of the most important criteria to assess the quality of seed crops and resistance of forest establishment to biotic and abiotic damages (i.e., global warming), ass discussed by Ivetić et al. [65]. Gene diversity could be an environmentally friendly solution to biotic (e.g., insect damage) and abiotic (e.g., climate change) problems based on artificial and natural selections. Gene diversity can be a reflector of the genetic quality of seed crop, as well as its commercial value and choosing by the forest owner.
Group coancestry represents the probability that two genes in a population are IBD. Diversity refers to differences, and gene diversity indicates differences in genes. Notably, 1-group coancestry (Θ) denotes the probability that the genes are non-identical and thus diverse (i.e., gene diversity).
G D = 1 Θ
The number of “ideal” trees shows the trees that have the same gene diversity as the considered population. The status number (Ns) is a way of expressing group coancestry as an effective number. An appealing property of the status number is that, for a population of unrelated, non-inbred individuals, it is equal to the census number. The status number connects to the familiar concept of population size.
The status number has similarities with “effective number” in the classical sense, as it predicts inbreeding using random mating. Status number (Ns) is equal to half the inverse of group coancestry. It is also related to gene diversity [5,10,32,64]:
N s = 1 / 2 Θ   and   G D = 1 0.5 / N s
When clones are unrelated and non-inbred, the status numbers of female (Ns(f)) and male parents (Ns(m)) are calculated as [10,11,18,42]:
N s ( f ) = 1 i = 1 N f i 2   and   N s ( m ) = 1 i = 1 N m i 2
where fi and mi correspond to the fertility of females and males of clone i, and N is the census number in the seed orchard. Fertility is estimated based on the strobilus assessment.
Status number (Ns) based on total fertility (i.e., clone fertility) is calculated as follows [11,16,35,39]:
N s = 4 N ψ f + ψ m + 2 + 2 r ( ψ f 1 ) ( ψ m 1 )
where ψf and ψm are the fertility variations in female and male parents, equivalent to CVf2 + 1 and CVm2 + 1, respectively. r is the correlation coefficient between female and male fertility.
The effective number of parents (Np) can be defined as the number of genotypes divided by the sibling coefficient (Ψ) [15]. This is further divided into the effective number of female parents [Np(f) = N/(CVf2 + 1)] and the effective number of male parents [Np(m) = N/(CVm2 + 1)]. Considering the correlations between female and male fertility, Np is calculated as follows [16,35]:
N p = N Ψ = 4 N C V f 2 + C V m 2 + 2 r C V f C V m + 4
Here, CVf and CVm are the coefficients of variation in female and male fertility, respectively, r is the correlation coefficient between female and male fertility, and N is the number of individuals. Fertility is estimated based on the flowering assessment [66].

3.2.3. Covariance between Female and Male Fertility

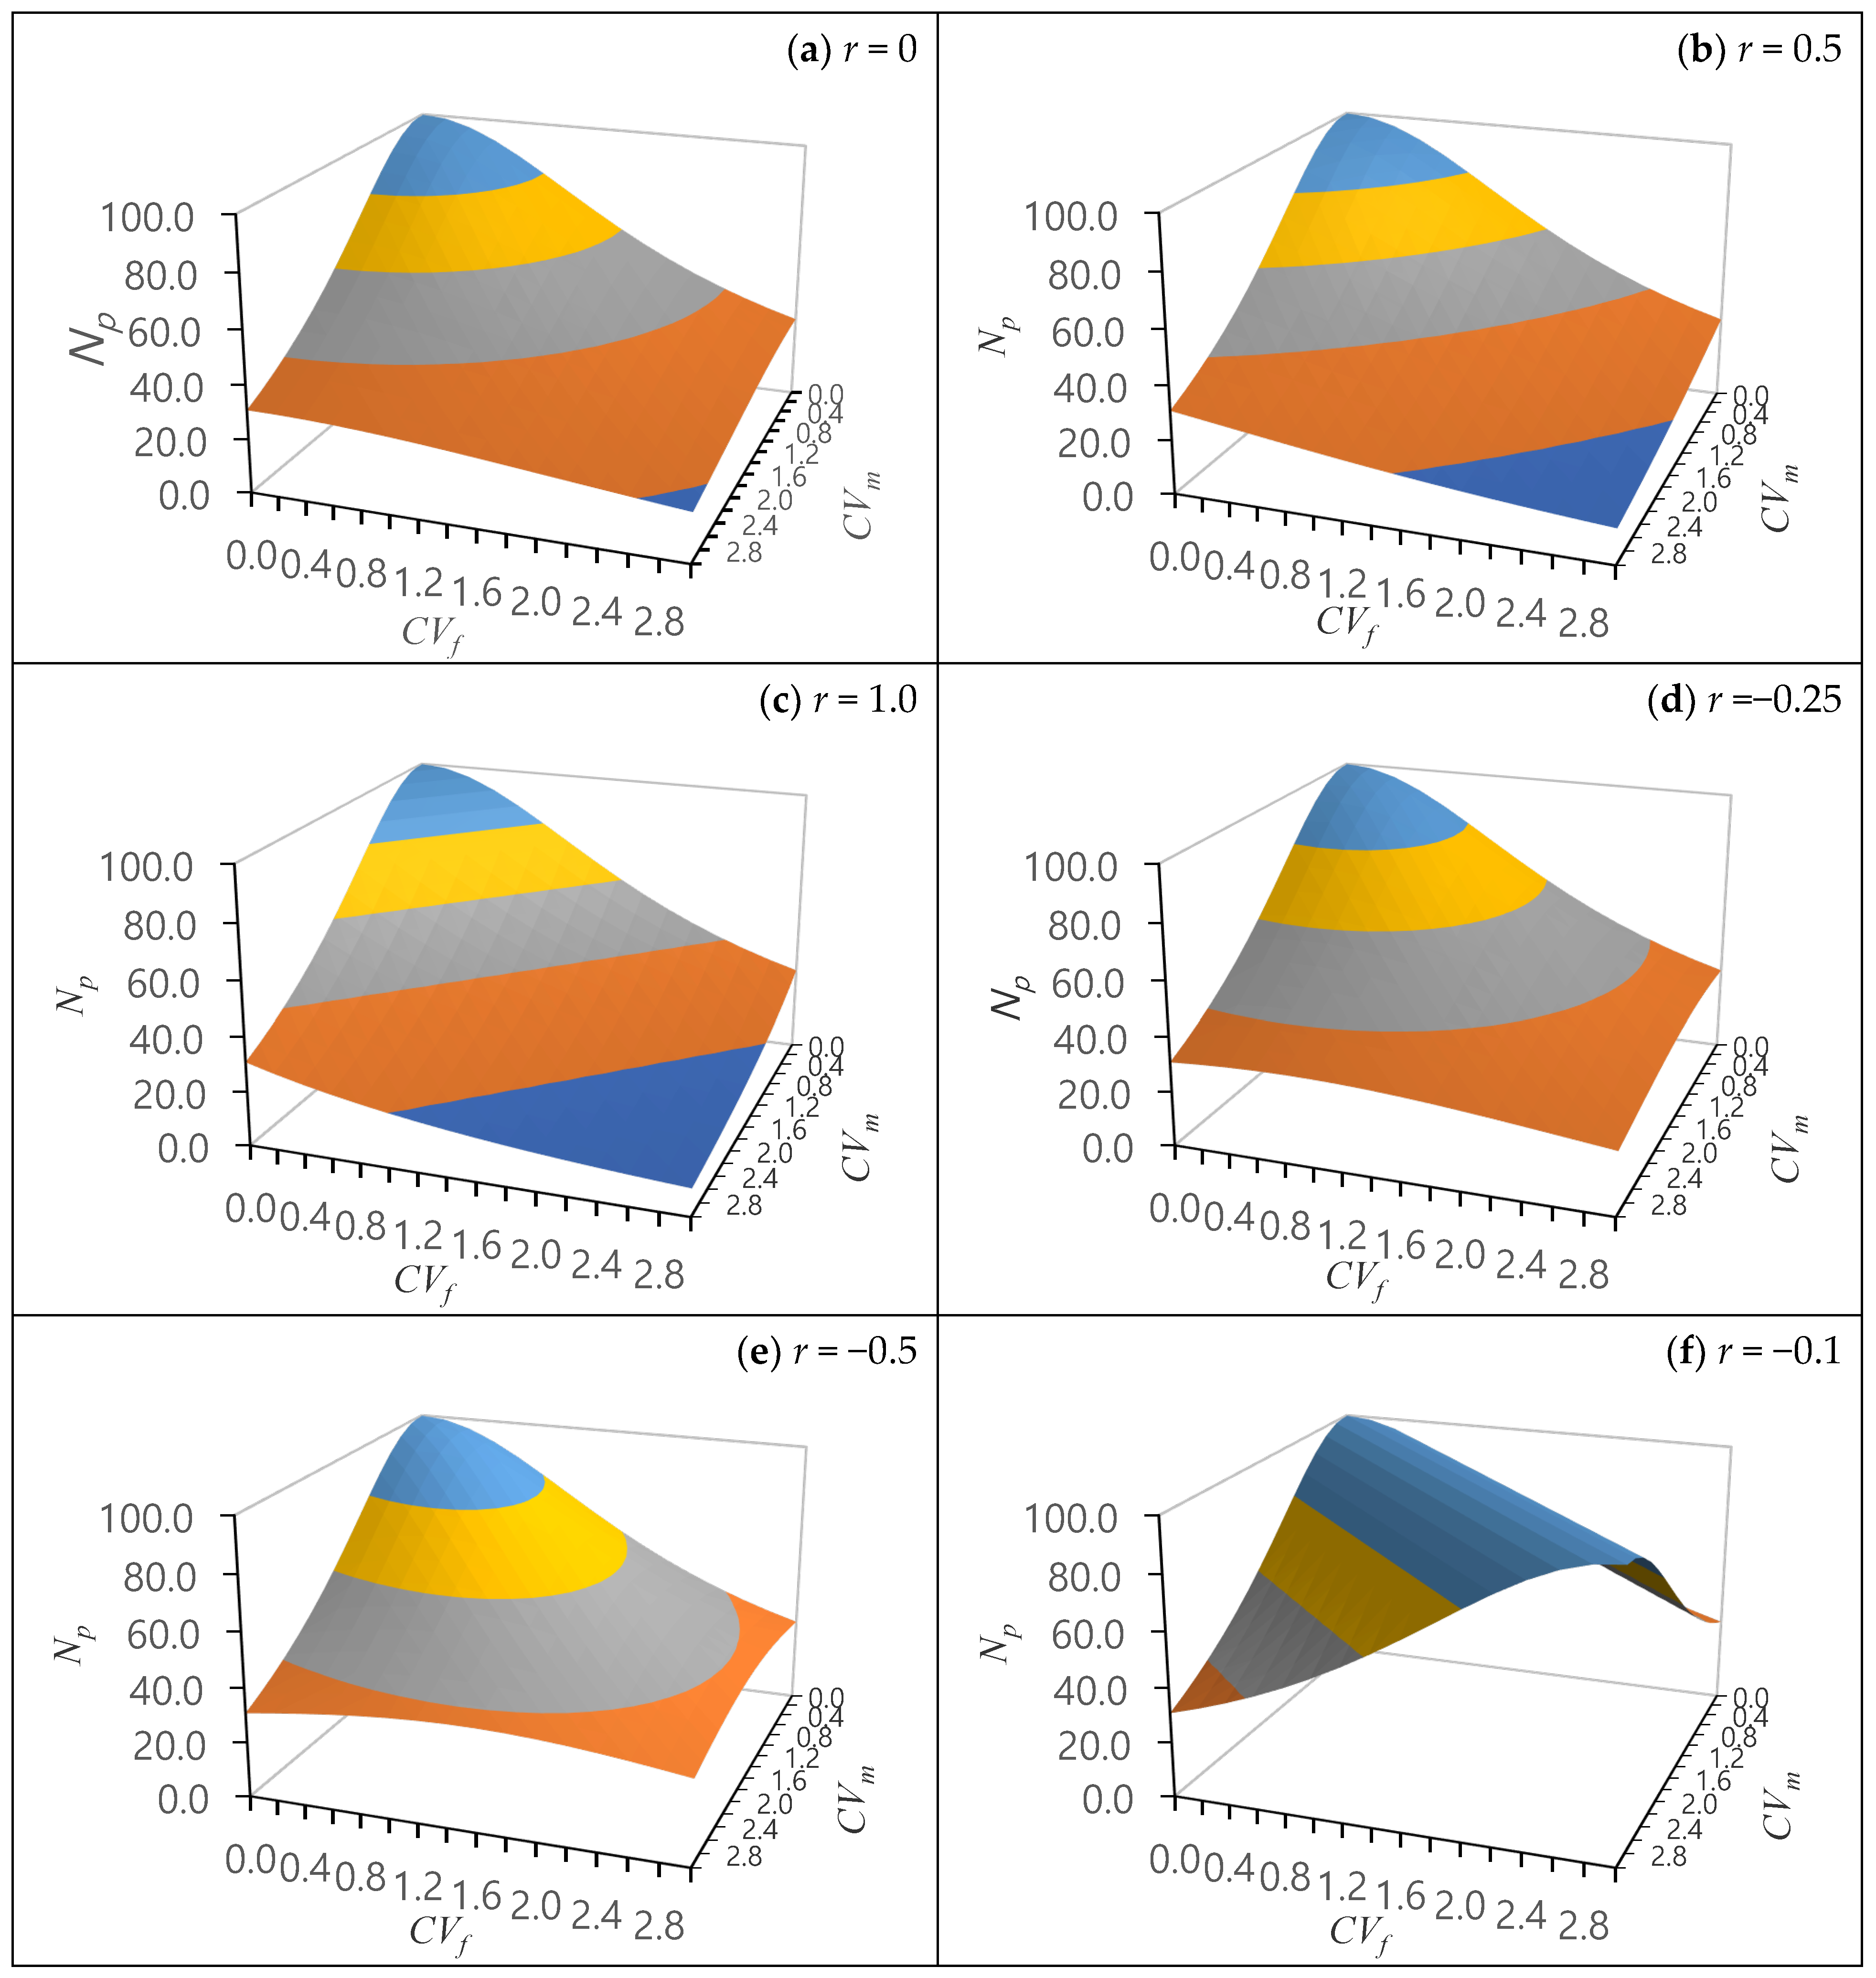
Under various scenarios of female and male fertility covariations (correlation), the effective number of parents is stochastically simulated across a range of correlation coefficients [67] (Figure 3). Generally, when there is no or limited covariation in female and male parental reproductive output fertility, the effective number of parents (Np) is equivalent to the census number (N), assuming the seed orchard parents are unrelated and non-inbred. Positive covariations in female and male parental reproductive output fertility increase the parental fertility variations (Ψ), as this is affected by variations in both females (ψf) and males (ψm), leading to a decline in the effective number of parents (Figure 3a–c). On the other hand, negative covariations in female and male parental reproductive output fertility mitigates the asymmetrical variations between ψf and ψm (fertility variation imbalances), increasing the effective number of parents (Figure 3d–f).

3.2.4. Sibling Coefficient and Relative Effective Number

The sibling coefficient (Ψ) can be interpreted as the likelihood of two random gametes being identical by descent in a set of gametes from the same group, considering fertility variations [2]. Thus, Ψ = 1 means that there that individuals made an equal contribution to the gamete gene pool in the population. When an equal number of seeds is collected from each tree, the female fertility is constant; thus, CVf = 0 (i.e., equal contribution among seed parents). Under equal seed harvesting conditions, the effective number of parents (Equation (18)) can be simplified [33,35,37] as:
N p = 4 N C V m 2 + 4
The relative effective number of parent or relative status number (Nr) is the proportion of the status number (Ns) or effective number of parents (Np) to the census number (N), as follows:
N r = N s / N   and   N r = N p / N
The relative effective number of parents for female (Nr(f)) and male fertility (Nr(m)) are also estimated based on female (ψf) and male fertility (ψm), as follows:
N r ( f ) = 1 / ψ f   and   N r ( m ) = 1 / ψ m
The relative effective number of parent (Nr) and relative status number (Nr) for the total gene pool is estimated based on total fertility variation (Ψ), as follows:
N r = 1 / Ψ

3.2.5. Parental Balance Curve and Maleness Index

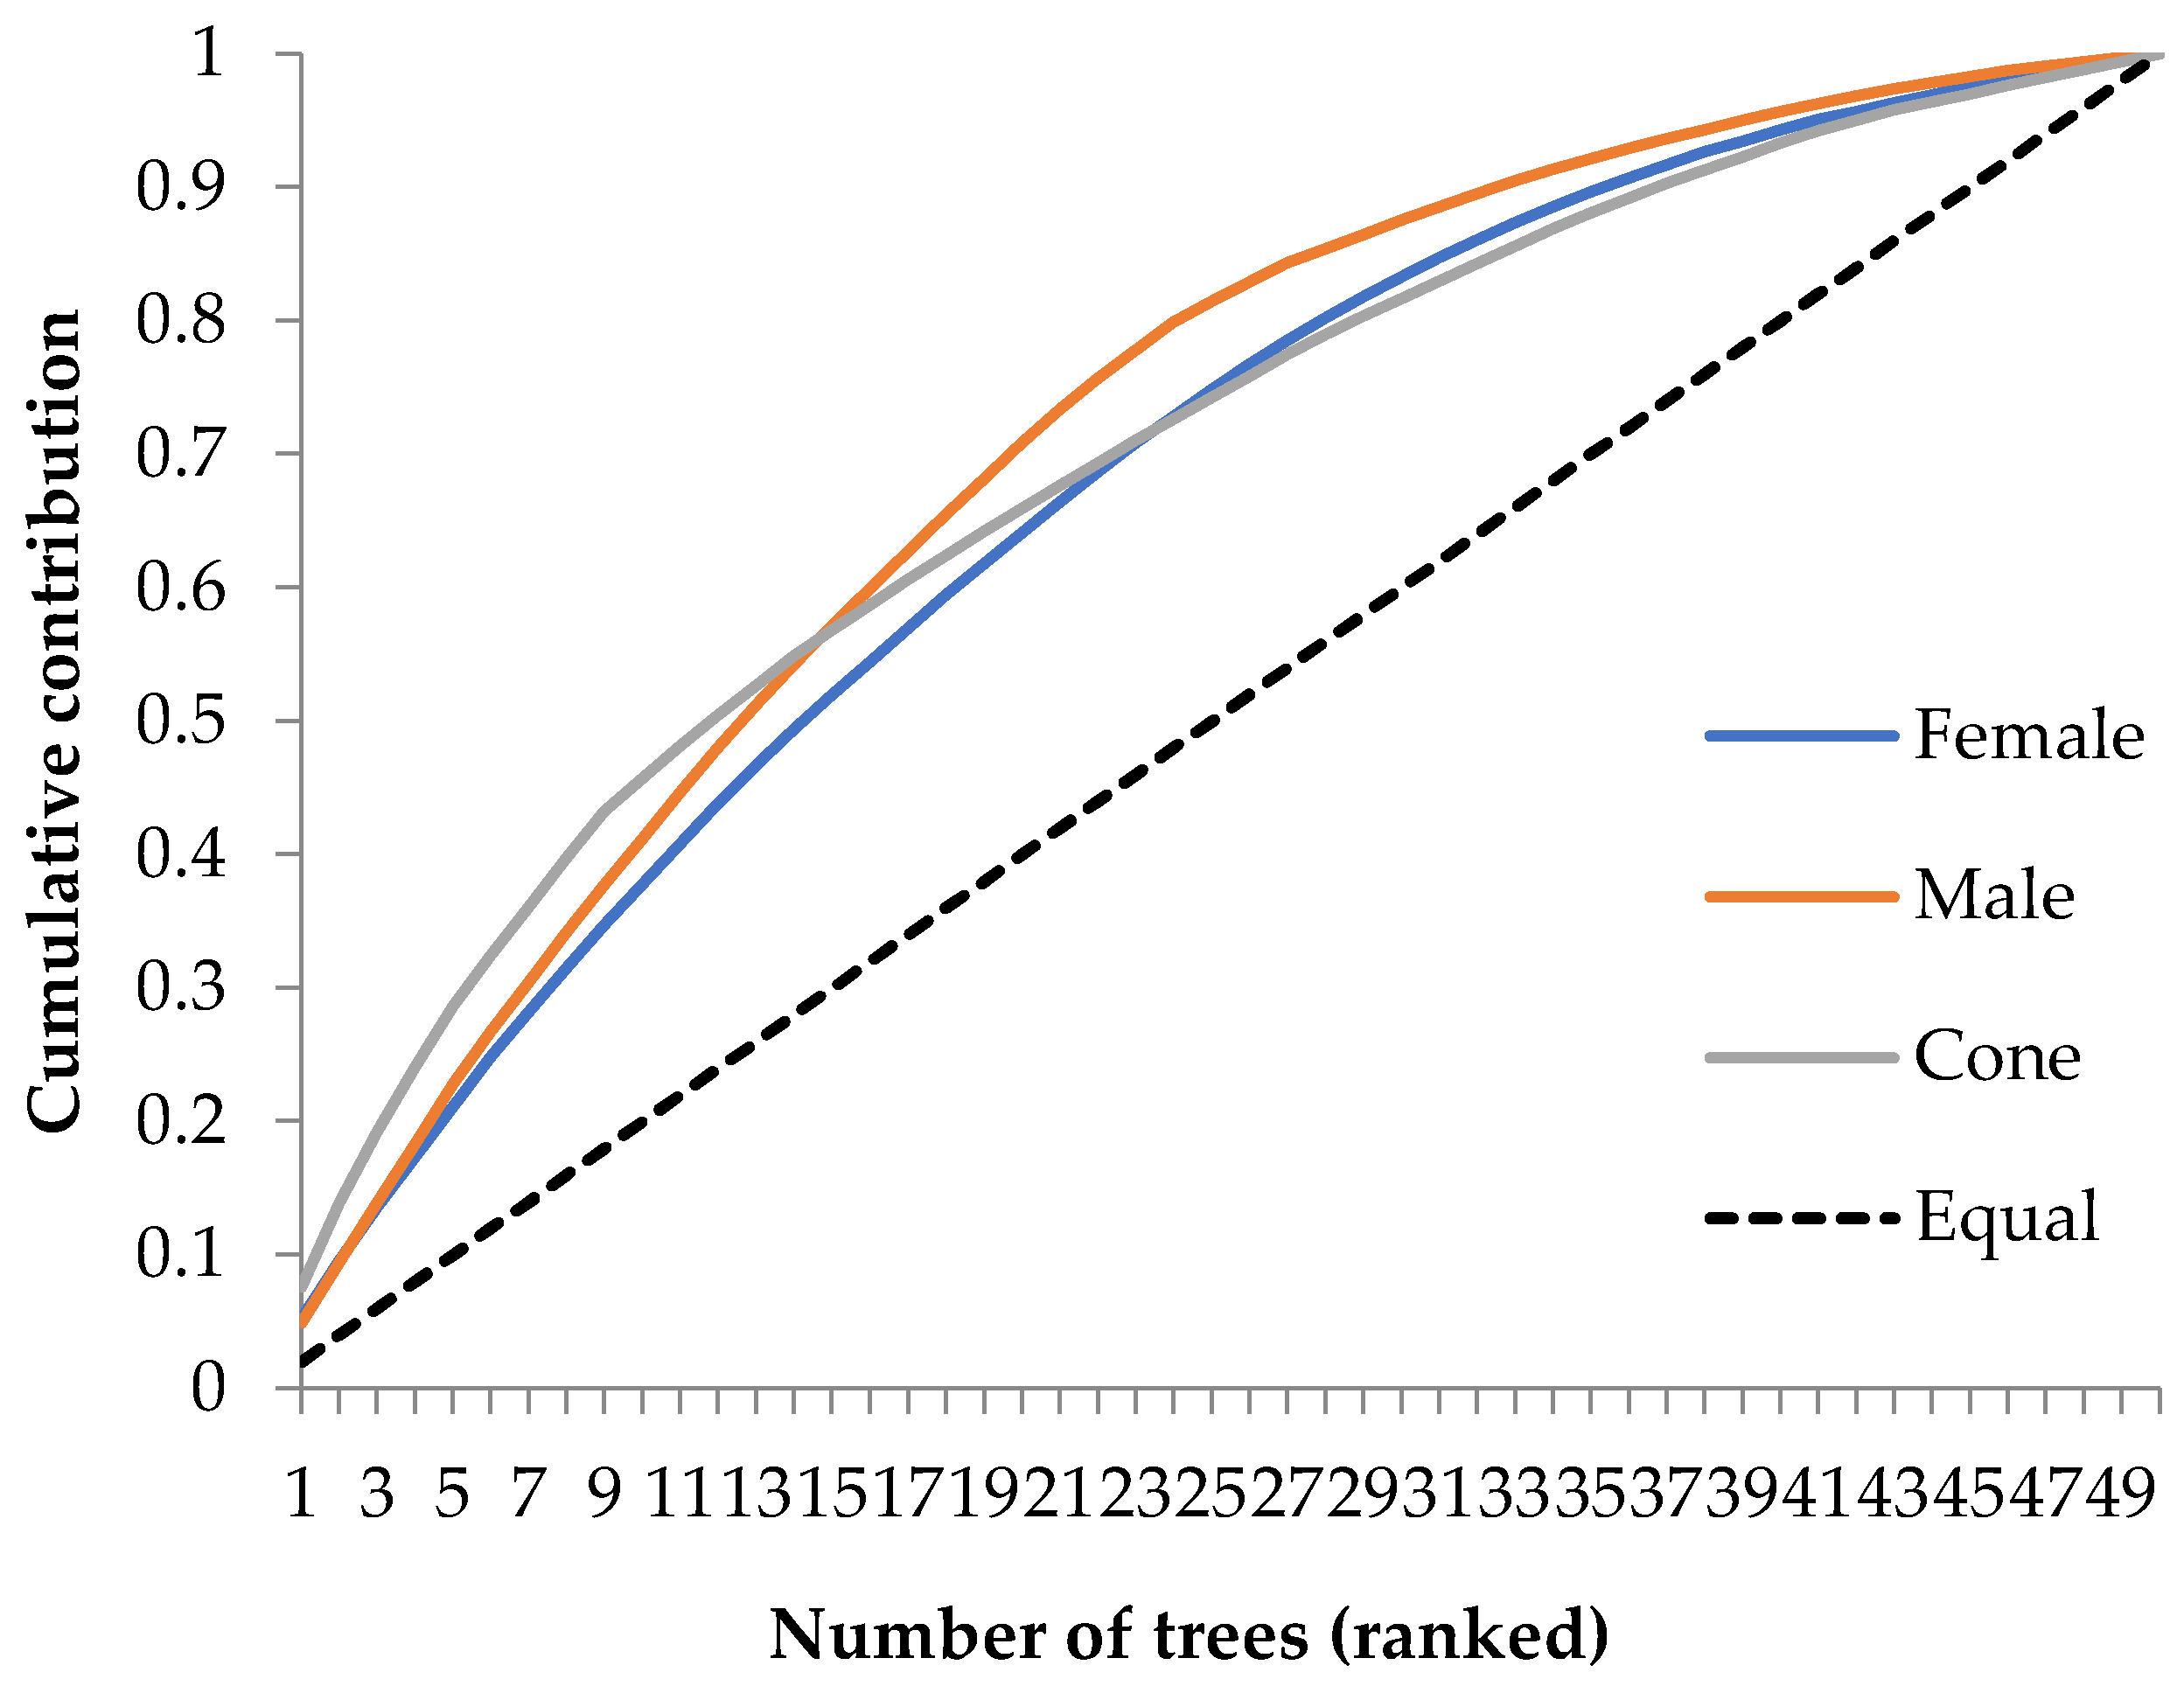
Parental balance curves are shown as an example in Figure 4 [17] using cumulative gamete contribution. Parental balance can be assessed using a cumulative gamete contribution curve [18,23,25,37,39]. This is an important guide tool for plant geneticists.
Variations in the parental contribution among families could be described using the parental cumulative curve shown in Figure 4. The cumulative contribution curve is linear, and the dotted diagonal line in Figure 4 denotes equal fertility among trees.
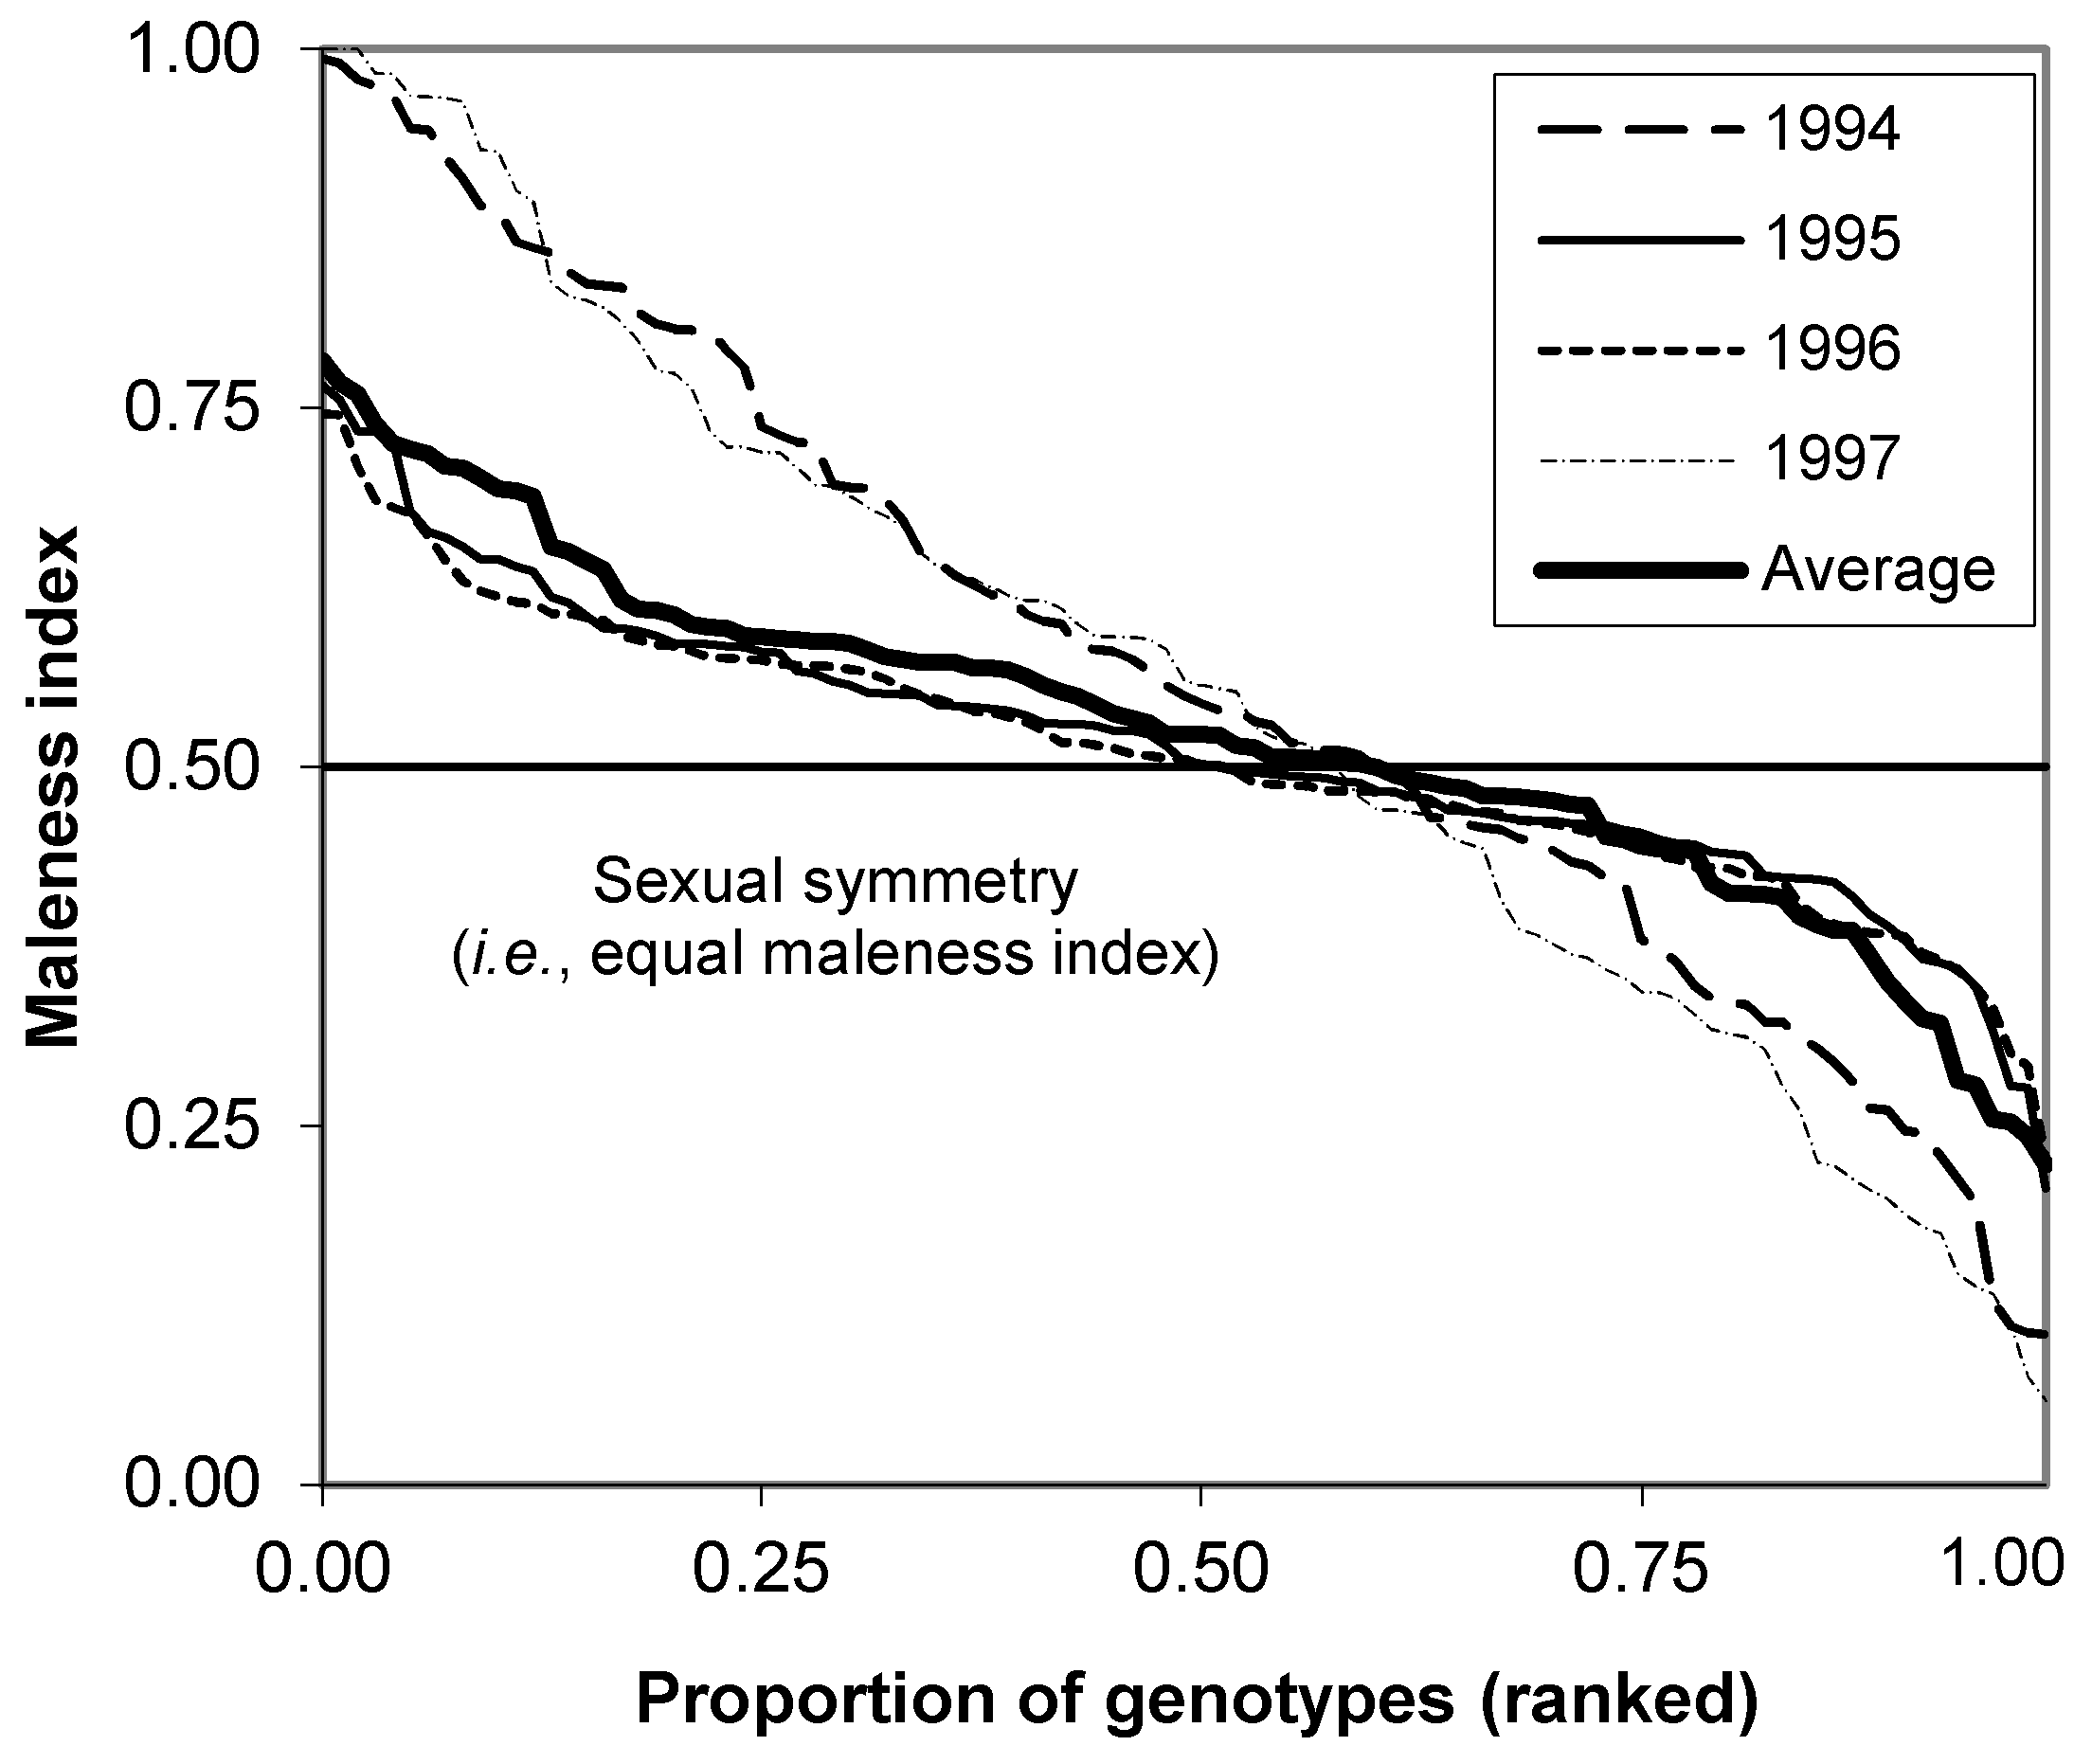
Maleness index (Mi) was defined as the proportion of a clone’s reproductive success that is transmitted through its pollen, that is, by paternal parents (Figure 5) [31,32,68]. The Mi represents the sexual asymmetry of parental contribution to seed crops among clones and provides a quantitative measure of gender [68,69,70] under some assumptions, such as equal fertility, and equality between ovule and pollen production. The Mi based on female and male fertility (e.g., female and male strobilus production) was calculated as follows:
M i = m i f i + m i
where mi is the proportion of male strobilus production and fi is that of female strobilus production of the ith clone. Femaleness index equals 1 − Mi, denoting the proportion of reproductive success transmitted by maternal parents. The high maleness of a clone indicates that the clone is contributing more as a father than as a mother parent when compared with other clones in the orchard [31,70].
The synchronization of flowering plays a vital role in assessing fertility variations, parental balance curves and the determination of the maleness index. Floral synchrony is closely tied to phenology, which is the most significant factor affecting the mating system and flower pollination in seed orchards [71,72]. For instance, in a second-generation clonal seed orchard of the Chinese fir, Cunninghamia lanceolata, a positive correlation was observed between the phenological synchronization index and both seed and cone production [73]. Moreover, by utilizing the phenological overlap index (proposed by [74]), researchers calculated the level of synchronicity required for optimal seed yield in a clonal seed orchard of northern red oak (Quercus rubra) and found that a high index was essential [75].
Furthermore, various reproductive indicators, such as cone length, cone weight, fertile scale count, a proportion of aborted ovules, a presence of empty and filled seeds, (referred to as seed efficiency), seed weight, ratio of empty to developed seeds, and weight of filled seeds and cones, should all be considered [76]. Additionally, when assessing the fertility of seed orchard crops, it is crucial to determine the depth of genetic diversity in future generations and their ability to withstand unpredictable environmental challenges. The range of variation in reproductive success can serve as a fundamental basis for this evaluation [77]. The entire process of fertility variations can be comprehensively examined, extending from seed germination tests to growth tests.

4. Conclusions

This comprehensive review provides valuable insights into fertility variations and their linkage parameters in the field of forest population genetics. Understanding the differences in reproductive success among individuals, known as fertility variations, has significant implications for gene conservation, seed production programs, managing forest genetic resources, and evolutionary and physiological studies.
Through an extensive analysis of the existing literature and knowledge, we created a comprehensive guide for future research on fertility variations and gene diversity. This review fills a notable gap in the literature by addressing the lack of a dedicated review paper specifically focusing on fertility variations and their linkage parameters. Fertility variation estimations, particularly through reproductive character assessments like cone production, have emerged as a cost-effective and widely used tool in plant sciences. They have found applications in seed orchards, seed stands, plantations, and natural populations. The increasing importance and popularity of fertility variations can be attributed to their numerous advantages and the ongoing research advancements.
We explored various methodologies for estimating fertility variations, including variations in female and male fertilities, total fertility variation (i.e., sibling coefficient), and effective parent numbers. Additionally, we discussed important linkage parameters such as coancestry, group coancestry, gene diversity, status number, and the effective number of parents. These parameters provide valuable insights into relatedness and gene diversity within forest populations, aiding in the management and conservation of forest genetic resources.
Furthermore, we highlighted the significance of parental balance curves as a tool for evaluating the contribution of individual parents to the overall gene pool. These curves visually represent cumulative gamete contribution and serve as a guide for breeding programs and seed production efforts. To further advance the field, we recommend incorporating molecular studies to support fertility research (i.e., marker-assisted selection (MAS)). Developing specialized stochastic software that is specifically designed for fertility variation and linkage parameter estimations would streamline calculations and analyses, leading to enhanced accuracy and efficiency. Moreover, fertility variations and their linkage parameters can be applied to new purposes, such as the establishment and selection of seed sources to produce climate-resilient seed crops based on gene diversity.
In summary, this review paper fills an important gap in the existing literature by providing a comprehensive overview of fertility variations and their linkage parameters. It serves as an invaluable resource for researchers and practitioners interested in studying and applying fertility variations in forest sciences. By understanding fertility variations, we can significantly contribute to gene conservation efforts, improve seed production programs, and gain deeper insights into the evolutionary and physiological aspects of forest populations. The integration of molecular studies, the development of specialized software, and the expansion of applications in seed source establishment and selection for climate resilience further advance the field of fertility research.

Author Contributions

K.-S.K. and N.B. organized the paper. K.-S.K. delivered a theoretical framework. K.J. and Y.-J.K. collected the published paper. K.J. and Y.-J.K. prepared the figures. All authors edited the final version of the manuscript. All authors have read and agreed to the published version of the manuscript.

Funding

This study was carried out with the support of ‘R&D Program for Forest Science Technology (Project No. FTIS 2022458B10-2224-0201)’ provided by Korea Forest Service (Korea Forestry Promotion Institute).

Institutional Review Board Statement

Not applicable.

Data Availability Statement

The data presented in this study are available upon request from the corresponding author.

Acknowledgments

The authors thank the anonymous reviewers who made valuable comments that helped to improve the manuscript.

Conflicts of Interest

The authors declare no conflict of interest.

References

  1. Lindgren, D.; Matheson, A.C. An algorithm for increasing the genetic quality of seed from seed orchards by using the better clones in higher proportions. Silvae Genet. 1986, 35, 173–177. [Google Scholar]
  2. Lindgren, D.; Danusevicius, D.; Rosvall, O. Unequal deployment of clones to seed orchards by considering genetic gain, relatedness and gene diversity. Forestry 2009, 82, 17–28. [Google Scholar] [CrossRef]
  3. Olsson, T.; Lindgren, D.; Li, B. Balancing genetic gain and relatedness in seed orchards. Silvae Genet. 2001, 50, 222–227. [Google Scholar]
  4. Chaisurisri, K.; El-Kassaby, Y.A. Estimation of clonal contribution to cone and seed crops in a Sitka spruce seed orchard. Ann. For. Sci. 1993, 50, 461–467. [Google Scholar] [CrossRef]
  5. Kjær, E.D. Estimation of effective population number in a Picea abies seed orchard based on flower assessment. Scand. J. For. Res. 1996, 11, 111–121. [Google Scholar] [CrossRef]
  6. Lindgren, D.; Mullin, T.J. Relatedness and status number in seed orchard crops. Can. J. For. Res. 1998, 28, 276–283. [Google Scholar] [CrossRef]
  7. Reynolds, S.; El-Kassaby, Y.A. Parental balance in Douglas-fir seed orchards-cone crop vs. seed crop. Silvae Genet. 1990, 39, 40–42. [Google Scholar]
  8. Funda, T.; Lstibůrek, M.; Lachout, P.; Klápště, J.; El-Kassaby, Y.A. Optimization of combined genetic gain and diversity for collection and deployment of seed orchard crops. Tree Genet. Genomes 2009, 5, 583–593. [Google Scholar] [CrossRef]
  9. Wu, H.; Duan, A.; Wang, X.; Chen, Z.; Zhang, X.; He, G.; Zhang, J. Construction of a Core Collection of Germplasms from Chinese Fir Seed Orchards. Forests 2023, 14, 305. [Google Scholar] [CrossRef]
  10. Bila, A.D. Fertility Variation and Its Effects on Gene Diversity in Forest Tree Populations. Ph.D. Thesis, Swedish University of Agricultural Science, Acta Universitatis Agriculturae Sueciae, Umeå, Sweden, 2000. [Google Scholar]
  11. Kang, K.S. Genetic Gain and Gene Diversity of Seed Orchard Crops. Ph.D. Thesis, Swedish University of Agricultural Science, Acta Universitatis Agriculturae Sueciae, Umeå, Sweden, 2001. [Google Scholar]
  12. Kang, K.S.; Bila, A.D.; Harju, A.M.; Lindgren, D. Estimation of fertility variation in forest tree populations. Forestry 2003, 76, 329–344. [Google Scholar] [CrossRef]
  13. Bilir, N.; Kang, K.S.; Lindgren, D. Fertility variation in six populations of Brutian pine (Pinus brutia Ten.) over altitudinal ranges. Euphytica 2005, 141, 163–168. [Google Scholar] [CrossRef]
  14. Bilir, N.; Kang, K.S. Fertility variation, seed collection and gene diversity in natural stands of Taurus cedar (Cedrus libani). Eur. J. For. Res. 2021, 40, 199–208. [Google Scholar] [CrossRef]
  15. Kamalakannan, R.; Varghese, M.; Park, J.M.; Kwon, S.H.; Song, J.H.; Kang, K.S. Fertility variation and its impact on effective population size in seed stands of Tamarindus indica and Azadirachta indica. Silvae Genet. 2015, 64, 91–99. [Google Scholar] [CrossRef]
  16. Yazici, N.; Bilir, N. Aspectual fertility variation and its effect on gene diversity of seeds in natural stands of Taurus cedar (Cedrus libani A. Rich.). Int. J. Genom. 2017, 2017, 2960624. [Google Scholar] [CrossRef]
  17. Park, J.M.; Kwon, S.H.; Lee, H.J.; Na, S.J.; El-Kassaby, Y.A.; Kang, K.S. Integrating fecundity variation and genetic relatedness in estimating the gene diversity of seed crops: Pinus koraiensis seed orchard as an example. Can. J. For. Res. 2017, 47, 366–370. [Google Scholar] [CrossRef]
  18. Kang, K.S.; Bilir, N. Seed Orchards (Establishment, Management and Genetics); OGEM-VAK Press: Ankara, Türkiye, 2021; Available online: https://www.ogemvak.org.tr/ (accessed on 10 March 2023).
  19. El-Kassaby, Y. Evaluation of the tree-improvement delivery system: Factors affecting genetic potential. Tree Physiol. 1995, 15, 545–550. [Google Scholar] [CrossRef]
  20. Eriksson, G.; Lindgren, D.; Jonsson, A. Flowering in a Clone Trial of Picea abies Karst; Technical Report; Royal School of Forestry: Stockholm, Sweden, 1973; Volume 110, pp. 1–45. [Google Scholar]
  21. Griffin, A.R. Clonal variation in radiata pine seed orchards. I. Some flowering, cone, and seed production traits. Aust. For. Res. 1982, 12, 295–302. Available online: http://jkv.50megs.com/afr.html (accessed on 29 April 2023).
  22. Roeder, K.; Devlin, B.; Lindsay, B.G. Application of maximum likelihood methods to population genetic data for the estimation of individual fertilities. Biometrics 1989, 45, 363–379. [Google Scholar] [CrossRef]
  23. El-Kassaby, Y.A.; Reynolds, S. Reproductive phenology, parental balance and supplemental mass pollination in a Sitka spruce seed orchard. For. Ecol. Manag. 1990, 31, 45–54. [Google Scholar] [CrossRef]
  24. Xie, C.Y.; Knowles, P. Male fertility variation in an open-pollinated plantation of Norway spruce (Picea abies). Can. J. For. Res. 1992, 22, 1463–1468. [Google Scholar] [CrossRef]
  25. El-Kassaby, Y.A.; Cook, C. Female reproductive energy and reproductive success in a Douglas-fir seed orchard and its impact on genetic diversity. Silvae Genet. 1994, 43, 243–246. [Google Scholar]
  26. Gömöry, D.; Bruchanik, R.; Paule, L. Effective population number estimation of three Scots pine (Pinus sylvestris L.) seed orchards based on an integrated assessment of flowering, floral phenology, and seed orchard design. For. Genet. 2000, 7, 65–75. [Google Scholar]
  27. Pakkanen, A.; Nikkanen, T.; Pulkkinen, P. Annual variation in pollen contamination and outcrossing in a Picea abies seed orchard. Scand. J. For. Res. 2000, 15, 399–404. [Google Scholar] [CrossRef]
  28. Hasan, N.; Choudhary, S.; Naaz, N.; Sharma, N.; Laskar, R.A. Recent advancements in molecular marker-assisted selection and applications in plant breeding programmes. J. Genet. Eng. Biotechnol. 2021, 19, 128. [Google Scholar] [CrossRef]
  29. Kang, K.S.; Lindgren, D. Fertility variation among clones of Korean pine (Pinus koraiensis S. et Z.) and its implications on seed orchard management. For. Genet. 1999, 6, 191–200. Available online: https://kf.tuzvo.sk/sites/default/files/FG06-3_191-200.pdf (accessed on 20 April 2023).
  30. Bilir, N. Fertility variation in wild rose (Rosa canina) over habitat classes. Int. J. Agric. Biol. 2011, 13, 110–114. [Google Scholar]
  31. Burczyk, J.; Chalupka, W. Flowering, and cone production variability and its effect on parental balance in a Scots pine clonal seed orchard. Ann. For. Sci. 1997, 54, 129–144. Available online: https://hal.science/hal-00883136 (accessed on 10 March 2023). [CrossRef]
  32. Kang, K.S.; Lindgren, D. Fertility variation and its effect on the relatedness of seeds in Pinus densiflora, Pinus thunbergii and Pinus koraiensis clonal seed orchards. Silvae Genet. 1998, 47, 196–201. [Google Scholar]
  33. Bila, A.D.; Lindgren, D.; Mullin, T.J. Fertility variation and its effect on diversity over generations in a teak plantation (Tectona grandis L.f.). Silvae Genet. 1999, 48, 109–114. [Google Scholar]
  34. Bila, A.D.; Lindgren, D. Fertility variation in Milletias thuhlmannii, Brachystegia spiciformis, Brachystegia bohemii and Leucaena leucocephala and its effects on relatedness in seeds. For. Genet. 1998, 5, 119–129. Available online: https://kf.tuzvo.sk/sites/default/files/FG05-2_119-129.pdf (accessed on 21 May 2023).
  35. Kang, K.S.; El-Kassaby, Y.A. Considerations of correlated fertility between genders on genetic diversity: The Pinus densiflora seed orchard as a model. Theor. Appl. Genet. 2002, 105, 1183–1189. [Google Scholar] [CrossRef]
  36. Gömöry, D.; Bruchánik, R.; Longauer, R. Fertility variation, and flowering asynchrony in Pinus sylvestris: Consequences for the genetic structure of progeny in seed orchards. For. Ecol. Manag. 2003, 174, 117–126. Available online: https://www.sciencedirect.com/science/article/pii/S0378112702000312?via%3Dihub (accessed on 12 June 2023). [CrossRef]
  37. Varghese, M.; Lindgren, D.; Nicodemus, A. Fertility and effective population size in seedling seed orchards of Casuarina equisetifolia and C. junghuhniana. Silvae Genet. 2004, 53, 164–168. [Google Scholar] [CrossRef]
  38. Varghese, M.; Nicodemus, A.; Nagarajan, B.; Lindgren, D. Impact of fertility variation on gene diversity and drift in two clonal seed orchards of teak (Tectona grandis Linn. f.). New For. 2006, 31, 497–512. [Google Scholar] [CrossRef]
  39. Prescher, F.; Lindgren, D.; Almqvist, C.; Kroon, J.; Lestander, T.; Mullin, T.J. Female fertility variation in mature Pinus sylvestris clonal seed orchards. Scand. J. For. Res. 2007, 22, 280–289. [Google Scholar] [CrossRef]
  40. Kamalakannan, R.; Varghese, M.; Lindgren, D. Fertility Variation and its Implications on Relatedness in Seed Crops in Seedling Seed Orchards of Eucalyptus camaldulensis and E. tereticornis. Silvae Genet. 2007, 56, 253–259. [Google Scholar] [CrossRef]
  41. Ertekin, M. Clone fertility and genetic diversity in a Black pine seed orchard. Silvae Genet. 2010, 59, 145–150. [Google Scholar] [CrossRef]
  42. Kamalakannan, R.; Varghese, M.; Suraj, P.G.; Arutselvan, T. Options for converting a clone trial of Eucalyptus camaldulensis into a clonal seed orchard considering gain, fertility and effective clone number. J. For. Res. 2016, 27, 51–57. [Google Scholar] [CrossRef]
  43. Cockerham, C.C. Group inbreeding and coancestry. Genetics 1967, 56, 89–104. [Google Scholar] [CrossRef]
  44. Kang, K.S.; Lindgren, D.; Mullin, T. Prediction of genetic gain and gene diversity in seed orchard crops under alternative management strategies. Theor. Appl. Genet. 2001, 103, 1099–1107. [Google Scholar] [CrossRef]
  45. Kartikawati, N. Fertility variation of Melaleuca cajuput subsp cajuputi and its implication seed orchard management. Indones. J. For. Res. 2016, 3, 83–94. [Google Scholar] [CrossRef]
  46. Kaya, Z.; Ozel, H.B. Fertility variation and gene diversity based on cone and seed production in a clonal seed orchard of Pinus nigra fresenius. Environ. Bull. 2018, 27, 3162–3165. Available online: https://www.prt-parlar.de/ (accessed on 11 March 2023).
  47. Suraj, P.G.; Nagabhushana, K.; Kamalakannan, R.; Varghese, M. Impact of fertility variation on genetic diversity and phenotypic traits in second generation seed production areas and clonal seed orchards of Eucalyptus camaldulensis. Silvae Genet. 2019, 68, 29–40. [Google Scholar] [CrossRef]
  48. Funda, T.; El-Kassaby, Y.A. Seed orchard genetics. CAB Rev. Perspect. Agric. Vet. Sci. Nutr. Nat. Resour. 2012, 7, 13. [Google Scholar] [CrossRef]
  49. Liesebach, H.; Liepe, K.; Bäucker, C. Towards new seed orchard designs in Germany—A review. Silvae Genet. 2021, 70, 84–98. [Google Scholar] [CrossRef]
  50. Muñoz-Gutiérrez, L.; Vargas-Hernández, J.J.; López-Upton, J.; Ramírez-Herrera, C.; Jiménez-Casas, M. Clonal variation in phenological synchronization and cone production in a Pinus patula seed orchard. Silvae Genet. 2020, 69, 130–138. [Google Scholar] [CrossRef]
  51. Wu, H.X.; Ker, R.; Chen, Z.; Ivkovic, M. Balancing breeding for growth and fecundity in Radiata pine (Pinus radiata D. Don) breeding programme. Evol. Appl. 2021, 14, 834–846. [Google Scholar] [CrossRef]
  52. Galeta, P.; Pankowská, A. A new method for estimating growth and fertility rates using age-at-death ratios in small skeletal samples: The effect of mortality and stochastic variation. PLoS ONE 2023, 18, e0286580. [Google Scholar] [CrossRef] [PubMed]
  53. Muller-Starck, G.; Ziehe, M. Reproductive systems in conifer seed orchards. Theor. Appl. Genet. 1984, 69, 173–177. [Google Scholar] [CrossRef]
  54. Schmidtling, R.C. The inheritance of precocity and its relationship with growth in loblolly pine. Silvae Genet. 1981, 30, 188–192. [Google Scholar]
  55. Schultz, R.P. Stimulation of Flower and Seed Production in a Young Slash Pine Orchard; Southeastern Forest Experiment Station Forest Service, U.S. Department of Agriculture: New Orleans, LA, USA, 1971; 10p.
  56. Savolainen, O.; Karkkainen, K.; Harju, A.; Nikkanen, T.; Rusanen, M. Fertility variation in Pinus sylvestris: A test of sexual allocation theory. Am. J. Bot. 1993, 80, 1016–1020. [Google Scholar] [CrossRef]
  57. Hannerz, M.; Aitken, S.; Ericsson, N.; Ying, C.C. Inheritance of strobili production and genetic correlation with growth in lodgepole pine. For. Genet. 2001, 8, 323–329. [Google Scholar]
  58. Bhumibhamon, S. Studies on Scots pine seed orchards in Finland with special emphasis on the genetic composition of the seed. Comm. Inst. For. Fenn. 1978, 94, 1–118. [Google Scholar]
  59. Kjær, E.D.; Wellendorf, H. Variation in flowering and reproductive success in a Danish Picea abies (Karst) seed orchard. For. Genet. 1997, 4, 181–188. [Google Scholar]
  60. Nikkanen, T.; Ruotsalainen, S. Variation in flowering abundance and impact on the genetic diversity of the seed crop in a Norway Spruce seed orchard. Silva Fenn. 2000, 34, 205–222. [Google Scholar] [CrossRef]
  61. Nikkanen, T.; Velling, P. Correlations between flowering and some vegetative characteristics of grafts of Pinus sylvestris. For. Ecol. Manag. 1987, 19, 35–40. [Google Scholar] [CrossRef]
  62. Almqvist, C.; Jansson, G.; Sonesson, J. Genotypic correlations between early cone-set and height growth in Picea abies clonal trials. For. Genet. 2001, 8, 197–204. [Google Scholar]
  63. Boydak, M. Seed Yield of Pinus sylvestris in Catacik-Eskisehir; Istanbul University Press: Istanbul, Türkiye, 1977; Available online: www.istanbul.edu.tr (accessed on 11 May 2023).
  64. Lindgren, D.; Gea, L.; Jefferson, P. Loss of genetic diversity monitored by status number. Silvae Genet. 1996, 45, 52–59. Available online: https://www.degruyter.com (accessed on 12 June 2023).
  65. Ivetić, V.; Devetaković, J.; Nonić, M.; Stanković, D.; Šijačić-Nikolić, M. Genetic diversity and forest reproductive material—From seed source selection to planting. iForest 2016, 9, 801–812. [Google Scholar] [CrossRef]
  66. Matziris, D. Variation in cone production in a clonal seed orchard of Black pine. Silvae Genet. 1993, 42, 136–141. [Google Scholar]
  67. Park, J.M.; Kang, H.Y.; Yeom, D.B.; Kang, K.S.; El-Kassaby, Y.A.; Lee, K.M. Gender, reproductive output covariation and their role on gene diversity of Pinus koraiensis seed orchard crops. BMC Plant Biol. 2020, 20, 418. [Google Scholar] [CrossRef]
  68. Lloyd, D.G. Parental strategies of angiosperms. N. Z. J. Bot. 1979, 17, 595–606. [Google Scholar] [CrossRef]
  69. Jiao, S.-Q.; Li, M.; Zhu, Y.-J.; Zhou, S.-S.; Zhao, S.-W.; Li, Z.-C.; Bao, Y.-T.; Shi, T.-L.; Zhang, H.-J.; Yang, X.-L. Variation in Platycladus orientalis (Cupressaceae) Reproductive output and its effect on seed orchard crops’ genetic diversity. Forests 2021, 12, 1429. [Google Scholar] [CrossRef]
  70. Kang, K.S. Clonal and annual variation of flower production and composition of gamete gene pool in a clonal seed orchard of Pinus densiflora. Can. J. For. Res. 2000, 30, 1275–1280. [Google Scholar] [CrossRef]
  71. Eriksson, V.J.; Adams, W.T. Mating success in a coastal Douglas-fir seed orchard as affected by distance and floral phenology. Can. J. For. Res. 1989, 19, 1248–1255. [Google Scholar] [CrossRef]
  72. El Kassaby, Y.A.; Ritland, K.; Fashler, A.M.; Devitt, W.J.B. The role of reproductive phenology upon the mating success of a Douglas-fir seed orchard. Silvae Genet. 1988, 37, 76–82. [Google Scholar]
  73. Xie, J.; Huang, X.; Liu, Y.; Zhu, P.; Zhu, Y.; Li, F.; Yao, J.; Chen, L.; Yang, H. Variation of fertility and phenological synchronization in Cunninghamia lanceolata seed orchard: Implications for seed production. Forests 2022, 13, 1571. [Google Scholar] [CrossRef]
  74. Askew, G.R.; Blush, T.D. Short note: An index of phenological overlap in flowering for clonal conifer seed orchards. Silvae Genet. 1990, 39, 168–171. [Google Scholar]
  75. Alexander, L.W.; Woeste, K.E. Phenology, dichogamy, and floral synchronization in a northern red oak (Quercus rubra) seed orchard. Can. J. For. Res. 2016, 46, 629–636. [Google Scholar] [CrossRef]
  76. Mápula-larreta, M.; López-Upton, J.; Vargas-Hernández, J.J.; Hernández-Livera, A. Reproductive indicators in natural populations of Douglas-fir in Mexico. Biodivers. Conserv. 2007, 16, 727–742. [Google Scholar] [CrossRef]
  77. El-Kassaby, Y.A.; Funda, T.; Lai, B.S.K. Female reproductive success variation in a Pseudotsuga menziesii seed orchard as revealed by pedigree reconstruction from a bulk seed collection. J. Hered. 2010, 101, 164–168. [Google Scholar] [CrossRef] [PubMed]
Figure 1. Scenarios of the parental contribution in model seed orchards with five unrelated, non-inbred individuals (N = 5). The different part in the pie chart is the different contribution of each individual. Reproduced with permission from [11].
Forests 14 02172 g001
Figure 2. Accumulation of group coancestry (Θ) over five generations for a constant population size (N = 180), and the sibling coefficient (Ψ) is 2. Reproduced with permission from [29].
Forests 14 02172 g002
Figure 3. Stochastic simulation of the effective number of parents (Np) with female and male fertility variations (CVf, CVm) under various covariation (correlation coefficients, r) between female and male reproductive outputs, where the census number is 100 (N = 100) in the population. Reproduced with permission from [67].
Forests 14 02172 g003
Figure 4. Parental balance curves for reproductive outputs in a population of Taurus cedar. Reproduced with permission from [17].
Forests 14 02172 g004
Figure 5. Maleness index calculated for individual clones of 99) based on the observations of strobilus production for 4 years. The horizontal line shows where the average contribution for reproduction is the same for both genders. Reproduced with permission from [68].
Forests 14 02172 g005
Disclaimer/Publisher’s Note: The statements, opinions and data contained in all publications are solely those of the individual author(s) and contributor(s) and not of MDPI and/or the editor(s). MDPI and/or the editor(s) disclaim responsibility for any injury to people or property resulting from any ideas, methods, instructions or products referred to in the content.