Article

Forest Single-Frame Remote Sensing Image Super-Resolution Using GANs

College of Computer and Control Engineering, Northeast Forestry University, Harbin 150040, China
*
Author to whom correspondence should be addressed.
Forests 2023, 14(11), 2188; https://doi.org/10.3390/f14112188
Submission received: 11 October 2023 / Revised: 27 October 2023 / Accepted: 29 October 2023 / Published: 3 November 2023
(This article belongs to the Special Issue Machine Learning Techniques in Forest Mapping and Vegetation Analysis)

Abstract

:
Generative Adversarial Networks (GANs) possess remarkable fitting capabilities and play a crucial role in the field of computer vision. Super-resolution restoration is the process of converting low-resolution images into high-resolution ones, providing more detail and information. This is of paramount importance for monitoring and managing forest resources, enabling the surveillance of vegetation, wildlife, and potential disruptive factors in forest ecosystems. In this study, we propose an image super-resolution model based on Generative Adversarial Networks. We incorporate Multi-Scale Residual Blocks (MSRB) as the core feature extraction component to obtain image features at different scales, enhancing feature extraction capabilities. We introduce a novel attention mechanism, GAM Attention, which is added to the VGG network to capture more accurate feature dependencies in both spatial and channel domains. We also employ the adaptive activation function Meta ACONC and Ghost convolution to optimize training efficiency and reduce network parameters. Our model is trained on the DIV2K and LOVEDA datasets, and experimental results indicate improvements in evaluation metrics compared to SRGAN, with a PSNR increase of 0.709/2.213 dB, SSIM increase of 0.032/0.142, and LPIPS reduction of 0.03/0.013. The model performs on par with Real-ESRGAN but offers significantly improved speed. Our model efficiently restores single-frame remote sensing images of forests while achieving results comparable to state-of-the-art methods. It overcomes issues related to image distortion and texture details, producing forest remote sensing images that closely resemble high-resolution real images and align more closely with human perception. This research has significant implications on a global scale for ecological conservation, resource management, climate change research, risk management, and decision-making processes.

1. Introduction

Super-resolution restoration can convert low-resolution images into high-resolution images, providing more detail and information. This is critical for the monitoring and management of forest resources, as it allows more accurate detection and identification of different characteristics in forests, such as tree species, forest health status and forest cover type, which can help monitor forest vegetation, wildlife and potential destructive factors such as forest fires, illegal logging and tree diseases. This helps to identify problems early and take the necessary conservation measures to reduce the loss of forest resources. High-quality image data are the basis for scientific research to better understand the complexity of forest ecosystems, reduce forest destruction, protect ecosystems and improve the sustainable use of forest resources.
Image super-resolution technology refers to the technique of enlarging the resolution of low-resolution degraded images through technical means, thereby obtaining high-resolution, clearer images. It is one of the important technologies in the fields of computer vision and image processing. This technology not only enhances the visual perception of images but also plays a significant role in medical imaging and single-frame remote sensing imaging. Moreover, image super-resolution technology contributes to various computer vision tasks such as object detection and semantic segmentation.
With the continuous evolution of deep learning technology, the prevailing image super-resolution models now heavily rely on deep learning. The development of deep learning-based image super-resolution models has roughly progressed in tandem with the architecture of mainstream classification models. The key milestones in this progression are as follows: In 2014, Dong et al. pioneered the integration of deep learning methods into the field of image super-resolution by introducing the SRCNN model [1], based on AlexNet. This marked the initial application of convolutional neural networks to image super-resolution. Subsequently, in 2016, they further introduced the FSRCNN model [2], gradually deepening the network layers. In 2017, KIM et al. introduced VDSR [3], which was the first model to address image super-resolution reconstruction problems using residual deep networks. The core idea was that by learning the high-frequency residual information between high-resolution and low-resolution images, super-resolution could be achieved. This is because the low-frequency information present in low-resolution images is almost identical to the low-frequency information conveyed by high-resolution images. To address the issue of insufficient utilization of hierarchical features of LR (low-resolution) images during the reconstruction process, ZHANG et al. proposed the RDN (residual dense network) [4], which combined multiple residual dense blocks in a cascading manner. Subsequently, Dong et al. also built upon the principles of residual networks and introduced the EDSR [5] model based on VDSR. Following this, Ledig et al. applied Generative Adversarial Networks (GANs) [6] to the field of super-resolution, combining them with residual networks to introduce SRGAN [7]; this marks the initial exploration of Generative Adversarial Networks in the field of image super-resolution.
GANs exhibit exceptional fitting capabilities and play a pivotal role in the field of computer vision. They consist of a generator and a discriminator. In the context of image super-resolution, the generator’s primary function is to extract image features from the input low-resolution image, uncover higher-frequency details, and, at the network’s end, generate a high-resolution image. The generator is continuously optimized by adjusting gradients based on the output from the discriminator, with the aim of minimizing the loss function to enhance its generation performance. The discriminator is responsible for assessing the authenticity of the input high-resolution images, essentially serving as a binary classifier that outputs corresponding classification probabilities. The optimization objective for the generator is to render the discriminator incapable of distinguishing between the original high-resolution images and those generated by the generator. In contrast, the optimization goal for the discriminator is to accurately differentiate between the original high-resolution images and the generator’s output. These two components engage in a strategic game where the performance of both the generator and the discriminator improves during training, ultimately reaching a Nash equilibrium [8]. In recent years, a series of image super-resolution models based on Generative Adversarial Networks have emerged, such as ESRGAN, RankSRGAN, leading up to Real-ESRGAN, introduced in 2021.
In order to better serve the restoration of single-frame remote sensing images for forests and, on a global scale, enhance their role in ecological conservation, resource management, climate change research, risk management, and decision making, we have designed a single-frame remote sensing image super-resolution model based on Generative Adversarial Networks.
Our key contributions are summarized as follows:
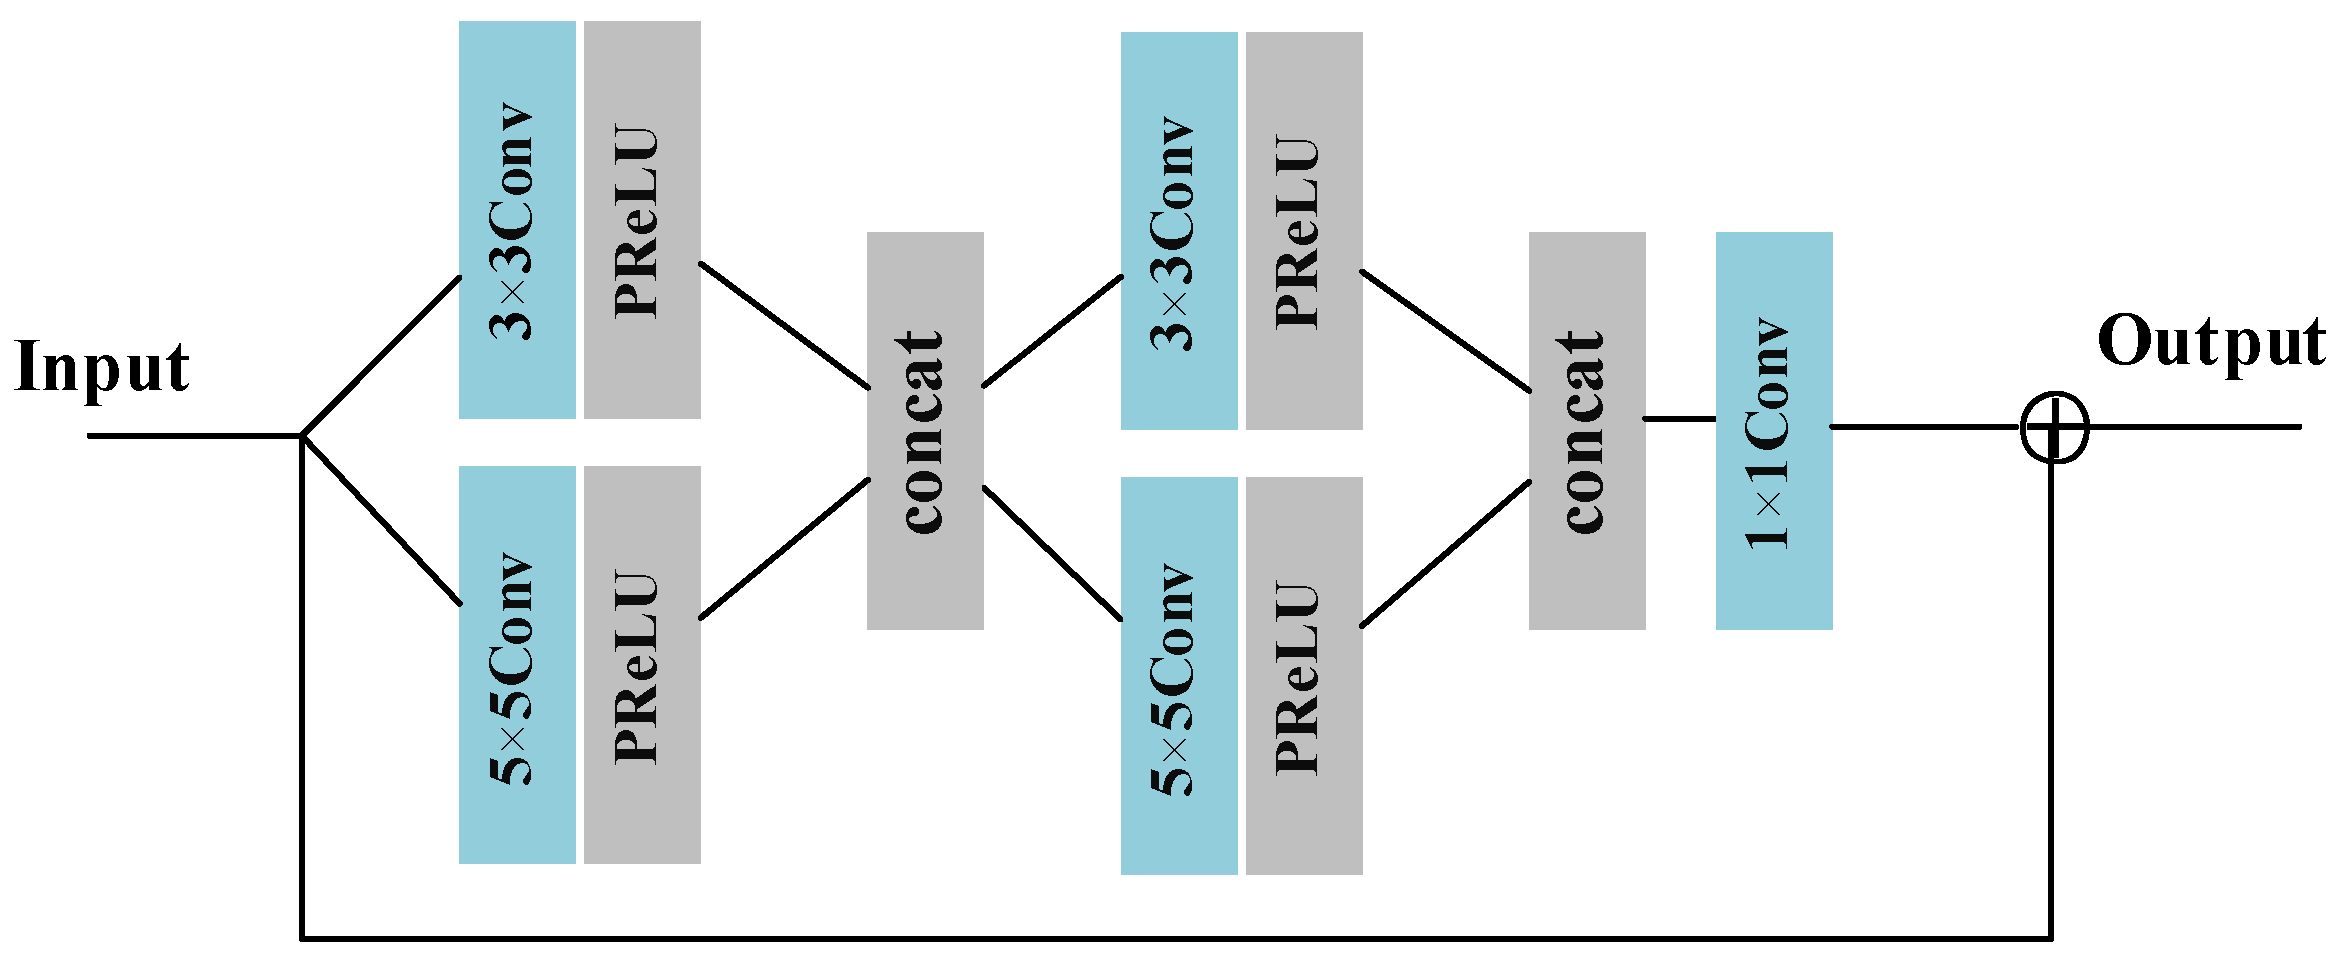
  • We introduce MSRB as a feature extraction component to enhance feature extraction capabilities by obtaining image features at different scales. MSRB constructs a dual-branch network, where different branches use distinct convolution kernels. These branches share information with each other, enabling the adaptive detection of image features at different scales.
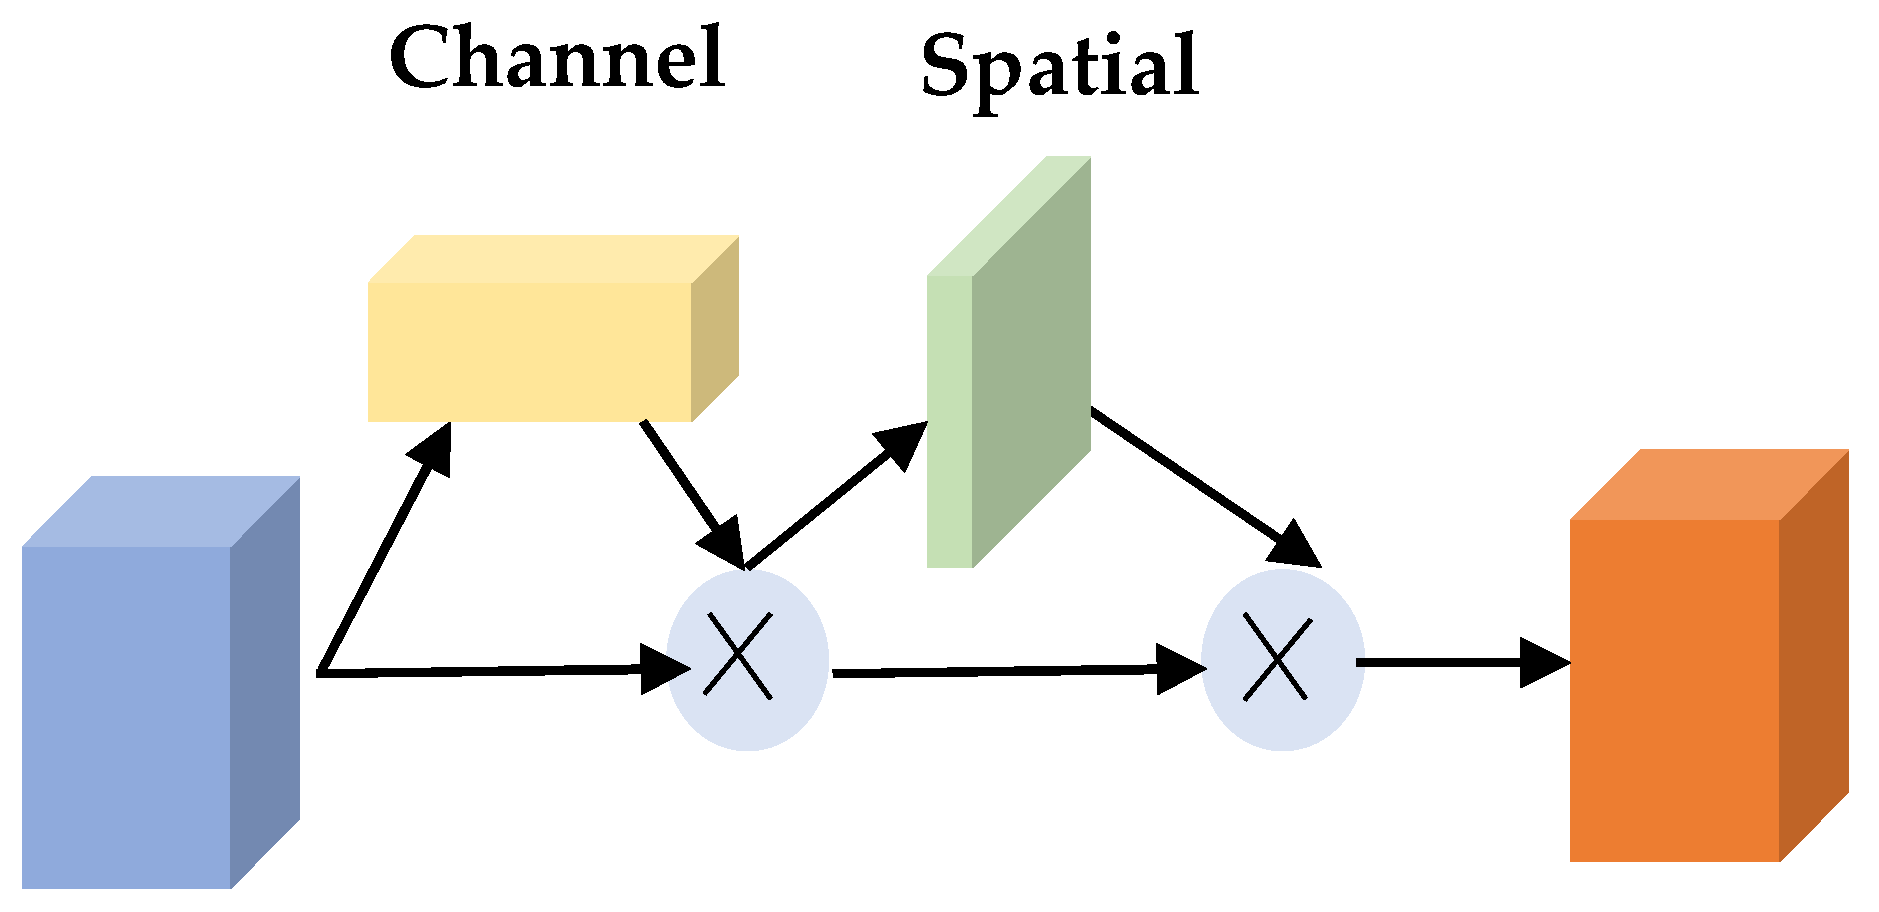
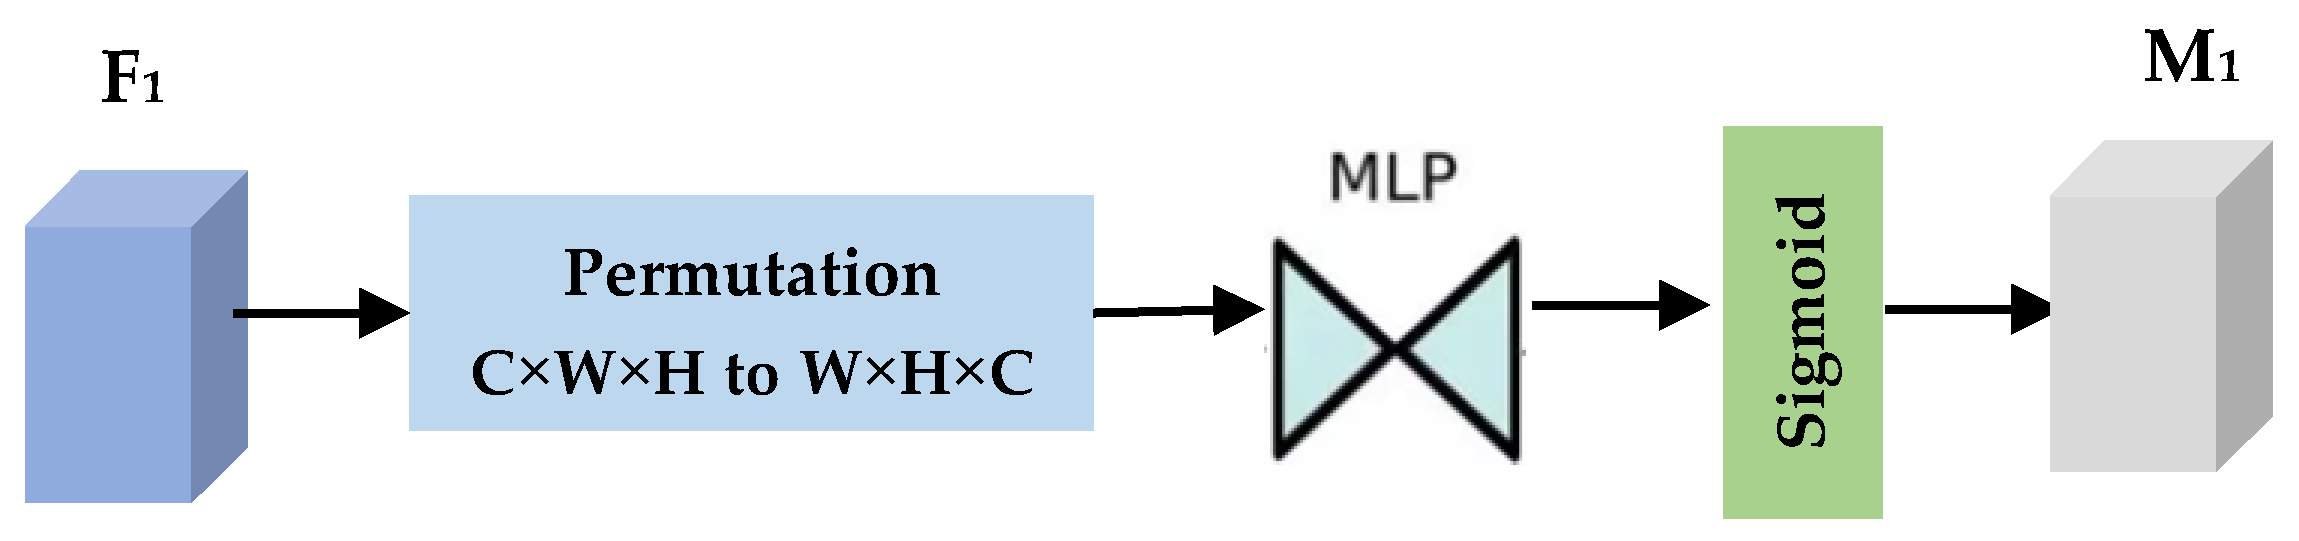
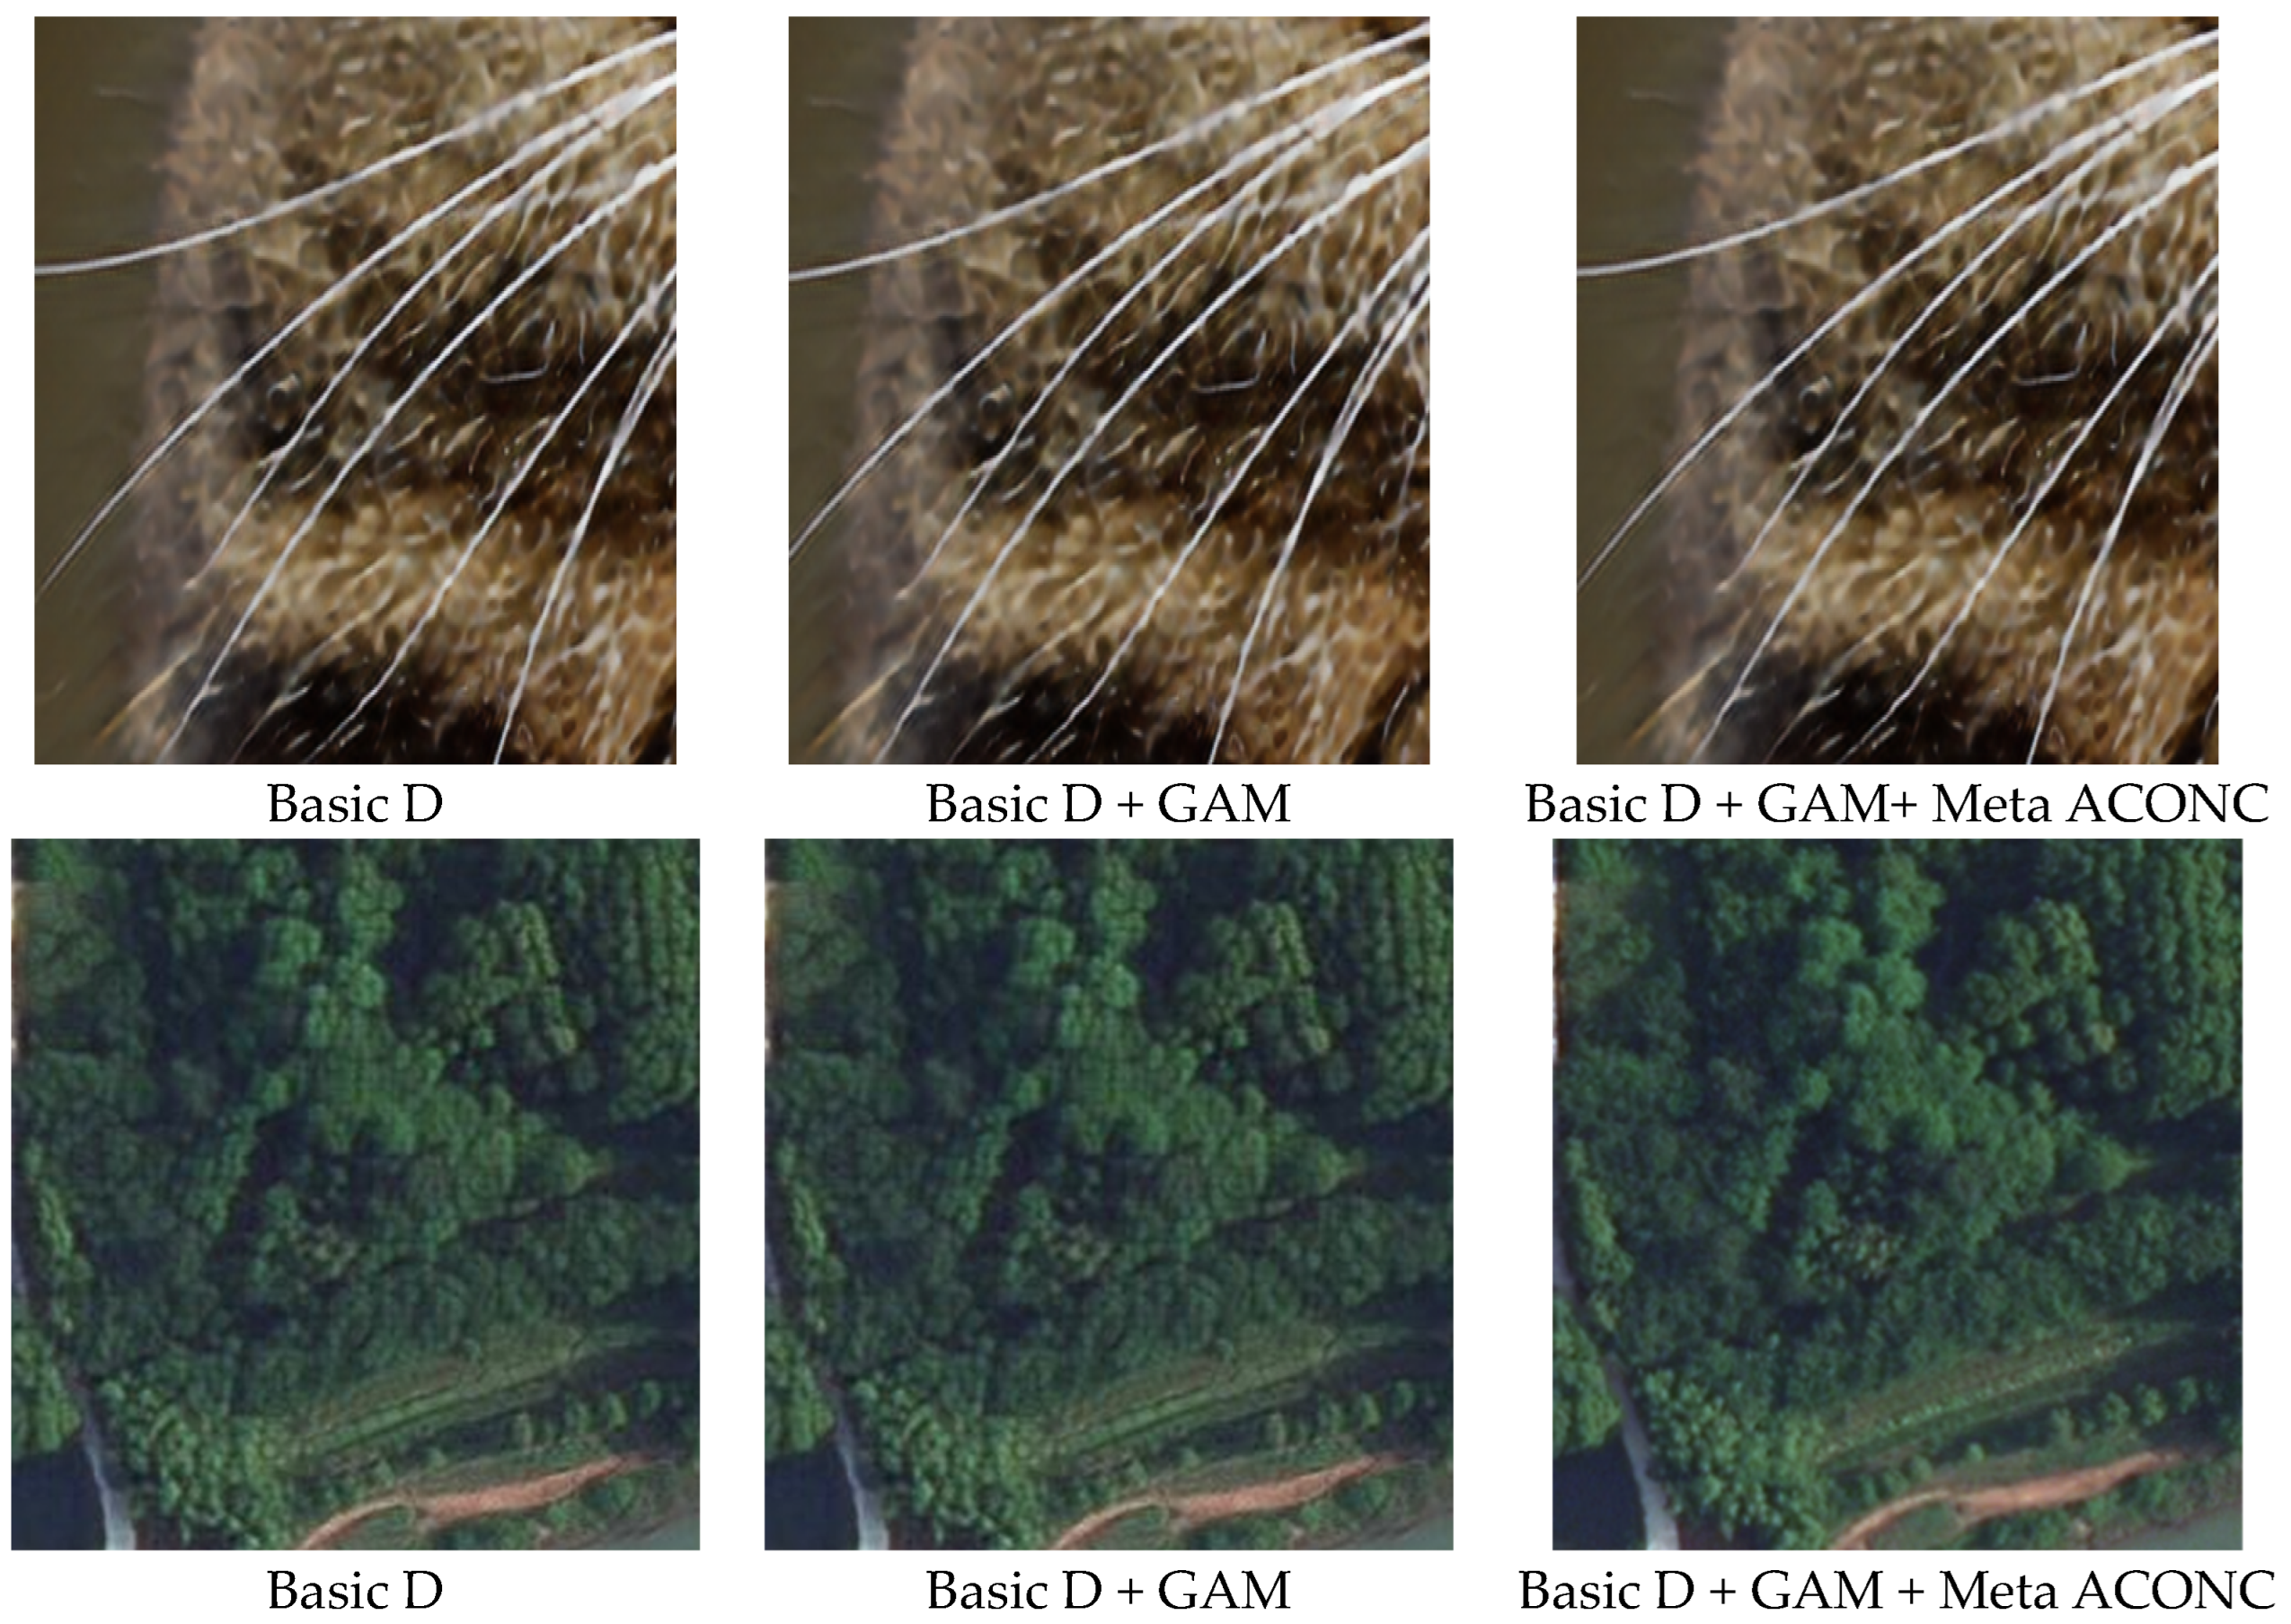
  • We propose GAM Attention and incorporate it into the VGG network to capture more precise feature dependencies in both spatial and channel domains.
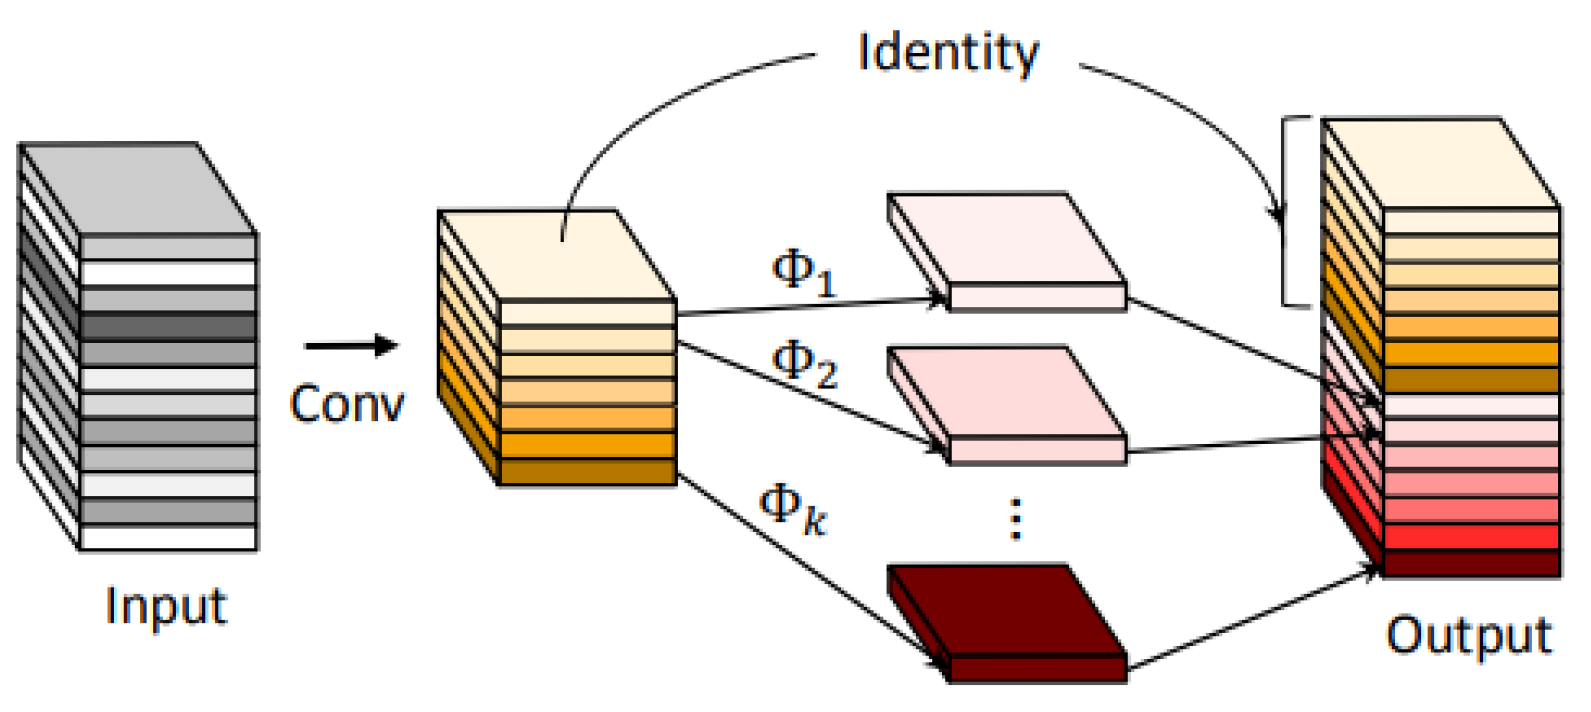
  • We apply Meta ACONC as the activation function within the VGG network. By dynamically learning the parameters of the Meta ACONC activation function for each neuron, it is designed to enhance network feature representation. Additionally, Ghost convolution is employed to optimize the convolution layers in the network, reducing network parameters and computational complexity.
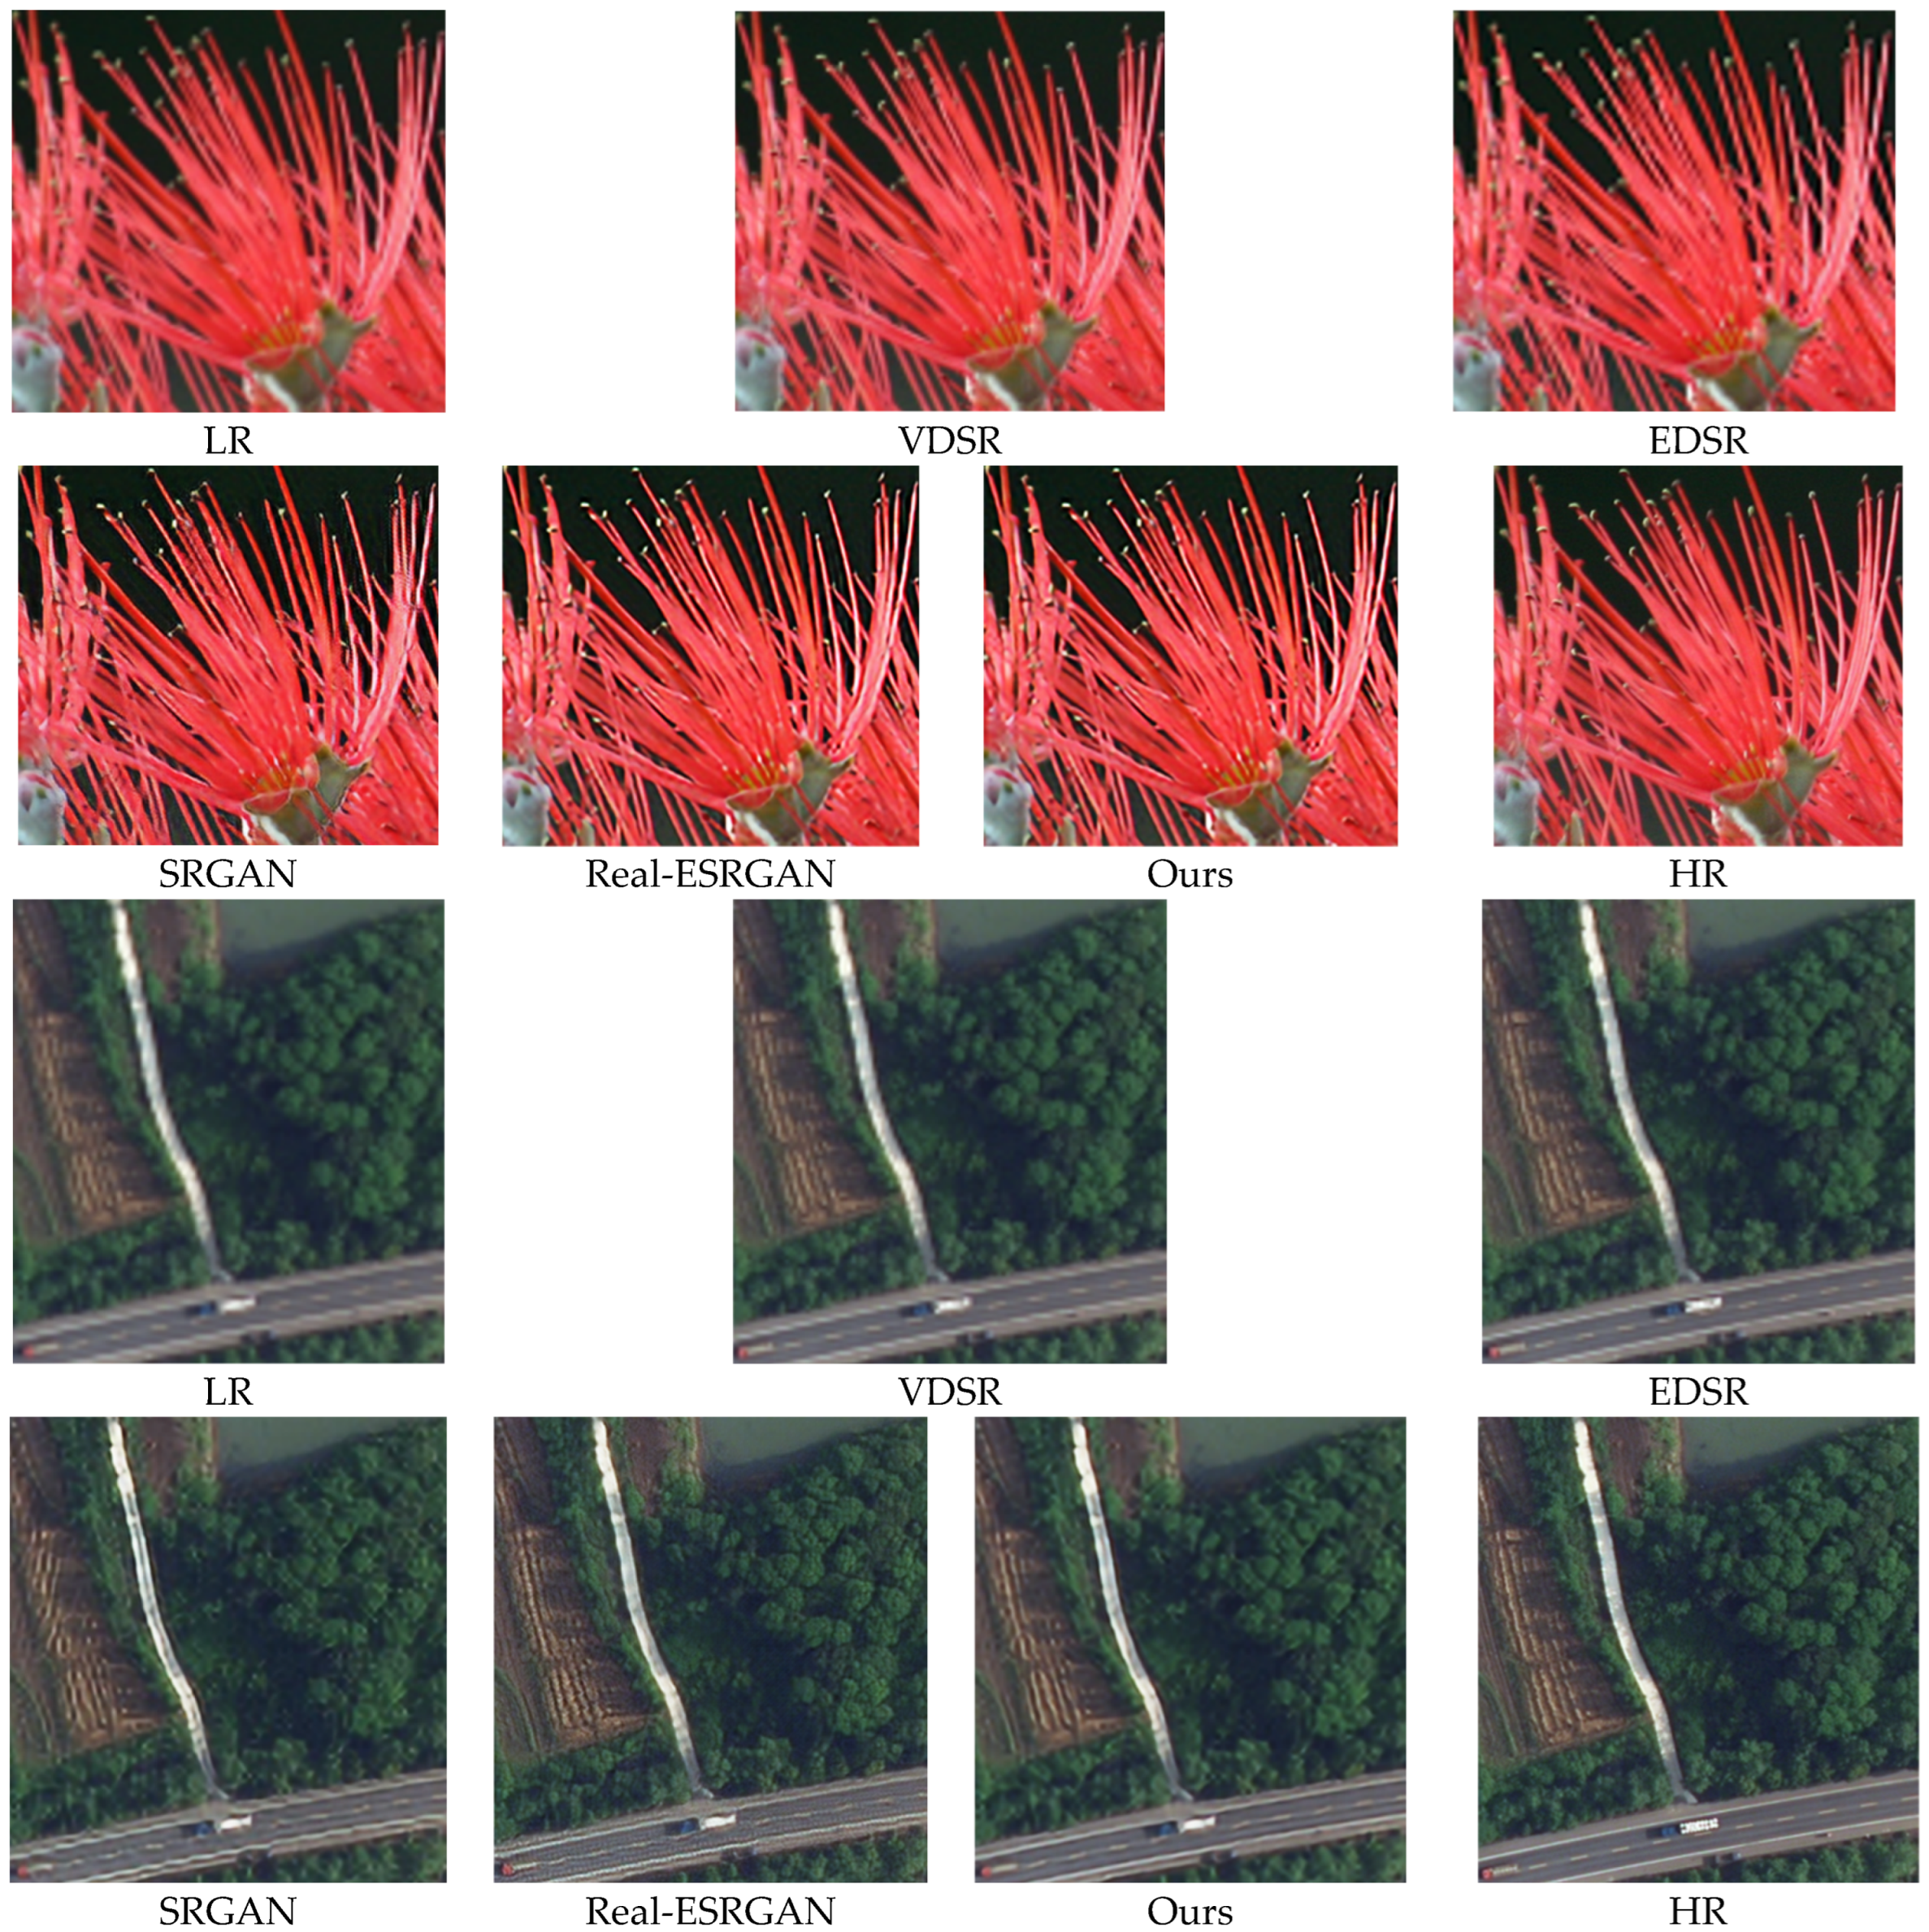
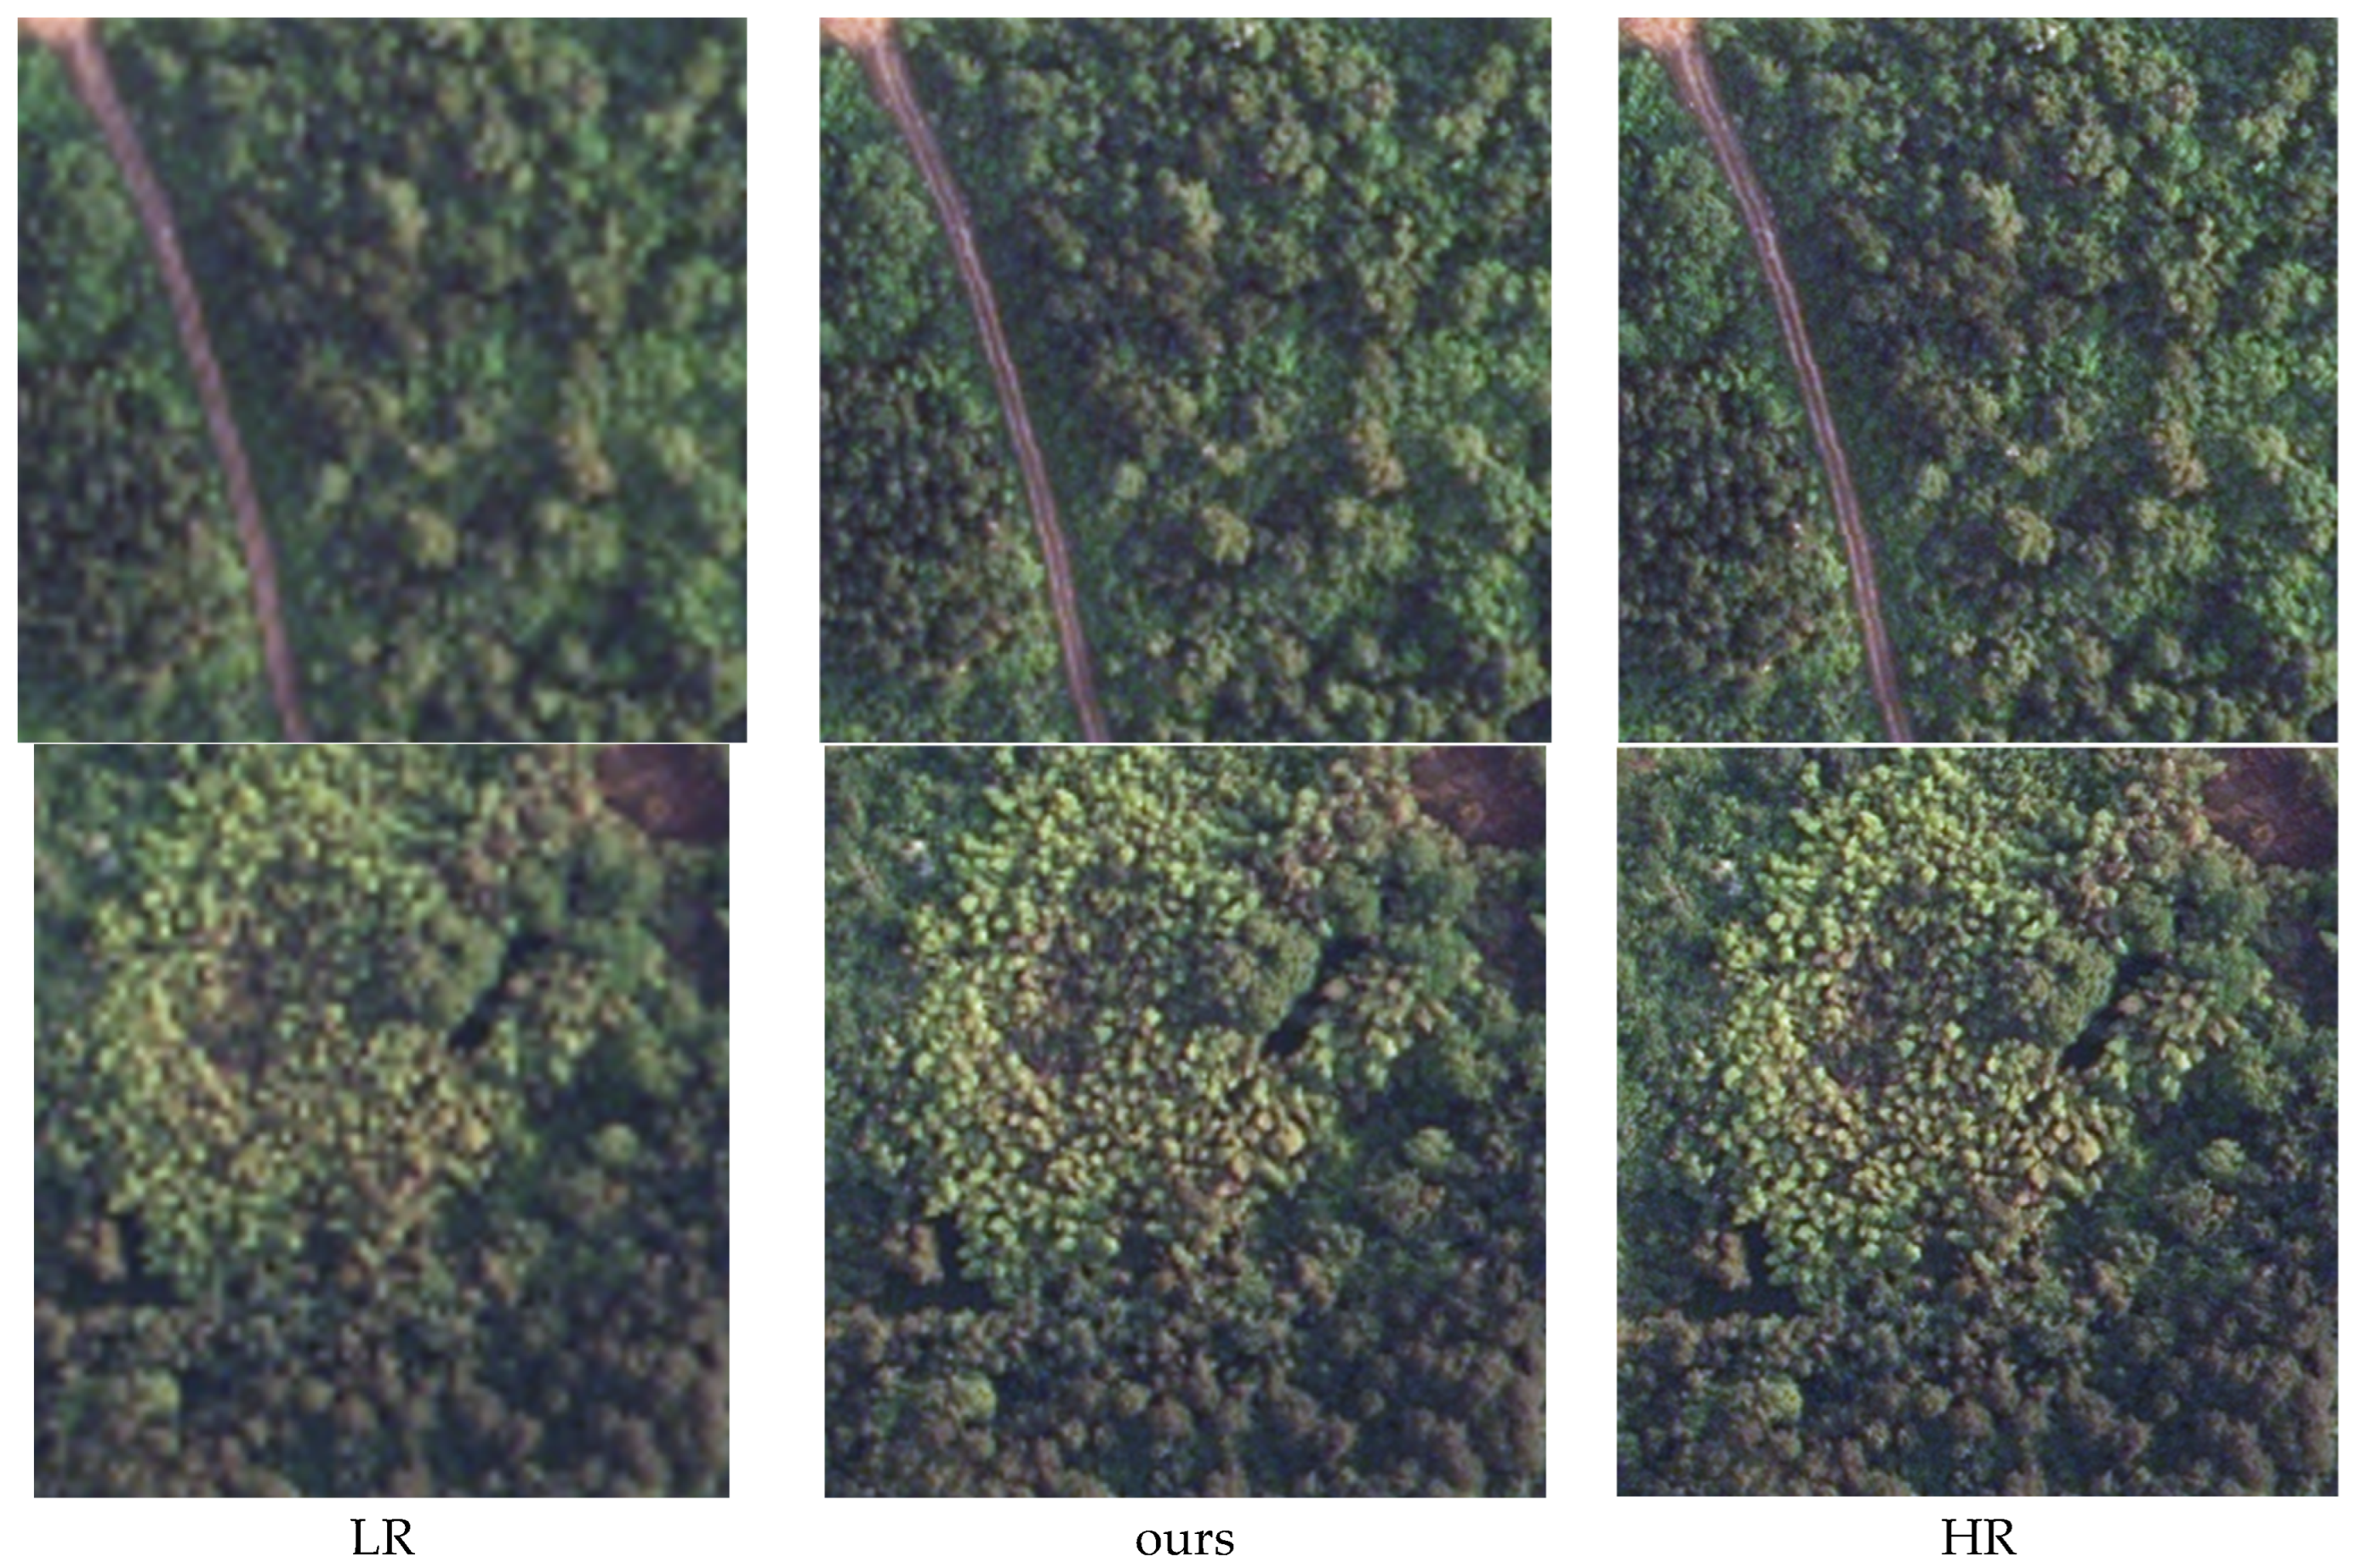
  • We conduct a multitude of comparative experiments with mature and advanced models. When tested on the high-resolution DIV2K dataset and the single-frame forest remote sensing image dataset LOVEDA, our proposed model outperforms some mainstream models in terms of perceived image quality. It exhibits higher image realism, with an improvement of 0.709/2.213 dB in PSNR and an increase of 0.032/0.142 in SSIM; LPIPS shows a decrease of 0.03/0.013 compared to SRGAN, while performing on par with Real-ESRGAN in terms of metrics. Significantly, it achieves faster processing speeds. These results demonstrate that our proposed model efficiently attains competitive performance in the context of single-frame forest remote sensing images.
  • This model contributes to improving the quality and information content of remote sensing images, providing a powerful tool for better understanding and preserving Earth’s forest ecosystems.

2. Related Work

Traditional image super-resolution algorithms can be categorized into three main types: 1—Interpolation-based super-resolution algorithms, such as bicubic interpolation [9] and nearest-neighbor interpolation [10]. These methods rely on image interpolation techniques, where interpolation functions or kernel methods are used to estimate unknown pixel values from known pixels. Each known data point is used for interpolation, and the values of the interpolated pixels are calculated to minimize image noise [11] and eliminate blurriness through image restoration techniques. 2—Degradation model-based super-resolution algorithms [12,13], such as iterative back-projection, convex-set projection, and maximum a posteriori estimation. These algorithms are based on specific degradation models and involve techniques like image deblurring and reconstruction. 3—Learning-based super-resolution algorithms [14], including manifold learning and sparse coding methods. Modern image super-resolution algorithms often leverage deep learning techniques, given the continuous development of deep learning technology.
Currently, most single-frame image super-resolution reconstruction techniques are researched using deep learning methods and have achieved significant results. There are three common approaches: 1—Early Convolutional Neural Network (CNN)-based Super-Resolution Methods. These methods include shallow CNNs, residual networks, recursive neural networks, and dense convolutions. Examples include SRCNN, ESDR, and SEDenseNet [15]. Early shallow convolutional neural network models typically had a network depth of fewer than five layers, and their network structures were relatively simple. These models did not incorporate an extensive range of network design strategies. However, in comparison to traditional image super-resolution methods, they managed to achieve a noticeable improvement in reconstruction quality. As such, they played a pioneering role in the development of deep learning-based image super-resolution. 2—Prominent and Promising GAN-based Super-Resolution Methods. Notably, the SRGAN (Super-Resolution Generative Adversarial Network) belongs to this category. GAN-based methods have been widely applied and have shown great potential in achieving high-quality super-resolution results. 3—Recent Transformer-based Super-Resolution Methods. Transformer-based methods have gained popularity in low-level computer vision tasks, including super-resolution, with models like IPT [16]. Transformer-based methods have significantly improved image reconstruction quality and generally outperform CNN-based methods. For instance, the IPT network comprises three main components: a head for feature extraction from input degraded images, an encoder-decoder, and a Transformer, all working together to reconstruct the output image. To maximize the potential of Transformers, IPT uses a large dataset of degraded image pairs, constructed from the ImageNet dataset, for model training. However, Transformer-based methods are still in the development phase and primarily focus on enhancing the quality of network reconstruction, with high computational costs, making them less practical efor some real-world applications.
GAN-based methods leverage the adversarial structure of GANs to enhance the realism of network reconstruction, making them a preferred solution in the current state of image super-resolution. They perform well for overall image enhancement when fine details are not the primary concern. However, this method still has some drawbacks [17], including unstable model training, significant parameter fluctuations, slow model convergence, and the presence of artefacts in the generated images. Therefore, when using GAN-based methods, it is crucial to focus on reconstructing image details and employ appropriate strategies to build lightweight networks that ensure stable training.

3. Method

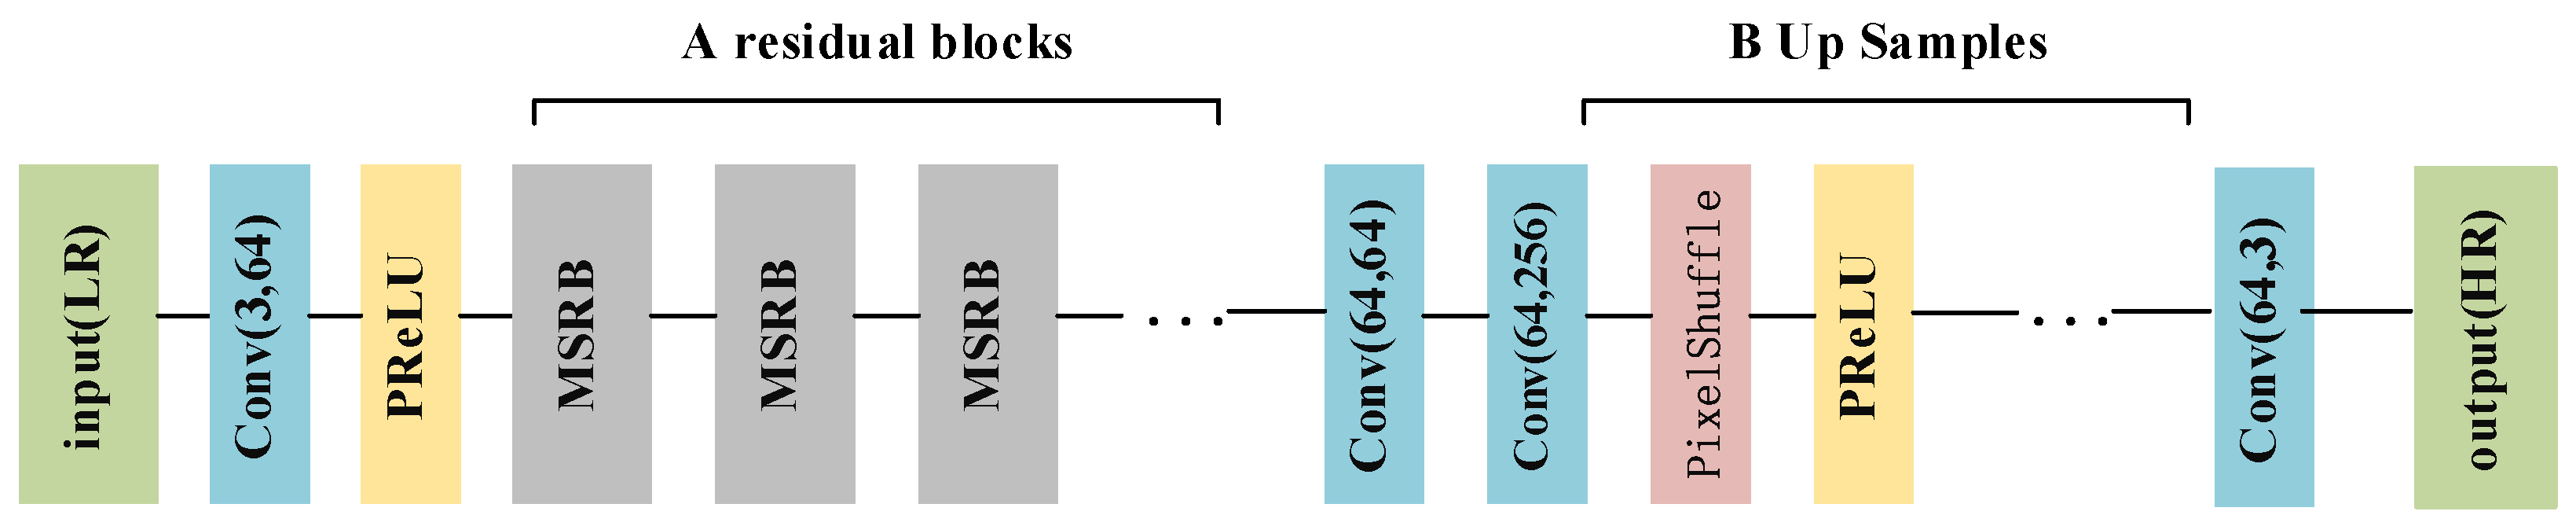
3.1. Method Overview

This paper introduces an image super-resolution model based on Generative Adversarial Networks. For the generator, we incorporate Multi-Scale Residual Blocks (MSRB) as a critical feature extraction component. Further details can be found in Section 3.2. Subsequently, we provide a detailed introduction to the loss functions used by the generator, as described in Section 3.3. Regarding the discriminator, we propose a novel attention mechanism known as GAM Attention, which is integrated into the VGG network. A comprehensive explanation can be found in Section 3.4.1. Additionally, we employ the adaptive activation function, Meta ACONC, as the activation function within the VGG network. Furthermore, we use Ghost convolution to optimize the convolution layers within the network, thereby reducing network parameters and computational complexity. For more in-depth insights, please refer to Section 3.4.2.

3.2. Multi-Scale Residual Block (MSRB)

Removing Batch Normalization (BN) layers has been shown to improve network performance and reduce computational complexity when dealing with PSNR-oriented tasks [18]. BN normalizes input data at different layers of the model during training, but when the statistical characteristics of the training and test datasets differ significantly, it can introduce artefacts that affect the visual quality of SR model-generated images. For very deep networks trained within a GAN framework, removing BN layers can improve robustness, reduce computation, and save memory.
In this paper, it is proposed to apply multi-scale residual block (MSRB) [19] to replace the common residual block commonly used in a feature extraction network to obtain image features of different scales to improve feature extraction capability. Based on residual blocks, we introduced convolution kerbs of different sizes to detect image features of different scales adaptively. Simple series of features of different scales would result in insufficient utilization of local features, so MSRB chose to make these features interact in parallel with each other to obtain the most effective image information. We constructed a double-bypass network, with different convolution kerbs used for different bypasses. In this way, the information between these bypasses can be shared with each other, making it possible to detect image features at different scales. Figure 1 shows the basic architecture of multi-scale residual blocks. The input is the 64 layers feature matrix after convolution, and the convolution kernel of 3 × 3 and 5 × 5 is used to generate feature graphs of different sizes. After the PreLU activation layer, the feature matrix of 128 layers is concat, and the same convolution operation is performed. After the concat is formed into a 256 layers feature matrix, 1 × 1 convolution is used to reduce the dimension, which can improve the feature abstraction ability and improve the expression ability of the network. The output of each MSRB is used in the generator as a hierarchical feature for global feature fusion. Finally, all these features are sent to the up-sampling module to generate a high-quality image, as shown in Figure 2 for the generator using MSRB.
Figure 2 illustrates the generator design that incorporates Multi-Scale Residual Blocks (MSRB). The generator consists of four key components: input, feature extraction, output, and up-sampling. In the input component, low-resolution images are up-sampled from 3 channels to 64 using a 9 × 9 convolution layer. A Parametric Rectified Linear Unit (PreLU) activation function introduces non-linearity. The feature extraction component comprises a MSRB, responsible for feature extraction. In the output component, a 3 × 3 convolution is applied for preprocessing the features without changing the number of channels. This preprocessing enriches feature representation, aiding in the better restoration of high-resolution information. In the up-sampling component, the channel count is initially increased through convolution to facilitate the learning of more features, enhancing feature richness. PixelShuffle is then used for up-sampling, employing a layer-by-layer incremental approach to upscale by a factor of two each time. This incremental approach helps the network gradually learn complex feature representations without introducing very high resolutions immediately, which could make the network more challenging to train due to the handling of larger feature maps within a single layer.

3.3. Generator Loss Function

The definition of the perceptual loss function is crucial for the generator network. Traditional super-resolution networks use pixel-wise loss functions such as Mean Squared Error (MSE) loss. However, images generated using MSE-based loss functions tend to be overly smooth in texture details. GAN-based image super-resolution algorithms typically use perceptual loss, which combines content loss (VGG loss) and adversarial loss (GAN loss). The complete loss function is as follows:
L S R = L M S E S R + λ G e n L G e n S R + λ V g g L V g g S R
The MSE loss, which has been traditionally emphasized, can be expressed as:
L M S E S R = 1 r 2 W H x = 1 r W y = 1 r H [ I x , y H R G θ G ( I L R ) x , y ] 2
where, I L R is the low-resolution image corresponding to the original high-resolution image, W and H are the width and height of the low-resolution image, respectively, r is the subsampling multiple from the original high-resolution image to the low-resolution image, G θ G is the generator network constructed by the parameter θ G , and G θ G ( I L R ) is the reconstructed image.
GEN loss can make the generated high-resolution image as much as possible visually similar to the ground truth value, where the function of the discriminator is the probability distribution to judge whether the image generated by generator is real, and its formula is expressed as Equation (3):
L G E N S R = n = 1 N l o g D θ D [ G θ G I L R ]
VGG loss represents the per-pixel loss between the high-resolution original image and the deep features of the generated image. It is a regularized loss function based on the total variational norm, and this regularized loss tends to preserve the smoothness of the image, and its formula is expressed as Equation (4):
L V G G S R = 1 W i , j H i , j x = 1 W i , j y = 1 H i , j { Φ i , j I H R x , y Φ i , j G θ G I L R x , y } 2
Φ i , j represents the feature graph obtained from the i th maximum pooled layer of the j th layer convolution of the VGG19 network. Ultimately, its essence is the Euclidean distance between the feature of the reconstructed image representing G θ G I L R and the reference image I H R .
The weight λ of GEN loss and VGG loss affects the balance between the deep perception quality of the reconstructed image and the PSNR index. The larger the weight of the two, the more realistic the reconstructed image will be, but the overall distortion will be aggravated. A too-small weight of the two will make the generated image too smooth.

3.4. Discriminator Design

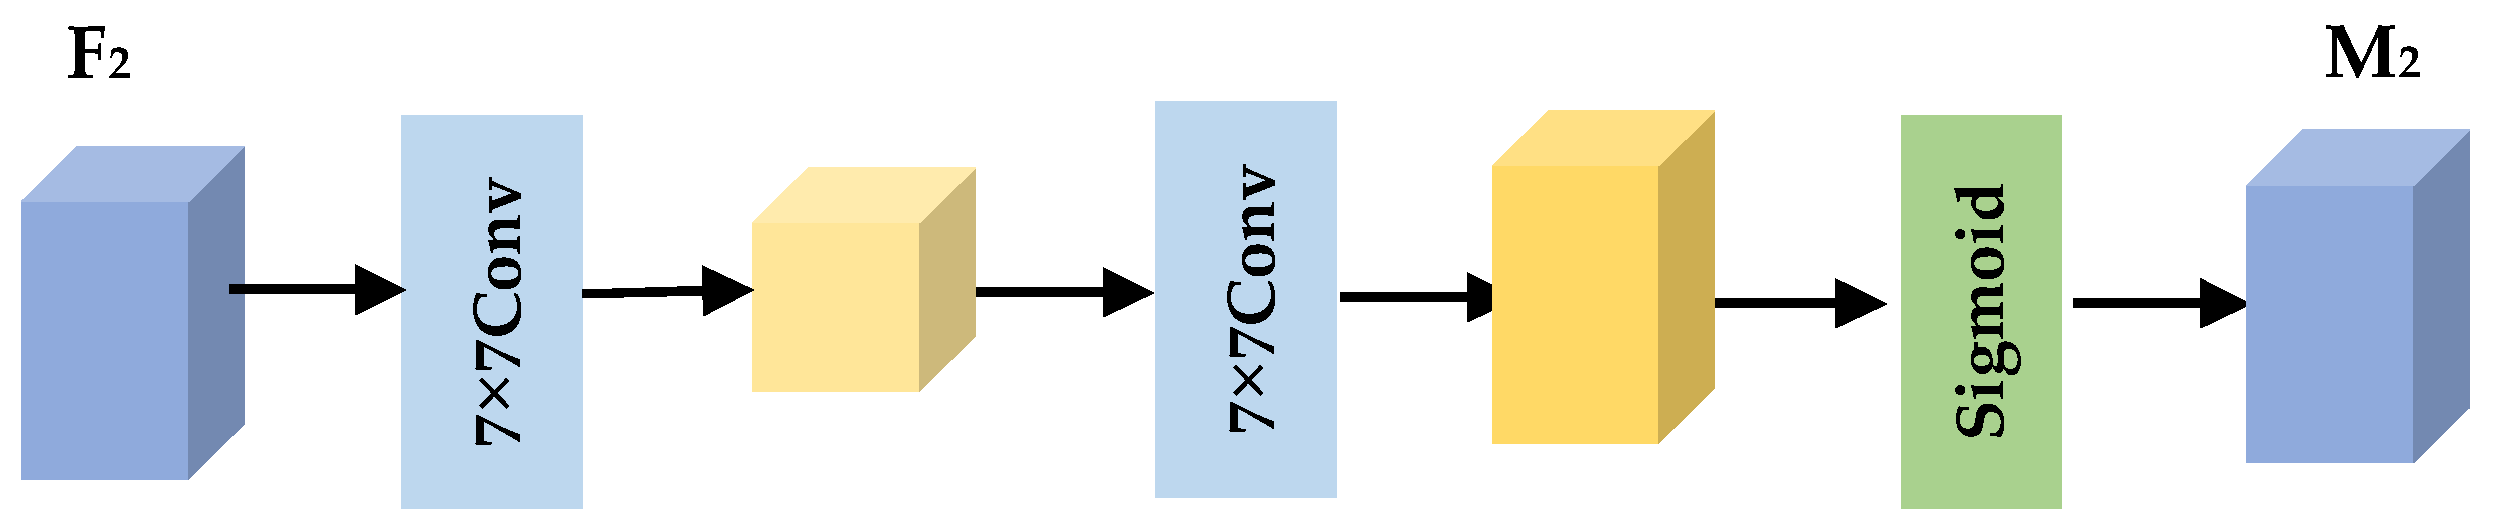
3.4.1. Novel Attention Mechanism (GAM Attention)

Attention mechanisms assign varying weights to different parts of the network input, extracting essential information to assist the model in making accurate judgments. They achieve this without significantly increasing computational or storage costs, which is why attention mechanisms are widely used. Attention mechanisms can generally be categorized into three domains: spatial, channel, and mixed. Commonly used channel domain attention mechanisms include SE-NET (Squeeze-and-Excitation Network) [20], ECA-NET (Efficient Channel Attention Network) [21], while mixed domain attention mechanisms include CBAM (Convolutional Block Attention Module) [22] and DA-Net (Dual Attention Network) [23]. In this paper, we introduce an attention mechanism module based on the VGG 19 architecture, commonly used in the discriminator, to fully exploit feature correlations and overcome the limitation of the original model in global information extraction. Due to the unique nature of the generator network, controlling the number of feature extraction layers can help strike a favorable balance between training speed and the quality of generated results.
We propose a novel attention mechanism called GAM Attention, which enhances neural network performance by reducing information diffusion and amplifying global interactive representations. GAM Attention includes both channel and spatial domain attention, providing more comprehensive and reliable attention information to guide a more reasonable allocation of computational resources. It is added to the discriminator at the end of the VGG network’s convolutional layers, enabling it to obtain more precise feature dependencies in both spatial and channel domains. Its structure is illustrated in Figure 3.
The channel attention module takes the feature matrix F1 obtained after VGG convolution as its input feature map, where the input feature map size is set to C × W × H, with H and W representing the input feature’s height and width, and C representing the number of channels. It undergoes a dimension transformation (C × W × H to W × H × C) and then feeds the dimension-transformed feature map into a two-layer Multi-Layer Perceptron (MLP) to amplify cross-dimensional channel-space dependencies. After processing, it is transformed back to dimension C × H × W and subjected to sigmoid processing to obtain the attention weight feature map M1, which is then multiplied with the input feature map to obtain the new feature map F2. The channel attention structure is depicted in Figure 4.
The spatial attention module takes the feature map F2 obtained from the channel attention module as its input feature map. It reduces its channel count to C/r (where r is set to 4) using a 7 × 7 convolution to reduce computational load. It then increases the channel count again using another 7 × 7 convolution to match the original channel count. Finally, it employs sigmoid processing to obtain the attention-weight feature map M2. After obtaining the weights, they are multiplied with the output feature layer F2 from the channel attention module to obtain the final dependency-enhanced feature matrix F3. The spatial attention structure is shown in Figure 5.

3.4.2. Network Performance and Training Enhancement

Activation functions in neural networks serve to introduce non-linearity and combine features effectively, thereby enhancing the model’s representational power. Traditional activation functions assume the same activation form for all neurons, limiting feature expressiveness. To address this limitation, we introduce the Meta ACONC (Adaptive Activation Function) to design different activation forms for each neuron, allowing each neuron to learn whether to activate or not, thereby enhancing the network’s feature representation capability. In this paper, we replace the PreLU and Leaky ReLU activation functions in the VGG network with the Meta ACONC activation function.
The ReLU activation function has been commonly used due to its excellent properties such as non-saturation and sparsity for a long time. However, it can lead to neuron death to some extent. Inspired by the Swish activation function obtained through NAS (Neural Architecture Search) [24], we propose a new activation function called the ACON (ACtivation functiON) series by exploring the smooth approximation principle between Swish and ReLU. Since ReLU is a special form of Maxout [25], we use the Maxout family of activation functions to derive a new type of activation function. The basic principle is as follows:
Our commonly used ReLU activation function is essentially a MAX function, and a smooth differentiable variant of the MAX function is called the Smooth Maximum. Its formula is shown in Equation (5):
S β x 1 , , x n = i = 1 n x i e β x i i = 1 n e β x i
where β represents the coupling coefficient. When β , S β m a x , and the Smooth Maximum becomes the standard MAX function, which is non-linear (activating). When β 0 , S β m e a n , making the Smooth Maximum an arithmetic average operation, which is linear (non-activating). When n = 2 , the maximum function is m a x ( η a ( x ) , η b ( x ) ) , and it can be expressed as a function in Sigmoid as follows:
S β η a x , η b x = η a x η b x × σ β η a x η b x + η b ( x )
When η a x = x, η b = 0 we obtain the Swish function as a smooth approximation of ReLU. By selecting different values for η a x , η b x , we define different ACON activation functions, as shown in Table 1:
Subsequently, based on the ACONC activation function, we learn to activate (non-linear) or not activate (linear) by simply maintaining the switching factor β. This led to Meta ACONC, which explicitly optimizes the factor and demonstrates significant improvements. The design space of the adaptive function includes layer-wise, channel-wise, and pixel-wise spaces. Here, we choose the channel-wise space, where we first calculate the means separately for the H and W dimensions and then use two convolution layers to ensure that every channel shares a weight for all pixels. The formula is shown in Equation (7):
β C = σ W 1 W 2 h = 1 H w = 1 W x c , h , w
To maintain a balance between the generator and the discriminator and avoid increasing the model complexity of the generator G, which is crucial for practical applications where the prediction process is the most commonly used scenario, we conducted an analysis of the generator G structure. As a result, we did not incorporate attention mechanisms into the generator G, nor did we alter the activation functions within the generator.
Due to the VGG19 network’s high frequency of convolutions with fixed parameters such as kernel size, stride, padding, etc., we applied optimization using Ghost convolutions [26] to replace the original convolutional layers in the VGG19 network. This approach effectively reduces the number of parameters and computational costs while ensuring that the model’s overall stability and results are minimally impacted. Figure 6 illustrates the working principle of Ghost convolutions.
Ghost convolution operates in three steps:
Initially, it convolves the input feature map. However, unlike regular convolutions with an output channel size of N, Ghost convolution first obtains a preliminary feature map with an output channel size of N/2. Next, it individually convolves each channel of the N/2 feature map in groups of size N/2. Finally, it concatenates the results of the grouped convolutions with the N/2 feature map.
Ghost convolution achieves the reduction in computational load by employing fewer convolutional operations during the process. Specifically, it reduces the number of convolutional kernels involved by half, effectively halving the computational workload.
Figure 7 shows the improved discriminator model in this paper. The model is designed in a concatenated manner, with Ghost convolution layers and Meta ACONC activation functions appearing alternately. As the depth of the convolution layers gradually increases, hierarchical feature extraction is achieved, and an attention mechanism is applied at the end to fully explore feature relevance.

3.5. Evaluation Metrics

Three super-resolution image quality evaluation metrics were used in this study: Peak Signal-to-Noise Ratio (PSNR) [27], Structural Similarity Index (SSIM) [28], and Learned Perceptual Image Patch Similarity (LPIPS) [29].
PSNR objectively evaluates the level of distortion in the reconstructed image by calculating the error between the generated image (I_SR) and the original high-resolution image (I_HR). PSNR primarily depends on Mean Squared Error (MSE) and is expressed as follows Equation (8):
P S N R = 10 × l o g 10 M A X 2 M S E
where MAX represents the maximum pixel value in the I_HR (i, j) image. SSIM measures the structural similarity between the reference image (I_HR) and the generated image (I_SR) in terms of brightness, contrast, and structure. These three aspects are independent and do not affect each other. SSIM is typically expressed as follows, in Equation (9):
S S I M = [ l ( I H R , I S R ) ] α [ c ( I H R , I S R ) ] β [ s ( I H R , I S R ) ] γ
where α, β, and γ are weighting parameters used to adjust the importance of brightness, contrast, and structure, with commonly used values being α = β = γ = 1.
S S I M = ( 2 μ I H R μ I S R + C 1 ) ( 2 σ I H R I S R + C 2 ) ( μ I H R 2 + μ I S R 2 + C 1 ) ( σ I H R 2 + σ I S R 2 + C 2 )
Among them, the μ I H R , μ I S R , respectively said I H R , I S R average, σ I H R , σ I S R , respectively said I H R , I S R standard deviation, σ I H R I S R said I H R , I S R covariance, C 1 and C 2 are constants added to avoid instability in the calculation.
LPIPS is a perceptual metric based on human perception and is thus well-suited to reflect subjective image quality. Smaller LPIPS values indicate better perceived image quality. The metric uses a pre-trained deep convolutional neural network to extract features from reference and distorted images, calculates the L2 distance in the deep feature space, and assesses perceptual similarity. The expression for LPIPS is shown as follows Equation (11):
L P I P S = d I H R , I S R = l 1 H l W l h , w w l ( y I H R h w l y I S R h w l ) 2 2
where l represents the l layer of the convolutional neural network, and y I H R l , y I S R l represent the features extracted from I H R , I S R normalized along the channel dimension.

4. Experimental Comparison and Analysis

4.1. Experimental Environment and Training Data

This experiment was conducted on a Linux server equipped with an NVIDIA 2080 Ti GPU with 11 GB of VRAM, 16 GB of RAM, and the following software stack: PyTorch 1.8, Python 3.8.5, CUDA 11.0, and cuDNN 8.0.4. The training data consisted of two parts: the publicly available DIV2K dataset [30] and the LoveDA dataset of single-frame remote sensing images in hilly terrain [31]. The DIV2K dataset contains 900 high-definition images (2K resolution), with 800 images used for training and 100 for testing. The LoveDA dataset, created by the RSIDEA team at Wuhan University, comprises a significant collection of single-frame remote sensing images. This dataset is constructed from 0.3-m imagery sourced from Google Earth, captured in July 2016, covering a total geographical area of 536.15 square kilometers in the regions of Nanjing, Changzhou, and Wuhan. All images are selected from undeveloped hilly areas and include abundant wild vegetation, water bodies, and sporadic buildings. After undergoing geometric registration and preprocessing, each region is covered by non-overlapping 1024 × 1024 images, as illustrated in Figure 8. For this study, 1000 single-frame remote sensing images were selected from LoveDA and used as a dataset for training the forest single-frame remote sensing images. Another 100 images were chosen as a test set.

4.2. Training Process

In the training process, the adaptive moment estimation (Adam) optimizer [32] was chosen. The number of residual blocks in the generator G was set to N = 16, λ G e n = 0.001 ,   λ V g g = 0.000002 , and a 4× upscaling factor was used. The batch size for training was set to 4, and the initial learning rate for both the generator and discriminator was set to 0.0002. The maximum number of training epochs was set to 100. During training, the low-resolution images required for training were obtained by applying a series of operations to the original high-resolution images, including scaling, distortion, flipping, and adding gray bars, all resulting in a unified size of 96 × 96.
The training process was divided into two parts. The first part involved training the discriminator. First, the original high-resolution image I H R was fed into the discriminator to obtain an adversarial loss based on I H R ’s authenticity. Then, the generated high-resolution image I S R was input to the discriminator to obtain a second adversarial loss. Both losses were optimized using Adam gradient descent. The second part focused on training the generator G. The generator aimed to produce a high-resolution image I S R . The loss consisted of the mean squared error (MSE) loss between I S R and I H R , an adversarial loss between I S R and the ground truth, and a content loss between I S R and I H R . These losses were summed, and the sum was optimized using Adam gradient descent.

4.3. Comparative Experiments

In this section, we conduct comparative experiments between our model and established models, namely VDSR, EDSR, SRGAN, and Real-ESRGAN. We use the DIV2K and LoveDA training datasets to train our model for 4× super-resolution, and the corresponding weights are obtained. Subsequently, we downscale the resolution of 100 test images from each dataset by a factor of four and evaluate the performance of each model in predicting the super-resolved images. We then combine the predicted results with the original test dataset to obtain the three evaluation metrics required in this study. The average evaluation metrics from this experiment are presented in Table 2. The experiments demonstrate that, in terms of evaluation metrics, the model proposed in this paper outperforms SRGAN with an increase in PSNR values of 0.709/2.213 dB, an improvement in SSIM of 0.032/0.142, and a decrease in LPIPS of 0.03/0.013. These results are on par with those achieved by Real-ESRGAN.
Additionally, we have collected FPS (Frames Per Second) data for each model. We conducted experiments in which 100 test images from both datasets were processed by each model in a loop to generate 4× super-resolved images. The data were measured after the models stabilized. It is worth noting that this data may vary depending on the experimental environment. The data are presented in Table 3. The results from both sets of experiments demonstrate that the model we propose achieves results in single-frame forest remote sensing images that are comparable to state-of-the-art methods while maintaining efficiency.
Selecting one image from the test dataset and enlarging it for comparison, the image reconstruction results of our proposed algorithm and the comparative algorithms are shown in Figure 9. Through the comparative experiments and relevant metrics, it is evident from the image results that VDSR and EDSR reconstructions lack many fine details, resulting in overly blurry and unrealistic images. SRGAN enhances the realism of the images but exhibits noticeable distortion. Based on LPIPS values and visual perception, it can be concluded that our proposed algorithm generates images that are more in line with human perception, making single-frame remote sensing image reconstructions closer to real high-resolution images in terms of perception and content. Although slightly lower in some parameters compared to Real-ESRGAN, our algorithm provides higher FPS and a more stable training process. In some scenarios, Real-ESRGAN can exhibit distorted lines and excessive alterations compared to the original image, possibly due to aliasing issues. The super-resolution processing makes the separation between different trees more apparent, allowing observers to easily distinguish each tree, thus facilitating the identification of tree species and distribution. Tree crown shapes are clearly distinguishable, and one can clearly see the size and shape of each tree’s canopy, which aids in the study and monitoring of forest ecosystems. Analyzing the evaluation metrics, it is evident that our algorithm optimizes PSNR, SSIM, and LPIPS differently based on the training dataset used. Additional dataset test results are depicted in Figure 10.

4.4. Ablation Experiments

To thoroughly evaluate the performance enhancement brought by our proposed attention mechanism, GAM Attention, we conducted experiments by incorporating this attention mechanism into algorithms like VDSR, EDSR, and SRGAN, which do not inherently possess attention mechanisms. We trained these modified models for 4× super-resolution using the DIV2K and LoveDA training datasets to obtain their respective weights. We then downscaled the resolution of 100 test images from each dataset by a factor of four and evaluated the performance of each model in predicting the super-resolved images. We combined the predicted results with the original test dataset to obtain the three evaluation metrics required in this study. The average evaluation metrics are presented in Table 4. The results before adding the attention mechanism can be referred to in Table 2.
To validate the consistently positive effects brought by the attention mechanism and activation functions, ablation experiments were conducted. The experiments involved gradually adding three components, namely Basic G, GAM, and Meta ACONC, to the generator based on the MSRB backbone network and the conventional VGG network for the discriminator. These experiments were conducted by training the models for 4× super-resolution using the DIV2K and LoveDA training datasets to obtain their respective weights. The resolution of 100 test images from each dataset was downscaled by a factor of four, and the performance of each model in predicting super-resolved images was evaluated. The predicted results were then combined with the original test dataset to obtain the three evaluation metrics required for this study. The average evaluation metrics are presented in Table 5.
The results from the ablation experiments show that with the continuous addition of improvement methods, all evaluation metrics on both datasets exhibit ongoing optimization, indicating a significant improvement in reconstruction. Selecting one image from the test dataset and enlarging it for comparison, the image reconstruction results of our improved algorithm and the original algorithm are shown in Figure 11. It can be observed that as the algorithm components are progressively added, the generated images exhibit clearer texture details, smoother transitions, and a substantial increase in realism.

5. Conclusions

This paper addresses the restoration of single-frame forest remote sensing images and introduces a novel image super-resolution model based on Generative Adversarial Networks (GANs). By avoiding the use of Batch Normalization layers (BN), improving residual blocks, enhancing activation functions, and incorporating attention mechanisms, this model reduces the computational load of convolutional layers. It effectively mitigates issues related to image distortion and texture details. Moreover, the generated images closely align with human perception and exhibit content that is more similar to real high-resolution images.
When tested on high-resolution DIV2K and single-frame forest remote sensing images from the LOVEDA dataset, the model proposed in this paper outperforms some mainstream models in terms of image perceptual quality, exhibiting higher realism. The model’s performance metrics are on par with Real-ESRGAN, but it offers significantly improved speed. Enhancing forest remote sensing image super-resolution is pivotal for improving the efficiency and sustainability of forest resource management. This approach provides more information and data, facilitating better protection and management of our forest resources. Our future endeavors will focus on enhancing model training and testing efficiency while ensuring reconstruction quality.

Author Contributions

Methodology, S.Z.; Resources, Y.Z. and J.H.; Data curation, J.H.; Writing—original draft, S.Z.; Writing—review and editing, Y.Z.; Supervision, Y.Z. All authors have read and agreed to the published version of the manuscript.

Funding

This research received no external funding.

Data Availability Statement

Data sharing not applicable.

Acknowledgments

The authors thank reviewers for suggestions.

Conflicts of Interest

The authors declare no conflict of interest.

References

  1. Dong, C.; Loy, C.C.; He, K.M.; Tang, X.O. Image super-resolution using deep convolutional networks. IEEE Trans. Pattern Anal. Mach. Intell. 2016, 38, 295–307. [Google Scholar] [CrossRef] [PubMed]
  2. Dong, C.; Loy, C.C.; Tang, X.O. Accelerating the superresolution convolutional neural network. In Computer Vision ECCV 2016; Springer: Amsterdam, The Netherlands, 2016; pp. 391–407. [Google Scholar]
  3. Kim, J.; Lee, J.K.; Lee, K.M. Accurate image super-resolution using very deep convolutional networks. In Proceedings of the 2016 IEEE Conference on Computer Vision and Pattern Recognition, Las Vegas, NV, USA, 27–30 June 2016; pp. 1646–1654. [Google Scholar]
  4. Zhang, Y.; Li, K.; Li, K.; Wang, L.C.; Zhong, B.N.; Fu, Y. Image super-resolution using very deep residual channel attention networks. In Computer Vision—ECCV 2018; Springer: Heidelberg, Germany, 2018; pp. 286–301. [Google Scholar]
  5. Lim, B.; Son, S.; Kim, H.; Nah, S.; Lee, K.M. Enhanced deep residual networks for single image super-resolution. In Proceedings of the 2017 IEEE Conference on Computer Vision and Pattern Recognition Workshops, Honolulu, HI, USA, 21–26 July 2017; pp. 1132–1140. [Google Scholar]
  6. Creswell, A.; White, T.; Dumoulin, V.; Arulkumaran, K.; Sengupta, B.; Bharath, A.A. Generative adversarial networks, an overview. IEEE Signal Process. Mag. 2018, 35, 53–65. [Google Scholar] [CrossRef]
  7. Ledig, C.; Theis, L.; Huszár, F.; Caballero, J.; Cunninghan, A.; Acosta, A.; Aitken, A.; Tejani, A.; Totz, J.; Wang, Z.; et al. Photo-realistic single image super-resolution using a generative adversarial network. In Proceedings of the 2017 IEEE Conference on Computer Vision and Pattern Recognition, Honolulu, HI, USA, 21–26 July 2017; pp. 105–114. [Google Scholar]
  8. Ratliff, L.J.; Burden, S.A.; Sastry, S.S. Characterization and computation of local Nash equilibria in continuous games. In Proceedings of the 2013 51st Annual Allerton Conference on Communication, Control, and Computing (Allerton), Monticello, IL, USA, 2–4 October 2013; pp. 917–924. [Google Scholar]
  9. Keys, R. Cubic convolution interpolation for digital image processing. IEEE Trans. Acoust. Speech Signal Process. 1981, 29, 1153–1160. [Google Scholar] [CrossRef]
  10. Prashanth, H.S.; Shashidhara, H.L.; Murthy, K.N.B. Image scaling comparison using universal image quality index. In Proceedings of the 2009 International Conference on Advances in Computing, Control, and Telecommunication Technologies, Bangalore, India, 28–29 December 2009; pp. 859–863. [Google Scholar]
  11. Shah, Z.H.; Müller, M.; Wang, T.C.; Scheidig, P.M.; Schneider, A.; Schüttpelz, M.; Huser, T.; Schenck, W. Deep-learning based denoising and reconstruction of super-resolution structured illumination microscopy images. Photonics Res. 2021, 9, B168–B181. [Google Scholar] [CrossRef]
  12. Dai, S.; Han, M.; Wu, Y.; Gong, Y. Bilateral back-projection for single image super resolution. In Proceedings of the 2007 IEEE International Conference on Multimedia and Expo, Beijing, China, 2–5 July 2007; pp. 1039–1042. [Google Scholar]
  13. Zhang, H.; Zhang, Y.; Li, H.; Huang, T.S. Generative Bayesian image super resolution with natural image prior. IEEE Trans. Image Process. 2012, 21, 4054–4067. [Google Scholar] [CrossRef] [PubMed]
  14. Chang, H.; Yeung, D.Y.; Xiong, Y. Super-resolution through neighbor embedding. In Proceedings of the 2004 IEEE Computer Society Conference on Computer Vision and Pattern Recognition, Washington, DC, USA, 27 June–2 July 2004; Volume 1, pp. I-275–I-282. [Google Scholar]
  15. Huang, G.; Liu, Z.; Maaten, L.V.D.; Weinberger, K.Q. Densely connected convolutional networks. In Proceedings of the 2017 IEEE Conference on Computer Vision and Pattern Recognition (CVPR), Honolulu, HI, USA, 21–26 July 2017; pp. 2261–2269. [Google Scholar]
  16. Chen, H.; Wang, Y.; Guo, T.; Xu, C.; Deng, Y.; Liu, Z.; Ma, S.; Xu, C.; Xu, C.; Gao, W. Pre-trained image processing transformer. In Proceedings of the 2021 IEEE/CVF Conference on Computer Vision and Pattern Recognition (CVPR), Nashville, TN, USA, 19–25 June 2021; pp. 12294–12305. [Google Scholar]
  17. Arjovsky, M.; Bottou, L. Towards principled methods for training generative adversarial networks. arXiv 2017, arXiv:1701.04862. [Google Scholar]
  18. Wang, X.; Yu, K.; Wu, S.; Gu, J.; Liu, Y.; Dong, C.; Qiao, Y.; Loy, C.C. Esrgan, enhanced super-resolution generative adversarial networks. In Computer Vision–ECCV 2018 Workshops; Springer: Munich, Germany, 2018; pp. 63–79. [Google Scholar]
  19. Li, J.; Fang, F.; Mei, K.; Zhang, G. Multi-scale Residual Network for Image Super-Resolution. In Proceedings of the European Conference on Computer Vision (ECCV), Munich, Germany, 8–14 September 2018; pp. 517–532. [Google Scholar]
  20. Hu, J.; Shen, L.; Albanie, S.; Sun, G.; Wu, E. Squeeze-and-Excitation Networks. arXiv 2017, arXiv:1709.01507v4. [Google Scholar]
  21. Wang, Q.; Wu, B.; Zhu, P.; Li, P.; Zuo, W.; Hu, Q. ECA-Net, efficient channel attention for deep convolutional neural networks. In Proceedings of the IEEE/CVF Conference on Computer Vision and Pattern Recognition (CVPR), Seattle, WA, USA, 14–19 June 2020; pp. 11531–11539. [Google Scholar]
  22. Woo, S.; Park, J.; Lee, J.Y.; Kweon, I.S. CBAM, convolutional block attention module. arXiv 2018, arXiv:1807.06521v2. [Google Scholar]
  23. Fu, J.; Liu, J.; Tian, H.; Li, Y.; Bao, Y.; Fang, Z.; Lu, H. Dual Attention Network for Scene Segmentation. arXiv 2019, arXiv:1809.02983v4. [Google Scholar]
  24. Zoph, B.; Le, Q.V. Neural Architecture Search with Reinforcement Learning. arXiv 2017, arXiv:1611.01578v2. [Google Scholar]
  25. Goodfellow, I.J.; Warde-Farley, D.; Mirza, M.; Courville, A.; Bengio, Y. Maxout Networks. arXiv 2013, arXiv:1302.4389v4. [Google Scholar]
  26. Han, K.; Wang, Y.; Tian, Q.; Guo, J.; Xu, C.; Xu, C. Ghostnet, More features from cheap operations. In Proceedings of the IEEE/CVF Conference on Computer Vision and Pattern Recognition, Seattle, WA, USA, 14–19 June 2020; pp. 1580–1589. [Google Scholar]
  27. Huynh-Thu, Q.; Ghanbari, M. Scope of validity of PSNR in image/video quality assessment. Electron. Lett. 2008, 44, 800–801. [Google Scholar] [CrossRef]
  28. Wang, Z.; Bovik, A.C.; Sheikh, H.R.; Simoncelli, E.P. Image quality assessment, from error visibility to structural similarity. IEEE Trans. Image Process. 2004, 13, 600–612. [Google Scholar] [CrossRef] [PubMed]
  29. Zhang, R.; Isola, P.; Efros, A.A.; Shechtman, E.; Wang, O. The unreasonable effectiveness of deep features as a perceptual metric. In Proceedings of the IEEE Conference on Computer Vision and Pattern Recognition, Salt Lake City, UT, USA, 18–22 June 2018; pp. 586–595. [Google Scholar]
  30. Agustsson, E.; Timofte, R. NTIRE 2017 challenge on single image super-resolution, dataset and study. In Proceedings of the 2017 IEEE Conference on Computer Vision and Pattern Recognition Workshops, Honolulu, HI, USA, 21–26 July 2017; pp. 1122–1131. [Google Scholar]
  31. Wang, J.; Zheng, Z.; Ma, A.; Lu, X.; Zhong, Y. LoveDA: A remote-sensing land-cover dataset for domain adaptive semantic segmentation. arXiv 2021, arXiv:2110.08733. [Google Scholar]
  32. Kingma, D.P.; Ba, J. Adam: A Method for Stochastic Optimization. arXiv 2017, arXiv:1412.6980v9. [Google Scholar]
Figure 1. Basic structure of the Multi-Scale Residual Block (MSRB). In this diagram, “Conv” represents the convolution operation, and “PreLU” indicates the utilization of the Parametric Rectified Linear Unit (PreLU) activation function. The overall structure of the MSRB employs a dual-branch network, with different branches using distinct convolution kernels.
Forests 14 02188 g001
Figure 2. Basic structure of generator. At the input end, low-resolution images are fed in, and “Conv(3,64)” denotes the use of convolution for dimensionality expansion. The Parametric Rectified Linear Unit (PreLU) activation function is employed to introduce non-linearity. Subsequently, the input undergoes feature extraction through a Multi-Scale Residual Block (MSRB). After passing through the output layer, the image proceeds through B up-sampling modules, where the number of B modules is determined by the upscaling factor. Finally, convolution is used to reduce the number of channels to three for output.
Forests 14 02188 g002
Figure 3. GAM Attention mechanism, where “Channel” represents the channel attention module, and “Spatial” represents the spatial attention module. These two components are interconnected in a concatenated manner.
Forests 14 02188 g003
Figure 4. Channel Attention Mechanism. Initially, channel number conversion is applied to the input feature map. This is followed by multiple perceptron layers to amplify dependencies, and ultimately, attention-weighted feature selection is achieved through the sigmoid function.
Forests 14 02188 g004
Figure 5. Spatial Attention Mechanism. This mechanism involves altering the channel count of the input feature map using a 7 × 7 convolution kernel and obtaining attention weights through the sigmoid activation function.
Forests 14 02188 g005
Figure 6. Principle of Ghost Convolution, achieving a reduction in the number of convolution kernels by continually grouping for convolution.
Forests 14 02188 g006
Figure 7. Discriminator model, where Ghost convolution layers and the Meta ACONC activation function alternate. At the end, attention is applied, and the true or false judgment results are obtained through pooling and channel reduction.
Forests 14 02188 g007
Figure 8. Images related to wild trees from the LoveDA dataset.
Forests 14 02188 g008
Figure 9. A comparison of the effects of four models, VDSR, EDSR, SRGAN, and Real-ESRGAN, on ×4 image super-resolution in comparison to the original and low-resolution images. The top portion of the images is sourced from the DIV2K dataset, while the lower portion is from the LoveDA dataset.
Forests 14 02188 g009
Figure 10. Additional prediction results from the LoveDA test set using the model designed in this paper.
Forests 14 02188 g010aForests 14 02188 g010b
Figure 11. The image results generated by the generator in the above-mentioned ablation experiments. The top portion of the images is sourced from the DIV2K dataset, while the lower portion is from the LoveDA dataset.
Forests 14 02188 g011
Table 1. Various scenarios for the ACON (Adaptive Contextual Normalization) activation function.
M a x o u t   F a m i l y A C O N   F a m i l y
η a x η b x m a x ( η a ( x ) , η b ( x ) ) S β η a x , η b x
x 0 max x , 0 : R e L U A C O N A S w i s h :
x σ ( β x )
x p x max x , p x : P R e L U A C O N B :
1 p x · σ β 1 p x + p x
p 1 x p 2 x max p 1 x , p 2 x A C O N C :
p 1 p 2 x · σ β p 1 p 2 x + p 2 x
Table 2. Comparative experimental results of image metrics for the VDSR, EDSR, SRGAN, and Real-ESRGAN models at 4× image super-resolution.
DatasetAlgorithmVDSREDSRSRGANReal-ESRGANOurs
DIV2KPSNR/dB24.84325.14127.35328.37428.062
SSIM0.5420.5970.7570.8030.789
LPIPS0.5190.4920.3430.3150.313
LOVEDAPSNR/dB21.34921.94723.68525.90725.898
SSIM0.3510.3830.5220.6730.664
LPIPS0.5930.5600.4070.3990.394
Table 3. Test results for the average frames per second (FPS) of the four models VDSR, EDSR, SRGAN, and Real-ESRGAN.
DatasetVDSREDSRSRGANReal-ESRGANOurs
DIV2K118.4111.198122.744
LOVEDA130.6112190.4331.450.4
Table 4. Results of ablation experiments on the addition of the GAM Attention mechanism to the VDSR, EDSR, and SRGAN models. The results before the addition can be referred to in Table 2.
DatasetAlgorithmVDSR + GAMEDSR + GAMSRGAN + GAM
DIV2KPSNR/dB24.95525.26827.361
SSIM0.5600.6110.764
LPIPS0.5080.4800.334
LOVEDAPSNR/dB21.22622.10123.775
SSIM0.3390.3920.513
LPIPS0.5830.5530.394
Table 5. Test results for the generator obtained through ablation training on the basic discriminator. “BasicD” represents the basic discriminator using a conventional VGG network.
DatasetAlgorithmBasic DBasic D +
GAM
Basic D + GAM +
Meta ACONC
DIV2KPSNR/dB27.82927.92428.062
SSIM0.7770.7850.789
LPIPS0.3220.3160.313
LOVEDAPSNR/dB25.16925.46725.898
SSIM0.5970.6290.664
LPIPS0.3820.3800.394
Disclaimer/Publisher’s Note: The statements, opinions and data contained in all publications are solely those of the individual author(s) and contributor(s) and not of MDPI and/or the editor(s). MDPI and/or the editor(s) disclaim responsibility for any injury to people or property resulting from any ideas, methods, instructions or products referred to in the content.

