Article

Increased Vegetation Productivity of Altitudinal Vegetation Belts in the Chinese Tianshan Mountains despite Warming and Drying since the Early 21st Century

Key Laboratory of Western China’s Environmental Systems (Ministry of Education), College of Earth and Environmental Sciences, Lanzhou University, Lanzhou 730000, China
*
Author to whom correspondence should be addressed.
Forests 2023, 14(11), 2189; https://doi.org/10.3390/f14112189
Submission received: 10 October 2023 / Revised: 30 October 2023 / Accepted: 1 November 2023 / Published: 3 November 2023
(This article belongs to the Special Issue Forest Plant, Soil, Microorganisms and Their Interactions)

Abstract

:
Gaining a deep understanding of how climate change affects the carbon cycle in dryland vegetation is of utmost importance, as it plays a pivotal role in shaping the overall carbon cycle in global ecosystems. It is currently not clear how plant communities at varying elevations in arid mountainous regions will respond to climate change in terms of their productivity. The aim of this study was to investigate the effect of climate change on vegetation productivity in different altitudinal vegetation belts of the Tianshan Mountains between 2000 and 2021, utilizing satellite-derived vegetation productivity and climate data. The findings suggest a notable increase in vegetation productivity across diverse altitudinal vegetation belts. The productivity of vegetation in the coniferous forest and alpine meadow belts displayed a notably higher interannual trend compared to other vegetation belts. Notably, an increase in vegetation productivity was accompanied by warming and drying. The productivity of altitudinal vegetation belts, however, appears to be resilient to current climate trends and was not significantly impacted by the severity of atmospheric drought. The trend of increased vegetation productivity was primarily driven by CO2 fertilization. Our results highlight that the extent of climate change may need to reach a threshold to noticeably affect variations in vegetation productivity in arid mountainous.

1. Introduction

The investigation of carbon sinks in terrestrial ecosystems holds significant scientific value in the efforts to mitigate global anthropogenic warming. The primary objective of the United Nations Paris Agreement is to limit the increase in global average temperature to below 2.0 °C above preindustrial levels and pursue efforts to limit the increase to 1.5 °C in order to tackle the adverse impacts of climate change [1,2]. Because of the importance of fossil fuel energy use in economic development in some countries, reducing fossil fuel energy use plays a limited role in achieving this core objective [3]. Vegetation and soil carbon pools absorb carbon dioxide from the atmosphere; the amount absorbed annually is equivalent to 20–30% of the carbon dioxide emitted by humans [4]. This indicates the significant contribution of terrestrial ecosystems to the global carbon cycle [5]. Terrestrial ecosystems include vegetation and soil carbon pools [6]. All vegetation communities can fix approximately 120 Pg C from the atmosphere annually, and this carbon exchange is highly sensitive to climate change [7,8]. Gross primary productivity (GPP) and net primary productivity (NPP) are commonly employed metrics for assessing the magnitude and variability of vegetation productivity [9,10]. GPP represents the overall quantity of carbon that vegetation captures from the atmosphere through carbon assimilation, while NPP represents GPP minus the portion consumed by plant respiration, which forms plant biomass [11,12,13]. Quantitative analysis of changes in GPP and NPP in different plant communities can improve the understanding of the feedback of terrestrial ecosystem carbon cycles to current climate change.
There is evident spatial heterogeneity in both the distribution and variability of vegetation productivity. Biotic and abiotic factors have an impact on the spatial distribution of both NPP and GPP [14]. Forests and grasslands have remarkably higher carbon pools than shrubs and wetlands [15]. Globally, GPP and NPP decrease with an increase in soil nutrients [16]. Temperature, water availability, and solar radiation determine the meridional distributions of GPP and NPP [17], and those at low elevations are dependent on the carbon use efficiency; however, GPP and NPP at high elevations are mainly limited by temperature and humidity [18]. In addition to the spatial distribution, changes in vegetation productivity are regulated by several environmental factors. Meta-analyses have shown that warming had a positive effect on GPP in global grasslands and that carbon fluxes increased more in boreal region grasslands than in temperate and subarid grasslands [7,19]. At the regional scale, changes in vegetation productivity of different ecosystems on the Tibetan Plateau are mainly influenced by carbon dioxide (CO2) concentration, temperature, and moisture; however, the main drivers of such changes are controversial [20,21,22,23]. Notably, warming and drying reduce the availability of soil moisture in arid regions, weakening vegetation productivity. Therefore, warming may negatively affect the GPP and NPP in arid regions [24,25,26].
The trend in vegetation productivity demonstrates inconsistent patterns both on a global and regional scale. During the period from 1982 to 2015, there was an increase in GPP across tropical rainforests, with the exception of the Congo rainforest [17]. Among them, the Amazon rainforest displayed a higher magnitude of increase. Additionally, GPP demonstrated an upward trend in North America and eastern China. Conversely, it decreased in the western mountain ranges of the United States, the Australian deserts, and western Central Asia. The variances in global GPP trends can be attributed to changes in temperature and humidity, which serve as the primary influencing factors. There has also been attention devoted to studying changes in montane vegetation productivity. From 1982 to 2019, the NPP of mountain vegetation in Yunnan Province, China, exhibited an overall increasing trend [27]. Among them, mountain forests demonstrated higher rates of increase. However, during the period from 2000 to 2012, the NPP in the Qilian Mountains, situated in the arid zone of China, experienced a decreasing trend primarily due to atmospheric drought [28]. On the Tibetan Plateau, the NPP of desert grassland and alpine grassland displayed an upward trend between 2001 and 2017, while deciduous broad-leaved forests experienced a decrease [29]. Additionally, severe drought in the years 2000 to 2010 led to reduced NPP in fir forests in the mountains of southern China [30].
Given their status as critical global biodiversity hotspots, mountain vegetation in arid zones is highly responsive to climate change [31,32]. Similarly, arid regions are sensitive and vulnerable to global change, and warming leads to remarkable changes in vegetation productivity [33]. Studying and identifying the changes and factors influencing vegetation productivity in arid mountainous areas can enhance our understanding of the crucial role that vegetation plays in the global carbon cycle within arid regions. The Tianshan Mountains, situated within the arid region of Central Asia, not only provide important ecosystem services for the surrounding plains but also serve as important carbon pools [34]. Relatively few studies have been conducted on vegetation productivity in the Tianshan Mountains, and several research findings indicate that changes in vegetation productivity in this area are closely related to air temperature, precipitation, and CO2 fertilization [35,36]. Significantly, since the 1980s, the Tianshan Mountains have exhibited trends of warming and increased precipitation, and the wetting trend has an obvious elevation dependence [37]. Additionally, relatively complete altitudinal vegetation belts have developed in the Tianshan Mountains [38]. Nevertheless, there is currently a lack of comprehensive research on how climate change affects the productivity of various vegetation belts in the Tianshan Mountains.
To fill this knowledge gap, we used remote sensing data of ecosystem productivity (GPP and NPP) to investigate changes in productivity at different vegetation belts in the Tianshan Mountains over the 21st century and attempted to analyze the potential drivers of this trend. Based on these analyses, we aimed to determine (1) whether there is a consistent response to climate change among the productivity of different vegetation belts at different elevations and (2) whether warming and increased precipitation or warming and decreased precipitation are the primary factors responsible for the interannual variation in primary productivity among different vegetation belts at various altitudes in the Tianshan Mountains. In summary, our study offers novel insights into how mountain vegetation in arid regions responds to climate change and contributes to a deeper understanding of the role of arid mountain regions in the global vegetation carbon cycle.

2. Materials and Methods
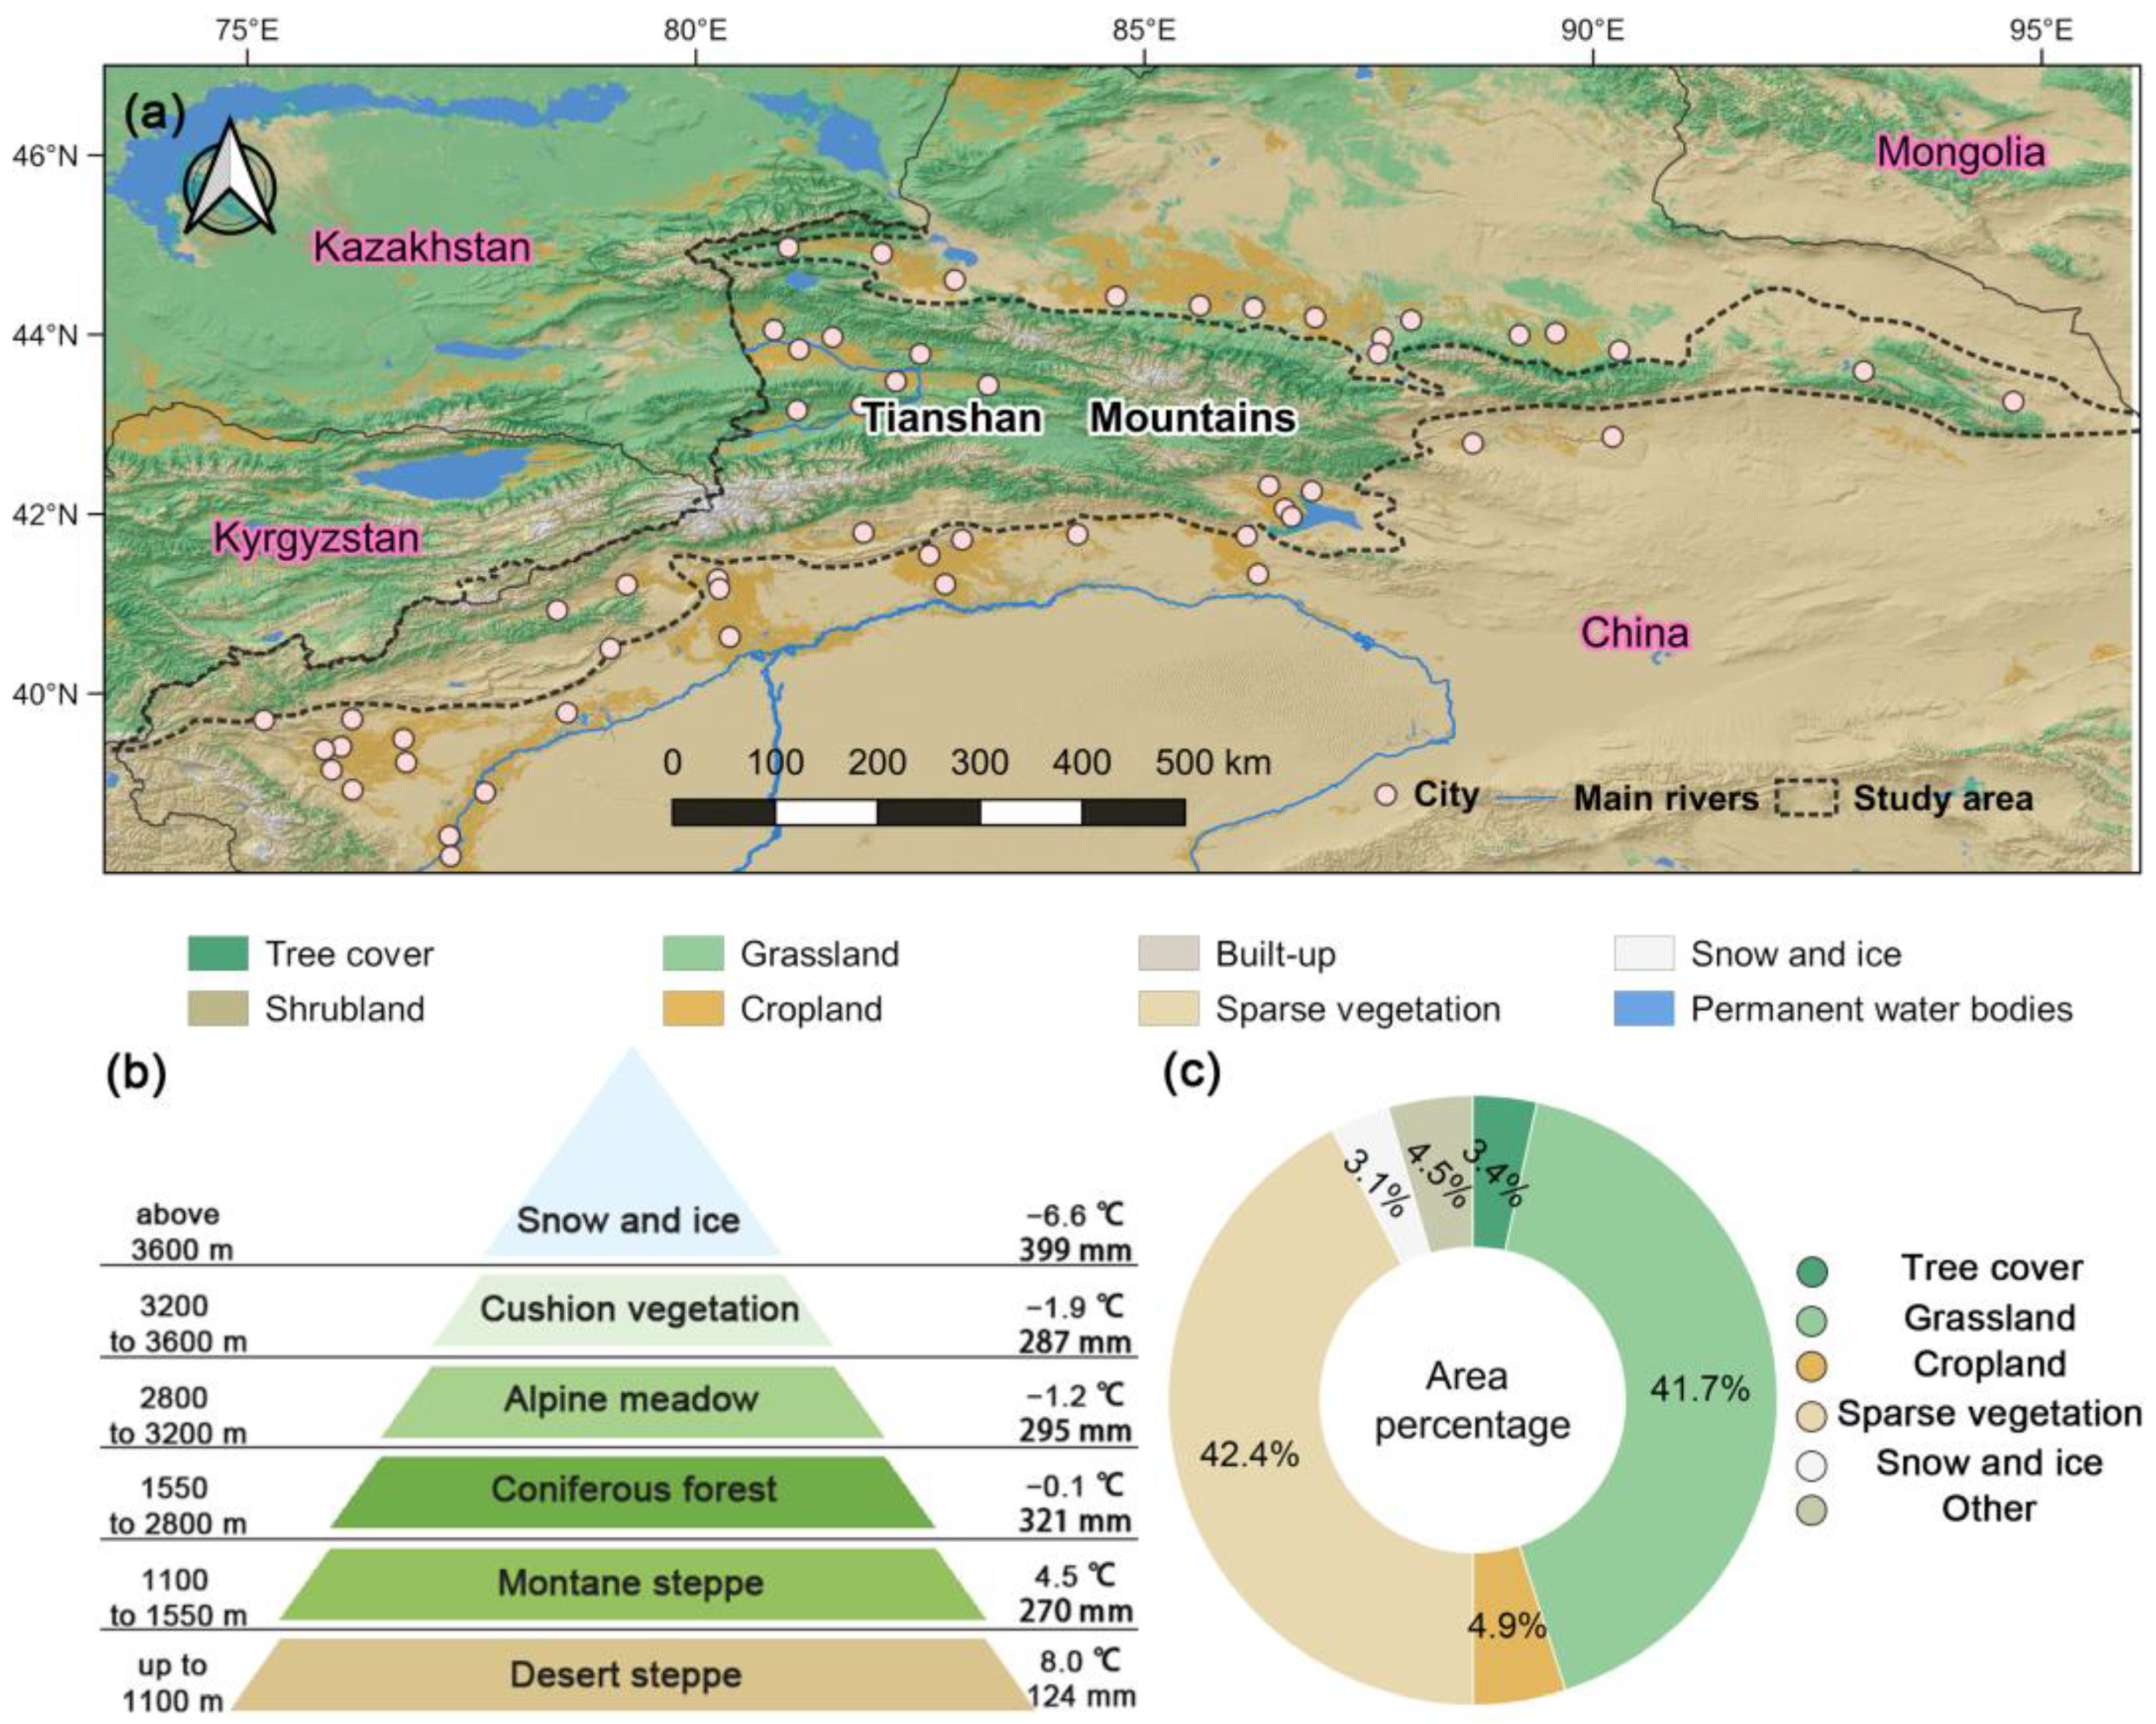
2.1. Study Area

The Tianshan Mountains are the largest mountain range in the arid region of Central Asia, stretching across China, Kazakhstan, Kyrgyzstan, and Uzbekistan in an east-west direction (Figure 1a). Xinjiang, China, is home to sixty percent of the Tianshan Mountains. The Tianshan Mountains exhibit a temperate continental climate, with an average annual precipitation range of 27.4 to 673.2 mm (1990–2020) and average annual temperatures varying from −15.4 to 14.1 °C. The higher relative elevation ranges (−154 to 7439 m) have led to the formation of a relatively complete altitudinal vegetation belt in the Tianshan Mountains [39]. Ref. [40] provided clarification on the average elevation range and composition of altitudinal vegetation belts within the Tianshan Mountains (Figure 1b). The climatic characteristics of vegetation belts at high elevations (>1500 m) are characterized by warm and humid conditions, and those at low elevations (<1500 m) are characterized by warm and dry conditions (Figure 1b). Land cover data from the Tianshan Mountains indicate that the natural vegetation types mainly include forests (tree cover), grasslands, and sparse vegetation (Figure 1c). Grasslands and sparse vegetation have the largest distribution, and both have an area proportion of more than 40% (Figure 1c). Although only comprising 3.4% of the total area, forests serve an important role as carbon sinks.

2.2. Climate Data

Our previous research has shown a strong agreement between climate observatory data and reanalysis data (i.e., ERA5-Land and TerraClimate) from the Tianshan Mountains throughout the entire time series [41]. ERA5-Land is a comprehensive global climate reanalysis dataset designed for global and regional climate change studies. It offers a wide range of climate variables and boasts a spatial resolution of 0.1° × 0.1° (approximately 9 km) and a temporal resolution ranging from months to hours [42]. In this study, we used monthly temperatures from the dataset (https://cds.climate.copernicus.eu/cdsapp, accessed on 8 May 2023) to calculate the average growing season (i.e., May to September) and obtain growing season temperatures (MAT) each year in the Tianshan Mountains for the years 2000–2021. TerraClimate is a hydrological, climatic dataset that provides high-resolution coverage worldwide. The resolution it provides is 4 km spatially and 1 month temporally [43]. VPD, commonly used as a measure of atmospheric drought, is defined as the disparity between saturation vapor pressure and actual vapor pressure [44]. We utilized monthly precipitation and vapor pressure deficit (VPD) (https://www.climatologylab.org/terraclimate.html, accessed on 14 May 2023) data to calculate the sum of growing season precipitation (PRE) and the average of growing season VPD in the Tianshan Mountains throughout the study period.

2.3. Atmospheric CO2 Concentration

Since the global distribution of atmospheric CO2 is heterogeneous in time and space (e.g., seasonal and latitudinal differences) [45,46], it is essential to employ atmospheric CO2 measurements from regional atmospheric background stations. This allows for a comprehensive examination of the effects of CO2 concentration variations on regional vegetation carbon fluxes. The Mt. Waliguan (WLG) station is located in Qinghai Province, China, which belongs to the hinterland of the Eurasian continent, with geographic coordinates of 36.29° N, 100.89° E, and an altitude of 3810 m above sea level, and it is one of the observational background stations of the World Meteorological Organization’s Global Atmospheric Observations project. The WLG station is far from areas of intensive human activity and has a predominantly semi-arid steppe vegetation type [47]. The Tianshan Mountains, situated in the hinterland of the Eurasian continent, are also relatively less impacted by human activities. Therefore, it is reliable to use the CO2 concentration (ppm) measured by the WLG station to analyze the effects on carbon fluxes in the Tianshan Mountains. Here, we used monthly scale CO2 concentrations to perform growing season averaging to obtain growing season CO2 concentration data over the study epoch (https://community.wmo.int/en/activity-areas/gaw, accessed on 20 May 2023).

2.4. Land Cover Data

A global annual land cover map, which utilizes imagery from Sentinel-1 and Sentinel-2 satellites, was created by the ESA WorldCover team (https://worldcover2021.esa.int/, accessed on 1 June 2023). This land cover map has a spatial resolution of 10 m, contains 11 categories, and has an overall classification accuracy of 77% [48]. The higher classification accuracy ensures the reliability of extracting the range of altitudinal vegetation belts. In this study, we reclassified the ESA WorldCover data (version 2021) based on the average elevation range of each altitudinal vegetation belt (Table 1). Based on this process, the geographical boundaries of each altitudinal vegetation belt were extracted. The detailed spatial distribution pattern and reclassification information are presented in Figure 2 and Table 1.

2.5. Elevation Data (DEM)

The DEMs derived from the Space Shuttle Radar Topography Mission (SRTM) have been extensively utilized as supplementary data in studies related to climatology, ecology, and geomorphology [49]. SRTM DEMs have a spatial resolution of 90 m, an average elevation error of 16 m, and cover 80% of the global area. We used SRTM DEMs (version 4) to acquire the spatial extent of different altitudinal vegetation belts (https://srtm.csi.cgiar.org/, accessed on 5 June 2023).

2.6. Primary Productivity

Vegetation productivity data (GPP and NPP) were obtained free of charge from the MODIS satellite image-derived MOD17A2H-based product. MOD17A2H version 06 offers GPP and NPP at 500 m spatial resolution and intervals of 8 days [50]. We preprocessed the NPP and GPP raster files by reprojecting them using the Google Earth Engine (the new coordinate system is World Geodetic System 1984). MOD17A2H also includes a Psn_QC band that provides quality information for GPP and NPP in the designated area. By utilizing this band, we can effectively filter and acquire high-quality GPP and NPP data where the Psn_QC value is equal to 0. We summed all the GPP and NPP raster data separately for each growing season from 2000 to 2021. Finally, the growing season GPP (g C m−2 yr−1) and NPP (g C m−2 yr−1) for 22 years were obtained using the study area masking process.
The accuracy of MODIS-derived GPP from different biomes has been validated using 800 eddy covariance flux tower GPPs (FLUXNET GPP) worldwide. The validation results show good agreement between MODIS-derived GPP and FLUXNET GPP, with spatial and temporal variations [51]. In other words, MODIS GPP and NPP are reliable data to investigate temporal variations in vegetation productivity in diverse altitudinal vegetation belts in the Tianshan Mountains.

2.7. Statistical Analyses

We used the Shapiro-Wilk test to perform normality tests for all climate variables and vegetation productivity data. We found that all the variables were normally distributed. Simple linear regression involves modeling the relationship between two variables, namely the independent and dependent variables [52]. It is utilized to approximate the dependent variable through the use of the best-fit line. Simple linear regression was employed to assess interannual trends (slope (k)) in climate (i.e., MAT, PRE, and VPD) and vegetation productivity (GPP and NPP). The linear regression equation can be represented by the following formula:
y = b + k x
where y represents the dependent variable, which refers to the climatic variables and vegetation productivity chosen for this study. x represents the time period from 2000 to 2021. k and b represent the slope and intercept of the fitted curve, respectively. A positive slope denotes an upward trend in the time series data, while a negative slope indicates a downward trend. The absolute value of the slope indicates the magnitude of the trend per unit of time.
The Mann–Kendall test was utilized to assess the statistical significance of inter-annual trends in both the climate and vegetation productivity data. In this study, the Python third-party package “pymannkendall” was employed to calculate the p-value for the slope and perform the significance test. The pymannkendall is a Python package used for conducting the Mann–Kendall trend test, a widely adopted method for detecting trends in time series data and assessing the statistical significance of those trends. Using this Python package, we analyzed the spatial distribution of interannual temperature and precipitation trends in the Tianshan Mountains (see Figure 3). Additionally, we calculated the regional average climate trends across various altitudinal vegetation belts (see Figure 4).
Pearson’s correlation coefficients were utilized to ascertain the correlation between climatic variables and vegetation productivity. We utilized OriginPro software (version 2023b, OriginLab Corp., Northampton, MA, USA) for the calculation of correlation coefficients and conducted a two-tailed significance test to assess the statistical significance of the correlation coefficients.

3. Results

3.1. Tendency of the Climate in the Tianshan Mountains

Tianshan Mountains showed warming and drying. Here, we analyzed the MAT and PRE trends in different altitudinal vegetation belts from 2000 to 2021. During the study period, the Tianshan Mountains experienced slight warming (Figure 3a). Only the northwestern part of the Tianshan Mountains experiences significant warming, accounting for a mere 9.4% of the entire area. The MAT trend ranged from −0.2 to 0.7 °C decade−1, and the average MAT trend was 0.2 °C decade−1. Further, PRE decreased slightly (Figure 3b). Only certain regions in the western section of the Tianshan Mountains exhibit noteworthy aridity. The precipitation trend ranged from −42.2 to 49.6 mm decade−1, with an average trend of −0.2 mm decade−1. The region experiencing a notable decrease in PRE covers just 6.5% of the total area.
The MAT and PRE trends in different altitudinal vegetation belts were consistent. Although divergent altitudinal vegetation belts showed slight warming (p > 0.05), the warming trends varied: they were higher in the lower elevation vegetation belts (i.e., DS and MS) than in the higher elevation belts (i.e., CF and CV) (Figure 4). Despite the minimal disparity in warming magnitude among all vegetation belts, the lower-elevation vegetation belts exhibit a slightly higher warming trend compared to their higher-elevation counterparts. Moreover, precipitation has slightly decreased across all altitudinal vegetation belts: MS and CF had the largest drying trend (−16.33 and −9.26 mm decade−1), and CV and DS had the smallest (below 0.7 mm decade−1).
Over the course of the study period, there was no significant trend in the VPD among various vegetation belts at different altitudes. Based on Figure 5, slightly increasing trends in VPD were observed across all altitudinal vegetation belts. Among them, DS and MS exhibited a higher rate of increase compared to other vegetation belts. However, AM did not show obvious inter-annual variation in VPD. It is important to note that the VPD trends in all vegetation belts did not meet the criteria for statistical significance.

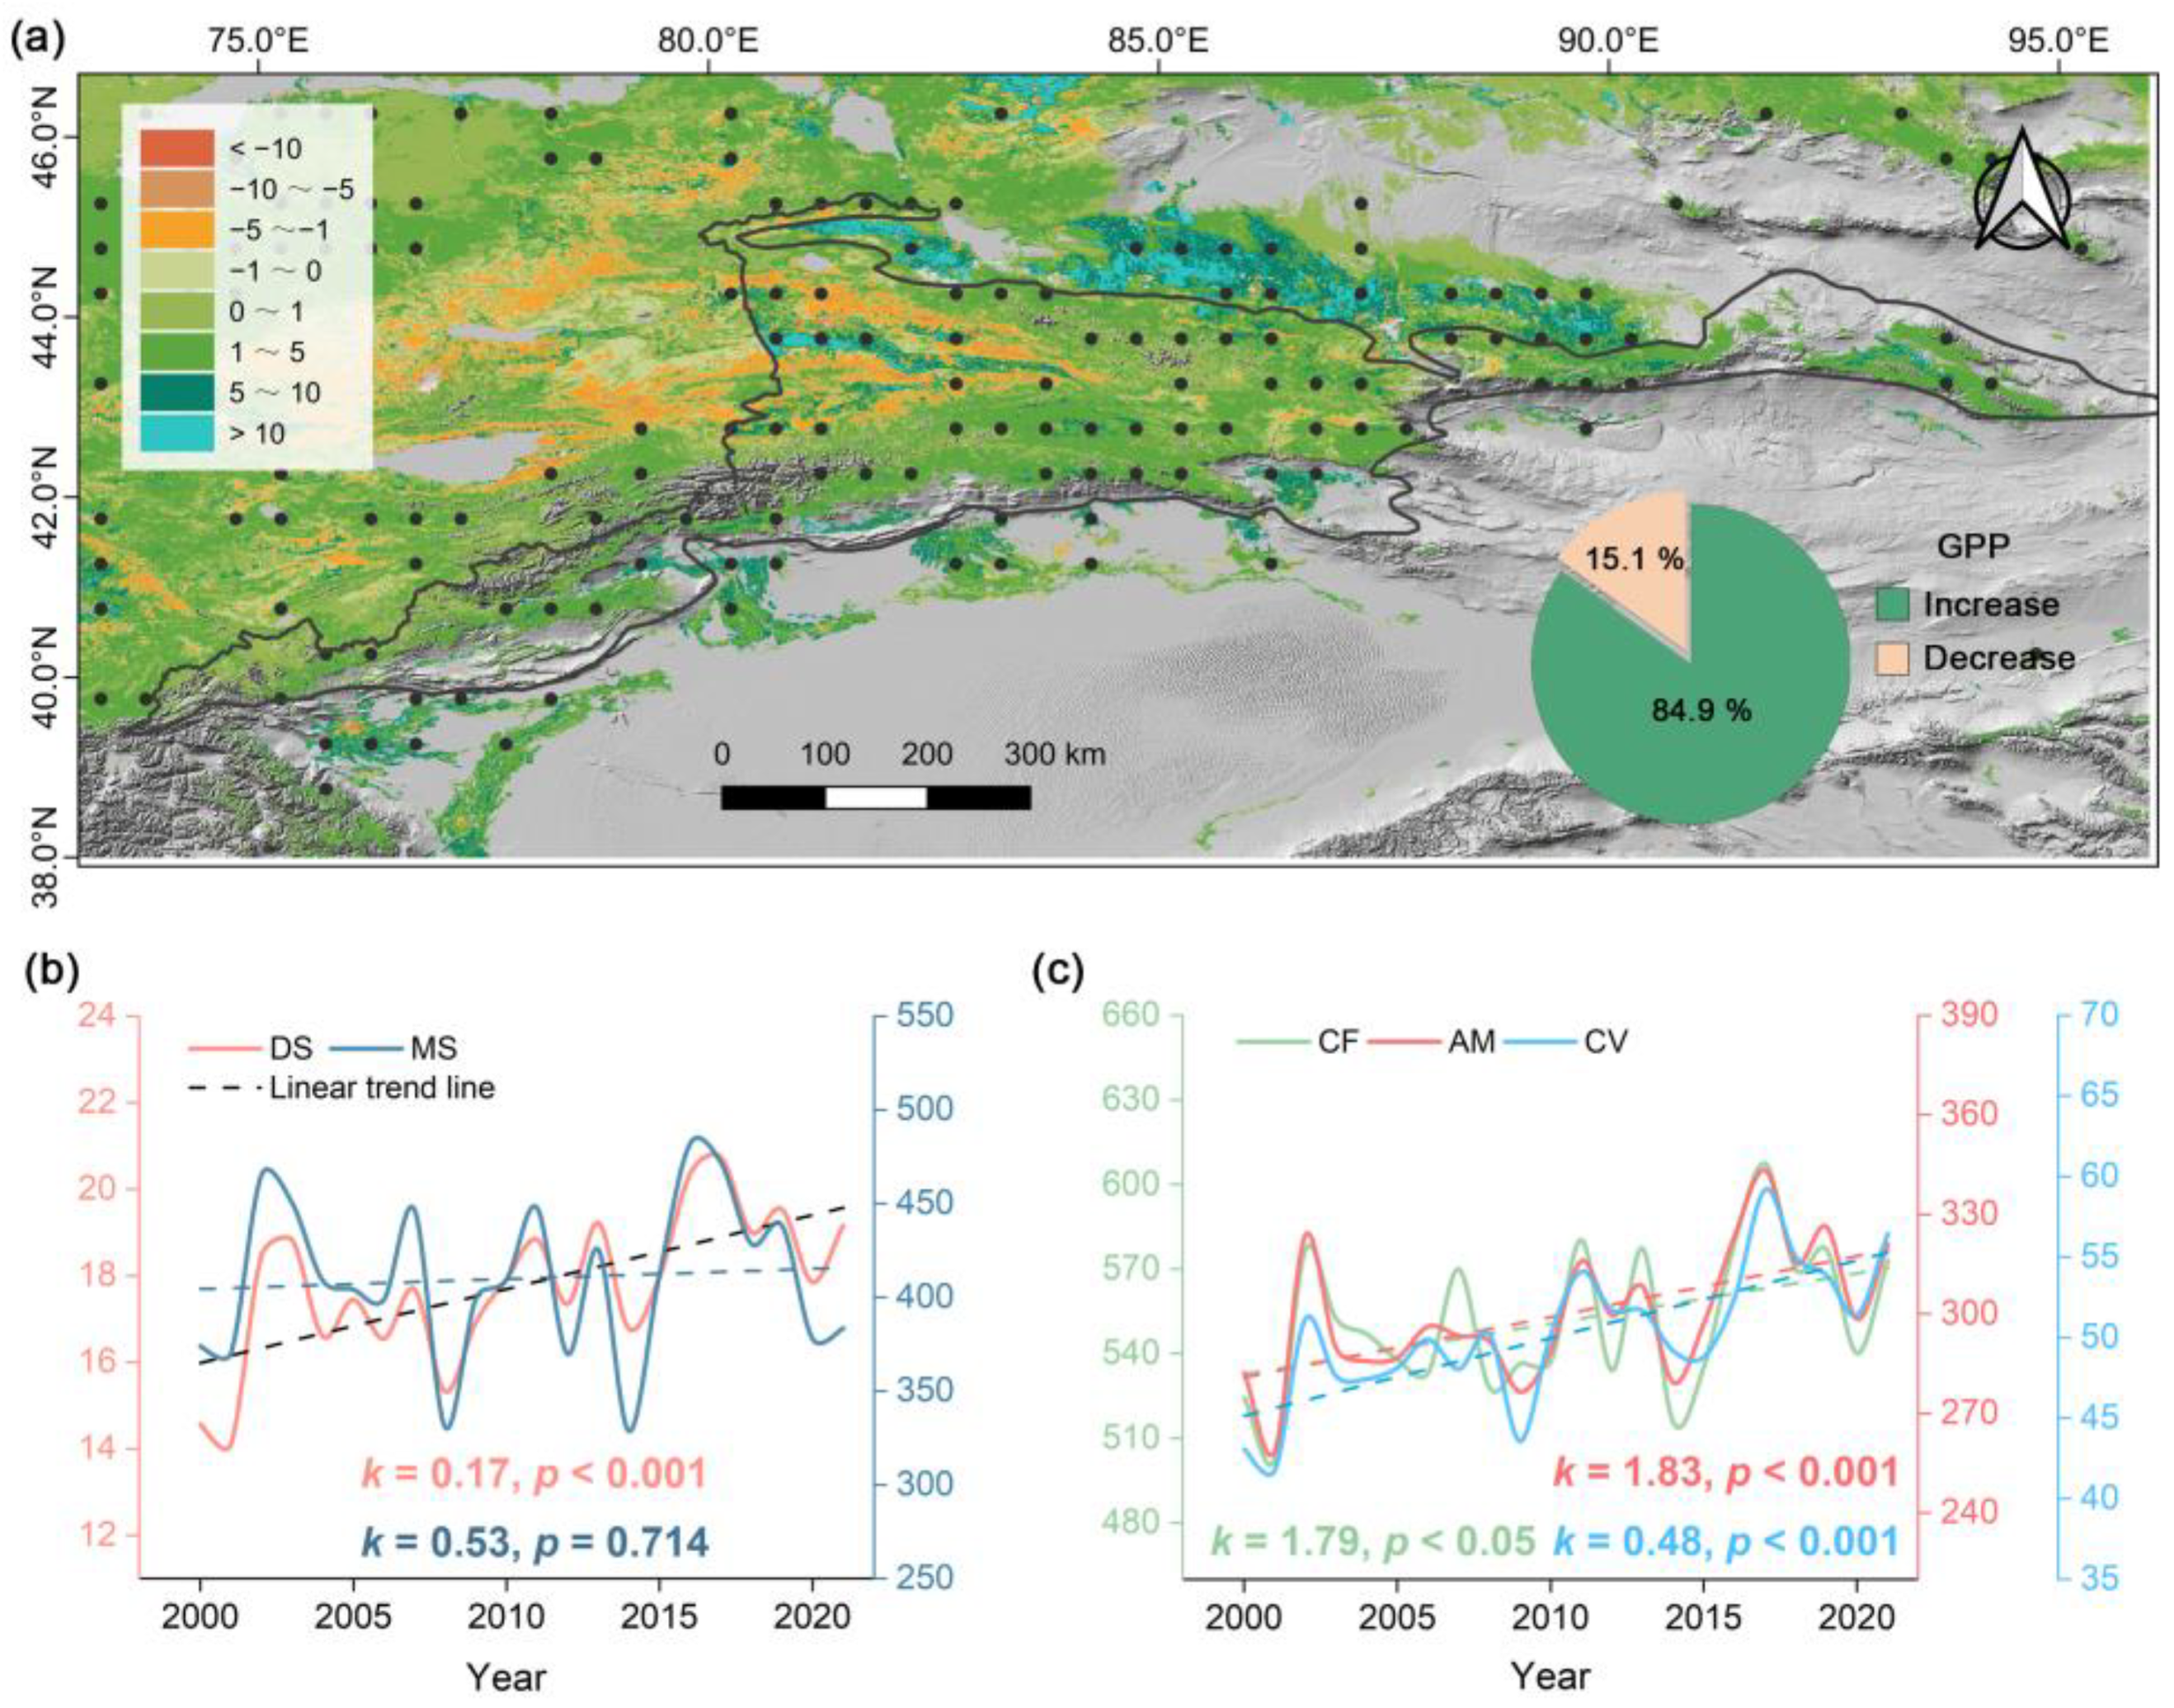
3.2. GPP Tendency in the Altitudinal Vegetation Belts Observed by Satellite

The GPP trend in the Tianshan Mountains showed remarkable spatial heterogeneity. The GPP trend ranged from −46.0 to 46.8 g C m−2 yr−1 and had an average trend of 1.7 g C m−2 yr−1 (p < 0.05) (Figure 6a). Notably, 15.1% of the regions experienced a decrease in GPP, and 84.9% experienced an increase in GPP (Figure 6a). Of these, the GPP trend is predominantly concentrated between 0 and 5 g C m−2 yr−1, accounting for 75.5% of the total area. In the western part of the Tianshan Mountains (i.e., Ili River valley), where the GPP mainly decreased, all other areas showed an increase. To summarize, there was an overall increasing trend in the GPP of the Tianshan Mountains.
GPP increased in different altitudinal vegetation belts from 2000 to 2021. Specifically, in the lower elevation altitudinal vegetation belts, DS GPP exhibited a significant increase (p < 0.001) with a regional average trend of 0.17 g C m−2 yr−1 (Figure 6b). Nevertheless, although MS GPP showed a higher rate of increase, this trend was not significant (p > 0.05). GPP demonstrated a significant increase (p < 0.05) across all altitudinal vegetation belts at higher elevations (Figure 6c). CF and AM showed higher rates of increase, with an approximate regional average tendency of 1.8 g C m−2 yr−1. The regional average tendency of CV was 0.5 g C m−2 yr−1. Overall, the tendency of increasing GPP was higher in the higher elevation vegetation belts than in the lower elevation vegetation belts.

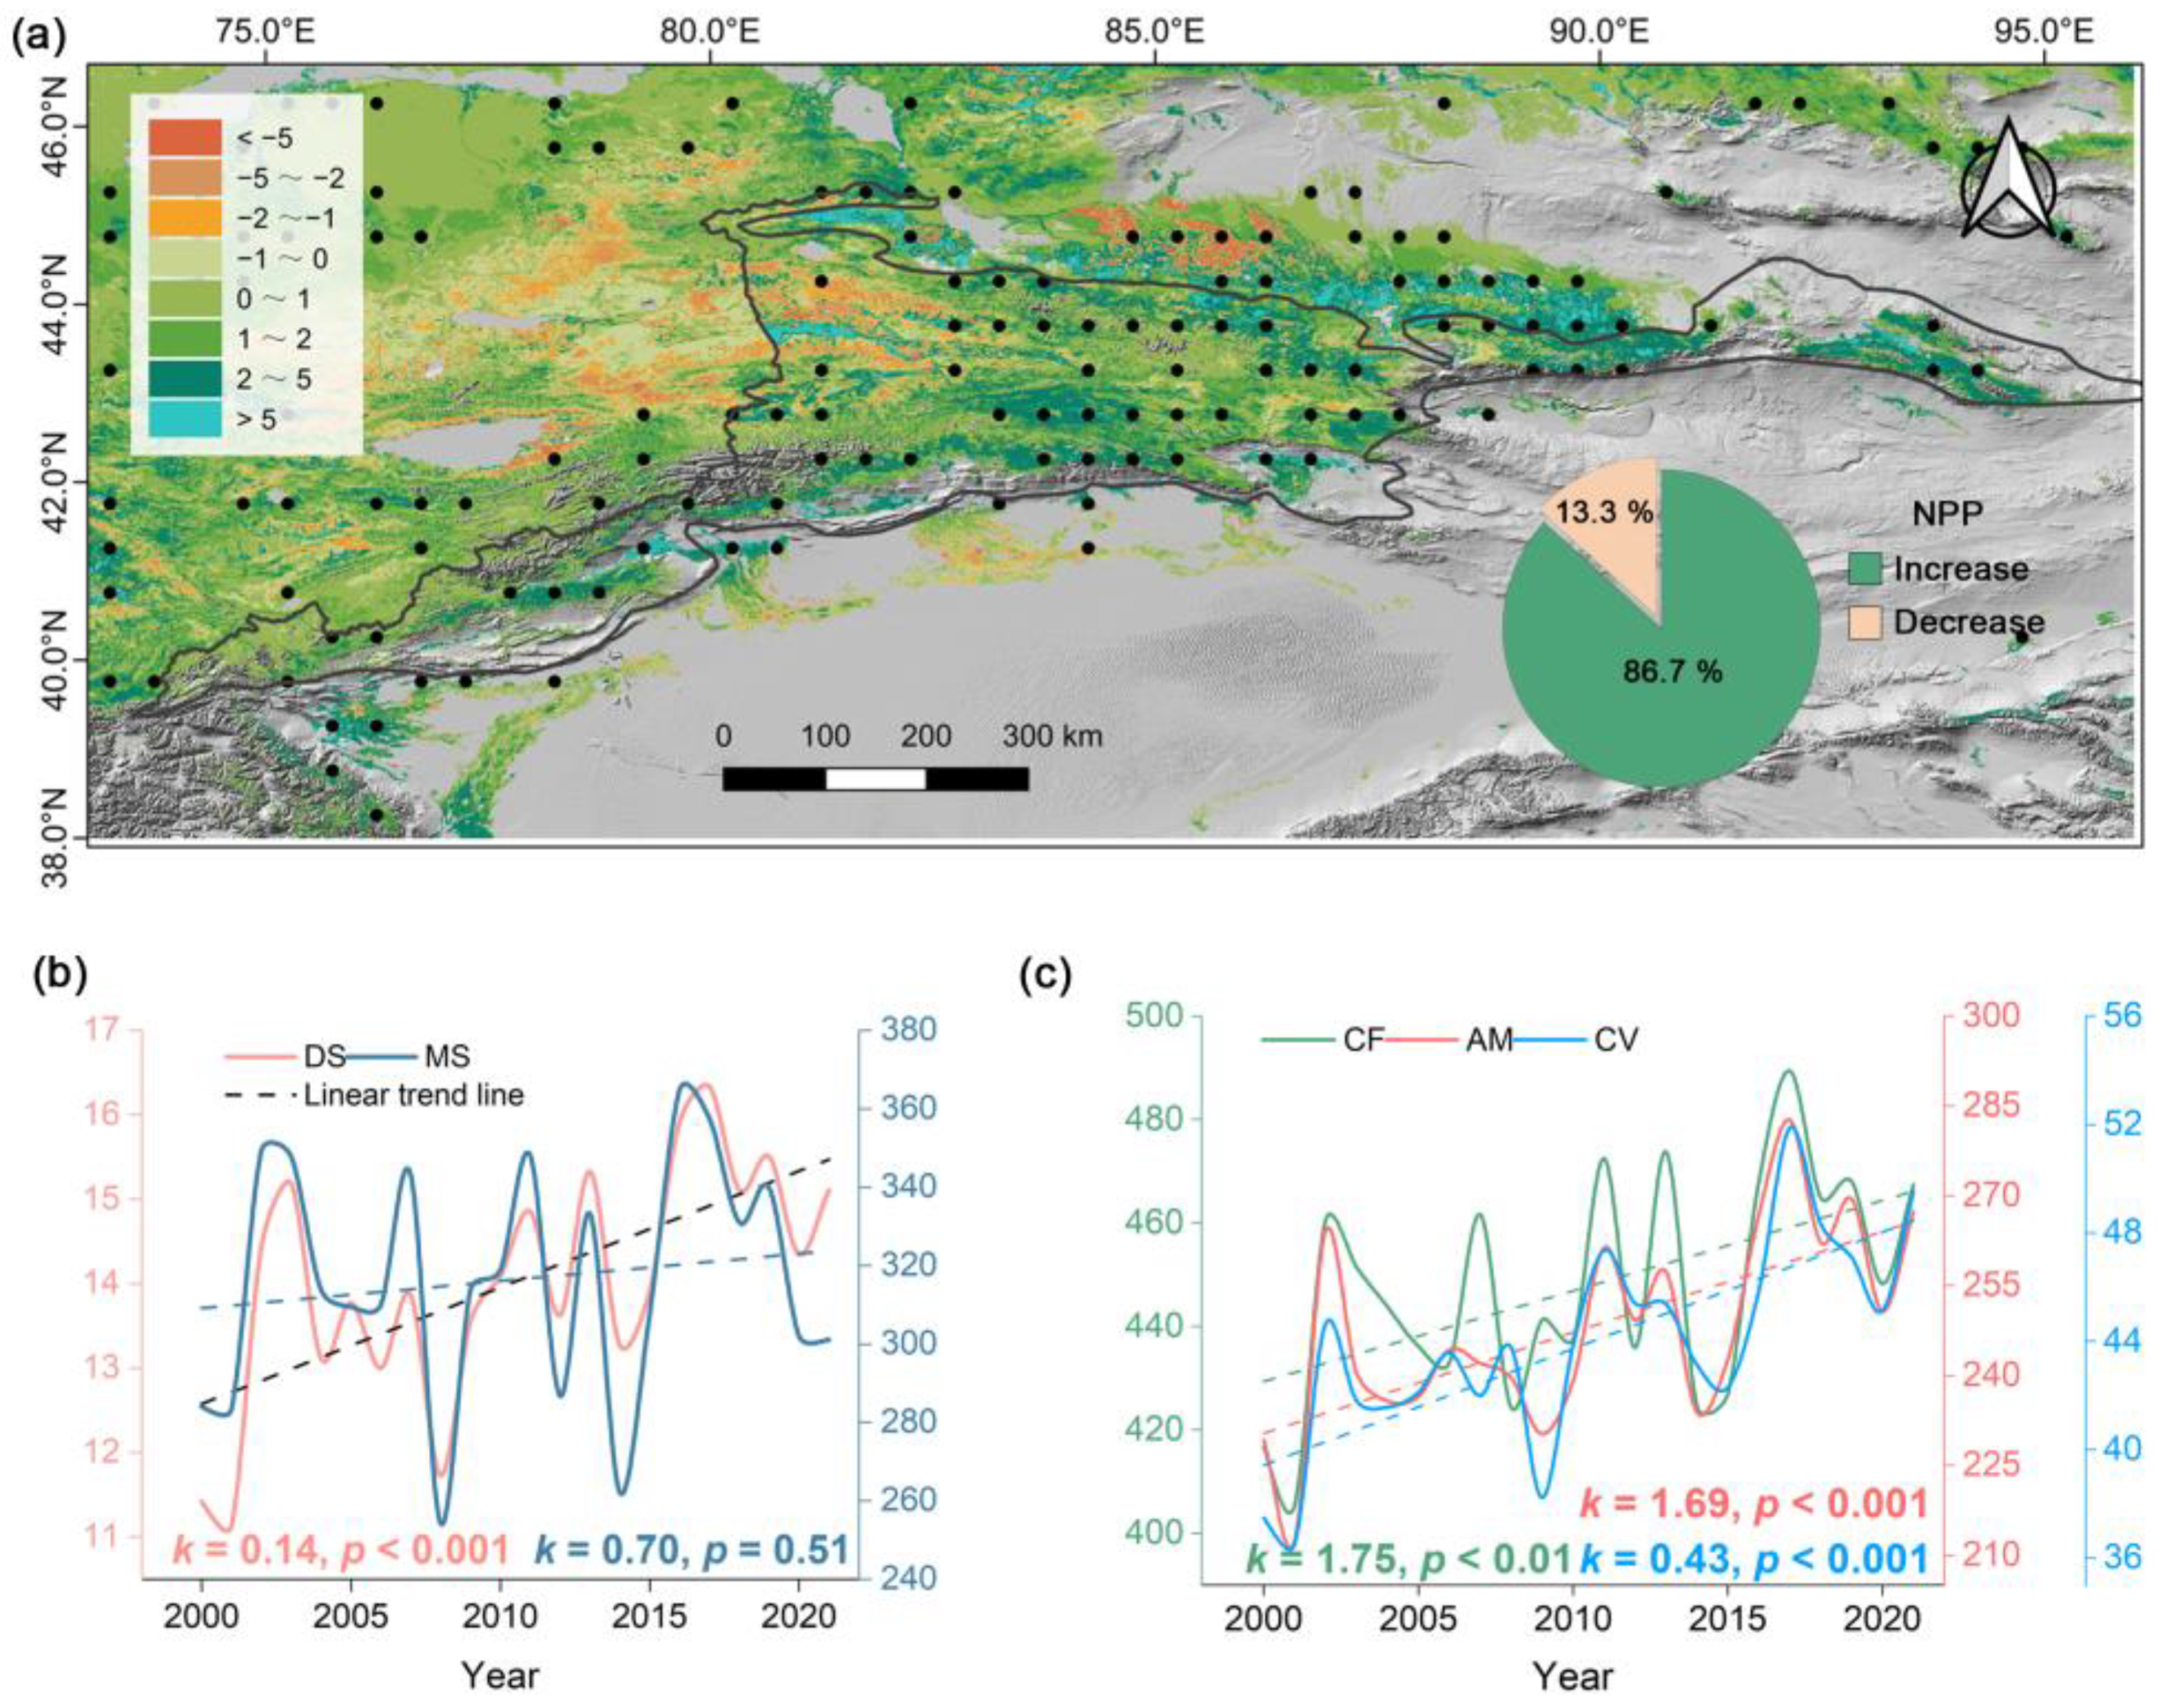
3.3. NPP Tendency in the Altitudinal Vegetation Belts Observed by Satellite

The spatial pattern of NPP trends exhibited similarity to the trends observed in GPP. The trend of NPP in the Tianshan Mountains ranged from −32.9 to 40.5 g C m−2 yr−1, with a regional average trend of 1.4 g C m−2 yr−1 (p < 0.05) (Figure 7a). Similarly, lower NPP trends were observed in the western region of the study area. In contrast, the other regions showed an increase in NPP. Altogether, NPP increased in over 86.7% of the study area and decreased in over 13.3% of the study area. In which, the NPP trend is primarily concentrated between 0 and 5 g C m−2 yr−1, representing 80.9% of the total area. The average NPP trend during the study epoch indicates that vegetation in the Tianshan Mountains acts as an important carbon sink.
Except for that of MS, NPP in the other altitudinal vegetation belts increased considerably from 2000 to 2021. The annual growing season trends of NPP in DS and MS were 0.1 and 0.7 g C m−2 yr−1, respectively; however, only the NPP trend in DS passed the 0.001 significance level (Figure 7b). CF and AM also had higher rates of increase in NPP, with regional average trends of 1.8 and 1.7 g C m−2 yr−1, respectively (Figure 7c). Although the rate of increase in NPP in the CV group was less than that in the CF and AM groups, the trend was significant (p < 0.001). In general, altitudinal vegetation belts in the Tianshan Mountains act as carbon sinks, and the middle vegetation belts show higher carbon sink capacities than the lowest and highest belts due to denser vegetation cover.

3.4. The Impact of Current Climate Patterns

The effect of MAT on GPP variation in different vegetation belts was weak. The variations in GPP across different vegetation belts exhibited a positive correlation with temperature (Figure 8a). The correlation coefficients (0.42 and 0.39) of CF, AM, and MAT were higher relative to the other altitudinal vegetation belts (i.e., DS, MS, and CV), and the magnitude of the correlation coefficients between other altitudinal vegetation belts and MAT were similar (approximately 0.30). However, the GPP variation and MAT were not significantly correlated (p > 0.05). Similarly, GPP variations in all altitudinal vegetation belts were positively correlated with PRE (Figure 8a), but the extent to which precipitation affected GPP varied across altitudinal vegetation belts. Specifically, the interannual variability in GPP for the DS and MS was more sensitive to PRE variability (r = 0.55, 0.8; p < 0.01, 0.001, respectively). The impact of the PRE on interannual GPP variability in other altitudinal vegetation belts was not significant (p > 0.05). In general, the interannual variation in GPP in altitudinal vegetation belts exhibited positive effects from temperature and precipitation.
Interannual variations in NPP in the different altitudinal vegetation belts were also not sensitive to MAT. The correlation coefficients between NPP and MAT in the altitudinal vegetation belt ranged from 0.28 to 0.40; however, the correlation was not significant (p > 0.05) (Figure 8b). PRE also had a positive effect on NPP variability in all altitudinal vegetation belts. Of these, there was a significant positive correlation between the changes in NPP in the DS and MS and PRE (r = 0.54, 0.75; p < 0.01, 0.001), whereas those in other altitudinal vegetation belts were weakly positively correlated with the PRE. The findings indicate that the impact of PRE was felt more strongly in the vegetation carbon sinks in lower-elevation altitudinal belts from 2000 to 2021.

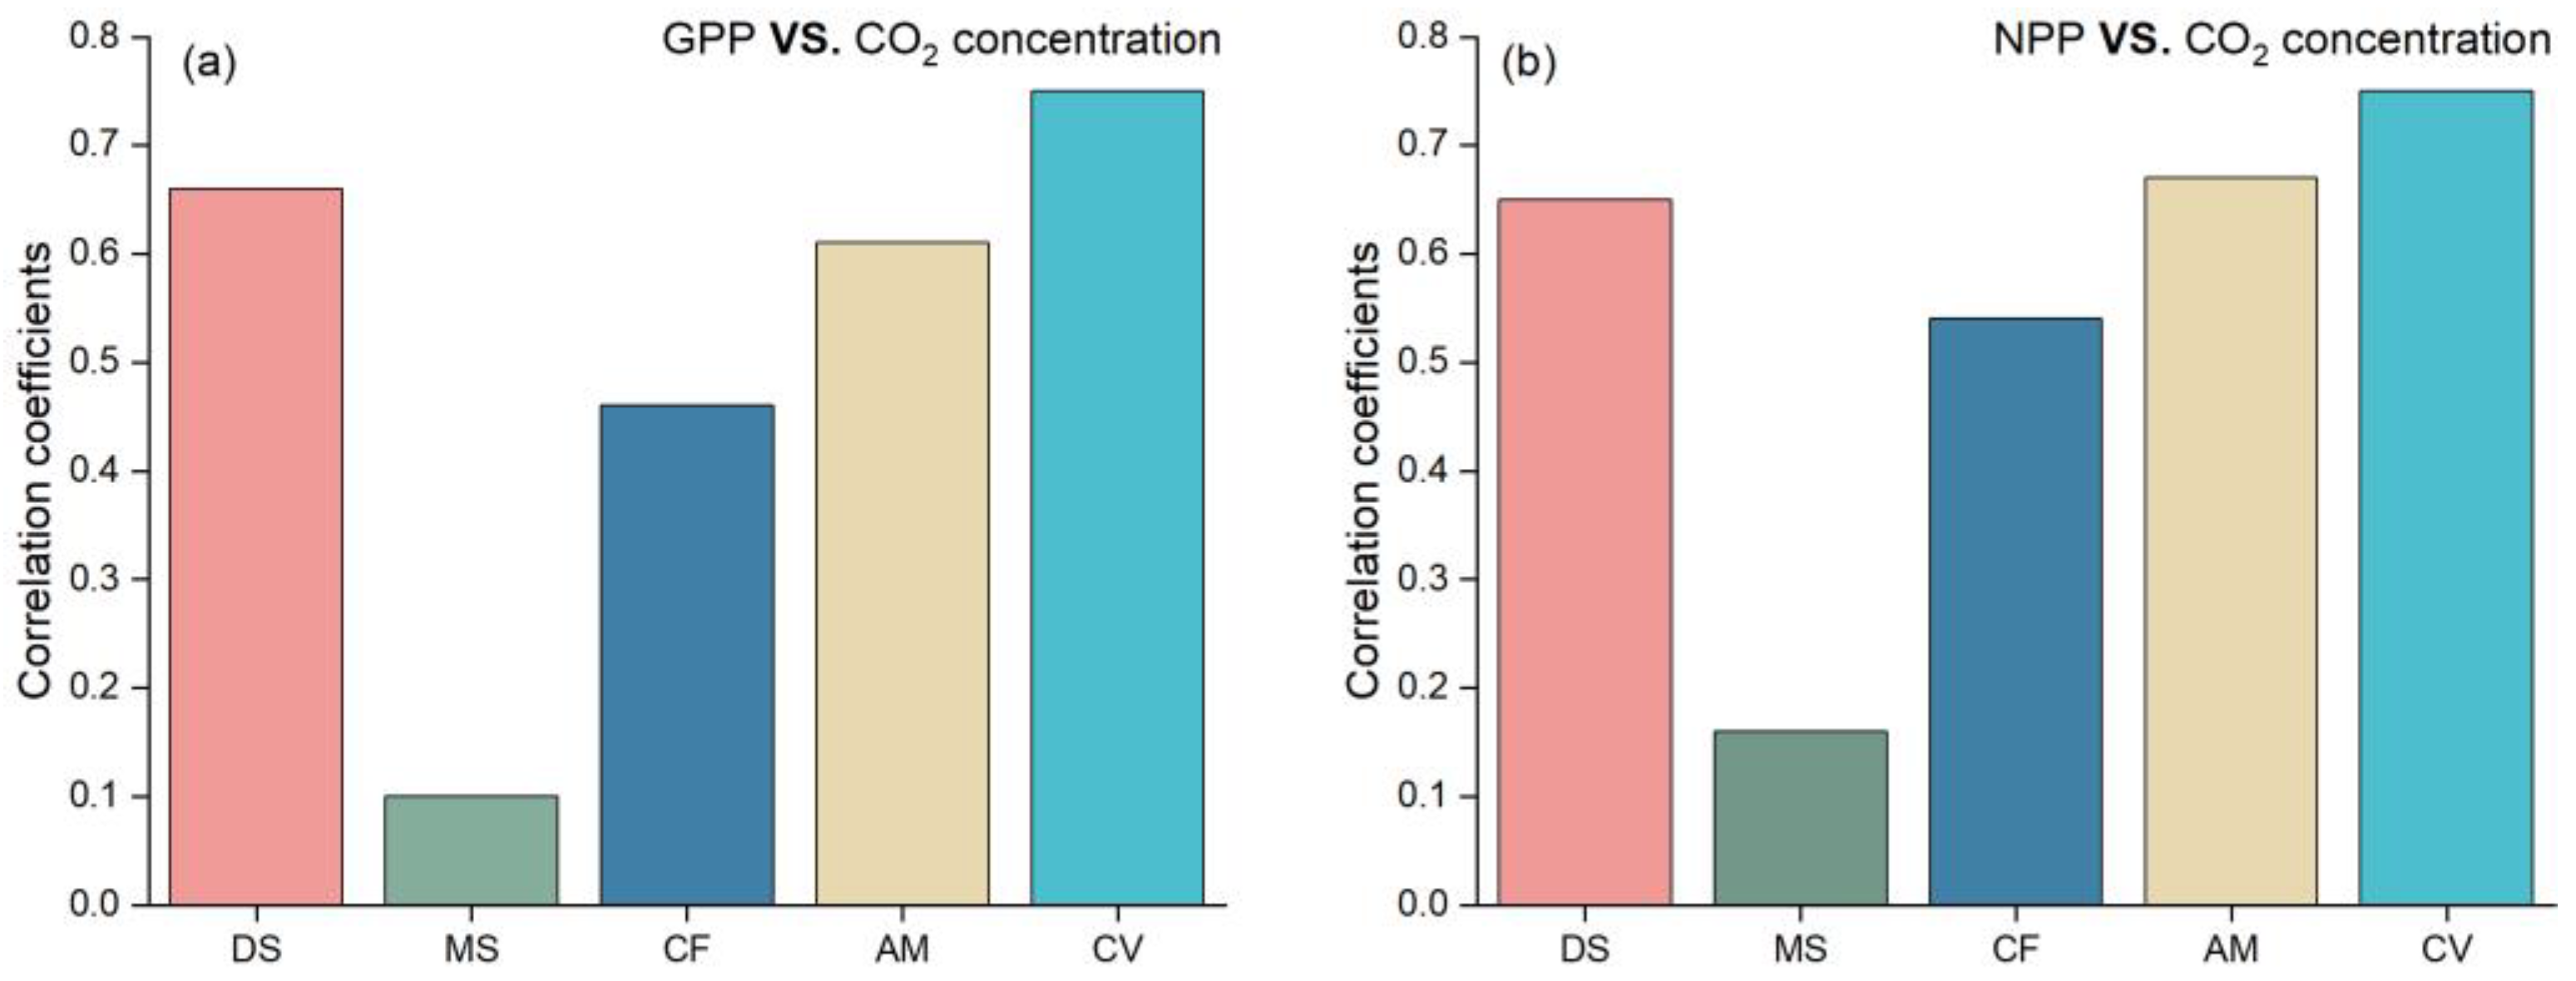
3.5. The Correlation between Changes in Vegetation Productivity and CO2 Concentrations

All vegetation belts, except for MS, displayed significant correlations between changes in vegetation productivity and CO2 concentrations. For both GPP and NPP, there was a significant positive correlation (with correlation coefficients exceeding 0.6, p < 0.01) between interannual changes in DS and CO2 concentrations. Additionally, for vegetation belts at higher elevations, interannual changes in GPP and NPP were also significantly and positively correlated with CO2 concentrations (p < 0.01), with CV displaying higher correlation coefficients (r = 0.75, p < 0.001). Interestingly, there was no significant correlation observed between changes in vegetation productivity at MS and CO2 concentrations.

4. Discussion

4.1. Universality and Uniqueness of Vegetation Productivity Variations in the Tianshan Mountains

To comprehend carbon exchange between vegetated ecosystems and the atmosphere, it is crucial to monitor variations in vegetation productivity (GPP and NPP) in diverse plant communities and geographic scales [8]. The average global GPP increased remarkably from 2000 to 2019, dominated by warming and CO2 fertilization [53]. However, vegetation productivity increased considerably in only 6.2% of the grassland areas and 7.3% of the evergreen broadleaf forest areas worldwide [9]. Few studies have analyzed changes in vegetation productivity by considering mountains as separate geographical units. From 2000 to 2016, warming dominated the increase in NPP in the high-elevation zone of the Hengduan Mountain region (subtropical monsoon climate); however, drying resulted in a decrease in NPP in the river valley region [54]. This indicates an elevational difference in the direction of vegetation productivity changes in the mountains. The Qilian Mountains (temperate continental climate) have shown decreasing trends in NPP and GPP since 2000, and the cooling trend led to a decrease in NPP after 2010 [55]. Collectively, these studies indicate that temperature is a crucial factor contributing to the alterations observed in vegetation productivity on both global and regional levels.
Our findings indicate a notable rise in GPP and NPP within the Tianshan Mountains, which aligns with global patterns. In addition, our results were in line with global and regional studies demonstrating that climate factors had positive impacts on GPP and NPP across various altitudinal vegetation belts. While our findings were consistent with the literature, we identified certain unique responses of various altitudinal vegetation belts in the Tianshan Mountains to climate change. We concluded that temperature and precipitation did not dominate the increase in GPP and NPP during the study period, as they did not change significantly (see Section 3.1); however, vegetation productivity increased significantly, suggesting that the contributions of temperature and precipitation were weak. Furthermore, although the temperature was positively correlated with vegetation productivity, the correlations were not significant (p > 0.05), which supports our conclusion. Although the GPP and NPP of DS and MS were significantly positively correlated with precipitation, the insignificant change in precipitation only affected the interannual fluctuation. Thus, we posit that GPP and NPP in different altitudinal vegetation belts are insensitive to current climate trends.

4.2. Why Vegetation Productivity Changes Are Insensitive to Temperature and Precipitation

The sensitivity of variations in vegetation productivity to warming diminished during the warming hiatus period. Temperature affects plant photosynthesis by influencing the rate of enzyme-catalyzed reactions [56]. Warming is expected to enhance the photosynthetic rate of vegetation and, thus, the net ecosystem carbon exchange [57]. In addition, the warming generally extends the duration of the growing season through advancements in plant leaf coloring or prolonged leaf drop, thereby enhancing vegetation productivity [20,58]. In general, warming has a positive impact on vegetation productivity. Notably, the rate of global warming did not increase remarkably from 1998 to 2012 (i.e., warming hiatus) because of the decrease in latent heat released from the surface to the atmosphere [59]. Nonetheless, the global atmospheric CO2 concentration increased continuously during this period [60]. Despite the increasing trend (1982–2012) in global gross primary productivity (GPP), satellite observations showed a decrease of 87.2% in the rate of warming hiatus compared to the warming period (1982–1998). Furthermore, the correlation between GPP and temperature showed a decrease in sensitivity, shifting from a significant correlation during the warming period to an insignificant correlation during the warming hiatus [61]. Based on these findings, it can be strongly inferred that the positive impact of temperature on vegetation productivity diminished notably during the period of warming hiatus. Our results showed that although the rate of warming in different altitudinal vegetation belts remained high (0.27–0.32 °C decade−1), the warming trend was not significant (p > 0.05). Similar to the relationship between global GPP and temperature, the non-significant increase in temperature since 2000 has led to a limited contribution of warming to vegetation productivity.
Decreased precipitation in the Tianshan Mountains did not negatively affect vegetation productivity. Leaf stomata are important channels of photosynthesis, respiration, and transpiration in plants [62]. During severe drought, plants reduce stomatal conductance to mitigate water loss [63]. The partial closure of plant leaf stomata attenuates the evaporative cooling effect, leading to plant death by heat stress, and reduces the photosynthetic rate and, consequently, plant carbon flux [64]. In general, severe droughts negatively affect vegetation productivity. In arid regions, VPD and soil moisture are considered the limiting factors affecting vegetation growth [65]. Global and regional studies have shown that increased VPD offsets or attenuates the positive effects of warming and CO2 fertilization on vegetation productivity [65,66]. Our results revealed warming and precipitation reduction trends in the altitudinal vegetation belts, which may enhance atmospheric drought and negatively affect vegetation productivity. However, the VPD trends in the different altitudinal vegetation belts showed a slightly increasing trend (p > 0.05) from 2000 to 2021 (Figure 5), suggesting that the decrease in precipitation did not obviously affect the GPP and NPP trends. Further, the non-significant changes in growing season precipitation (Figure 4) suggest a limited role of precipitation in the GPP and NPP trends.

4.3. Factors Dominating the Tendency of Growing Vegetation Productivity in Altitudinal Vegetation Belts

Elevated CO2 concentration can lead to increased productivity in vegetation. Solar radiation mainly regulates vegetation productivity changes in humid areas (higher cloud cover and water vapor content) [67]. Hence, the influence of solar radiation on the interannual trends of vegetation productivity in the altitudinal vegetation belts is not a topic that will be discussed. The consumption of fossil energy sources increases the concentration of atmospheric CO2, which contributes to global warming while stimulating photosynthesis in plants (CO2 fertilization) [68]. In general, CO2 fertilization plays a significant role in augmenting the capacity of vegetation to absorb CO2. Existing literature has demonstrated that CO2 fertilization stimulates vegetative growth and facilitates the accumulation of biomass [68]. Therefore, we further investigated the sensitivity of vegetation productivity in altitudinal vegetation belts to changes in CO2 during the growing season. GPP and NPP variations were significantly and positively correlated with CO2 concentrations in all altitudinal vegetation belts, except for MS (Figure 9a,b). In which the GPP and NPP of CV were more sensitive than those of other areas to changes in CO2 concentration. MS was not sensitive to changes in CO2 concentration because there were no significant changes in GPP or NPP (Figure 6b and Figure 7b). In summary, we conclude that CO2 fertilization played a more important role than precipitation and temperature in determining the interannual trends of vegetation productivity across altitudinal vegetation belts in the study period.

4.4. Limitations and Significance

The climate reanalysis dataset is a gridded dataset that refers to satellite and observational data and is created through data assimilation methods [69]. Nevertheless, 79.2% of the meteorological stations in the Tianshan Mountains are located below 2000 m above sea level [37], which indicates that the reanalysis data perform poorly in high mountainous areas. Therefore, there may be some uncertainty when using reanalysis data to investigate climate trends in higher-elevation altitudinal vegetation belts. In future research, we aim to enhance the reliability of climate trend analysis in the alpine vegetation belts by using ensemble averaging of multiple reanalysis datasets. Human activity has also driven changes in vegetation productivity [17], and the primary human activity in the Tianshan Mountains range is grazing. Therefore, additional research is required to assess the impact of grazing activities on vegetation productivity in grassland belts.
The soil organic carbon pool constitutes the most extensive carbon reservoir within terrestrial ecosystems; therefore, small variations in its storage may cause obvious fluctuations in atmospheric CO2 concentrations [70]. Plant carbon input (NPP) is the main source of soil organic carbon [71], and an increase in plant carbon input can enhance its content and stock [72]. Our results showed that NPP increased significantly in all vegetation belts except MS, enhancing soil carbon sink capacity. Moreover, the vegetation belts situated at higher elevations tended to exhibit higher NPP, thereby enhancing their soil organic carbon content. In conclusion, increased NPP improved plant and soil carbon sequestration in the Tianshan Mountains.

5. Conclusions

Based on satellite-derived vegetation productivity (GPP and NPP) and climate variables, we examined changes in vegetation productivity and responses to current (2000–2021) climate trends in the Tianshan Mountains. The outcomes of our study demonstrate that the altitudinal vegetation belts in the Tianshan Mountains exhibited a slight warming and drying trend over the studied period of 2000–2021. The warming trends in different altitudinal vegetation belts ranged from 0.27 to 0.32 °C decade−1, and precipitation trends ranged from −16.33 to −0.77 mm decade−1. Vegetation productivity increased significantly in all altitudinal vegetation belts except MS, and the rate of increase was greatest (> 1.6 g C m−2 yr−1) in CF and AM. The altitudinal vegetation belts exhibited a positive correlation between climate factors and both GPP and NPP. However, climatic factors did not dominate the trend of increasing vegetative productivity. Notably, warming and drying did not lead to a significant increase in the VPD, further suggesting that the role of climatic factors in vegetation productivity was weak. We conclude that the sustained rise in global CO2 concentrations has dominated the significant increase in vegetation productivity in the altitudinal vegetation belts.

Author Contributions

Y.Z. (Yong Zhang): writing—original draft, validation, investigation and data curation; C.A.: funding acquisition and writing—original draft; L.J.: methodology, formal analysis, data curation and software; L.Z.: methodology and formal analysis; W.Z.: data curation, software and validation; B.T.: visualization, software and supervision; C.L.: data curation and software; Y.Z. (Yanzhen Zhang): formal analysis, data curation and validation. All authors have read and agreed to the published version of the manuscript.

Funding

National Natural Science Foundation of China [Grant number 42071102, 42220104001].

Data Availability Statement

No data was used for the research described in the article.

Acknowledgments

The authors would like to thank the ESA WorldCover team for providing land cover data at 10 m resolution (https://worldcover2021.esa.int/, accessed on 1 June 2023).

Conflicts of Interest

The authors declare that they have no known competing financial interests or personal relationships that could have appeared to influence the work reported in this paper.

References

  1. Xu, L.; Yu, G.; He, N.; Wang, Q.; Gao, Y.; Wen, D.; Li, S.; Niu, S.; Ge, J. Carbon Storage in China’s Terrestrial Ecosystems: A Synthesis. Sci. Rep. 2018, 8, 2806. [Google Scholar] [CrossRef] [PubMed]
  2. Seneviratne, S.I.; Rogelj, J.; Séférian, R.; Wartenburger, R.; Allen, M.R.; Cain, M.; Millar, R.J.; Ebi, K.L.; Ellis, N.; Hoegh-Guldberg, O.; et al. The Many Possible Climates from the Paris Agreement’s Aim of 1.5 °C Warming. Nature 2018, 558, 41–49. [Google Scholar] [CrossRef] [PubMed]
  3. Duan, H.; Zhou, S.; Jiang, K.; Bertram, C.; Harmsen, M.; Kriegler, E.; van Vuuren, D.P.; Wang, S.; Fujimori, S.; Tavoni, M.; et al. Assessing China’s Efforts to Pursue the 1.5 °C Warming Limit. Science 1979 2021, 372, 378–385. [Google Scholar] [CrossRef] [PubMed]
  4. Tang, X.; Zhao, X.; Bai, Y.; Tang, Z.; Wang, W.; Zhao, Y.; Wan, H.; Xie, Z.; Shi, X.; Wu, B.; et al. Carbon Pools in China’s Terrestrial Ecosystems: New Estimates Based on an Intensive Field Survey. Proc. Natl. Acad. Sci. USA 2018, 115, 4021–4026. [Google Scholar] [CrossRef] [PubMed]
  5. Al-Yaari, A.; Wigneron, J.; Ciais, P.; Reichstein, M.; Ballantyne, A.; Ogée, J.; Ducharne, A.; Swenson, J.J.; Frappart, F.; Fan, L.; et al. Asymmetric Responses of Ecosystem Productivity to Rainfall Anomalies Vary Inversely with Mean Annual Rainfall over the Conterminous United States. Glob. Chang. Biol. 2020, 26, 6959–6973. [Google Scholar] [CrossRef]
  6. Wang, L.; Gao, J.; Shen, W.; Shi, Y.; Zhang, H. Carbon Storage in Vegetation and Soil in Chinese Ecosystems Estimated by Carbon Transfer Rate Method. Ecosphere 2021, 12, e03341. [Google Scholar] [CrossRef]
  7. Wang, N.; Quesada, B.; Xia, L.; Butterbach-Bahl, K.; Goodale, C.L.; Kiese, R. Effects of Climate Warming on Carbon Fluxes in Grasslands—A Global Meta-analysis. Glob. Chang. Biol. 2019, 25, 1839–1851. [Google Scholar] [CrossRef]
  8. Sha, Z.; Bai, Y.; Li, R.; Lan, H.; Zhang, X.; Li, J.; Liu, X.; Chang, S.; Xie, Y. The Global Carbon Sink Potential of Terrestrial Vegetation Can Be Increased Substantially by Optimal Land Management. Commun. Earth Environ. 2022, 3, 8. [Google Scholar] [CrossRef]
  9. Ding, Z.; Peng, J.; Qiu, S.; Zhao, Y. Nearly Half of Global Vegetated Area Experienced Inconsistent Vegetation Growth in Terms of Greenness, Cover, and Productivity. Earths Future 2020, 8, e2020EF001618. [Google Scholar] [CrossRef]
  10. Robinson, N.P.; Allred, B.W.; Smith, W.K.; Jones, M.O.; Moreno, A.; Erickson, T.A.; Naugle, D.E.; Running, S.W. Terrestrial Primary Production for the Conterminous United States Derived from Landsat 30 m and MODIS 250 m. Remote Sens. Ecol. Conserv. 2018, 4, 264–280. [Google Scholar] [CrossRef]
  11. Hu, Q.; Li, T.; Deng, X.; Wu, T.; Zhai, P.; Huang, D.; Fan, X.; Zhu, Y.; Lin, Y.; Xiao, X.; et al. Intercomparison of Global Terrestrial Carbon Fluxes Estimated by MODIS and Earth System Models. Sci. Total Environ. 2022, 810, 152231. [Google Scholar] [CrossRef] [PubMed]
  12. He, Y.; Piao, S.; Li, X.; Chen, A.; Qin, D. Global Patterns of Vegetation Carbon Use Efficiency and Their Climate Drivers Deduced from MODIS Satellite Data and Process-Based Models. Agric. For. Meteorol. 2018, 256–257, 150–158. [Google Scholar] [CrossRef]
  13. Tian, C.; Yue, X.; Zhou, H.; Lei, Y.; Ma, Y.; Cao, Y. Projections of Changes in Ecosystem Productivity under 1.5 °C and 2 °C Global Warming. Glob. Planet. Change 2021, 205, 103588. [Google Scholar] [CrossRef]
  14. Khalifa, M.; Elagib, N.A.; Ribbe, L.; Schneider, K. Spatio-Temporal Variations in Climate, Primary Productivity and Efficiency of Water and Carbon Use of the Land Cover Types in Sudan and Ethiopia. Sci. Total Environ. 2018, 624, 790–806. [Google Scholar] [CrossRef]
  15. He, Q.; Zhou, G.; Lü, X.; Zhou, M. Climatic Suitability and Spatial Distribution for Summer Maize Cultivation in China at 1.5 and 2.0 °C Global Warming. Sci. Bull. 2019, 64, 690–697. [Google Scholar] [CrossRef]
  16. Zhang, Y.; Huang, K.; Zhang, T.; Zhu, J.; Di, Y. Soil Nutrient Availability Regulated Global Carbon Use Efficiency. Glob. Planet. Change 2019, 173, 47–52. [Google Scholar] [CrossRef]
  17. Sun, Z.; Wang, X.; Yamamoto, H.; Tani, H.; Zhong, G.; Yin, S.; Guo, E. Spatial Pattern of GPP Variations in Terrestrial Ecosystems and Its Drivers: Climatic Factors, CO2 Concentration and Land-Cover Change, 1982–2015. Ecol Inf. 2018, 46, 156–165. [Google Scholar] [CrossRef]
  18. Wei, D.; Qi, Y.; Ma, Y.; Wang, X.; Ma, W.; Gao, T.; Huang, L.; Zhao, H.; Zhang, J.; Wang, X. Plant Uptake of CO2 Outpaces Losses from Permafrost and Plant Respiration on the Tibetan Plateau. Proc. Natl. Acad. Sci. USA 2021, 118, e2015283118. [Google Scholar] [CrossRef]
  19. Shi, L.; Lin, Z.; Tang, S.; Peng, C.; Yao, Z.; Xiao, Q.; Zhou, H.; Liu, K.; Shao, X. Interactive Effects of Warming and Managements on Carbon Fluxes in Grasslands: A Global Meta-Analysis. Agric. Ecosyst. Environ. 2022, 340, 108178. [Google Scholar] [CrossRef]
  20. Yuan, F.; Liu, J.; Zuo, Y.; Guo, Z.; Wang, N.; Song, C.; Wang, Z.; Sun, L.; Guo, Y.; Song, Y.; et al. Rising Vegetation Activity Dominates Growing Water Use Efficiency in the Asian Permafrost Region from 1900 to 2100. Sci. Total Environ. 2020, 736, 139587. [Google Scholar] [CrossRef]
  21. Wang, Y.; Hu, J.; Yang, Y.; Li, R.; Peng, C.; Zheng, H. Climate Change Will Reduce the Carbon Use Efficiency of Terrestrial Ecosystems on the Qinghai-Tibet Plateau: An Analysis Based on Multiple Models. Forests 2020, 12, 12. [Google Scholar] [CrossRef]
  22. Lin, S.; Wang, G.; Feng, J.; Dan, L.; Sun, X.; Hu, Z.; Chen, X.; Xiao, X. A Carbon Flux Assessment Driven by Environmental Factors Over the Tibetan Plateau and Various Permafrost Regions. J. Geophys. Res. Biogeosci 2019, 124, 1132–1147. [Google Scholar] [CrossRef]
  23. Kang, X.; Li, Y.; Wang, J.; Yan, L.; Zhang, X.; Wu, H.; Yan, Z.; Zhang, K.; Hao, Y. Precipitation and Temperature Regulate the Carbon Allocation Process in Alpine Wetlands: Quantitative Simulation. J. Soils Sedim. 2020, 20, 3300–3315. [Google Scholar] [CrossRef]
  24. Song, L.; Li, Y.; Ren, Y.; Wu, X.; Guo, B.; Tang, X.; Shi, W.; Ma, M.; Han, X.; Zhao, L. Divergent Vegetation Responses to Extreme Spring and Summer Droughts in Southwestern China. Agric. For. Meteorol. 2019, 279, 107703. [Google Scholar] [CrossRef]
  25. Chen, Y.; Feng, X.; Tian, H.; Wu, X.; Gao, Z.; Feng, Y.; Piao, S.; Lv, N.; Pan, N.; Fu, B. Accelerated Increase in Vegetation Carbon Sequestration in China after 2010: A Turning Point Resulting from Climate and Human Interaction. Glob. Chang. Biol. 2021, 27, 5848–5864. [Google Scholar] [CrossRef]
  26. Liu, X.; Ma, Q.; Yu, H.; Li, Y.; Li, L.; Qi, M.; Wu, W.; Zhang, F.; Wang, Y.; Zhou, G.; et al. Climate Warming-Induced Drought Constrains Vegetation Productivity by Weakening the Temporal Stability of the Plant Community in an Arid Grassland Ecosystem. Agric. For. Meteorol. 2021, 307, 108526. [Google Scholar] [CrossRef]
  27. He, Y.; Yan, W.; Cai, Y.; Deng, F.; Qu, X.; Cui, X. How Does the Net Primary Productivity Respond to the Extreme Climate under Elevation Constraints in Mountainous Areas of Yunnan, China? Ecol. Indic. 2022, 138, 108817. [Google Scholar] [CrossRef]
  28. Yan, M.; Tian, X.; Li, Z.; Chen, E.; Li, C.; Fan, W. A Long-Term Simulation of Forest Carbon Fluxes over the Qilian Mountains. Int. J. Appl. Earth Obs. Geoinf. 2016, 52, 515–526. [Google Scholar] [CrossRef]
  29. Zhang, Y.; Hu, Q.; Zou, F. Spatio-Temporal Changes of Vegetation Net Primary Productivity and Its Driving Factors on the Qinghai-Tibetan Plateau from 2001 to 2017. Remote Sens. 2021, 13, 1566. [Google Scholar] [CrossRef]
  30. Wang, L.; Zhang, Y.; Berninger, F.; Duan, B. Net Primary Production of Chinese Fir Plantation Ecosystems and Its Relationship to Climate. Biogeosciences 2014, 11, 5595–5606. [Google Scholar] [CrossRef]
  31. Rumpf, S.B.; Gravey, M.; Brönnimann, O.; Luoto, M.; Cianfrani, C.; Mariethoz, G.; Guisan, A. From White to Green: Snow Cover Loss and Increased Vegetation Productivity in the European Alps. Science 1979 2022, 376, 1119–1122. [Google Scholar] [CrossRef] [PubMed]
  32. Xie, X.; Tian, J.; Wu, C.; Li, A.; Jin, H.; Bian, J.; Zhang, Z.; Nan, X.; Jin, Y. Long-Term Topographic Effect on Remotely Sensed Vegetation Index-Based Gross Primary Productivity (GPP) Estimation at the Watershed Scale. Int. J. Appl. Earth Obs. Geoinf. 2022, 108, 102755. [Google Scholar] [CrossRef]
  33. Lian, X.; Piao, S.; Chen, A.; Huntingford, C.; Fu, B.; Li, L.Z.X.; Huang, J.; Sheffield, J.; Berg, A.M.; Keenan, T.F.; et al. Multifaceted Characteristics of Dryland Aridity Changes in a Warming World. Nat. Rev. Earth Environ. 2021, 2, 232–250. [Google Scholar] [CrossRef]
  34. Lu, Y.; Xu, X.; Zhao, J.; Han, F. Spatiotemporal Evolution of Mountainous Ecosystem Services in an Arid Region and Its Influencing Factors: A Case Study of the Tianshan Mountains in Xinjiang. Land 2022, 11, 2164. [Google Scholar] [CrossRef]
  35. Zhu, S.; Li, C.; Shao, H.; Ju, W.; Lv, N. The Response of Carbon Stocks of Drylands in Central Asia to Changes of CO2 and Climate during Past 35 years. Sci. Total Environ. 2019, 687, 330–340. [Google Scholar] [CrossRef]
  36. Liu, L.; Guan, J.; Han, W.; Ju, X.; Mu, C.; Zheng, J. Quantitative Assessment of the Relative Contributions of Climate and Human Factors to Net Primary Productivity in the Ili River Basin of China and Kazakhstan. Chin. Geogr. Sci. 2022, 32, 1069–1082. [Google Scholar] [CrossRef]
  37. Zhang, Y.; An, C.; Liu, L.; Zhang, Y.; Lu, C.; Zhang, W. High Mountains Becoming Wetter While Deserts Getting Drier in Xinjiang, China since the 1980s. Land 2021, 10, 1131. [Google Scholar] [CrossRef]
  38. Zhang, Y.; Liu, L.; Liu, Y.; Zhang, M.; An, C. Response of Altitudinal Vegetation Belts of the Tianshan Mountains in Northwestern China to Climate Change during 1989–2015. Sci. Rep. 2021, 11, 4870. [Google Scholar] [CrossRef]
  39. Zhang, Y.; An, C.-B.; Liu, L.-Y.; Zhang, Y.-Z.; Lu, C.; Zhang, W.-S. High-Elevation Landforms Are Experiencing More Remarkable Wetting Trends in Arid Central Asia. Adv. Clim. Change Res. 2022, 13, 489–495. [Google Scholar] [CrossRef]
  40. Zhang, B.; Mo, S.; Wu, H.; Xiao, F. Digital Spectra and Analysis of Altitudinal Belts in Tianshan Mountains, China. J. Mt. Sci. 2004, 1, 18–28. [Google Scholar] [CrossRef]
  41. Zhang, Y.; An, C.; Zheng, L.; Liu, L.; Zhang, W.; Lu, C.; Zhang, Y. Assessment of Lake Area in Response to Climate Change at Varying Elevations: A Case Study of Mt. Tianshan, Central Asia. Sci. Total Environ. 2023, 869, 161665. [Google Scholar] [CrossRef] [PubMed]
  42. Roffe, S.J.; van der Walt, A.J. Representation and Evaluation of Southern Africa’s Seasonal Mean and Extreme Temperatures in the ERA5-Based Reanalysis Products. Atmos. Res. 2023, 284, 106591. [Google Scholar] [CrossRef]
  43. Abatzoglou, J.T.; Dobrowski, S.Z.; Parks, S.A.; Hegewisch, K.C. TerraClimate, a High-Resolution Global Dataset of Monthly Climate and Climatic Water Balance from 1958–2015. Sci. Data 2018, 5, 170191. [Google Scholar] [CrossRef] [PubMed]
  44. Noguera, I.; Vicente-Serrano, S.M.; Peña-Angulo, D.; Domínguez-Castro, F.; Juez, C.; Tomás-Burguera, M.; Lorenzo-Lacruz, J.; Azorin-Molina, C.; Halifa-Marín, A.; Fernández-Duque, B.; et al. Assessment of Vapor Pressure Deficit Variability and Trends in Spain and Possible Connections with Soil Moisture. Atmos. Res. 2023, 285, 106666. [Google Scholar] [CrossRef]
  45. Stephens, B.B.; Gurney, K.R.; Tans, P.P.; Sweeney, C.; Peters, W.; Bruhwiler, L.; Ciais, P.; Ramonet, M.; Bousquet, P.; Nakazawa, T.; et al. Weak Northern and Strong Tropical Land Carbon Uptake from Vertical Profiles of Atmospheric CO2. Science 1979 2007, 316, 1732–1735. [Google Scholar] [CrossRef]
  46. Sweeney, C.; Karion, A.; Wolter, S.; Newberger, T.; Guenther, D.; Higgs, J.A.; Andrews, A.E.; Lang, P.M.; Neff, D.; Dlugokencky, E.; et al. Seasonal Climatology of CO2 across North America from Aircraft Measurements in the NOAA/ESRL Global Greenhouse Gas Reference Network. J. Geophys. Res. Atmos. 2015, 120, 5155–5190. [Google Scholar] [CrossRef]
  47. Cheng, S.; An, X.; Zhou, L.; Tans, P.P.; Jacobson, A. Atmospheric CO2 at Waliguan Station in China: Transport Climatology, Temporal Patterns and Source-Sink Region Representativeness. Atmos. Environ. 2017, 159, 107–116. [Google Scholar] [CrossRef]
  48. Wang, N.; Zhang, X.; Yao, S.; Wu, J.; Xia, H. How Good Are Global Layers for Mapping Rural Settlements? Evidence from China. Land 2022, 11, 1308. [Google Scholar] [CrossRef]
  49. Zhao, X.; Su, Y.; Hu, T.; Chen, L.; Gao, S.; Wang, R.; Jin, S.; Guo, Q. A Global Corrected SRTM DEM Product for Vegetated Areas. Remote Sens. Lett. 2018, 9, 393–402. [Google Scholar] [CrossRef]
  50. Wang, L.; Zhu, H.; Lin, A.; Zou, L.; Qin, W.; Du, Q. Evaluation of the Latest MODIS GPP Products across Multiple Biomes Using Global Eddy Covariance Flux Data. Remote Sens. 2017, 9, 418. [Google Scholar] [CrossRef]
  51. Yao, J.; Liu, H.; Huang, J.; Gao, Z.; Wang, G.; Li, D.; Yu, H.; Chen, X. Accelerated Dryland Expansion Regulates Future Variability in Dryland Gross Primary Production. Nat. Commun. 2020, 11, 1665. [Google Scholar] [CrossRef] [PubMed]
  52. Rukh, S.; Schad, T.; Strer, M.; Natkhin, M.; Krüger, I.; Raspe, S.; Eickenscheidt, N.; Hentschel, R.; Hölscher, A.; Reiter, P.; et al. Interpolated Daily Temperature and Precipitation Data for Level II ICP Forests Plots in Germany. Ann. For. Sci. 2022, 79, 47. [Google Scholar] [CrossRef]
  53. Song, Y.; Jiao, W.; Wang, J.; Wang, L. Increased Global Vegetation Productivity Despite Rising Atmospheric Dryness Over the Last Two Decades. Earths Future 2022, 10, e2021EF002634. [Google Scholar] [CrossRef]
  54. Wang, Y.; Dai, E.; Wu, C. Spatiotemporal Heterogeneity of Net Primary Productivity and Response to Climate Change in the Mountain Regions of Southwest China. Ecol. Indic. 2021, 132, 108273. [Google Scholar] [CrossRef]
  55. Xu, H.; Zhao, C.; Wang, X. Spatiotemporal Differentiation of the Terrestrial Gross Primary Production Response to Climate Constraints in a Dryland Mountain Ecosystem of Northwestern China. Agric. For. Meteorol. 2019, 276–277, 107628. [Google Scholar] [CrossRef]
  56. Moore, C.E.; Meacham-Hensold, K.; Lemonnier, P.; Slattery, R.A.; Benjamin, C.; Bernacchi, C.J.; Lawson, T.; Cavanagh, A.P. The Effect of Increasing Temperature on Crop Photosynthesis: From Enzymes to Ecosystems. J. Exp. Bot. 2021, 72, 2822–2844. [Google Scholar] [CrossRef]
  57. Liberati, D.; Guidolotti, G.; Dato, G.; De Angelis, P. Enhancement of Ecosystem Carbon Uptake in a Dry Shrubland under Moderate Warming: The Role of Nitrogen-driven Changes in Plant Morphology. Glob. Chang. Biol. 2021, 27, 5629–5642. [Google Scholar] [CrossRef]
  58. Liu, H.; Lu, C.; Wang, S.; Ren, F.; Wang, H. Climate Warming Extends Growing Season but Not Reproductive Phase of Terrestrial Plants. Glob. Ecol. Biogeogr. 2021, 30, 950–960. [Google Scholar] [CrossRef]
  59. Liu, B.; Zhou, T. Atmospheric Footprint of the Recent Warming Slowdown. Sci. Rep. 2017, 7, 40947. [Google Scholar] [CrossRef]
  60. Kosaka, Y.; Xie, S.-P. Recent Global-Warming Hiatus Tied to Equatorial Pacific Surface Cooling. Nature 2013, 501, 403–407. [Google Scholar] [CrossRef]
  61. Ballantyne, A.; Smith, W.; Anderegg, W.; Kauppi, P.; Sarmiento, J.; Tans, P.; Shevliakova, E.; Pan, Y.; Poulter, B.; Anav, A.; et al. Accelerating Net Terrestrial Carbon Uptake during the Warming Hiatus Due to Reduced Respiration. Nat. Clim. Chang. 2017, 7, 148–152. [Google Scholar] [CrossRef]
  62. Kusumi, K.; Hirotsuka, S.; Kumamaru, T.; Iba, K. Increased Leaf Photosynthesis Caused by Elevated Stomatal Conductance in a Rice Mutant Deficient in SLAC1, a Guard Cell Anion Channel Protein. J. Exp. Bot. 2012, 63, 5635–5644. [Google Scholar] [CrossRef] [PubMed]
  63. Li, Y.; Li, H.; Li, Y.; Zhang, S. Improving Water-Use Efficiency by Decreasing Stomatal Conductance and Transpiration Rate to Maintain Higher Ear Photosynthetic Rate in Drought-Resistant Wheat. Crop J. 2017, 5, 231–239. [Google Scholar] [CrossRef]
  64. Marchin, R.M.; Backes, D.; Ossola, A.; Leishman, M.R.; Tjoelker, M.G.; Ellsworth, D.S. Extreme Heat Increases Stomatal Conductance and Drought-induced Mortality Risk in Vulnerable Plant Species. Glob. Chang. Biol. 2022, 28, 1133–1146. [Google Scholar] [CrossRef] [PubMed]
  65. Madani, N.; Parazoo, N.C.; Kimball, J.S.; Ballantyne, A.P.; Reichle, R.H.; Maneta, M.; Saatchi, S.; Palmer, P.I.; Liu, Z.; Tagesson, T. Recent Amplified Global Gross Primary Productivity Due to Temperature Increase Is Offset by Reduced Productivity Due to Water Constraints. AGU Adv. 2020, 1, e2020AV000180. [Google Scholar] [CrossRef]
  66. Yuan, W.; Zheng, Y.; Piao, S.; Ciais, P.; Lombardozzi, D.; Wang, Y.; Ryu, Y.; Chen, G.; Dong, W.; Hu, Z.; et al. Increased Atmospheric Vapor Pressure Deficit Reduces Global Vegetation Growth. Sci. Adv. 2019, 5, aax1396. [Google Scholar] [CrossRef]
  67. Chen, S.; Zhang, Y.; Wu, Q.; Liu, S.; Song, C.; Xiao, J.; Band, L.E.; Vose, J.M. Vegetation Structural Change and CO2 Fertilization More than Offset Gross Primary Production Decline Caused by Reduced Solar Radiation in China. Agric. For. Meteorol. 2021, 296, 108207. [Google Scholar] [CrossRef]
  68. Wang, S.; Zhang, Y.; Ju, W.; Chen, J.M.; Ciais, P.; Cescatti, A.; Sardans, J.; Janssens, I.A.; Wu, M.; Berry, J.A.; et al. Recent Global Decline of CO2 Fertilization Effects on Vegetation Photosynthesis. Science 1979 2020, 370, 1295–1300. [Google Scholar] [CrossRef]
  69. Huerta, A.; Bonnesoeur, V.; Cuadros-Adriazola, J.; Gutierrez, L.; Ochoa-Tocachi, B.F.; Román-Dañobeytia, F.; Lavado-Casimiro, W. PISCOeo_pm, a Reference Evapotranspiration Gridded Database Based on FAO Penman-Monteith in Peru. Sci. Data 2022, 9, 328. [Google Scholar] [CrossRef]
  70. Kou, D.; Ma, W.; Ding, J.; Zhang, B.; Fang, K.; Hu, H.; Yu, J.; Wang, T.; Qin, S.; Zhao, X.; et al. Dryland Soils in Northern China Sequester Carbon during the Early 2000s Warming Hiatus Period. Funct. Ecol. 2018, 32, 1620–1630. [Google Scholar] [CrossRef]
  71. Huang, J.; Liu, W.; Yang, S.; Yang, L.; Peng, Z.; Deng, M.; Xu, S.; Zhang, B.; Ahirwal, J.; Liu, L. Plant Carbon Inputs through Shoot, Root, and Mycorrhizal Pathways Affect Soil Organic Carbon Turnover Differently. Soil. Biol. Biochem. 2021, 160, 108322. [Google Scholar] [CrossRef]
  72. Dintwe, K.; Okin, G.S. Soil Organic Carbon in Savannas Decreases with Anthropogenic Climate Change. Geoderma 2018, 309, 7–16. [Google Scholar] [CrossRef]
Figure 1. Composition and distribution of major vegetation types in the Tianshan Mountains. (a) Spatial distribution of land cover. (b) Composition and climatic characteristics (average annual precipitation and temperature) of altitudinal vegetation belts. (c) Percentage of area of major vegetation types. Land cover data were obtained from ESA WorldCover open access (https://worldcover2021.esa.int/, accessed on 3 May 2023).
Forests 14 02189 g001
Figure 2. Spatial patterns of vegetation belts at different altitudes.
Forests 14 02189 g002
Figure 3. Climate tendency in the Tianshan Mountains from 2000 to 2021. (a) Interannual tendencies of MAT (℃ yr−1) and (b) PRE (mm yr−1) in the Tianshan Mountains. Areas marked with black dots indicate statistically significant trends at the 95% confidence level.
Forests 14 02189 g003
Figure 4. Average MAT (°C decade−1) and PRE (mm decade−1) trends across different altitudinal vegetation belts. The meaning of the abbreviation for each vegetation belt is shown in Table 1. The significance test was not passed by the MAT and PRE trends for all altitudinal vegetation belts (p > 0.05).
Forests 14 02189 g004
Figure 5. Mean VPD of different altitudinal vegetation belts during the growing season. Gray dashed lines are linear trend lines.
Forests 14 02189 g005
Figure 6. Temporal trend in GPP during the growing season from 2000 to 2021. (a) Spatial patterns of GPP trends (unit is g C m−2 yr−1) during the growing season in the Tianshan Mountains. The area surrounded by the solid black line is the study area; the gray region is the non-vegetated area. The black dots represent statistically significant trends at the 0.05 level. (b) Interannual variability in regional mean GPP (y-axis unit is g C m−2 yr−1) in lower elevation altitudinal vegetation belts. (c) Interannual variability in regional mean GPP (y-axis unit is g C m−2 yr−1) in higher elevation altitudinal vegetation belts.
Forests 14 02189 g006
Figure 7. Spatial and temporal variations in growing season NPP from 2000 to 2021. (a) Spatial patterns of NPP trends (unit is g C m−2 yr−1) during the study epoch in the Tianshan Mountains. The interpretation of the black dots in the figure remains consistent with that in Figure 6. (b) Interannual variability in regional mean GPP (y-axis unit is g C m−2 yr−1) in lower elevation altitudinal vegetation belts. (c) Interannual variability in regional mean GPP (y-axis unit is g C m−2 yr−1) in higher elevation altitudinal vegetation belts.
Forests 14 02189 g007
Figure 8. Correlation matrix plot of climatic variables and growing season vegetation productivity. (a) Correlation coefficients of GPP and climate variables for different altitudinal vegetation belts. (b) As in panel (a), but for NPP. Asterisks indicate that the correlation passed the significance test: p < 0.05 *, p < 0.01 **, p < 0.001 ***.
Forests 14 02189 g008
Figure 9. Correlation between vegetation productivity and CO2 concentration (ppm) in this time series. (a) Correlation coefficients between GPP in altitudinal vegetation belts and CO2 concentration for 2000–2021. (b) As in panel (a), but for NPP.
Forests 14 02189 g009
Table 1. Reclassification information of major vegetation types based on ESA WorldCover data.
WorldCover CategoriesReclassification CategoriesElevation Ranges (m)Abbreviations
Main Vegetation TypesAltitudinal Vegetation Belts
Sparse vegetationCushion vegetation3200–3600CV
Desert steppe<1100DS
GrasslandAlpine meadow2800–3200AM
Montane steppe1100–1550MS
Tree coverConiferous forest1550–2800CF
Note: The specific elevational range of each altitudinal vegetation belt was obtained from the results of [40]. This range represents the optimal elevation for the distribution of each vegetation type.
Disclaimer/Publisher’s Note: The statements, opinions and data contained in all publications are solely those of the individual author(s) and contributor(s) and not of MDPI and/or the editor(s). MDPI and/or the editor(s) disclaim responsibility for any injury to people or property resulting from any ideas, methods, instructions or products referred to in the content.

