
Social Value of Urban Green Space Based on Visitors’ Perceptions: The Case of the Summer Palace, Beijing, China
 ,
,
Abstract
:1. Introduction
2. Theoretical Analysis and Research Hypothesis
2.1. Theoretical Analysis
2.1.1. Definition and Classification of the Social Value of Ecosystem Services
2.1.2. Assessing the Social Value of Ecosystem Services in Urban Green Spaces
2.2. Research Hypothesis
2.2.1. Environmental Landscape Features and Social Value Distribution
2.2.2. Individual Environmental Values and Perceived Social Values
3. Research Design
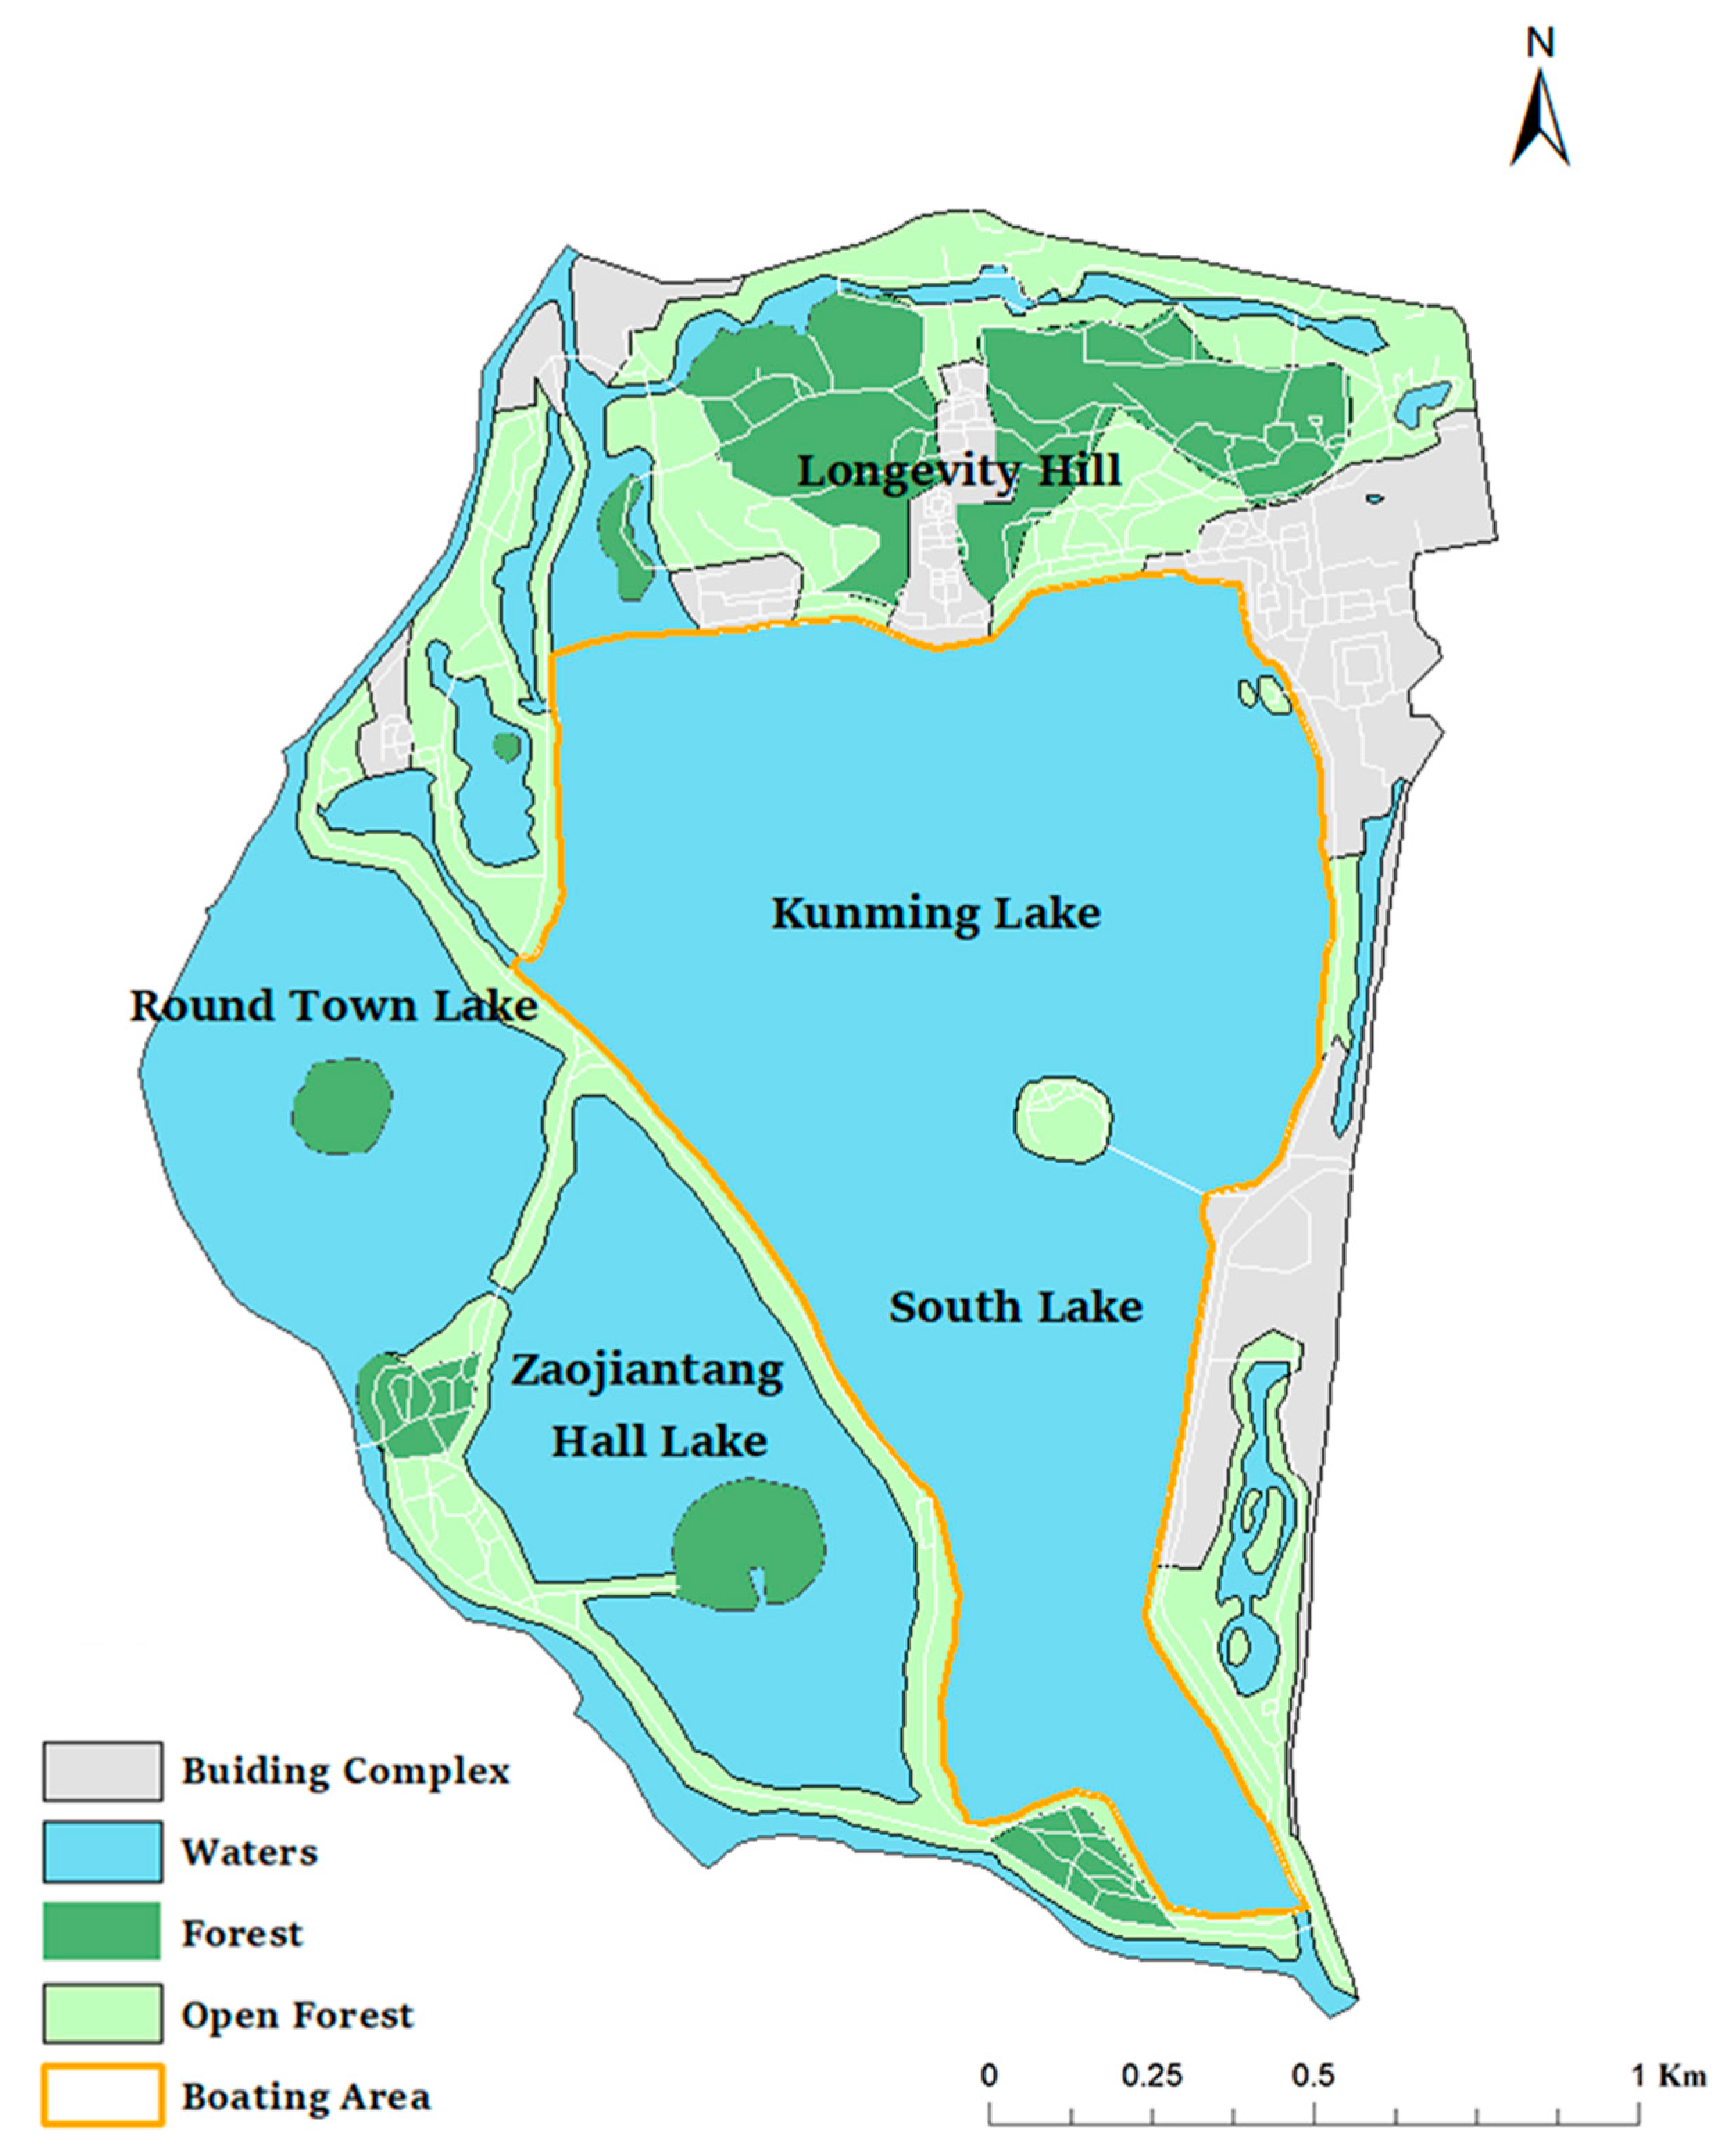
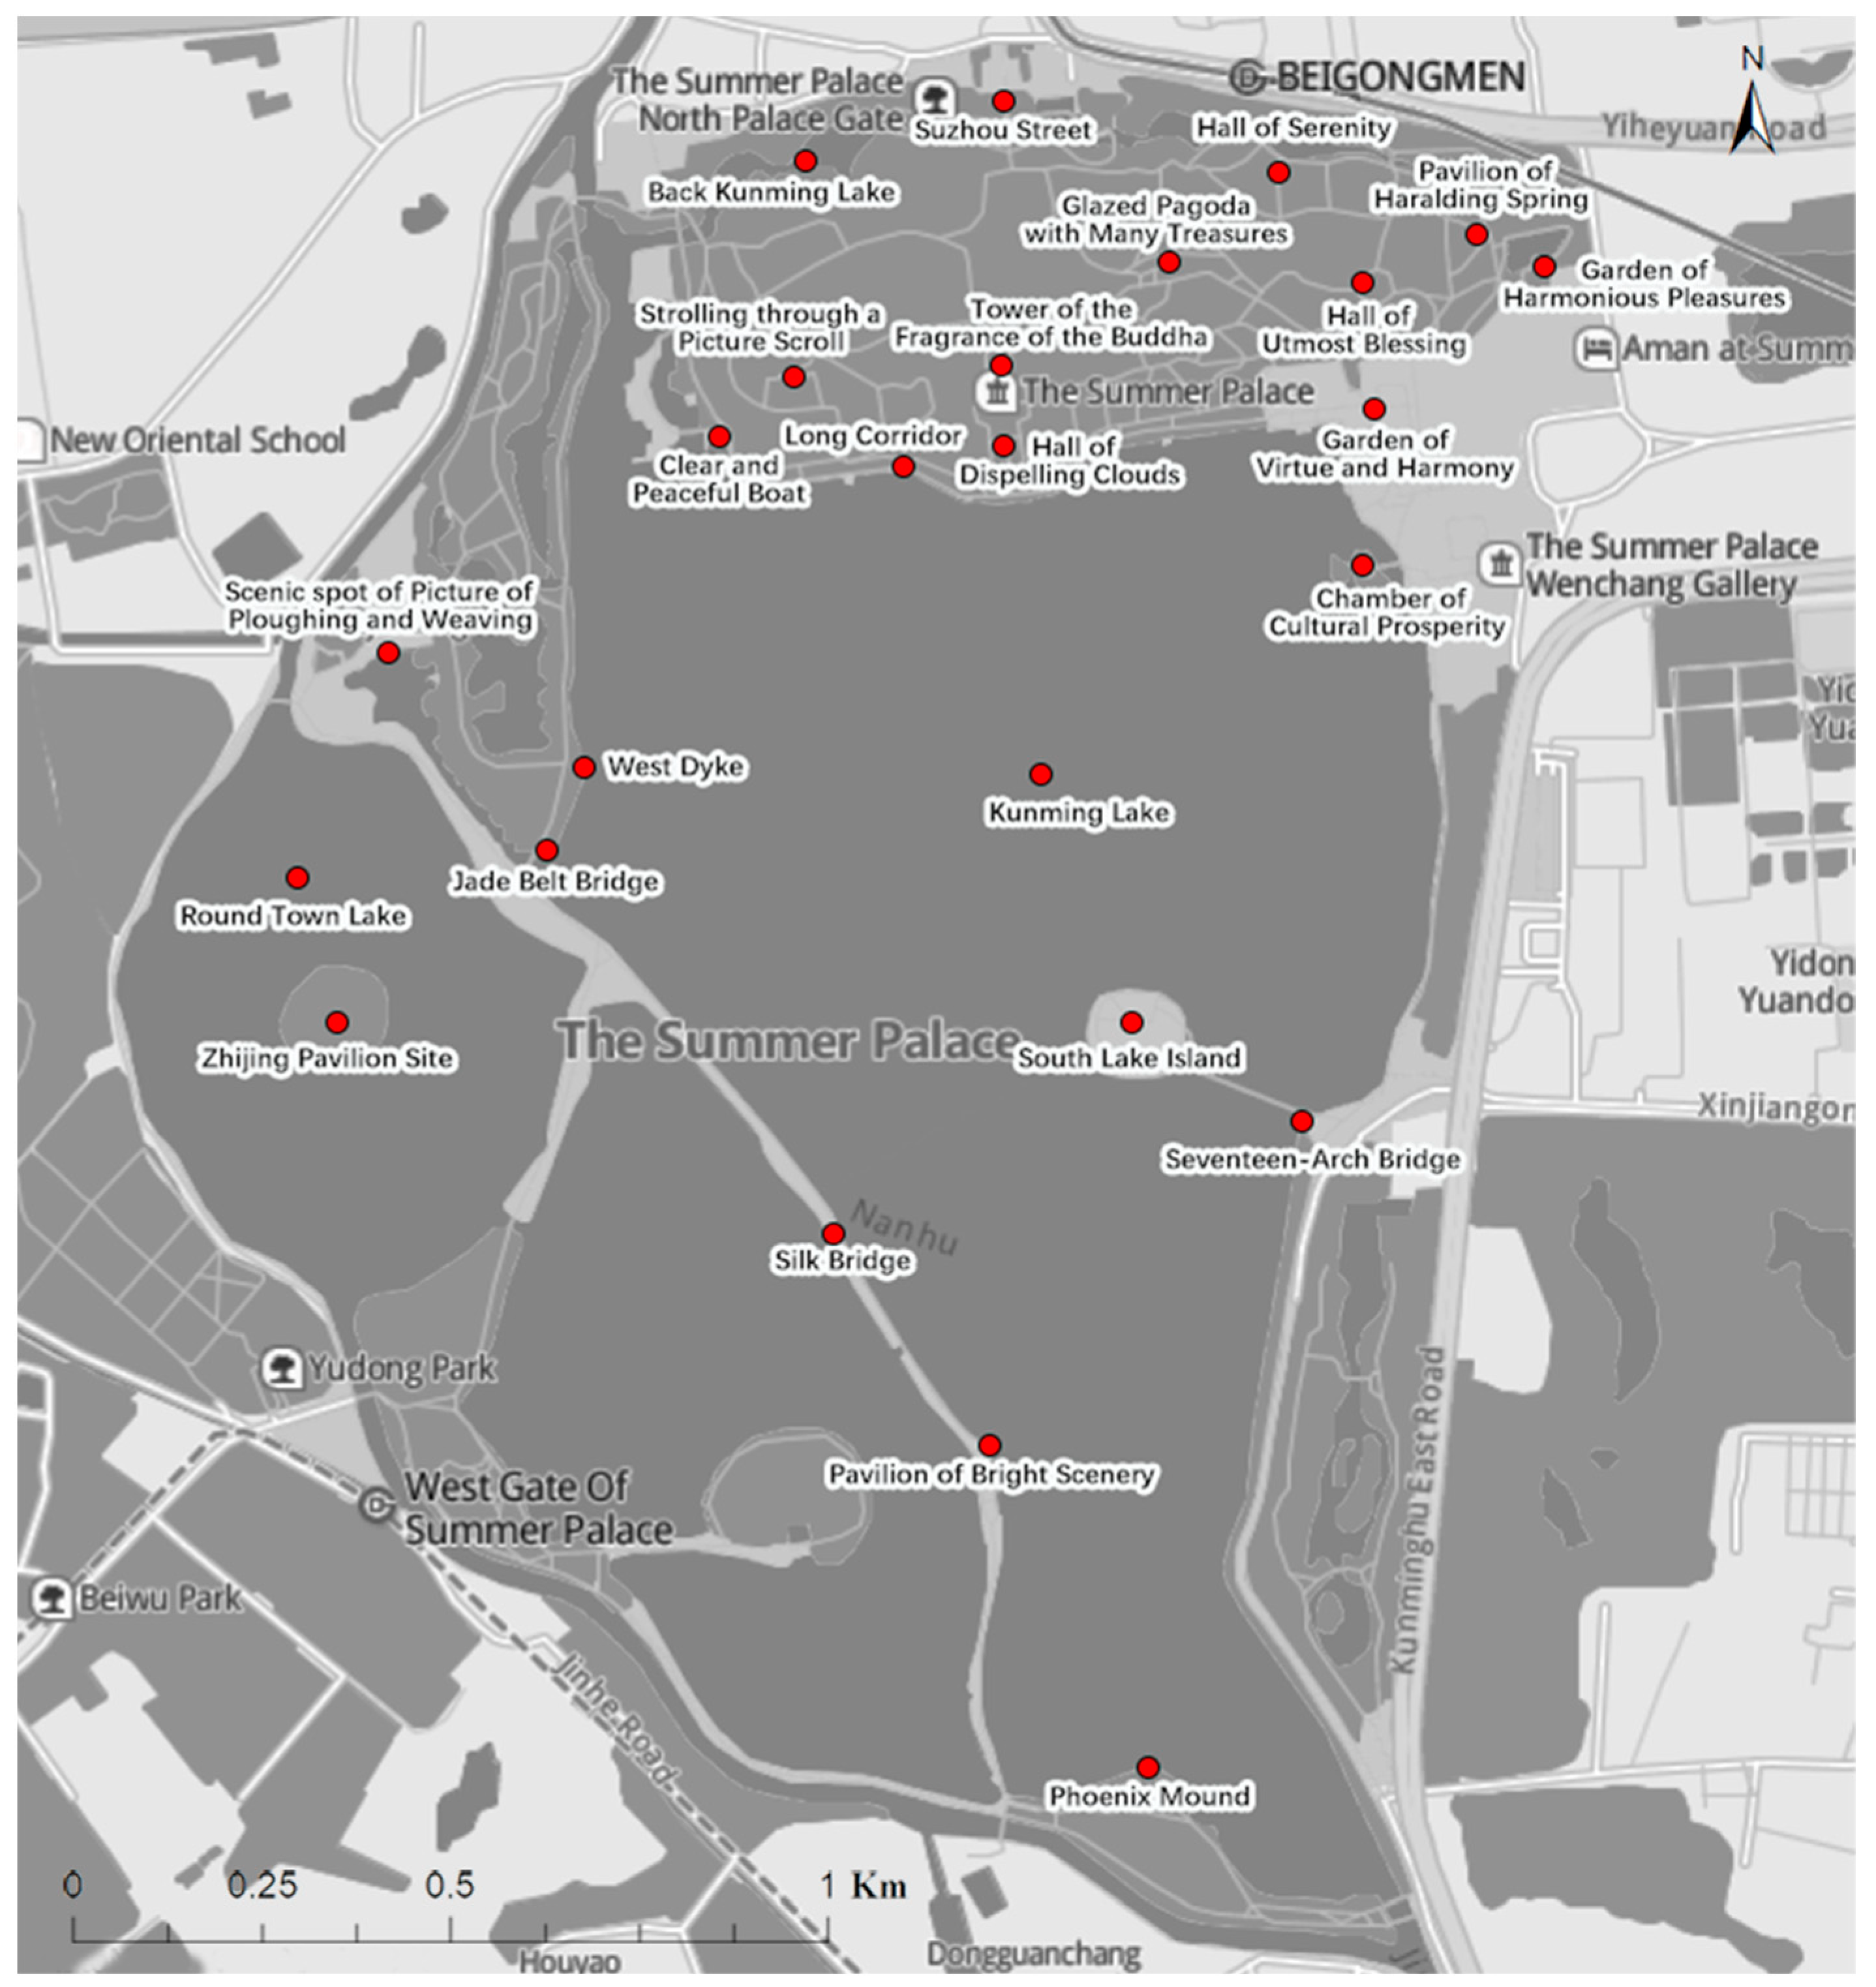
3.1. Study Area
3.2. Questionnaire Design
3.3. Data Acquisition and Processing
3.3.1. Survey Data
3.3.2. Spatial Data
3.3.3. Analysis Methods
4. Results and Analysis
4.1. Attributes of Social Value Users of Ecosystems in the Summer Palace
4.2. Relationships between Social Values and Negative Services of Ecosystems and Landscape Types
4.3. Correlation Analysis of Social Values and Negative Services of Ecosystems in the Summer Palace
4.4. Degree of Preference for Social Values of in the Summer Palace
4.5. Spatial Distribution of Social Value Points in the Summer Palace
4.6. Relationships between Spatial Distribution of Social Values and Landscape Type in the Summer Palace
4.7. Influence of Environmental Values on the Spatial Distribution of Social Values Perceived by Visitors in the Summer Palace
5. Discussion and Insights
6. Conclusions
Author Contributions
Funding
Institutional Review Board Statement
Informed Consent Statement
Data Availability Statement
Conflicts of Interest
References
- The General Office of the Central Committee of the Communist Party of China and the State Council. Opinions on Establishing a Sound Mechanism for Realizing the Value of Ecological Products. Bull. State Counc. People’s Repub. China 2021, 14, 11–15. [Google Scholar]
- Seymour, E.; Curtis, A.; Pannell, D.; Allan, C.; Roberts, A. Understanding the role of assigned values in natural resource management. Australas. J. Environ. Manag. 2010, 17, 142–153. [Google Scholar] [CrossRef]
- Yan, G.; Kang, L.; Qiao, M.; Ying, L.; Yaning, F.; Xiuqing, L.; Chao, G. Social valuation of ecosystem services based on SolVES model and tourists’ preferences-A case study of Taibai Mountain National Forest Park. J. Ecol. 2017, 36, 3564–3573. [Google Scholar]
- Lijuan, W. Progress and Trend of Research on Valuation of Forest Ecosystem Service Function. J. Ecol. 2013, 32, 2229–2237. [Google Scholar]
- Nora, F.A.; Niina, K.A.; Festo, N.B.; Miza, K.C. Community stakeholders’ knowledge in landscape assessments—Mapping indicators for landscape services. Ecol. Indic. 2012, 18, 421–433. [Google Scholar]
- Yujiu, X.; Shaohua, Z.; Chunhua, Y.; Guoyu, Q.; Hua, S.; Yanlin, W.; Longjun, Q. Discussion on multi-scale monitoring and evaluation methods of urban green space resources. Remote Sens. Land Resour. 2021, 33, 54–62. [Google Scholar]
- Yaru, Z.; Jun, G.; Zhenhua, B.; Zhonghao, Z.; Jing, F. Research on landscape service assessment and spatial structure based on Public Participation Geographic Information Systems method. J. Earth Inf. Sci. 2020, 22, 1106–1119. [Google Scholar]
- Zafar, T.B.; Ding, W.; Din, S.U.; Khan, G.M.; Hao, C.; He, L. Forest cover and land use map of the Chunati Wildlife Sanctuary based on participatory mapping and satellite images: Insight into Chunati beat. Land Use Policy 2021, 103, 105193. [Google Scholar] [CrossRef]
- Rice, W.L.; Taff, B.D.; Newman, P.; Zipp, K.Y.; Pan, B. Identifying recreational ecosystem service areas of concern in Grand Canyon National Park: A participatory mapping approach. Appl. Geogr. 2020, 125, 102353. [Google Scholar] [CrossRef]
- Bryan, B.A.; Raymond, C.M.; Crossman, N.D. Targeting the management of ecosystem services based on social values: Where, what, and how? Landsc. Urban Plan. 2010, 97, 111–122. [Google Scholar] [CrossRef]
- Plieninger, T.; Dijks, S.; Oteros-Rozas, E.; Bieling, C. Assessing, mapping, and quantifying cultural ecosystem services at community level. Land Use Policy 2013, 33, 118–129. [Google Scholar] [CrossRef]
- Rachel, D.; Zoë, L. Quantifying and mapping ecosystem service use across stakeholder groups: Implications for conservation with priorities for cultural values. Ecosyst. Serv. 2015, 13, 153–161. [Google Scholar]
- Liangeng, D.; Wenbo, Z.; Yang, G.; Shuangcheng, L. Progress of research on ecosystem cultural services. J. Peking Univ. (Nat. Sci. Ed.) 2014, 50, 1155–1162. [Google Scholar]
- Qizheng, M.; Ganlin, H.; Jianguo, W. A review of urban ecosystem service research. J. Appl. Ecol. 2015, 26, 1023–1033. [Google Scholar]
- Greg, B.; Nora, F. Empirical PPGIS/PGIS mapping of ecosystem services: A review and evaluation. Ecosyst. Serv. 2015, 13, 119–133. [Google Scholar]
- Michael, L. Humans Valuing Nature: Synthesising Insights from Philosophy, Psychology and Economics. Environ. Values 1999, 8, 381–401. [Google Scholar]
- Yechen, Z.; Hongmei, Z.; Hu, Y. Social valuation of ecosystem services based on tourists’ perceptions-A case study of Qianjiangyuan National Park. Tour. Sci. 2020, 34, 66–85. [Google Scholar]
- Greg, B.; Lars, B. An analysis of the relationships between multiple values and physical landscapes at a regional scale using public participation GIS and landscape character classification. Landsc. Urban Plan. 2012, 107, 317–331. [Google Scholar]
- Harmon, D.; Putney, A.D. The Full Value of Parks: From Economics to the Intangible; Rowman & Littlefield Publishers: Lanham, MD, USA, 2003. [Google Scholar]
- Benson, C.S.; Darius, J.S.; Jessica, M.C. An application of Social Values for Ecosystem Services (SolVES) to three national forests in Colorado and Wyoming. Ecol. Indic. 2014, 36, 68–79. [Google Scholar]
- Brown, G.; Reed, P. Validation of a Forest Values Typlogy for Use in National Forest Planning. For. Sci. 2000, 46, 240–247. [Google Scholar]
- Sherrouse, B.C.; Clement, J.M.; Semmens, D.J. A GIS application for assessing, mapping, and quantifying the social values of ecosystem services. Appl. Geogr. 2011, 31, 748–760. [Google Scholar] [CrossRef]
- Reid, W.V.; Cropper, A.; Mooney, H.; Capistrano, D.; Carpenter, S.; Chopra, K.; Dasgupta, P.; Hassan, R.; Leemans, R.; May, R. Living Beyond Our Means: Natural Assets and Human Well-Being, Statement form the Board; IEG: Washington, DC, USA, 2005. [Google Scholar]
- Chun, Y.; Shaohua, T.; Mingjuan, D. Study on the health impact of urban green space based on ESs: Service function, connotation and mechanism. China Gard. 2021, 37, 32–37. [Google Scholar]
- Sarah, C.K.; Kai, M.A.C. Navigating coastal values: Participatory mapping of ecosystem services for spatial planning. Ecol. Econ. 2012, 82, 104–113. [Google Scholar]
- Zhenmin, D.; Xiujuan, H.; Jiajia, Z. Content validity test of CVM for evaluating the recreational value of forest scenic spots-Taking Fuzhou National Forest Park as an example. For. Econ. Issues 2017, 37, 46–50. [Google Scholar]
- Kumar, M.; Kumar, P. Valuation of the ecosystem services: A psycho-cultural perspective. Ecol. Econ. 2008, 64, 808–819. [Google Scholar] [CrossRef]
- Carpenter, S.R.; Mooney, H.A.; Agard, J.; Capistrano, D.; Whyte, A. Science for managing ecosystem services: Beyond the millennium ecosystem assessment. Proc. Natl. Acad. Sci. USA 2009, 106, 1305–1312. [Google Scholar] [CrossRef] [PubMed]
- Zhongwei, G.; Yaling, G. Scientific issues on ecosystem service functions. Biodiversity 2003, 20, 63–69. [Google Scholar]
- Conghong, H.; Jun, Y.; Wenjuan, Z. Progress of Research on Ecosystem Service Assessment Models. J. Ecol. 2013, 32, 3360–3367. [Google Scholar]
- Gaodi, X.; Caixia, Z.; Changshun, Z.; Yu, X.; Chunxia, L. The value of ecosystem services in China. Resour. Sci. 2015, 37, 1740–1746. [Google Scholar]
- Gaodi, X.; Lin, Z.; Chunxia, L.; Yu, X.; Cao, C. An expert knowledge-based approach to ecosystem service valorization. J. Nat. Resour. 2008, 1, 911–919. [Google Scholar]
- Bagstad, K.J.; Semmens, D.; Winthrop, R.; Jaworksi, D.; Larson, J. Ecosystem Services Valuation to Support Decisionmaking on Public Lands—A Case Study of the San Pedro River Watershed, Arizona; Scientific Investigations Report 2012–5251; U.S. Geological Survey: Denver, CO, USA, 2012.
- Daniel, R.R.; Daniel, A.F. A rapid indicator of cultural ecosystem service usage at a fine spatial scale: Content analysis of social media photographs. Ecol. Indic. 2015, 53, 187–195. [Google Scholar]
- María, J.M.; Patricia, B. Methods for mapping ecosystem service supply: A review. Int. J. Biodivers. Sci. Ecosyst. Serv. Manag. 2012, 8, 17–25. [Google Scholar]
- Gregory, B. Mapping Spatial Attributes in Survey Research for Natural Resource Management: Methods and Applications. Soc. Nat. Resour. 2004, 18, 17–39. [Google Scholar]
- Ridding, L.E.; Redhead, J.W.; Oliver, T.H.; Schmucki, R.; Mcginlay, J.; Graves, A.R.; Morris, J.; Bradbury, R.B.; King, H.; Bullock, J.M. The importance of landscape characteristics for the delivery of cultural ecosystem services. J. Environ. Manag. 2018, 206, 1145–1154. [Google Scholar] [CrossRef] [PubMed]
- Lynne, C.M. For better or worse: Exploring multiple dimensions of place meaning. J. Environ. Psychol. 2005, 25, 67–86. [Google Scholar]
- Nahuelhual, L.; Carmona, A.; Lozada, P.; Jaramillo, A.; Aguayo, M. Mapping recreation and ecotourism as a cultural ecosystem service: An application at the local level in Southern Chile. Appl. Geogr. 2013, 40, 71–82. [Google Scholar] [CrossRef]
- Lorena, P.; Izaskun, C.; Miren, O. Mapping recreation supply and demand using an ecological and a social evaluation approach. Ecosyst. Serv. 2015, 13, 108–118. [Google Scholar]
- Hille, K.; Rachel, P. Revisiting fear and place: Women’s fear of attack and the built environment. Geoforum 2000, 31, 269–280. [Google Scholar]
- O’Neil-Dunne, J.; Troy, A.; Grove, J.M. The relationship between tree canopy and crime rates across an urban–rural gradient in the greater Baltimore region. Landsc. Urban Plan. 2012, 106, 262–270. [Google Scholar]
- Leung, K.Y.; Koh, K.; Tam, K.P. Being environmentally responsible: Cosmopolitan orientation predicts pro-environmental behaviors. J. Environ. Psychol. 2015, 43, 79–94. [Google Scholar] [CrossRef]
- Ling, L. Integrating ecological values and the theory of planned behavior to predict customers’ green hotel consumption intention. Ecol. Econ. 2016, 32, 153–157. [Google Scholar]
- Zhiheng, S.; Rongrong, J.; Hongjie, M.; Laishou, Q. Research on farmers’ pro-environmental behaviors based on the perspective of media education function-Analysis of the mediating effect of environmental knowledge and values. Arid. Zone Resour. Environ. 2018, 32, 76–81. [Google Scholar]
- Chunxia, L.; Gaodi, X.; Shengkui, C. Recreational Functions of River Ecosystems and Their Valuation. Resour. Sci. 2001, 14, 77–78. [Google Scholar]
- Yan, G. Social Value Assessment of Ecosystem Services in Qinling Mountain Forest Park Based on SolVES Model. Ph.D. Thesis, Northwestern University, Xi’an, China, 2018. [Google Scholar]
- Koster, S.E.; Langley, D.J. Modeling individual and collective opinion in online social networks: Drivers of choice behavior and effects of marketing interventions. In Proceedings of the European Marketing Academy Conference, Istanbul, Türkiye, 4–7 June 2013. [Google Scholar]
- Xiuqing, L.; Yahong, L.; Liming, X. Personal values, farmers’ willingness and pro-environmental behavioral decisions-An empirical study based on the questionnaire of farmers in Anze County, Shanxi Province. For. Econ. 2021, 43, 17–29. [Google Scholar]
- Dunlap, R.E.; Liere, K.D.V.; Mertig, A.G.; Jones, R.E. Measuring Endorsement of the New Ecological Paradigm: A Revised NEP Scale. J. Soc. Issues 2000, 56, 425–442. [Google Scholar] [CrossRef]
- Schultz, P.W.; Zelezny, L. Values as predictors of environmental attitudes: Evidence for consistency across 14 countries. J. Environ. Psychol. 1999, 19, 255–265. [Google Scholar] [CrossRef]
- Peer, V.D.; Dagmar, H. Ecosystem disservices research: A review of the state of the art with a focus on cities. Ecol. Indic. 2015, 52, 490–497. [Google Scholar]
- Robert, R.D. Global Mapping of Ecosystem Disservices: The Unspoken Reality that Nature Sometimes Kills us. Biotropica 2010, 42, 555–557. [Google Scholar]


| Types of Social Values | Description of Social Values |
|---|---|
| Aesthetic value | This urban green space has beautiful landscapes, natural sounds, and fragrant aromas. |
| Biodiversity value | This urban green space is rich in wildlife resources. |
| Cultural value | This urban green space can provide knowledge and wisdom about the traditional way of life of our ancestors. |
| Economic value | This urban green space can provide opportunities for farming, cultural and creative industries, and tourism, leading to industrial development. |
| Future value | This urban green space will enable the next generation to understand and experience the current urban ecosystem. |
| Historical value | This urban green space has left a legacy of natural and human history that is relevant to me, to others, and to the nation. |
| Learning value | This urban green space provides me with opportunities for research, study, and science education. |
| Life support value | This urban green space can maintain soil and water, nourish water, and purify air. |
| Recreational value | This urban green space provides me with a place for outdoor activities and recreation. |
| Spiritual value | This urban green space can cultivate my emotions and cleanse my soul. |
| Healing Value | This urban green space can make me feel better physically and psychologically by relieving my body and mind and releasing my stress. |
| Intrinsic value | Whether someone lives here or not, this urban green space has its own value. |
| Subject | Measurement Method |
|---|---|
| Humans are the most important and can change the natural environment to meet their needs. | 1–5 means “Strongly Disagree”–“Strongly Agree”. |
| Humans are born to be masters and to rule over the rest of nature. | 1–5 means “strongly disagree”–“strongly agree”. |
| Nature’s plants and animals have the same right to live as humans do. | 1–5 means “Strongly disagree”–“Strongly agree”. |
| Despite their special abilities, humans are still governed by the laws of nature. | 1–5 means “Strongly disagree”–“Strongly agree”. |
| Negative Service Types | Description of Negative Service |
|---|---|
| Unpleasant | Places that are neglected, damaged, or create an unpleasant feeling for people. |
| Unsafe | Places that make people feel unsafe, threatened, or in danger. |
| Noisy | Places where there is a lot of noise. |
| Subject | Choice | Frequency (%) |
|---|---|---|
| Sex | Male | 58.9 |
| Female | 41.1 | |
| Age | 18 years old and below | 9.4 |
| 19–30 years old | 46.9 | |
| 31–45 years old | 23.4 | |
| 46–60 years old | 13.5 | |
| Above 60 years old | 5.7 | |
| Educational level | Primary/middle/high school | 20.8 |
| Junior college/university | 65.1 | |
| Master/doctorate | 14.1 | |
| Place of origin | Beijing | 23.5 |
| Other provinces and cities | 76.5 |
| Value Orientation | Description | Mean Value |
|---|---|---|
| Ecocentrism | Nature has the same right to exist as humans. | 4.3 |
| Humans are still bound by the laws of nature. | 4.4 | |
| Anthropocentrism | Humans are the most important. | 2.4 |
| Humans are the masters of nature. | 1.9 |
| ESV Classification | Architectural Complex | Waters | Forest | Open Forest | Waterfront |
|---|---|---|---|---|---|
| Aesthetic value | 15 | 21 | 11 | 17.3 | 35.7 |
| Biodiversity value | 9.8 | 45.5 | 6.3 | 30.1 | 8.4 |
| Cultural value | 37.5 | 9.4 | 19.3 | 11.1 | 22.6 |
| Economic value | 16.2 | 17.1 | 18.1 | 20 | 28.6 |
| Future value | 26.8 | 25.4 | 15.5 | 12.7 | 19.7 |
| Historical value | 30.6 | 8.8 | 23.6 | 10.6 | 26.4 |
| Learning value | 29.9 | 6.9 | 26.4 | 18.4 | 18.4 |
| Life support value | 12.8 | 36 | 18.6 | 18.6 | 14 |
| Recreational value | 15.3 | 28.2 | 7.4 | 18.8 | 30.2 |
| Spiritual value | 28.1 | 15.6 | 20.8 | 18.8 | 16.7 |
| Wellness value | 16.9 | 29.9 | 11.7 | 14.3 | 27.3 |
| Intrinsic value | 23.2 | 21.4 | 21.4 | 19.6 | 14.3 |
| Insecure places | 20 | 30 | 10 | 15 | 25 |
| Noisy places | 39.1 | 8.7 | 4.3 | 8.7 | 39.1 |
| Unpleasant places | 42.9 | 21.4 | 7.1 | 0 | 28.6 |
| ESV Classification | Aesthetic | Biodiversity | Culture | Economy | Future | History | Learning | Life Support | Recreation | Spirit | Healing | Intrinsic | Insecurity | Noise |
|---|---|---|---|---|---|---|---|---|---|---|---|---|---|---|
| Biodiversity | 0.210 | |||||||||||||
| Culture | 0.326 | −0.284 | ||||||||||||
| Economy | 0.561 * | 0.157 | 0.427 * | |||||||||||
| Future | 0.212 | 0.353 | 0.312 | 0.298 | ||||||||||
| History | 0.072 | −0.293 | 0.596 ** | 0.091 | −0.102 | |||||||||
| Learning | 0.247 | 0.016 | 0.492 * | 0.492 * | −0.017 | 0.503 ** | ||||||||
| Life support | 0.112 | 0.516 ** | −0.312 | 0.238 | 0.122 | −0.378 | 0.100 | |||||||
| Recreation | 0.687 ** | 0.498 *** | 0.138 | 0.573 ** | 0.434 * | −0.318 | 0.068 | 0.206 | ||||||
| Spirit | 0.274 | 0.269 | 0.362 | 0.450 * | 0.413 * | 0.067 | 0.141 | 0.106 | 0.302 | |||||
| Wellness | 0.528 ** | 0.389 * | 0.006 | 0.385 | 0.348 | −0.226 | −0.092 | 0.269 | 0.787 ** | 0.212 | ||||
| Intrinsic | 0.413 * | 0.252 | 0.254 | 0.643 ** | 0.372 | 0.022 | 0.426 * | 0.237 | 0.396 * | 0.288 | 0.227 | |||
| Insecurity | 0.106 | −0.043 | 0.040 | 0.178 | −0.008 | −0.068 | 0.081 | 0.258 | 0.129 | −0.098 | 0.245 | 0.101 | ||
| Noise | 0.007 | −0.027 | 0.513 ** | −0.094 | 0.016 | 0.570 ** | 0.305 | −0.357 | −0.089 | −0.147 | −0.095 | −0.081 | −0.024 | |
| Unhappiness | −0.253 | −0.014 | 0.215 | −0.125 | 0.184 | 0.225 | −0.018 | −0.419 * | −0.154 | 0.006 | −0.005 | 0.033 | 0.184 | 0.302 |
| ESV Classification | Total Sample N (M-VI) | Ecocentrism Group N (M-VI) | Anthropocentrism Group N (M-VI) |
|---|---|---|---|
| Aesthetic value | 347 (8) | 305 (8) | 60 (10) |
| Biodiversity value | 143 (3) | 152 (4) | 21 (3) |
| Cultural value | 424 (10) | 377 (10) | 32 (5) |
| Economic value | 105 (2) | 92 (2) | 21 (3) |
| Future value | 71 (1) | 64 (1) | 17 (2) |
| Historical value | 386 (9) | 360 (10) | 18 (3) |
| Learning value | 87 (2) | 77 (2) | 3 (0) |
| Life support value | 86 (2) | 80 (2) | 19 (3) |
| Recreational value | 202 (5) | 171 (4) | 31 (5) |
| Spiritual value | 96 (2) | 93 (2) | 19 (3) |
| Healing value | 77 (2) | 77 (2) | 8 (1) |
| Intrinsic value | 56 (1) | 56 (1) | 3 (0) |
| Insecurity | 20 (0.1) | 20 (0.2) | 3 (0) |
| Noise | 23 (0.2) | 20 (0.2) | 3 (0) |
| Unhappiness | 14 (0) | 13 (0) | 3 (0) |
Disclaimer/Publisher’s Note: The statements, opinions and data contained in all publications are solely those of the individual author(s) and contributor(s) and not of MDPI and/or the editor(s). MDPI and/or the editor(s) disclaim responsibility for any injury to people or property resulting from any ideas, methods, instructions or products referred to in the content. |
© 2023 by the authors. Licensee MDPI, Basel, Switzerland. This article is an open access article distributed under the terms and conditions of the Creative Commons Attribution (CC BY) license (https://creativecommons.org/licenses/by/4.0/).
Share and Cite
Huang, R.; Liu, Y.; Liang, S.; Si, J.; Di, S.; Cai, M.; Hu, S.; Hao, C.; Zhao, Z. Social Value of Urban Green Space Based on Visitors’ Perceptions: The Case of the Summer Palace, Beijing, China. Forests 2023, 14, 2192. https://doi.org/10.3390/f14112192
Huang R, Liu Y, Liang S, Si J, Di S, Cai M, Hu S, Hao C, Zhao Z. Social Value of Urban Green Space Based on Visitors’ Perceptions: The Case of the Summer Palace, Beijing, China. Forests. 2023; 14(11):2192. https://doi.org/10.3390/f14112192
Chicago/Turabian StyleHuang, Ruoyi, Yunxi Liu, Shu Liang, Jiayi Si, Shuyi Di, Mengmeng Cai, Shuang Hu, Chunxu Hao, and Zheng Zhao. 2023. "Social Value of Urban Green Space Based on Visitors’ Perceptions: The Case of the Summer Palace, Beijing, China" Forests 14, no. 11: 2192. https://doi.org/10.3390/f14112192