Article

Comprehensive Analysis of Chloroplast Genome of Hibiscus sinosyriacus: Evolutionary Studies in Related Species and Genera

1
Department of Forest Bioresources, National Institute of Forest Science, Suwon 16631, Republic of Korea
2
Forest Medicinal Resources Research Center, National Institute of Forest Science, Yeongju 36040, Republic of Korea
*
Author to whom correspondence should be addressed.
Forests 2023, 14(11), 2221; https://doi.org/10.3390/f14112221
Submission received: 13 October 2023 / Revised: 7 November 2023 / Accepted: 8 November 2023 / Published: 10 November 2023
(This article belongs to the Section Genetics and Molecular Biology)

Abstract

:
The Hibiscus genus of the Malvaceae family is widely distributed and has diverse applications. Hibiscus sinosyriacus is a valuable ornamental tree, but it has not been extensively researched. This study aimed to complete the chloroplast genome of H. sinosyriacus and elucidate its evolutionary relationship with closely related species and genera. The complete chloroplast genome of H. sinosyriacus was found to be 160,892 bp in length, with annotations identifying 130 genes, including 85 coding genes, 37 tRNAs, and 8 rRNAs. Interspecific variations in the Hibiscus spp. were explored, and H. sinosyriacus has species-specific single-nucleotide polymorphisms in four genes. Genome structure analysis and visualization revealed that in the Abelmoschus genus, parts of the large single-copy region, including rps19, rpl22, and rps3, have been incorporated into the inverted repeat region, leading to a duplication and an increase in the number of genes. Furthermore, within the Malvales order, the infA gene remains in some genera. Phylogenetic analysis using the whole genome and coding sequences established the phylogenetic position of H. sinosyriacus. This research has further advanced the understanding of the phylogenetic relationships of Hibiscus spp. and related genera, and the results of the structural and variation studies will be helpful for future research.

1. Introduction

The Hibiscus genus of the Malvaceae family encompasses approximately 220–250 species that are widely distributed across tropical, subtropical, and temperate climates in the form of trees, shrubs, and herbs [1]. Historically, this genus has been utilized for ornamental, culinary, and medicinal purposes [2,3]. With technological advancements and the rise of high-value industries, the applications of Hibiscus spp. have expanded to include indoor decoration, functional foods, cosmetics, and medicinal research [4,5,6,7,8]. Among the various Hibiscus species, Hibiscus sinosyriacus L. H. Bailey is a deciduous shrub native to the subtropical and tropical regions of southern China [9]. In the previous study, this species is morphologically most similar to H. syriacus, but with some differences, including broader leaves, elongated epicalyx tubes, and larger growth. Moreover, through an amplified fragment length polymorphism analysis, two species were clearly differentiated [10]. In the Republic of Korea, novel cultivars of H. syriacus have been developed by interbreeding with H. sinosyriacus to enhance their ornamental value, flower quality, and growth habit [11,12,13].
Chloroplast (cp), one of the cell organelles in plants, is integral to photosynthesis, plant immunity, and other vital biological functions, including amino acid synthesis and nitrogen metabolism [14,15]. As a symbiotic entity within cells, cp possesses ancestral genomic DNA and is predominantly maternally inherited from angiosperms [16]. The cp genome of angiosperms is highly conserved and typically presents a quadripartite structure comprising a large single-copy (LSC), a small single-copy (SSC), and a pair of inverted repeat (IR) regions [15]. Although the cp genome remains largely intact, genetic events such as insertions, deletions, rearrangements, and copy number variations have led to plant divergence and evolution [17]. Consequently, cp genomes have been used in diverse research areas, including species differentiation, evolutionary distance estimation, parameter determination, and cultivar identification [18,19,20].
The evolutionary relationship between species or genera has typically been analyzed by selecting various regions within the cp genome, such as protein-coding sequences (CDSs) and mutational hotspots. Generally, well-conserved CDS regions have been primarily used for phylogenetic classification [21]. Restricted regions showing extensive variations, such as ycf1, ycf3, and matK-trnK, known as mutational hotspots, have been emphasized more for developing markers to identify species, cultivars, or subspecies rather than for studies determining broad evolutionary relationships between genera or between species [22,23,24]. Recent studies have also focused on utilizing regions outside the CDS that are well conserved but still exhibit variations for phylogenetic analysis [25].
In this study, we aimed to elucidate the complete cp genome of H. sinosyriacus for the first time. Additionally, by comparing in-depth the genome structure and variations with its closely related species, we hope to help in future research such as marker development. Furthermore, by clarifying the phylogenetic relationship with closely related species and genera, we aimed to confirm the evolutionary position of H. sinosyriacus.

2. Materials and Methods

2.1. DNA Extraction, Sequencing, Assembly, and Annotation

Fresh leaves of H. sinosyriacus (“Melmauve”) were obtained from the Hibiscus Clonal Archive of the National Institute of Forest Science (37.15° N, 126.57° E), Suwon, Republic of Korea. Total DNA was extracted using a GeneAll® Exgene™ Genomic DNA Purification Kit (GeneAll Biotechnology, Seoul, Republic of Korea). Next-generation sequencing library construction was performed by Macrogen (Seoul, Republic of Korea) using a TruSeq™ Nano DNA Kit (Illumina, San Diego, CA, USA). Genome sequencing was performed using a NovaSeq™ 6000 platform (Illumina). The cp genome sequence was assembled using NOVOPlasity 4.3.1, an organelle assembler based on the cp genome of H. syriacus (KR_259989), with k-mers of 27, 29, and 35 [26]. Genes, rRNAs, tRNAs annotations, and circular maps were drawn using GeSeq (https://chlorobox.mpimp-golm.mpg.de/geseq.html, accessed on 15 March 2023) containing annotators blatN, blatX, and Chlorom [27]. Error correction was manually conducted using Sanger sequencing, by designing primers around the nucleotides where the errors occurred.

2.2. Comparative Analyses of cp Genome Sequences

To comprehensively compare the cp sequences of the 17 species of the Malvaceae family, we used the mVISTA program. To observe the positional changes in genes at the boundaries of each compartment structure, including hibiscus and its close relatives, we used the GeSeq annotation program to identify the boundaries of each structure.

2.3. Simple Sequence Repeats (SSRs) Analysis

MISA version 2.1 was used to identify SSRs in the cp genomes of H. sinosyriacus and 16 other species, including H. syriacus, H. coccineus, H. mutabilis, H. sabdariffa, H. rosa-sinensis, H. trionum, H. cannabinus, H. taiwanensis, Gossypium gossypioides, G. herbaceum, G. hirsutum, G. raimondii, A. esculentus, A. manihot, A. moschatus, with Tilia amurensis as the outgroup [28]. The analysis was performed using parameters set at 8/mono, 3/di, 3/tri, 3/tetra, and 3/penta. Statistical analyses of average SSRs across the three genera, excluding T. amurensis, were conducted using R version 4.3.1 (The R Foundation, Vienna, Austria). To evaluate the significance among group means that did not adhere to a normal distribution, we used the non-parametric Kruskal–Wallis test [29]. Subsequently, Dunn’s test with Bonferroni correction was conducted for post hoc analysis [30].

2.4. Detection of Variants and Statistical Analyses

To compare the overall count of single-nucleotide polymorphisms (SNPs) and indels in the complete cp genomes of 16 species, using H. sinosyriacus as a reference, sequences were aligned using Clustal Omega version 1.2.4 [31]. Subsequently, the alignment results were subjected to pairwise comparison analysis using CLC main workbench version 23.0.2, to determine the gaps, differences, distances, percent identities, and identities of each species [32]. These metrics were calculated separately for the whole cp genome, CDSs, and specific regions, including LSC, IRa, SSC, and IRb. For the identification of SNPs and indels within the CDSs of nine species from the Hibiscus genus, the ClustalW alignment tool embedded in the Vector NTI Advanced 10 software was used [33]. All genes were annotated using BLAST X and Chlorom annotation engines within the GeSeq. Statistical methods were used to determine whether there were significant differences in variation across cp genomes between species and genera of the 17 species belonging to the Malvaceae family. Given that the species within each genus did not follow a normal distribution, as determined using the Shapiro–Wilk test in R version 4.3.1, we utilized the non-parametric Kruskal–Wallis test for statistical analysis. For post hoc analysis, the Dunn’s test with Bonferroni correction was applied. Two methods were used to extract samples from the 17 species. The first method utilized the pairwise averages of species within each genus, whereas the second method used H. sinosyriacus as a reference.

2.5. Phylogenetic Tree Analysis

Alignment analyses of the complete cp genomes were performed using the same species as those included in the SSR analysis—nine species of Hibiscus, including H. sinosyriacus, three species of Abelmoschus, and four species of Gossypium, with T. amurensis as the outgroup—using Clustal Omega version 1.2.4. The following are the scientific names of the plants used for phylogenetic analysis, along with their respective GenBank accession numbers: H. sinosyriacus (MZ_367751), H. syriacus (KR_259989), H. mutabilis (MK_820657), H. coccineus (OK_336487), H. sabdariffa (MZ_522720), H. rosa-sinensis (NC_042239), H. trionum (OL_628829), H. cannabinus (NC_045873), H. taiwanensis (MK_937807), A. esculentus (NC_035234), A. manihot (NC_053353), A. moschatus (NC_053355), G. gossypiodes (NC_017894), G. herbaceum (JK_317353), G. hirsutum (NC_007944), G. raimondii (NC_016668), and T. amurensis (MH_169573). Phylogenetic analyses were performed separately for each region, including the whole cp genome, LSC, SSC, IR, and CDS regions. The analysis was performed using the neighbor-joining method in the CLC genomics workbench program version 23.1, with 1000 bootstraps.

3. Results

3.1. Cp Genome Assembly and Annotation of H. sinosyriacus Genes

The assembly process utilized 121,987,386 total reads, 2,315,382 of which aligned with the reference genome; 2,300,724 of these were used for assembly, with an average organelle coverage of 2173×. The complete cp genome of H. sinosyriacus was sequenced and assembled, resulting in a circular genome 160,892 bp in length (Figure 1). This genome was then deposited in GenBank, under the accession number MZ_367751. The genome comprised four distinct regions: LSC, IRs (IRa and IRb), and SSC. The LSC region was 89,747 bp in length, the IRa and IRb regions were 25,742 bp each, and the SSC region was 19,661 bp in length. The GC content of H. sinosyriacus was 36.85%. The total annotation included 130 genes, including 85 CDSs, 37 tRNAs, and 8 rRNAs (Table 1). Of the 85 CDSs, there were 12 genes in the cp genome of H. sinosyriacus: petD, petB, atpF, ycf3, ndhB, ndhA, rpoC1, rps16, rps12, rpl16, rpl2, and clpP1. Among these, ycf3 had three introns and clpP1 had two introns, whereas the remaining 10 genes contained one intron each. Among the 37 tRNAs, eight tRNAs—trnK-UUU, trnS-UCC, trnL-UAA, trnV-UAC, two copies of trnE-UUC, and two copies of trnA-UGC—each contained one intron (Table 2).

3.2. Comparative Structural Analysis

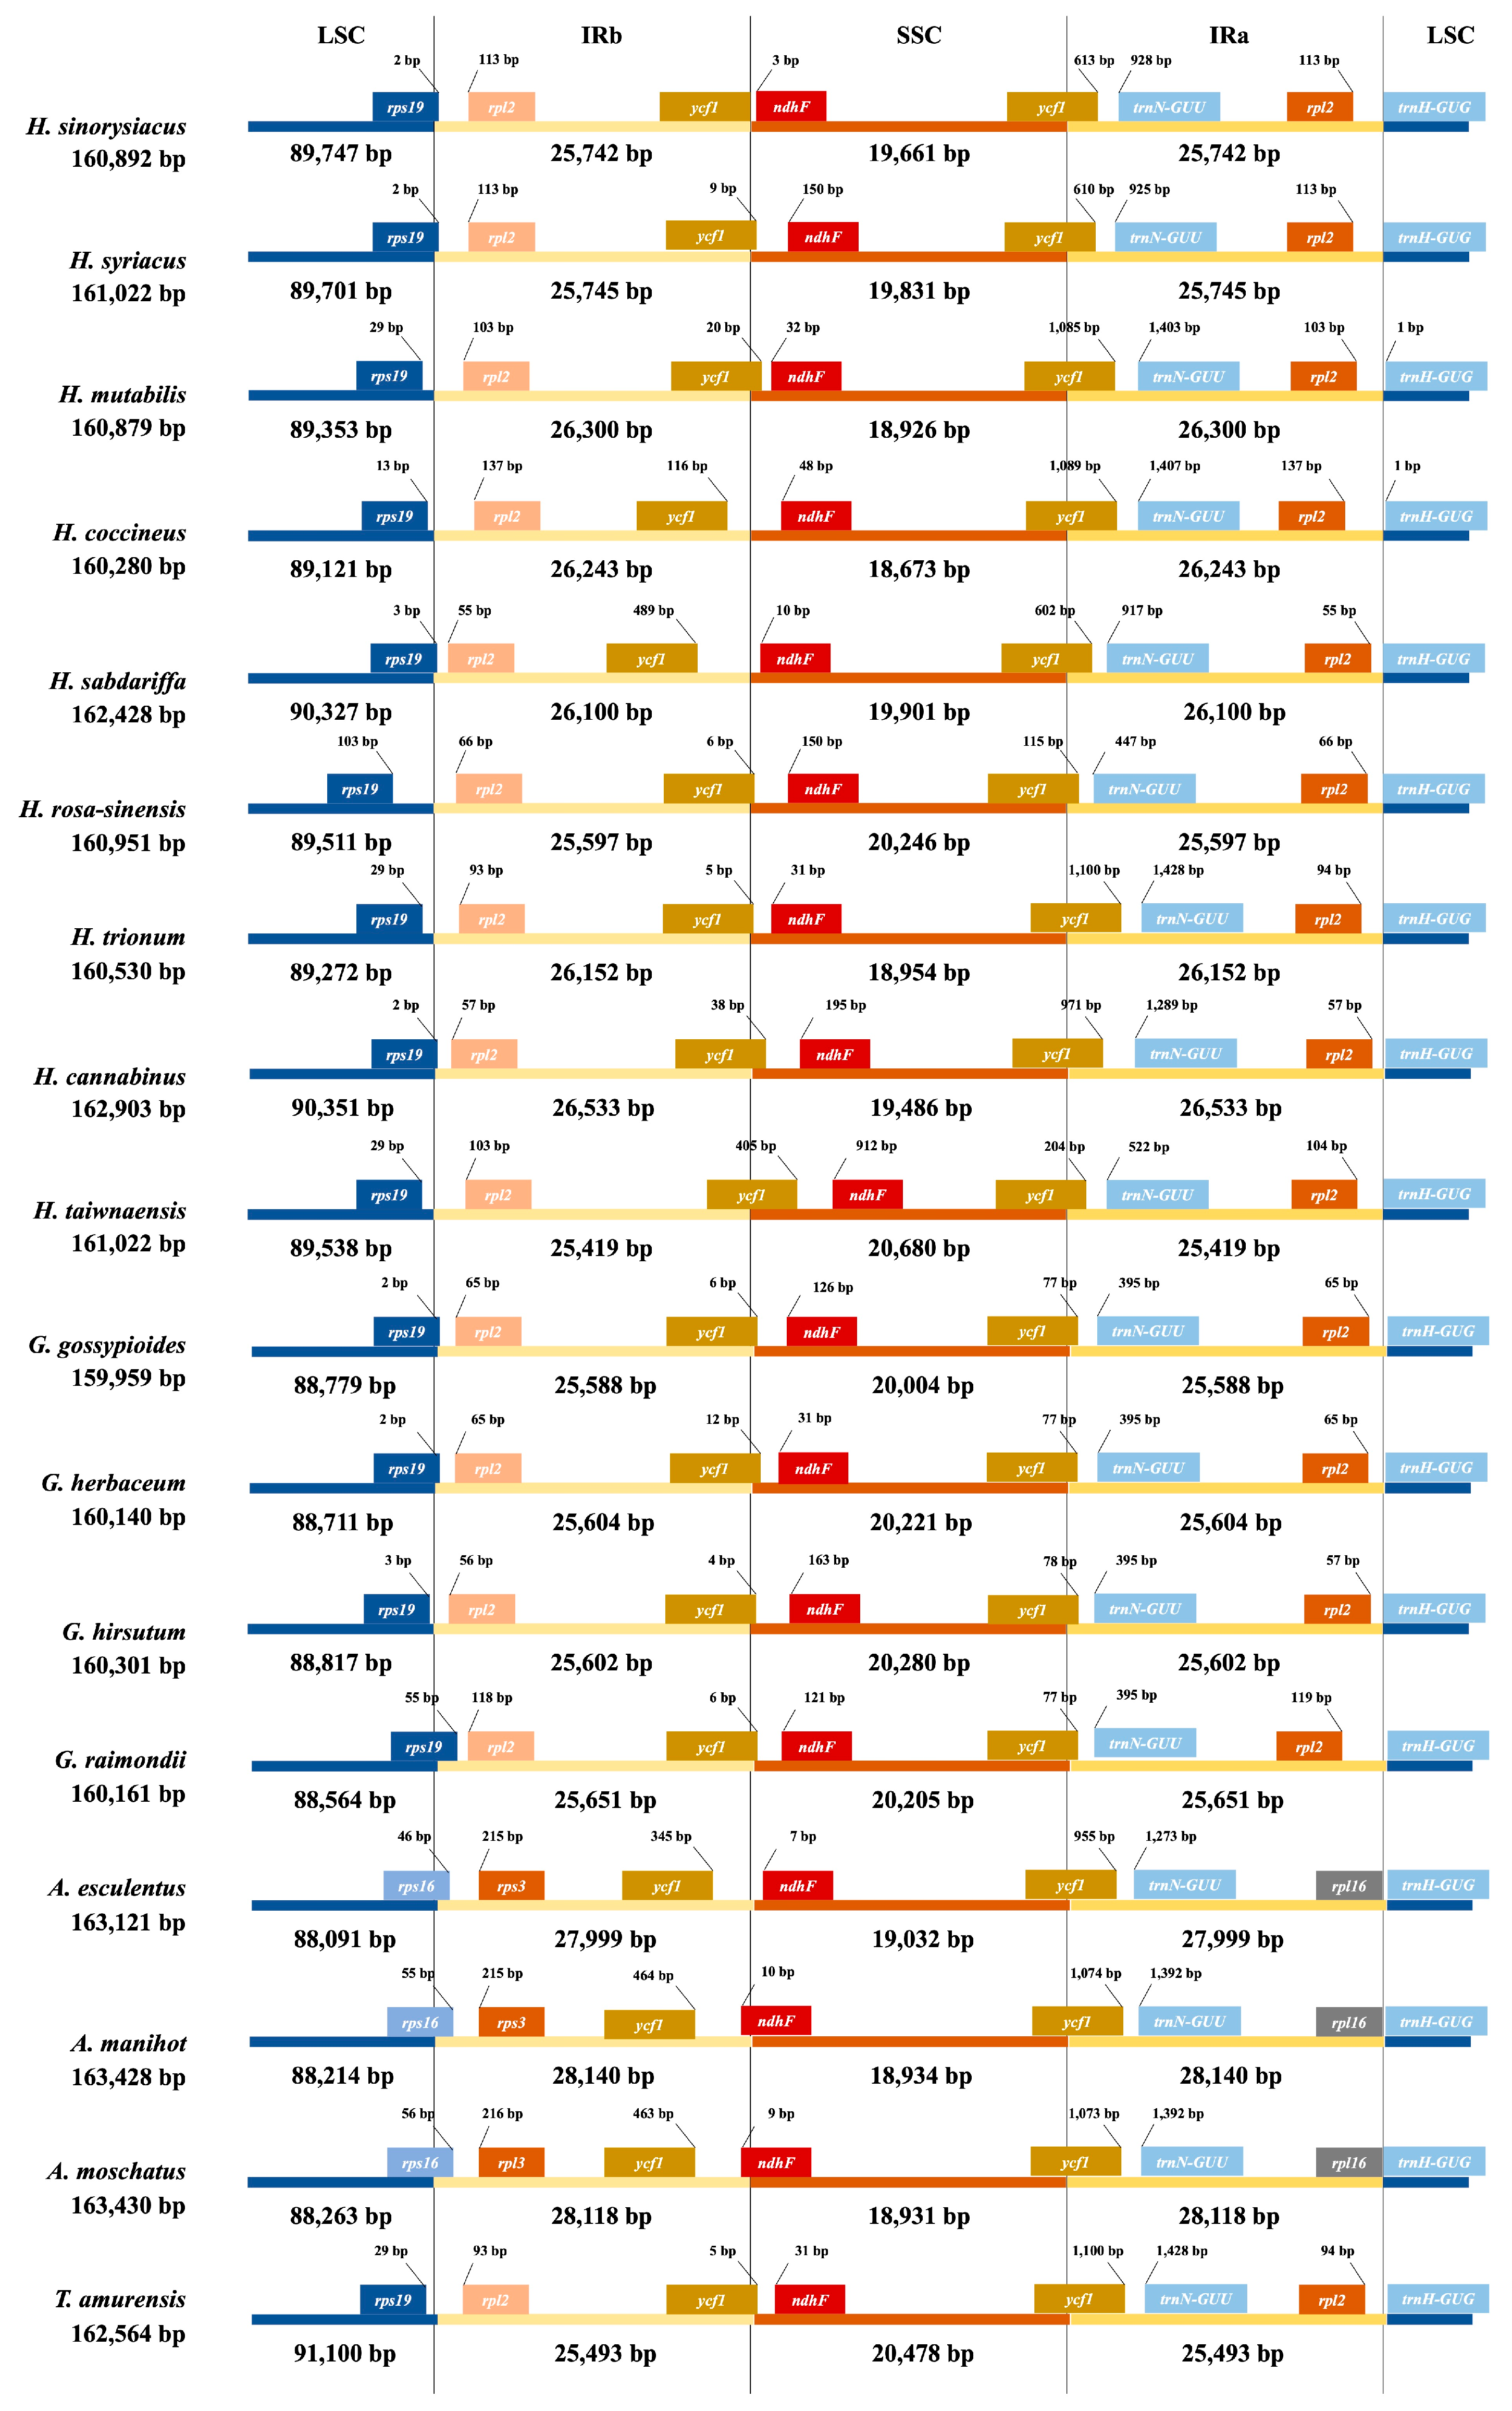
The positions of the genes at the boundaries of each quadripartite structure of the cp genome play a crucial role in observing insertions, deletions, and structural transformations in large frames [34,35]. The structural differences in 17 species, including 9 species of the genus Hibiscus, were analyzed to determine the gene loci at the beginning and end of the structural boundaries (Figure 2). The average sizes of the cp genomes were 161,216 bp for the Hibiscus genus, 163,326 bp for the Abelmoschus genus, 160,140 bp for the Gossypium genus, and 162,564 bp for T. amurensis. Among them, the Abelmoschus genus had the largest genome, whereas Gossypium had the smallest. The average sizes of the LSC region in the genera Hibiscus and Gossypium were 89,268 and 89,658 bp, respectively, whereas that in the genus Abelmoschus was 88,189 bp, with a difference of 1079–1469 bp. Conversely, the genus Abelmoschus exhibited an expansion in the IR region by 1849–2593 bp, compared with the other two genera, which was due to the presence of rps19, rpl22, and rps3 genes. In the LSC region, the rps19 gene (excluding the genus Abelmoschus) spanned the boundary of seven species: H. sinosyriacus, H. syriacus, H. sabdariffa, H. cannabinus, G. gosyspioides, G. herbaceum, and G. raimondii. Additionally, the rps16 gene in the three species of the Abelmoschus genus also crossed the boundary line. In contrast, there were seven species for which no genes were located across the boundary: H. mutabilis, H. coccineus, H. rosa-sinensis, H. trionum, H. taiwanensis, G. hirsutum, and T. amurensis. Notably, H. rosa-sinensis exhibited the largest distance between the gene and the boundary (103 bp). In the IRb structure, three species from the Abelmoschus genus began with the rps3 gene, whereas in the other species, the rpl2 gene appeared after the boundary with the LSC region. Within the Hibiscus genus, the end of the ycf1 fragment in H. sabdariffa was 489 bp before the start of the small SSC region, a pattern similar to that observed in the Abelmoschus genus. The ycf1 fragment of H. coccineus showed a 116 bp difference from the SSC boundary. All other ycf1 fragments of Hibiscus species crossed the SSC boundary. In most cases, the last gene of the IRa, rpl2, was located 57–137 bp before the LSC boundary, whereas in the case of the Abelmoschus genus, the rpl16 gene was present.
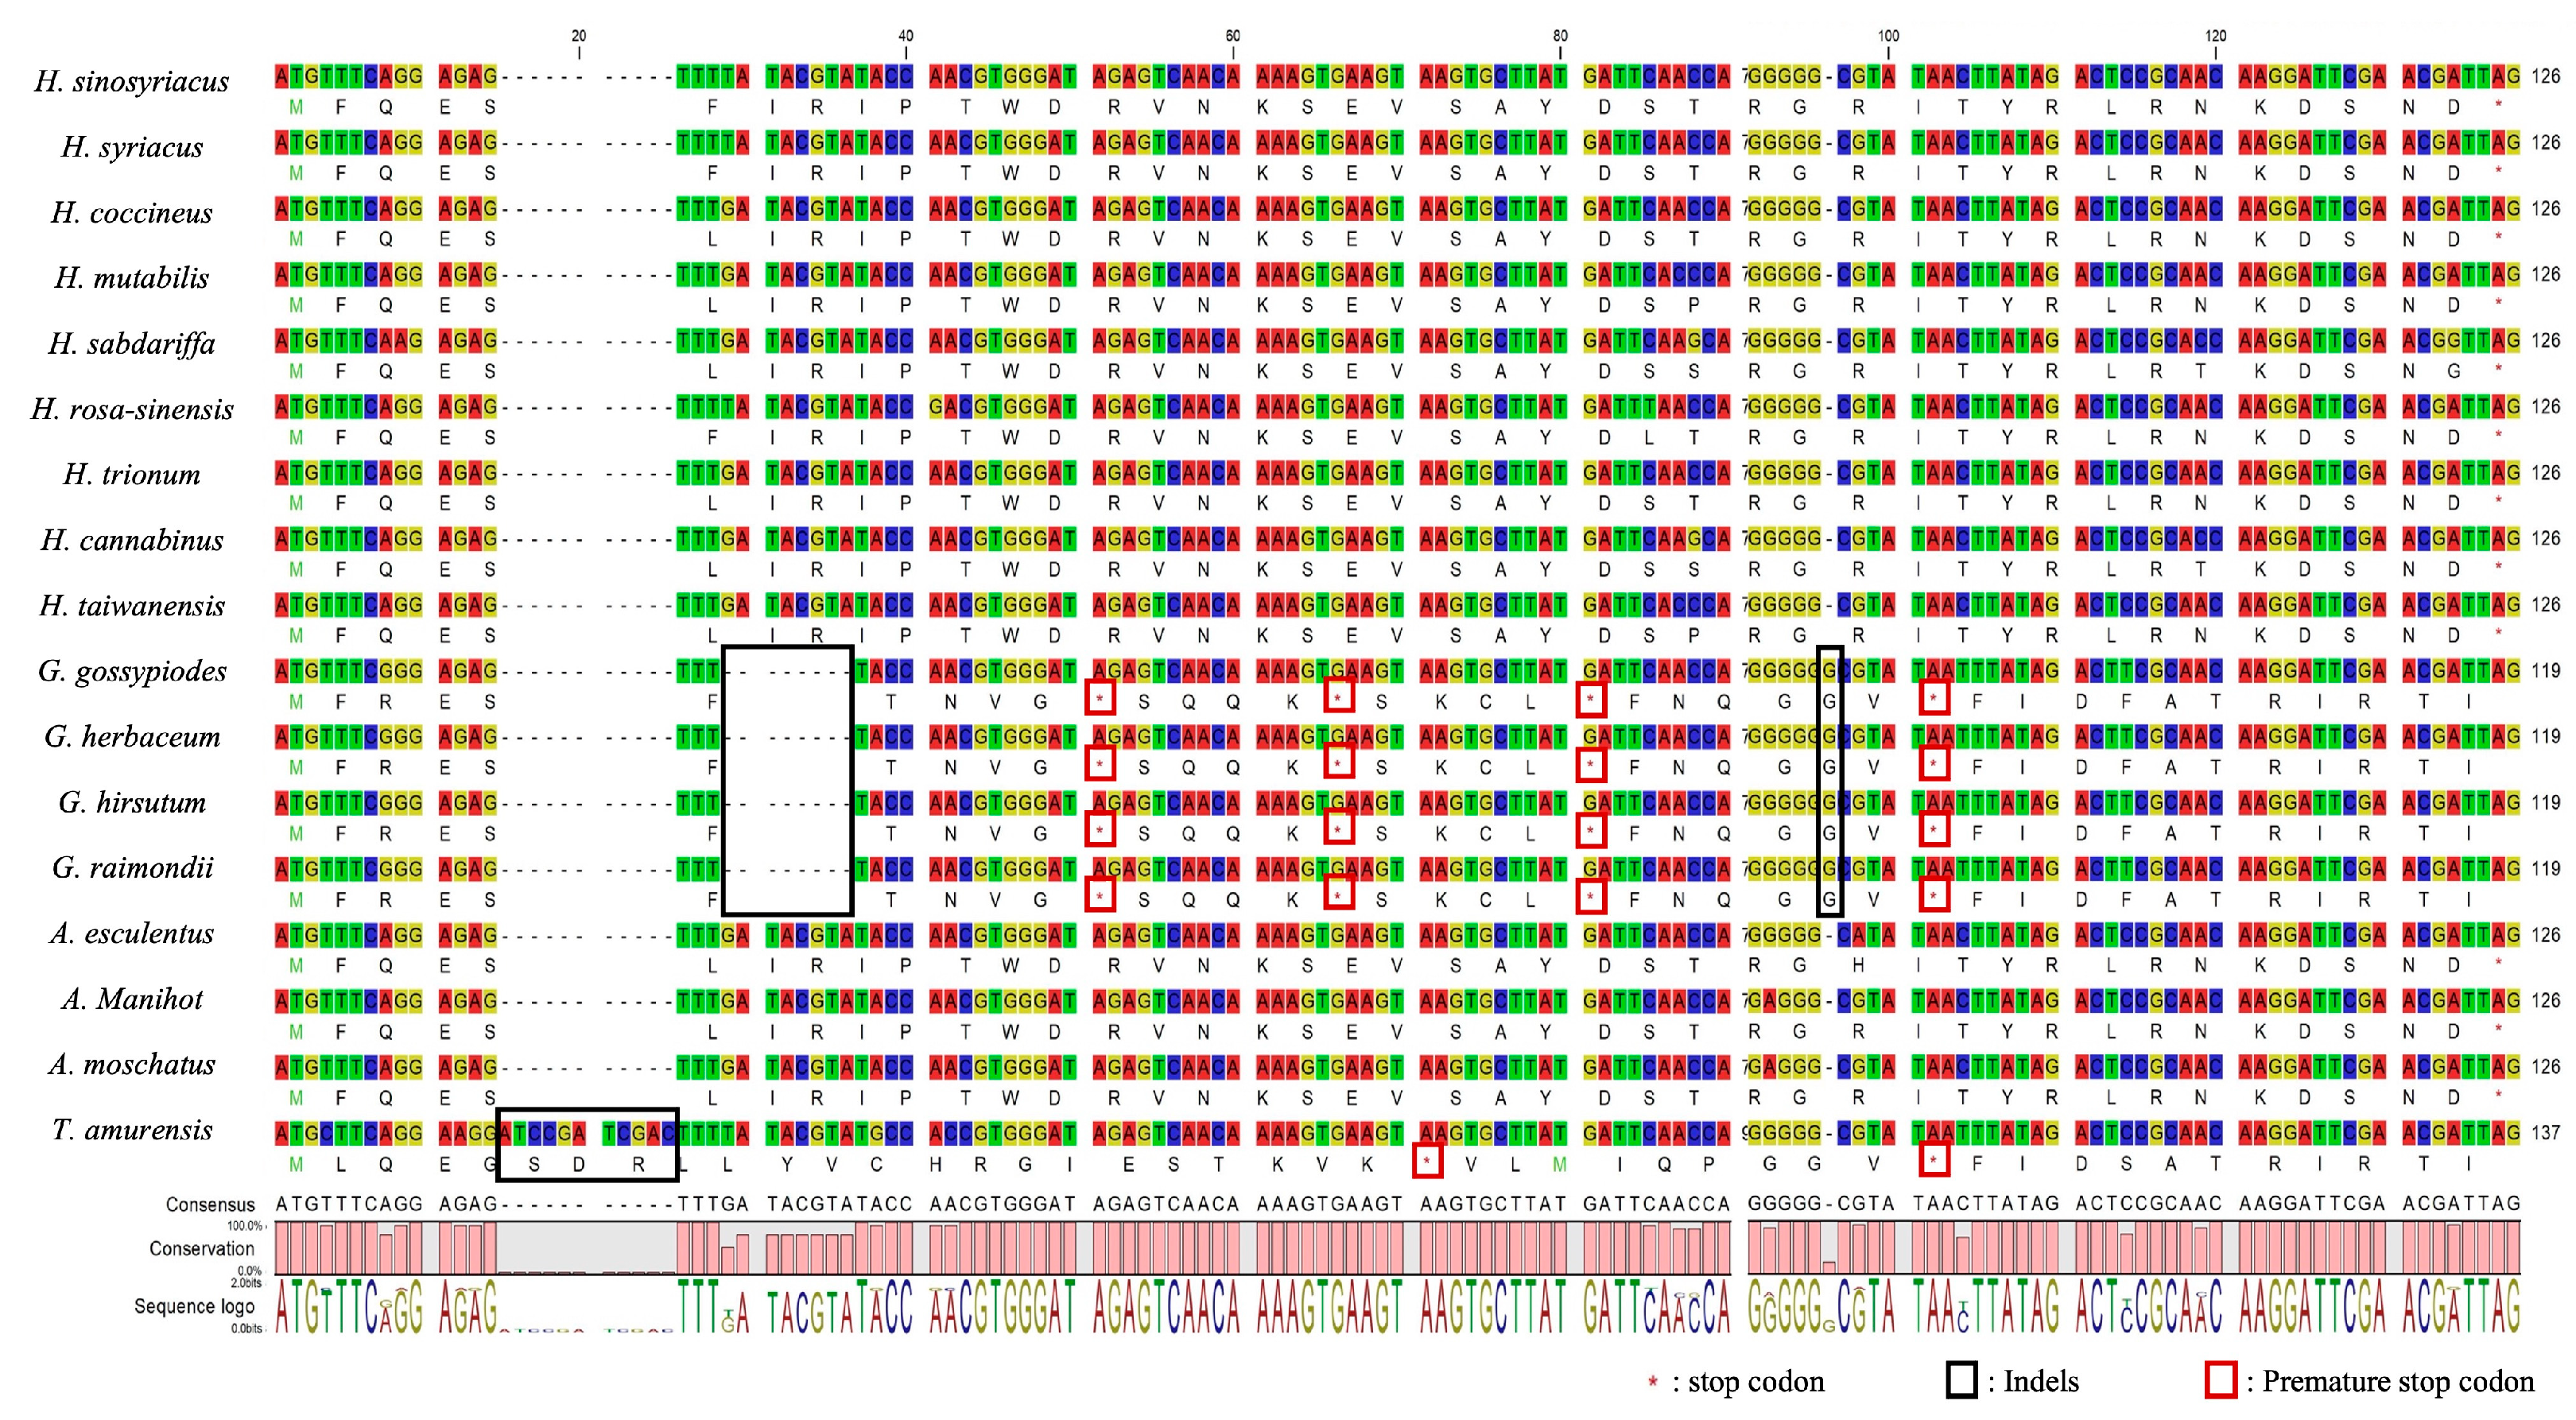
The GC content of H. sinosyriacus was 36.85%, and the average GC content of the genus Hibiscus was ~36.85%. The average GC content of the genus Abelmoschus was 36.72%, which was lower than that of the genus Hibiscus, whereas that of the genus Gossypium was 37.29%, which was much higher. The GC content of T. amurensis was the lowest (36.51%) (Table 1). Differences were observed in the number of genes in the cp genome among the genera. The genus Abelmoschus had three additional genes compared with other genera, as the IR region included rps19, rpl22, and rps3. Unlike other genera, the genus Abelmoschus experienced an increase in gene count owing to the incorporation of rps19, rpl22, and rps3 from the existing LSC region into the IR region, resulting in duplication. This led to a three-fold increase in the gene count. Although both synonymous and non-synonymous SNPs were observed within the infA gene of plants of the Hibiscus and Abelmoschus genera, they were well preserved within the cp genome. However, although a deletion of 7 bp within the infA gene in the Gossypium genus led to the appearance of a premature stop codon, an insertion of 11 bp resulted in a premature stop codon, confirming the loss of the infA gene in T. amurensis (Figure 3).

3.3. SSRs Analysis

The total number of SSRs in H. sinosyriacus was 686, comprising 192 mononucleotides, 408 dinucleotides, 76 trinucleotides, 6 tetranucleotides, and 4 pentanucleotides. A analysis of SSRs across 17 species, including H. sinosyriacus, revealed an average total SSR count of 692.35. The species with the highest number of SSRs was A. esculentus (748), whereas the one with the lowest was G. raimondii (633). Among these, Abelmoschus had the highest average SSR count (745.33), followed by T. amurensis (735), Hibiscus (689), and Gossypium (649.5). Notably, within the Hibiscus genus, H. rosa-sinensis had a particularly low SSR count (653). The distributions of total SSRs and monopenta-SSR motifs were not proportional across species. A. moschatus had the highest number of mononucleotide SSRs, whereas H. rosa-sinensis had the lowest. A. esculentus had the most dinucleotide SSRs, whereas G. raimondii had the least. A. manihot had the highest number of trinucleotide SSRs, whereas G. hirsutum had the lowest. With respect to the tetranucleotide SSRs, A. manihot had the highest count, whereas H. sinsyriacus, H. rosa-sinensis, and G. hirsutum had only six. T. amurensis had the highest count of pentanucleotides (11), whereas that in the other species ranged between 1 and 4. The distribution of SSRs was also analyzed according to region. SSRs in the LSC region accounted for ~63.3% of the total, whereas those in the SSC and IR regions accounted for 11.7% and ~25% of the total, respectively. The LSC region showed an SSR distribution pattern that was most similar to that of the overall genome of the 17 species, whereas the SSC region displayed a distinct pattern. In particular, H. sinosyriacus and H. syriacus had a notably higher number of SSRs than the other species, whereas pentanucleotide repeats were absent in all species. The IR regions had a distribution pattern that was more similar to the SSR distribution of the overall genome than that of the SSC region, but with a higher proportion of dinucleotides. Tetranucleotide repeats were absent in all the species, except T. amurensis (Figure 4). In the comparison of differences in the number of SSRs among the three closely related genera excluding T. amurensis, the quantity of SSRs in the Hibiscus genus was intermediate between the other two genera and showed no significant difference from them. However, there was a significant difference between Abelmoschus, which had the most SSRs, and Gossypium, which had fewer SSRs (Table 3).

3.4. Comparative Sequence Identification Analysis via Visualization

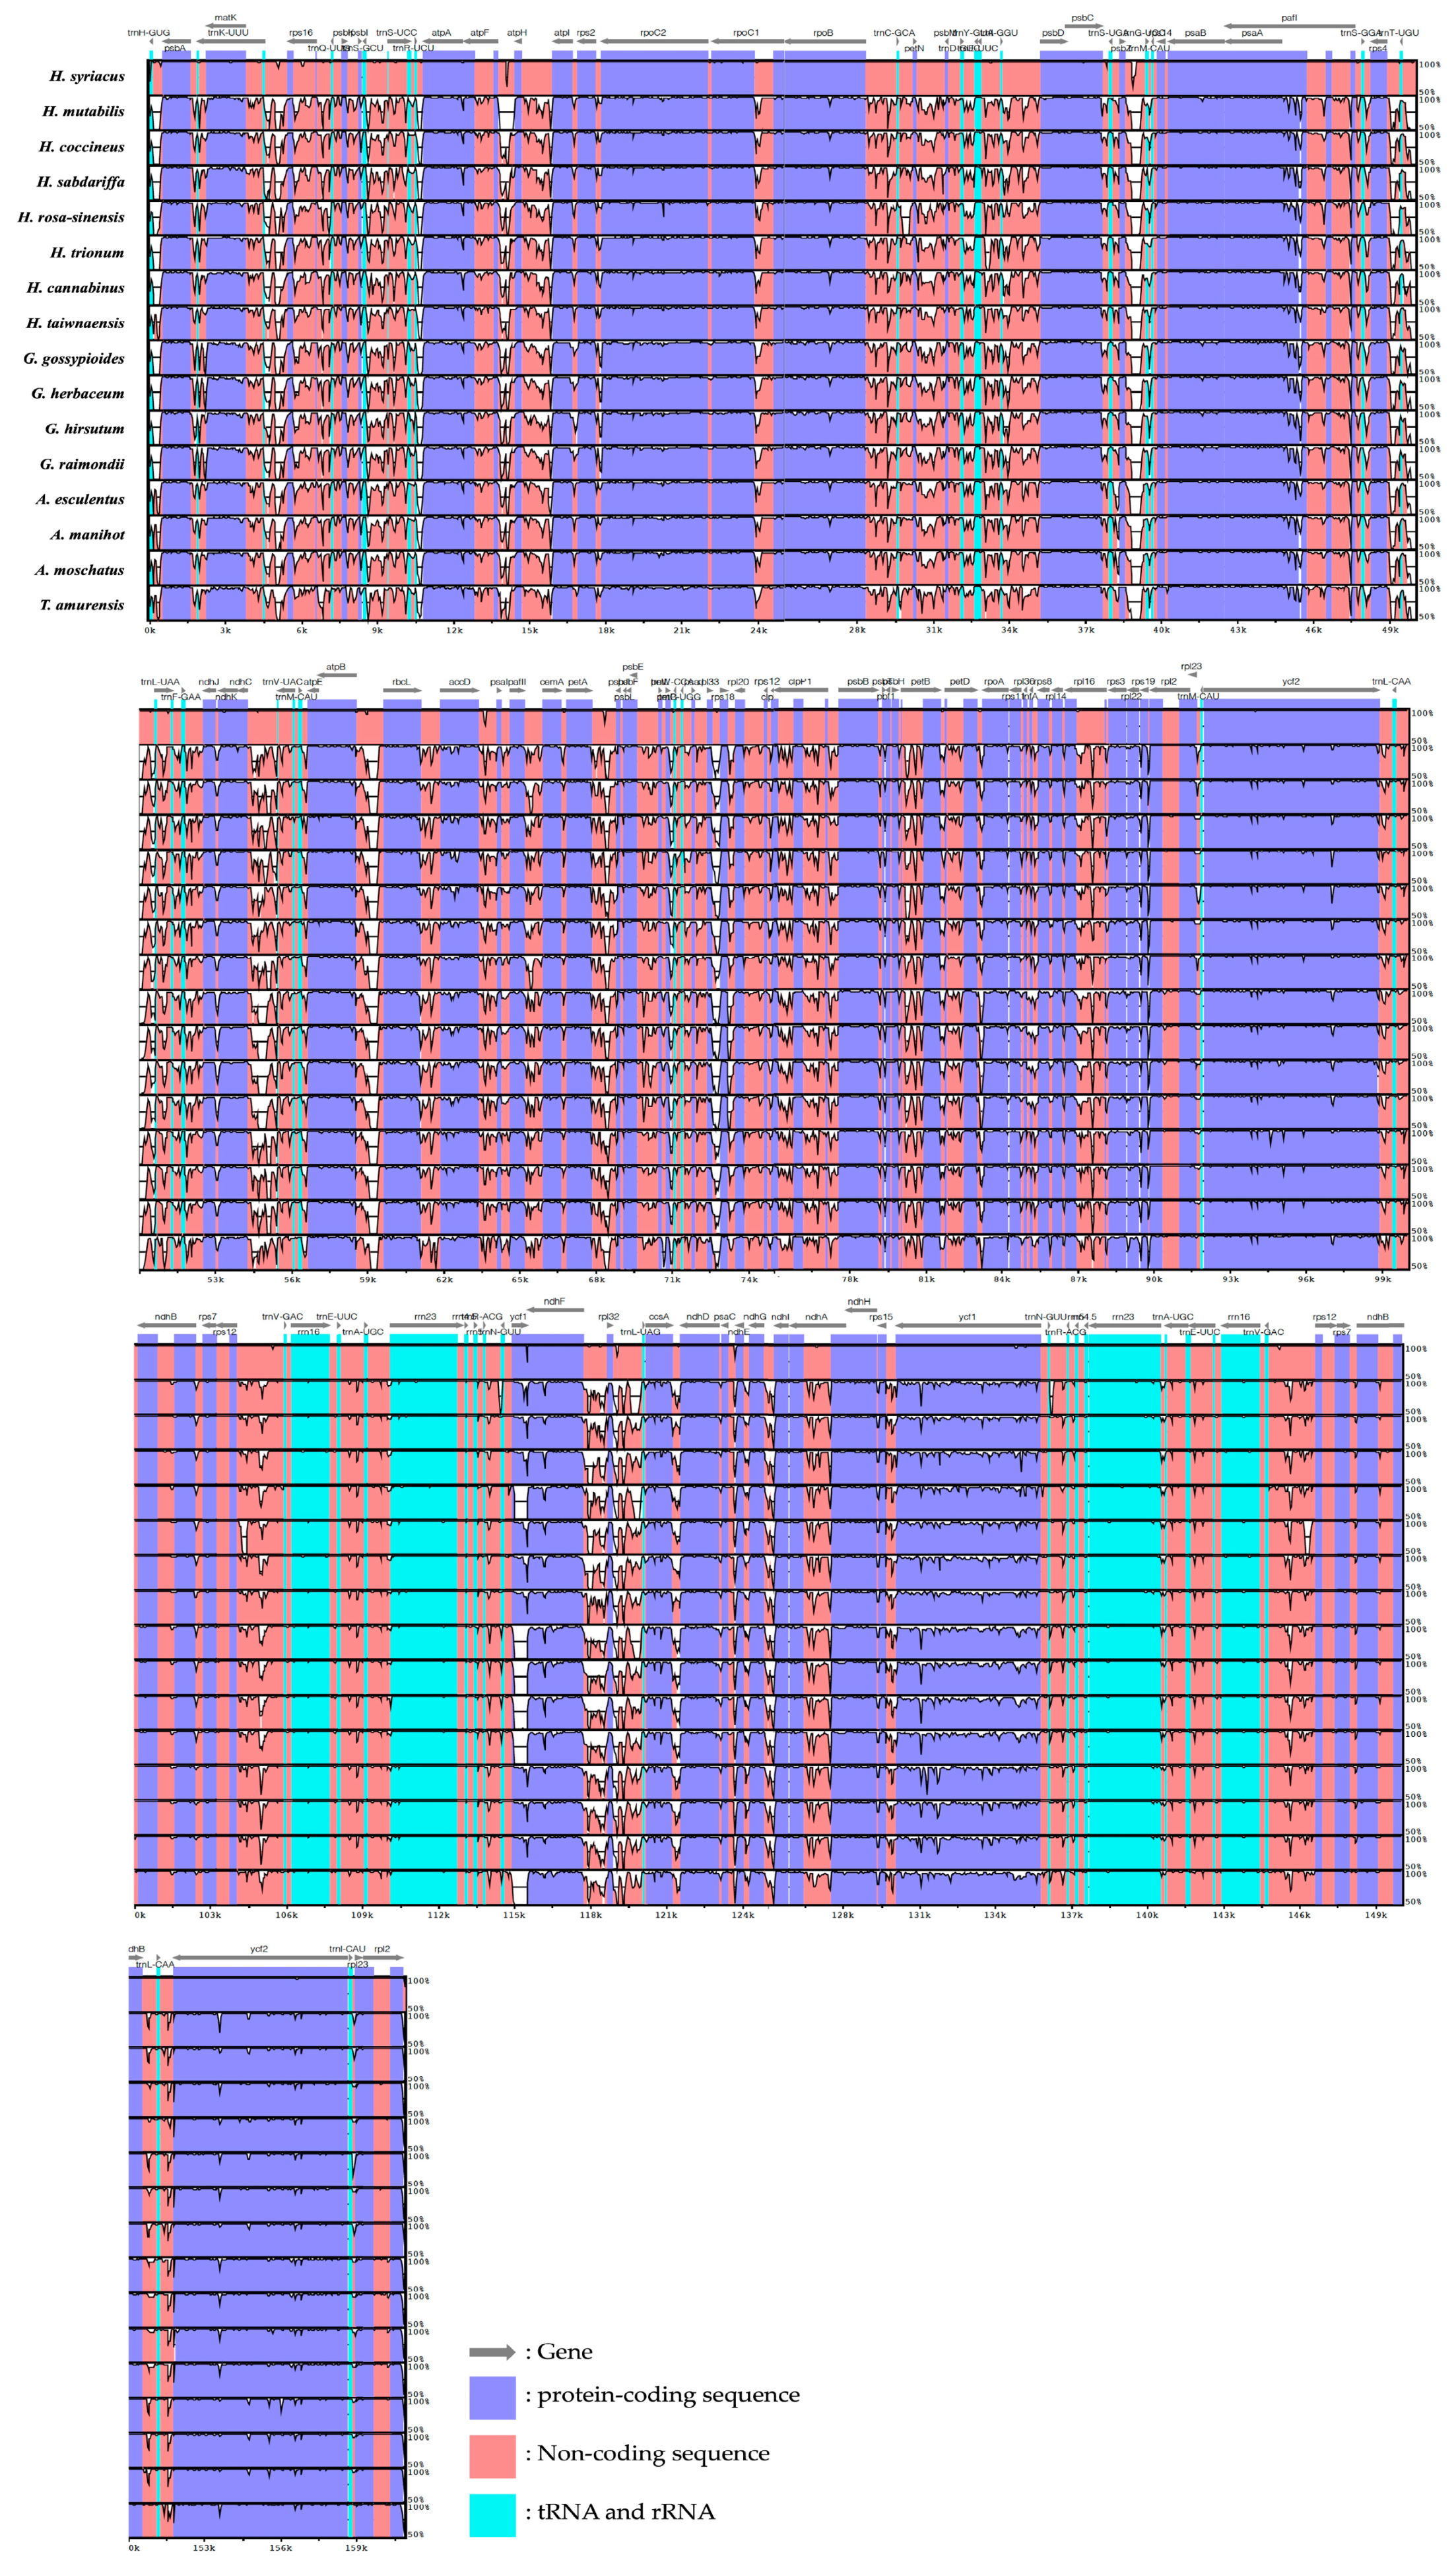
The mVISTA program, which visualizes the similarity of comparative sequences, was used to understand these differences intuitively [36]. We explored the sequence variations in 17 species using H. sinosyriacus as a reference (Figure 5). Generally, sequence differences are observed more frequently in non-coding regions than in coding regions. In the non-coding regions, significant differences were observed within the intron regions of matK-atpA, atpF-atpI, rpoB-psbD, psbC-psaB, rps4-ndhJ, ndhC-atpE, atpB-rbcL, pafII-cemA, petA-psbJ, and clpP1-rpl16. These differences were predominantly distributed in the LSC region. In the coding regions, differences were frequently found within genes such as rpoC2, rpoB, pafI, ycf2, ycf1, and ndhF. In the SSC region, differences were observed between the ndhF and ccsA genes and within the intron region of ndhA. In the IR region, differences were observed between rps12 and trnV-GAC. The location of the ycf1 gene exhibited two distinct patterns across species. The first pattern showed a portion of the ycf1 gene initiated at the start of the SSC region in the forward direction, with the entire sequence of the ycf1 gene located in the reverse direction at the end of the SSC. This pattern was observed in eight species of the Hibiscus genus, excluding H. rosa-sinensis, and in three species of the Abelmoschus genus. Conversely, the second pattern, distinct from the first, lacked the partial ycf1 gene at the beginning of the SSC but contained the complete sequence in the reverse direction at the end. The latter pattern was characteristic of four species from the Gossypium genus and T. amurensis. Notably, H. rosa-sinensis deviated from the first pattern, where the species typically had an ycf1 partial sequence spanning 500–600 bp. Instead, H. rosa-sinensis replicated only a short 113 bp partial sequence at the beginning. Additionally, upon examining the sequence identity patterns, it was evident that the patterns were either grouped by genus or varied distinctly. Species-specific patterns were also observed. For instance, a unique pattern was identified between the atpF and atpH introns in H. syriacus and within the IR region between rps12 and trnV-GAC intron in H. trionum. Excluding H. syriacus, the remaining species showed similar patterns of variation; however, unique patterns were often observed, depending on the species. Notably, H. syriacus showed much less difference from H. sinosyriacus than the other species. Unlike other species, these two species can be crossbred and have flower shapes similar to those of shrubs. Noticeable differences between the two species were observed in the non-coding regions of atpF and atpH, psbZ and rps14, accD and psaI, petA and psbJ, rps18 and rpl20, rps12 and trnV-GAC, rpl32 and trnL-UAG, and so on. H. mutabilis had a different pattern of sequence similarity between atpF and atpH and trnR-ACG and trnN-GUU, as compared with the other species. H. rosa-sinensis showed large differences in the rpoC2, ycf2, and ycf1 partial genes. In terms of sequence similarity, H. sinosyriacus, H. syriacus, H. mutabilis, H. coccineus, H. sabdariffa, and H. cannabinus exhibited similar patterns.

3.5. Comparison Analysis of Pairwise Heatmap

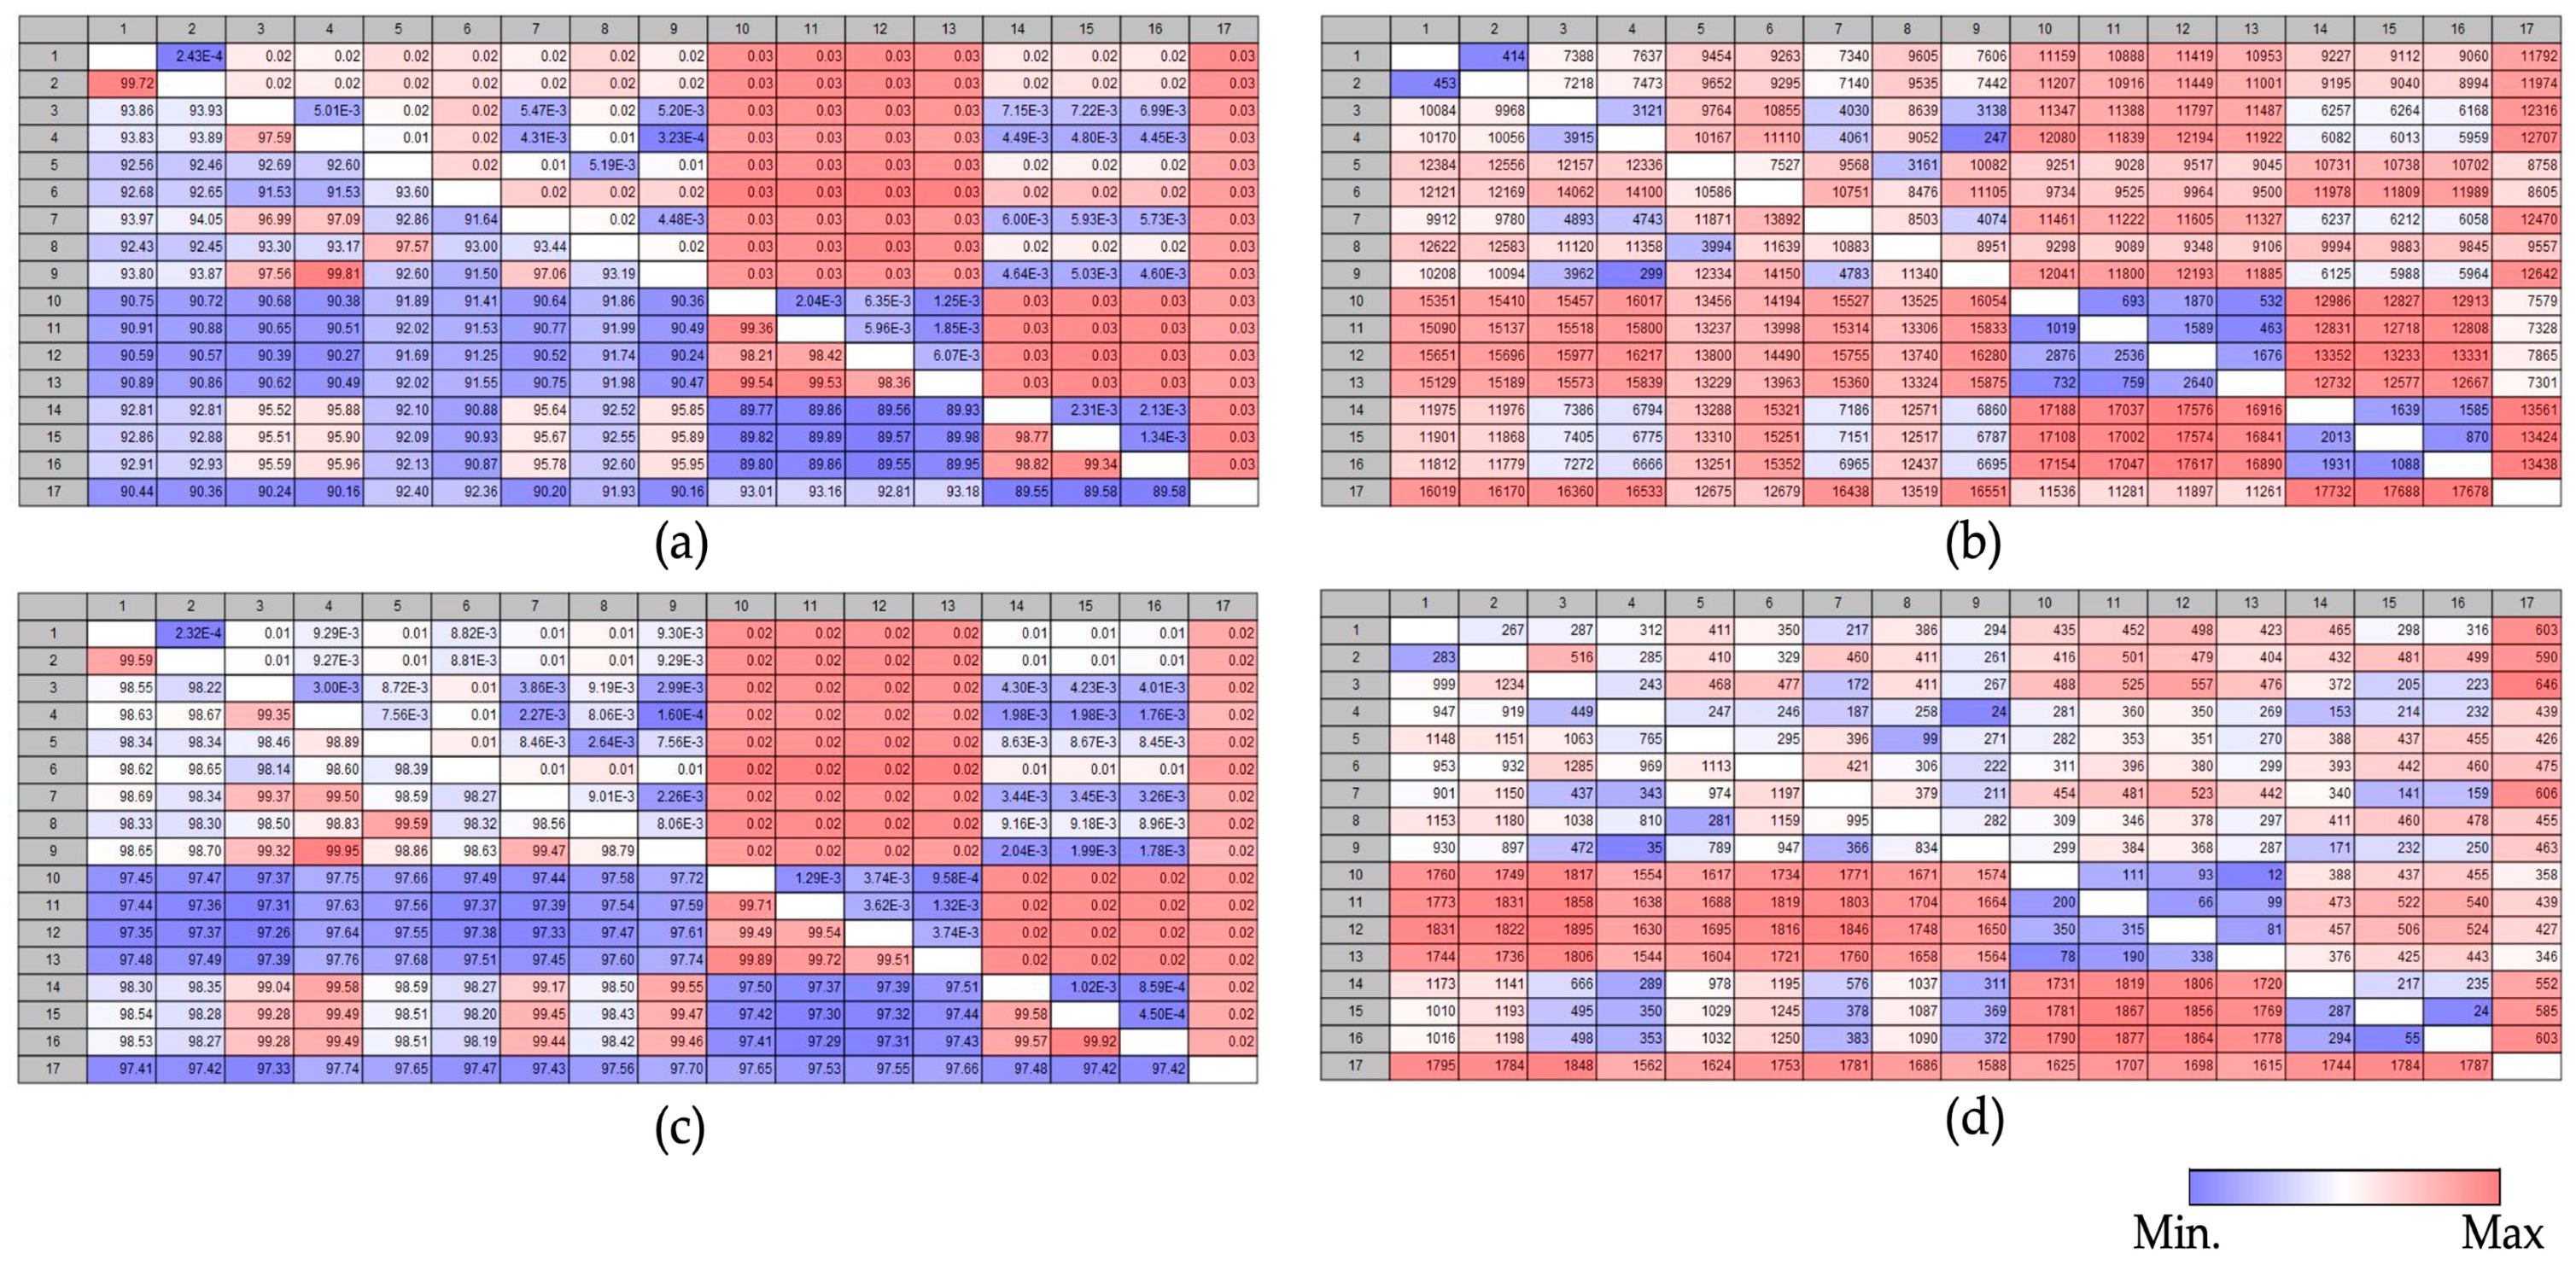
From the pairwise analysis results of 17 species in the Malvaceae family, we confirmed that they are well grouped by genus. First, the heatmaps of whole genome, within the Hibiscus genus, the combinations of H. sinosyriacus and H. syriacus (99.72% and 2.43 × 10⁻⁴), and H. taiwanensis and H. mutabilis (99.81% and 3.23 × 10⁻⁴) showed similar values for similarity and distance, respectively. H. coccineus showed close values with H. mutabilis (97.59% and 5.01 × 10⁻³), H. trionum (96.99% and 5.47 × 10⁻³), and H. taiwanensis (97.56% and 5.20 × 10⁻³). In the Gossypium genus, G. gossypioides and G. reimondii had the closest distance of 2.79 × 10⁻³, whereas G. herbaceum and G. reimondii were the most similar (99.23%). In the Abelmoschus genus, A. manihot and A. moschatus were the closest, at 99.95% similarity. The distances between A. esculentus and A. manihot and between A. esculentus and A. moschatus were both 6.95 × 10⁻⁴. The pairwise heatmap for “Gaps and differences” on the right appeared to be proportional to the sequence similarity on the left. Following this, upon examining the heatmaps for CDS, the identity and distance in relation to CDS displayed a pattern similar to that of the whole genome. The interspecies sequence similarity did not show significant differences when compared with those of the whole genome. As CDS sequences are better conserved than non-coding sequences, the sequence similarity for most species increased. However, the similarity between the combination of H. sinosyriacus and H. syriacus was observed to decrease to 99.59%, compared with 99.72% in the whole genome (Figure 6). Upon analyzing the sequence similarity differences among the three genera, contrary to the results from the SSR analysis, there was no significant difference between the Gossypium and Abelmoschus genera. However, there was a substantial difference between these two genera and Hibiscus, with values of 9.95 × 10⁻⁷ and 6.64 × 10⁻⁴, respectively. Furthermore, in the indices for gaps and differences, there was no significant difference between Abelmoschus and Hibiscus. However, significant differences were observed in the other two combinations, Hibiscus and Gossypium (2.67 × 10⁻²) and Gossypium and Abelmoschus (8.55 × 10⁻³) (Table 3).

3.6. Exploration of Variants in the CDS of Hibiscus spp.

In this comprehensive study of the cp genome of H. sinosyriacus, we successfully assembled it for the first time and explored its evolutionary relationship with eight closely related species, by examining variations within the CDS. Using H. sinosyriacus as the reference, 130 genes were examined. Notably, 36 genes showed no variations. These genes included 28 tRNA genes (such as trnH-GUG, trnK-UUU, trnQ-UUU, trnS-GCU, trnG-UCC, trnC-GCA, trnY-GUA, trnG-UCC, trnM-CAU, trnS-GGA, trnF-GAA, trnM-CAU, trnW-CCA, trnM-CAU, trnL-CAA, trnV-GAC, trnI-GAU, trnA-UGC, trnR-ACG, trnN-GUU, trnL-UAG, trnN-GUU, trnR-ACG, trnA-UGC, trnL-GAU, trnV-GAC, trnL-CAA, and trnI-CAU), 2 rRNA genes (rrn5), and 6 other genes. In an analysis of variants across different species, several distinct patterns emerged. In H. sinosyriacus, species-specific SNPs were identified in the CDS regions of the matK, psbC, ndhK, and ycf2 genes, with one SNP detected for each gene, totaling four SNPs. H. syriacus had only 4 species-specific SNPs, 6 common SNPs, and 3 species-specific inserts, resulting in a total variant count of 13. H. coccineus displayed 136 species-specific SNPs, 608 common SNPs, and a combined total of 198 indels, resulting in 942 variants. Both H. mutabilis and H. taiwanensis showed 4 species-specific SNPs, 655 common SNPs, and 815 and 821 total variants, respectively. H. sabdariffa had 76 species-specific SNPs, 708 common SNPs, and 1083 variants. H. rosa-sinensis contained 326 species-specific SNPs, 311 common SNPs, and 877 variants. H. trionum had 89 species-specific SNPs, 624 common SNPs, and 927 variants. Finally, H. cannabinus had 101 species-specific SNPs, 705 common SNPs, and 1067 variants. Indel regions were identified in the following 13 genes: matK, rpoB, atpB, rbcL, rpl20, rpl23, ccsA, rpoC2, rps14, accD, ycf2, ndh5, and ycf1. Species-specific indels were observed in several genes. The gene rpoC2 exhibited a species-specific insert exclusive to H. rosa-sinensis. Similarly, rps14 exhibited a species-specific insertion in H. rosa-sinensis. The accD gene revealed species-specific indels in H. trionum and a unique insert in H. rosa-sinensis. The ycf2 gene displayed general indels with species-specific inserts in H. trionum and H. rosa-sinensis. The ndh5 gene had species-specific indels in H. sabdariffa, H. trionum, and H. rosa-sinensis. Finally, the ycf1 gene presented general indels and species-specific indels in H. syriacus, H. rosa-sinensis, and H. coccineus. The ycf1 gene is particularly notable for its extensive variation. It harbored a diverse range of indels, especially between positions 5688 and 5742 bp, and was densely populated with species-specific SNPs and indels. Intriguingly, although H. sinosyriacus and H. syriacus exhibited significant similarities, a unique indel specific to H. syriacus was identified in this region. Among the 13 genes analyzed, matK, rpoB, atpB, rbcL, rpl20, rpoC2, and rps14 were located in the LSC region, whereas accD, ccsA, ndh5, and ycf1 were located in the SSC region, and rpl23 and ycf2 were duplicated and present in the IR regions (Table 4).
In the analysis of stop codon usage across various species, we examined the termination codons in 85 genes (Table S1). The distribution of stop codons was as follows: TAA, 55.95%; TGA, 20.78%; TAG, 23.27%. Among the nine Hibiscus spp. analyzed, variations in stop codons were observed for five genes: atpB, accD, petA, rpl16, and ccsA (Table 5). Specifically, for the atpB gene, H. sabdariffa and H. cannabinus both utilized TAG, whereas the remaining seven species used TGA. In the case of the accD gene, only H. trionum had TAA, whereas the other eight species used TAG. In the case of the petA gene, both H. sinosyriacus and H. syriacus used TAA, whereas the other seven species used TAG. In the case of the rpl16 gene, H. coccineus was the only species with TAA, with TAG being prevalent in the other eight species. Finally, in the case of the ccsA gene, only H. rosa-sinensis had TAA, whereas TGA was observed in the remaining eight species. The distribution of the variations was as follows: TAG to TGA in one instance, TAA to TAG in three instances, and TAA to TGA in one instance.

3.7. Compararive Phylogenetic Analyses

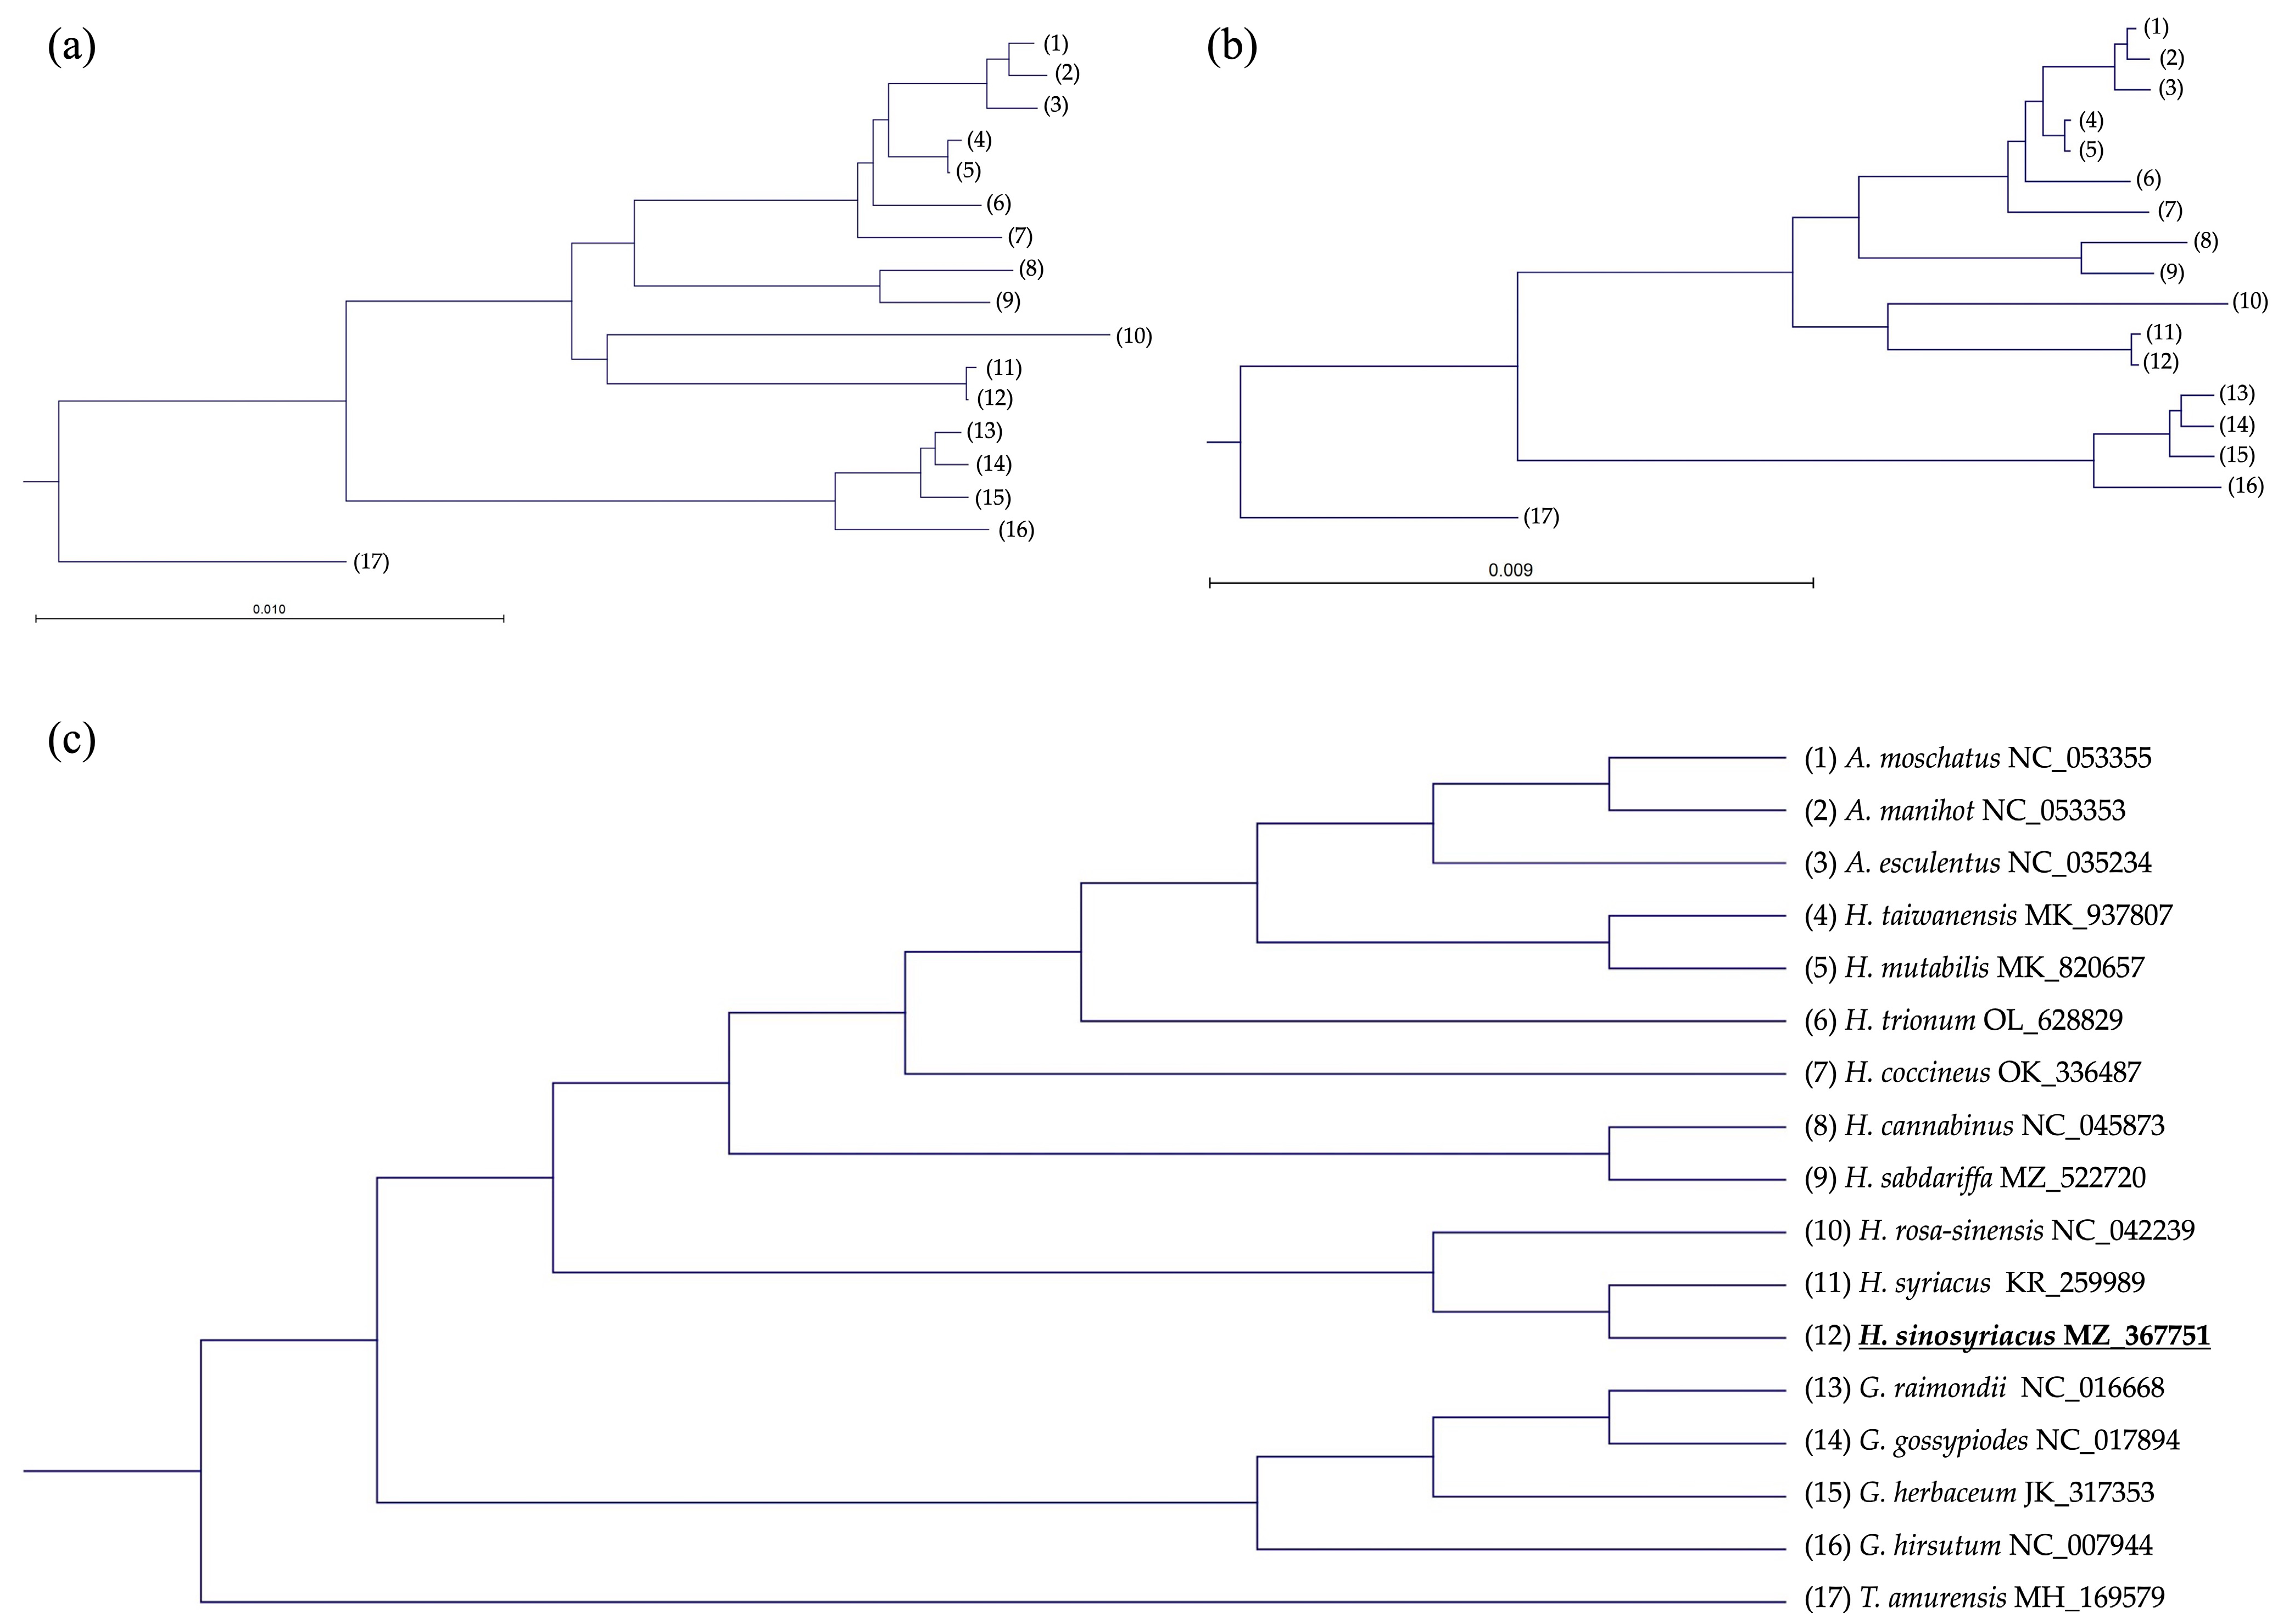
We performed a comparative analysis of phylogenetic trees derived from both the whole cp genome and CDS regions (Figure 7). The results from the pairwise heatmap analysis displayed minor differences between the whole genome and CDS. However, the comparative outcomes utilizing both phylogenetic trees were almost identical. Using 17 species from four genera of the Malvaceae family, we investigated the evolutionary process of H. sinosyriacus. Among the four genera, T. amurensis, which was anticipated to have the greatest genetic distance, appropriately diverged early as an outgroup. Subsequently, the Gossypium genus differentiated earlier than the other two genera. H. sinosyriacus, H. syriacus, and H. rosa-sinensis diverged earlier from other species, with H. sinosyriacus and H. syriacus displaying a monophyletic relationship. This was followed by the divergence of H. cannabinus and H. sabdariffa, both showing a monophyletic structure. H. coccineus and H. trionum sequentially differentiated in a paraphyletic manner. The remaining species of the Hibiscus genus, H. mutabilis and H. taiwanensis, diverged with the species of the Abelmoschus genus in a monophyletic pattern.

4. Discussion

This study successfully executed the assembly of the cp genome of H. sinosyriacus, and the data obtained from this study offer profound insights into the structure and content of the cp genome of this species. Notably, the lengths and compositions of the four distinct regions of the genome—LSC, IRs (IRa and IRb), and SSC—were consistent with those of many other angiosperm cp genomes. Additionally, the number of intrinsic genes and tRNAs found in the H. sinosyriacus cp genome underscores its complexity and diversity. The number of genes containing introns and their locations can indicate the structural characteristics and evolutionary significance of the genome.
An analysis of the cp genome structure of H. sinosyriacus and other related species provides crucial information for elucidating the structural differences and features of each genome. Gene positions at the boundaries between the four distinct regions of each genome play a pivotal role in observing large-frame insertions, deletions, and structural alterations within the genome. Specifically, the genome of the genus Abelmoschus showed an increase in the number of genes owing to the expansion of the IR region and the inclusion of rps19, rpl22, and rps3. Such changes may be associated with the movement or replication of specific genes during genome evolution. Moreover, the infA gene is the most mobile cp gene known in plants, and species of the genera Gossypium and Tilia have probably repeatedly transferred the infA gene from the cp to the nucleus for functional or evolutionary reasons [37]. Additionally, as plants evolve into higher plants, the infA gene tends to disappear from the cp. Although the gene is reported to be almost absent in the Malvales order, it has been confirmed that it remains intact in the cp of many higher plants, including those in the Hibiscus and Abelmoschus genera [17].
An analysis of SSRs in the cp genomes of 17 species, including H. sinosyriacus, provides vital information for understanding the structural characteristics and evolutionary patterns of the genome. The total number and distribution of SSRs varied between species and genera. In particular, Abelmoschus had the highest average number of SSRs. Such differences may stem from the evolutionary background and structural changes in the genomes of each genus. Statistical analysis revealed significant differences in SSR distribution among the three genera, interpreted as reflecting the evolutionary characteristics and genomic structural variability of each genus. In particular, the differences between Abelmoschus and Gossypium may be related to the evolutionary distance between the two genera. These findings offer valuable insights into plant evolution and diversity through SSR analyses of the cp genome.
Visualization analysis using the mVISTA program clearly delineated the cp genome sequence differences among 17 species, including H. sinosyriacus. Generally, sequence differences are observed more frequently in non-coding regions than in coding regions. In particular, the differences in the LSC region were noteworthy. In the coding regions, differences were frequently observed within specific genes, potentially reflecting evolutionary differences between species. Additionally, the position of the ycf1 gene exhibited two distinct patterns depending on the species. These differences in pattern may be related to the evolutionary background [22]. The similarities between H. sinosyriacus and H. syriacus align with the fact that the two species can be interbred and have similar flower morphologies. Furthermore, the unique sequence similarity patterns observed only in specific species may indicate a unique evolutionary background of this species.
Through a pairwise heatmap analysis of the overall identity and distance of the cp genome, clear genetic differences among the three genera, Hibiscus, Gossypium, and Abelmoschus, were identified. Color-coded clustering facilitates an intuitive understanding of sequence similarities and differences between species. Specifically, the Hibiscus genus showed significant genetic differences in most regions, compared with the other two genera. However, no significant differences were observed between Abelmoschus and Gossypium. These findings suggest that the Hibiscus genus may have unique evolutionary characteristics compared to the other two genera.
By studying the cp genome of H. sinosyriacus, evolutionary relationships with eight species were successfully explored, focusing on variations within the CDS. In this study, 130 genes were reviewed, with no variations found in 36 genes. These results suggested that certain genes maintained stable characteristics throughout the evolutionary process. Several unique patterns emerged in the analysis of variation among various species. Notably, a high similarity was observed between H. syriacus and H. sinosyriacus, but species-specific indels were found in H. syriacus. These results indicated that despite the close relationship between the two species, each has unique evolutionary characteristics. Additionally, species-specific indels were observed in each species, especially in the ycf1 gene, where various indels, as well as species-specific SNPs and indels, were densely distributed. These results indicated that the ycf1 gene underwent various mutations during the evolutionary process. An extensive analysis of stop codon usage confirmed the distributions of TAA, TGA, and TAG. For specific genes, there were species-specific differences in stop codon usage, which might be related to the genetic characteristics [38].
In this study, the comparative analysis of the phylogenetic tree based on the whole cp genome and the CDS region provides a crucial key to deeply understanding the evolutionary relationships among species within the Malvaceae family. The subtle differences in the pairwise heatmap analysis between the whole genome and the CDS region offer significant insights into how information is extracted from various parts of the genome. The early branching and interspecific relationships within the genera Gossypium and Hibiscus clarify the evolutionary characteristics and timeline of these genera. In particular, the close relationship between H. sinosyriacus and H. syriacus suggests that these two species share a common recent ancestor and are evolutionarily proximate. Additionally, the classification of T. amurensis emphasizes how this species is evolutionarily unique compared with other species.

5. Conclusions

This study offers foundational insights into the structure and function of the H. sinosyriacus cp genome and establishes a basis for more in-depth research on its evolutionary position. We provide a comprehensive understanding of the cp genome structure of H. sinosyriacus and related species, whereas emphasizing the significance of gene positions within their respective boundaries. These structural variations and gene placements reflect the evolutionary traits and adaptations of each species. Such data are pivotal for phylogenetic and evolutionary studies of these taxa. Our findings shed light on the genetic relationships and evolutionary nuances of species within the Hibiscus genus. The numerous species-specific variations and characteristics identified through interspecific variation analysis will be useful for distinguishing species and developing various markers in the future. This study underscores the significance of the cp genome in understanding plant evolution and offers a foundation for future research in the Malvaceae family.

Supplementary Materials

The following supporting information can be downloaded at: https://www.mdpi.com/article/10.3390/f14112221/s1, Table S1: Variations of stop codons among Hibiscus spp.

Author Contributions

Conceptualization, methodology, software, formal analysis, visualization, and writing—original draft, S.-H.K.; validation, investigation, resources, and supervision, H.-Y.K.; supervision, writing—review and editing, and project administration, Y.-I.C.; supervision, review of the manuscript, and funding acquisition, H.S. All authors have read and agreed to the published version of the manuscript.

Funding

This research was funded by the National Institute of Forest Science, grant number FG0403-2023-02-2023.

Data Availability Statement

The data presented in this study have been deposited in the NCBI (https://ncbi.nlm.nih.gov/, accessed on 12 October 2023) GenBank with the accession number MZ_367751. The associated BioProject, BioSample, and SRA numbers are PRJNA789673, SAMN24146414, and SRR17253293, respectively. This data can be accessed at NCBI GenBank using the accession number MZ_367751.

Conflicts of Interest

The authors declare no conflict of interest.

References

  1. Yamazaki, Y.; Kajita, T.; Takayama, K. Spatiotemporal process of long-distance seed dispersal in a pantropically distributed sea hibiscus group. Mol. Ecol. 2023, 32, 1726–1738. [Google Scholar] [CrossRef]
  2. Contreras, R.; Lattier, J.D. Targeted breeding of rose-of-sharon to improve a garden classic. Digger 2014, 215227, 47–50. [Google Scholar]
  3. Holser, R.A.; King, J.W.; Bost, G. Extraction of Lipid Components from Hibiscus Seeds by Supercritical Carbon Dioxide and Ethanol Mixtures; Los Alamos National Laboratory: Los Alamos, NM, USA, 2002; Available online: https://digital.library.unt.edu/ark:/67531/metadc928040/ (accessed on 7 November 2023).
  4. Mandaji, C.M.; Pena, R.d.S.; Chisté, R.C. Encapsulation of bioactive compounds extracted from plants of genus Hibiscus: A review of selected techniques and applications. Food Res. Int. 2022, 151, 110820. [Google Scholar] [CrossRef] [PubMed]
  5. Hsu, R.J.; Hsu, Y.C.; Chen, S.P.; Fu, C.L.; Yu, J.C.; Chang, F.W.; Chen, Y.H.; Liu, J.M.; Ho, J.Y.; Yu, C.P. The triterpenoids of Hibiscus syriacus induce apoptosis and inhibit cell migration in breast cancer cells. BMC Complement. Altern. Med. 2015, 15, 65. [Google Scholar] [CrossRef] [PubMed]
  6. Maganha, E.G.; da Costa Halmenschlager, R.; Rosa, R.M.; Henriques, J.A.; de Paula Ramos, A.L.; Saffi, J. Pharmacological evidences for the extracts and secondary metabolites from plants of the genus Hibiscus. Food Chem. 2010, 118, 1–10. [Google Scholar] [CrossRef]
  7. Yang, J.E.; Ngo, H.T.T.; Hwang, E.; Seo, S.A.; Park, S.W.; Yi, T.H. Dietary enzyme-treated Hibiscus syriacus L. protects skin against chronic UVB-induced photoaging via enhancement of skin hydration and collagen synthesis. Arch. Biochem. Biophys. 2019, 662, 190–200. [Google Scholar] [CrossRef]
  8. Molagoda, I.M.N.; Lee, K.T.; Choi, Y.H.; Jayasingha, J.A.C.C.; Kim, G.Y. Anthocyanins from Hibiscus syriacus L. inhibit NLRP3 inflammasome in BV2 microglia cells by alleviating NF-κB and ER stress-induced Ca2+ accumulation and mitochondrial ROS production. Oxid. Med. Cell. Longev. 2021, 2021, 1246491. [Google Scholar] [CrossRef]
  9. Beers, L.; Howie, J. Growing Hibiscus; Kangaroo Press: Kenthurst, UK, 1992; p. 94. [Google Scholar]
  10. Van Laere, K.; Van Huylenbroeck, J.M.; Van Bockstaele, E. Interspecific hybridisation between Hibiscus syriacus, Hibiscus sinosyriacus and Hibiscus paramutabilis. Euphytica 2007, 155, 271–283. [Google Scholar] [CrossRef]
  11. Yu, T.Y.; Yeam, D.Y. A survey on flower types and colors in Hibiscus syriacus L. J. Korean Soc. Hortic. Sci. 1972, 11, 55–61. [Google Scholar]
  12. Kim, J.H.; Lee, K.C. Studies on the flower color variation in Hibiscus syriacus L., 1; Spectral properties of fresh petals and flower color classification. J. Korean Soc. Hortic. Sci. 1991, 32, 102–110. [Google Scholar]
  13. Ha, Y.-M.; Shim, K.-K.; Kang, H.-C.; Lim, K.-B. A new cultivar ‘Tohagol Red’ with unique flower shape and color through interspecific hybridization of Hibiscus species. Flower Res. J. 2014, 22, 278–282. [Google Scholar] [CrossRef]
  14. Kretschmer, M.; Damoo, D.; Djamei, A.; Kronstad, J. Chloroplasts and plant immunity: Where are the fungal effectors? Pathogens 2020, 9, 19. [Google Scholar] [CrossRef]
  15. Cheng, Y.; Zhang, L.; Qi, J.; Zhang, L. Complete chloroplast genome sequence of Hibiscus cannabinus and comparative analysis of the Malvaceae family. Front. Genet. 2020, 11, 227. [Google Scholar] [CrossRef] [PubMed]
  16. Daniell, H.; Jin, S.; Zhu, X.G.; Gitzendanner, M.A.; Soltis, D.E.; Soltis, P.S. Green giant—A tiny chloroplast genome with mighty power to produce high-value proteins: History and phylogeny. Plant Biotechnol. J. 2021, 19, 430–447. [Google Scholar] [CrossRef] [PubMed]
  17. Daniell, H.; Lin, C.S.; Yu, M.; Chang, W.J. Chloroplast genomes: Diversity, evolution, and applications in genetic engineering. Genome Biol. 2016, 17, 134. [Google Scholar] [CrossRef]
  18. Jheng, C.F.; Chen, T.C.; Lin, J.Y.; Chen, T.C.; Wu, W.L.; Chang, C.C. The comparative chloroplast genomic analysis of photosynthetic orchids and developing DNA markers to distinguish Phalaenopsis orchids. Plant Sci. 2012, 190, 62–73. [Google Scholar] [CrossRef]
  19. Takayama, K.; Kajita, T.; Murata, J.; Tateishi, Y. Phylogeography and genetic structure of Hibiscus tiliaceus—Speciation of a pantropical plant with sea-drifted seeds. Mol. Ecol. 2006, 15, 2871–2881. [Google Scholar] [CrossRef]
  20. Nguyen, V.; Park, H.; Lee, S.; Lee, J.; Park, J.; Yang, T. Authentication markers for five major Panax species developed via comparative analysis of complete chloroplast genome sequences. J. Agric. Food Chem. 2017, 65, 6298–6306. [Google Scholar] [CrossRef]
  21. Padolina, J.; Linder, C.R.; Simpson, B.B. A phylogeny of Phalaenopsis using multiple chloroplast markers. Selbyana 2005, 26, 23–27. [Google Scholar]
  22. Olsson, S.; Grivet, D.; Cid-Vian, J. Species-diagnostic markers in the genus Pinus: Evaluation of the chloroplast regions matK and ycf1. For. Syst. 2018, 27, e016. [Google Scholar] [CrossRef]
  23. Cheng, Y.C.; Houston, R. Evaluation of the trnK-matK-trnK, ycf3, and accD-psal chloroplast regions to differentiate crop type and biogeographical origin of Cannabis sativa. Int. J. Legal Med. 2021, 135, 1235–1244. [Google Scholar] [CrossRef] [PubMed]
  24. Susanna, A.; Garcia-Jacas, N.; Hidalgo, O.; Vilatersana, R.; Garnatje, T. The Cardueae (Compositae) revisited: Insights from ITS, trnL-trnF, and matK nuclear and chloroplast DNA analysis. Ann. Mo. Bot. Gard. 2006, 93, 150–171. [Google Scholar] [CrossRef]
  25. Shaw, J.; Lickey, E.B.; Schilling, E.E.; Small, R.L. Comparison of whole chloroplast genome sequences to choose noncoding regions for phylogenetic studies in angiosperms: The tortoise and the hare III. Am. J. Bot. 2007, 94, 275–288. [Google Scholar] [CrossRef] [PubMed]
  26. Dierckxsens, N.; Mardulyn, P.; Smits, G. NOVOPlasty: De novo assembly of organelle genomes from whole genome data. Nucleic Acids Res. 2017, 45, E18. [Google Scholar] [PubMed]
  27. Tillich, M.; Lehwark, P.; Pellizzer, T.; Ulbricht-Jones, E.S.; Fischer, A.; Bock, R.; Greiner, S. GeSeq—Versatile and accurate annotation of organelle genomes. Nucleic Acids Res. 2017, 45, W6–W11. [Google Scholar] [CrossRef]
  28. Beier, S.; Thiel, T.; Münch, T.; Scholz, U.; Mascher, M. MISA-web: A web server for microsatellite prediction. Bioinformatics 2017, 33, 2583–2585. [Google Scholar] [CrossRef]
  29. Ostertagová, E.; Ostertag, O.; Kováč, J. Methodology and application of the Kruskal-Wallis test. Appl. Mech. Mater. 2014, 611, 115–120. [Google Scholar] [CrossRef]
  30. Dinno, A.; Dinno, M.A. Package ‘dunn. test’. CRAN Repos 2017, 10, 1–7. [Google Scholar]
  31. Sievers, F.; Wilm, A.; Dineen, D.; Gibson, T.J.; Karplus, K.; Li, W.; Lopez, R.; McWilliam, H.; Remmert, M.; Söding, J.; et al. Fast, scalable generation of high-quality protein multiple sequence alignments using Clustal Omega. Mol. Syst. Biol. 2011, 7, 539. [Google Scholar] [CrossRef]
  32. Matvienko, M. CLC Genomics Workbench. In Proceedings of the Plant and Animal Genome Conference, San Diego, CA, USA, 10–14 January 2015; CLC Bio: Aarhus, Denmark, 2015. [Google Scholar]
  33. Lu, G.; Moriyama, E.N. Vector NTI, a balanced all-in-one sequence analysis suite. Brief. Bioinform. 2004, 5, 378–388. [Google Scholar] [CrossRef]
  34. Reginato, M.; Neubig, K.M.; Majure, L.C.; Michelangeli, F.A. The first complete plastid genomes of Melastomataceae are highly structurally conserved. PeerJ 2016, 4, e2715. [Google Scholar] [CrossRef]
  35. Wang, X.; Zhou, T.; Bai, G.; Zhao, Y. Complete chloroplast genome sequence of Fagopyrum dibotrys: Genome features, comparative analysis and phylogenetic relationships. Sci. Rep. 2018, 8, 12379–12388. [Google Scholar] [CrossRef]
  36. Mayor, C.; Brudno, M.; Schwartz, J.R.; Poliakov, A.; Rubin, E.M.; Frazer, K.A.; Pachter, L.S.; Dubchak, I. VISTA: Visualizing global DNA sequence alignments of arbitrary length. Bioinformatics 2000, 16, 1046. [Google Scholar] [CrossRef] [PubMed]
  37. Millen, R.S.; Olmstead, R.G.; Adams, K.L.; Palmer, J.D.; Lao, N.T.; Heggie, L.; Kavanagh, T.A.; Hibberd, J.M.; Gray, J.C.; Morden, C.W.; et al. Many parallel losses of infA from chloroplast DNA during angiosperm evolution with multiple independent transfers to the nucleus. Plant Cell 2001, 13, 645–658. [Google Scholar] [CrossRef] [PubMed]
  38. Wei, S.; Yong, B.; Jiang, H.; An, Z.; Wang, Y.; Li, B.; Yang, C.; Zhu, W.; Chen, Q.; He, C. A loss-of-function mutant allele of a glycosyl hydrolase gene has been co-opted for seed weight control during soybean domestication. J. Integr. Plant Biol. 2023. [Google Scholar] [CrossRef] [PubMed]
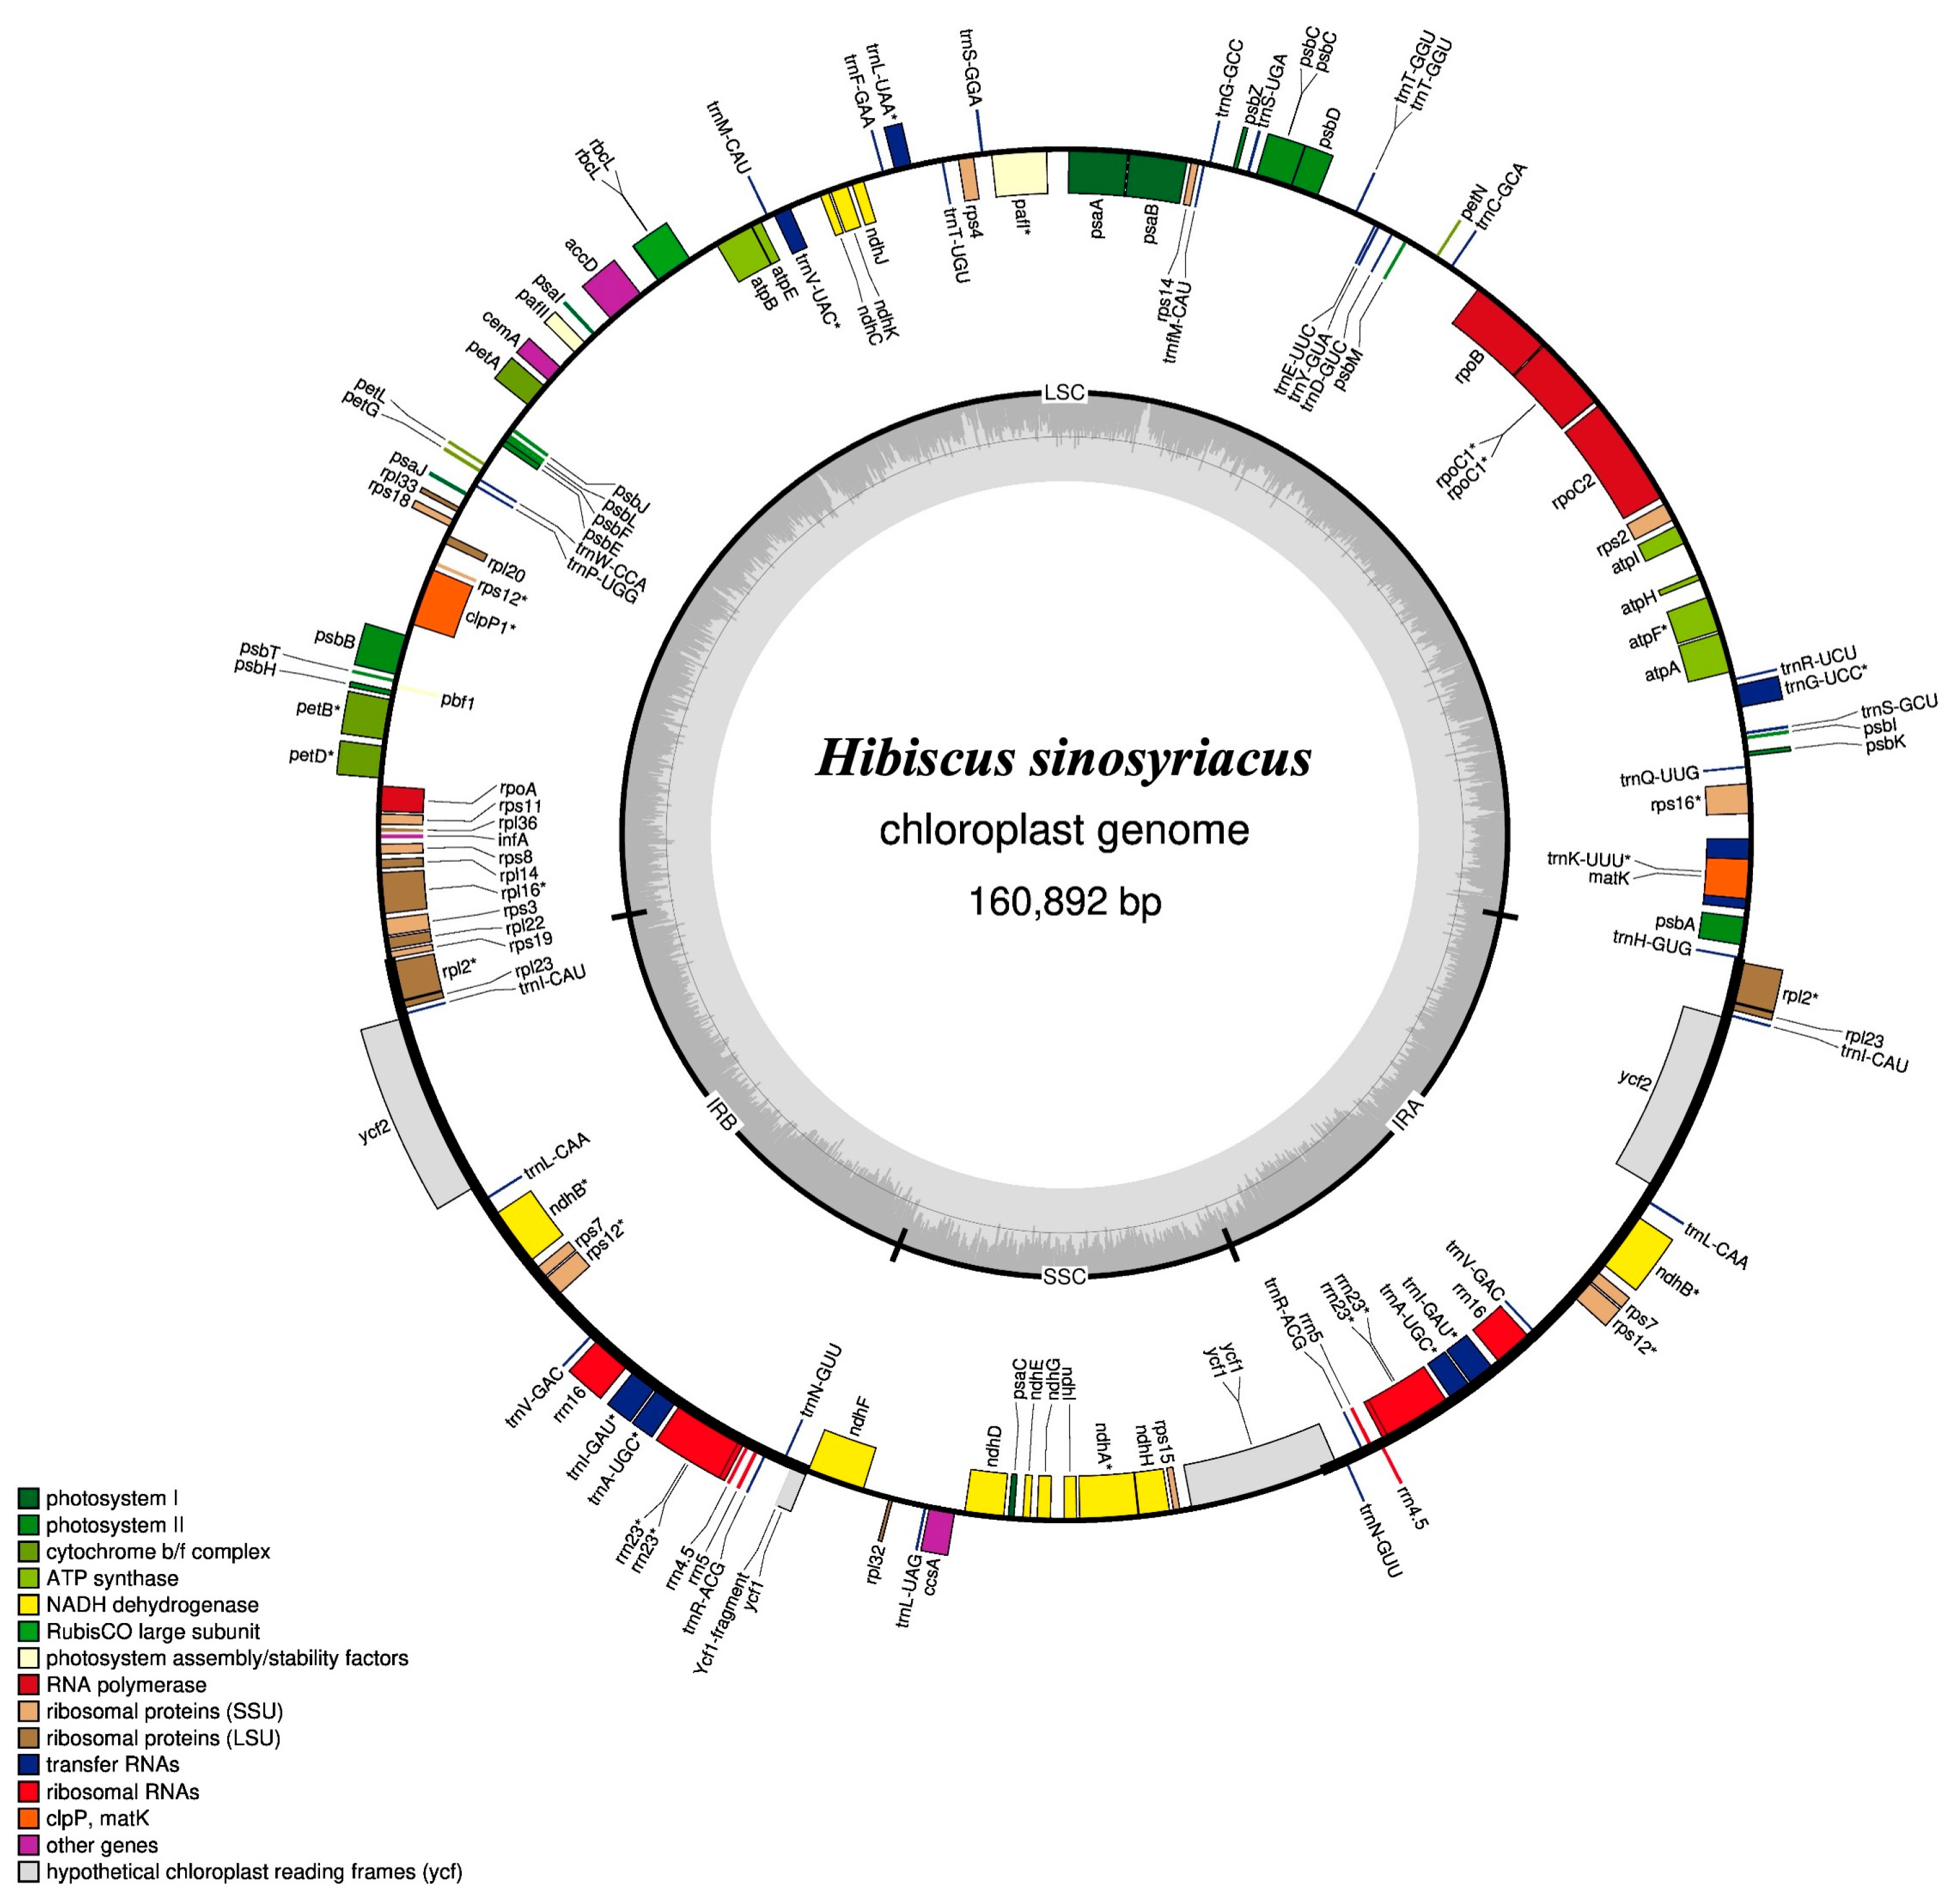
Figure 1. Circular map of the chloroplast genome of H. sinosyriacus. Genes, tRNAs, and rRNAs are presented as different-colored boxes on the outer circle. The inner circle shows the quadrant structure of the chloroplast genome. The dark gray circle shows the GC content, whereas light gray circle shows the AT content along the genome. cp, chloroplast; LSC, large single-copy; IRA, inverted repeat A; SSC, small single-copy; IRB, inverted repeat B. * indicates the presence of one and more introns.
Forests 14 02221 g001
Figure 2. Distance between adjacent genes and junctions of the SSC, LSC, and two IR regions among plastid genomes of 17 species.
Forests 14 02221 g002
Figure 3. Structural variations in the infA gene among different genera in the Malvaceae family.
Forests 14 02221 g003
Figure 4. SSR analysis in 17 species of the Malvaceae family. (Left), region-specific SSRs; (Right), SSRs presented by repeat motif lengths.
Forests 14 02221 g004
Figure 5. Visualization of alignment identity among 16 species. Sequences were annotated and identified using different colors. Sequence identity ratio has been presented through vertical depth, using H. sinosyriacus as a reference.
Forests 14 02221 g005
Figure 6. Pairwise comparison heatmap. (a) Percent identities and distances of whole genomes, (b) gaps and differences in whole genomes, (c) percent identities and distances of CDSs, and (d) gaps and differences in CDSs. (a,c) Top, distances; bottom, percent identities. (b,d) Top, differences; bottom, gaps. CDS, coding sequence. 1, H. sinosyriacus; 2, H. syriacus; 3, H. coccineus; 4, H. mutabilis; 5, H. sabdariffa; 6, H. rosa-sinensis; 7, H. trionum; 8, H. cannabinus; 9, H. taiwanensis; 10, G. gossypioides; 11, G. herbaceum; 12, G. hirsutum; 13, G. raimondii; 14, A. esculentus; 15, A. manihot; 16, A. moschatus; 17, T. amurensis.
Forests 14 02221 g006
Figure 7. Phylogenetic analysis of 17 species of the Malvaceae family. (a) Phylogenetic tree derived from whole cp genome, (b) phylogenetic tree derived from CDS, and (c) cladogram. Phylograms were drawn using the maximum likelihood method, with the CLC main workbench version 23.0.2 program. Bootstrap values derived from 1000 pseudo replicates were indicated near the nodes. The numbers at the tips of the branches in phylogenetic trees (a,b) correspond to the numbered species in the cladogram (c).
Forests 14 02221 g007
Table 1. Summary of the complete cp genomes of 17 species of the Malvaceae family.
Genome Size (bp)LSCIRBSSCIRANumber of GenesProtein Coding GenestRNArRNAGC Contents (%)
H. sinosyriacus160,89289,74725,74219,66125,7421308537836.85
H. syriacus161,02289,70125,74519,83125,7451308537836.83
H. mutabilis160,87989,35326,30018,92626,3001308537836.92
H. coccineus160,28089,12126,24318,67326,2431308537836.92
H. sabdariffa162,42890,32726,10019,90126,1001308537836.74
H. rosa-sinensis160,95189,51125,59720,24625,5971308537836.99
H. trionum160,53089,27226,15218,95426,1521308537836.90
H. cannabinus162,90390,35126,53319,48626,5331308537836.65
H. taiwanensis161,05689,53825,41920,68025,4191308537836.89
G. gossypiodes159,95988,77925,58820,00425,5881298437837.31
G. herbaceum160,14088,71125,60420,22125,6041298437837.31
G. hirsutum160,30188,81725,60220,28025,6021298437837.24
G. raimondii160,16188,65425,65120,20525,6511298437837.31
A. esculentus163,12188,09127,99919,03227,9991338837836.74
A. manihot163,42888,21428,14018,93428,1401338837836.70
A. moschatus163,43088,26328,11818,93128,1181338837836.71
T. amurensis162,56491,10025,49320,47825,4931298437836.51
Table 2. Gene contents in the cp genome of H. sinosyriacus.
RoleGroup of GeneName of GeneNo.
PhotosynthesisPhotosystem IpsaA, psaB, pasC, psaI, psaJ5
Photosystem IIpsbA, psbK, psbI, psbM, psbD, psbF, psbC, psbH, psbJ, psbL, psbE, psbN, psbB13
Cytochrome b/f complexpsbT, psbZ, petN, petA, petL, petG, petD 1, petB 18
ATP synthaseatpI, atpH, atpA, atpF 1, atpE, atpB6
Cytochrome c-type synthesisccsA1
Assembly/stability of photosystem Iycf3(pafI) 3, ycf4(pafII)2
NADPH dehydrogenasendhB *1, ndhH, ndhA 1, ndhI, ndhG, ndhJ, ndhE, ndhF, ndhC, ndhK, ndhD12
RubiscorbcL1
Transcription and translation Small subunit of ribosomerpoA, rpoC2, rpoC1 1, rpoB, rps16 1, rps2, rps14, rps4, rps18, rps12 ***1, rps11, rps8, rps3, rps19, rps7 *, rps1518
Large subunit of ribosomerpl33, rpl20, rpl36, rpl14, rpl16 1, rpl22, rpl2 *1, rpl23 *, rpl3211
Translational initiation factorinfA1
Ribosomal RNArrn16 *, rrn4.5 *, rrn5 *, rrn23 *8
Transfer RNAtrnH-GUG, trnK-UUU 1, trnQ-UUG, trnS-GCU, trnS-UCC 1, trnR-UCU, trnC-GCA, trnD-GUC,
trnY-GUA, trnE-UUC 1**, trnI-GGU, trnS-UGA,
trnG-UCC, trnfM-CAU **, trnS-GGA, trnT-UGU, trnL-UAA 1, trnF-GAA, trnV-UAC 1, trnW-CCA, trnP-GGU, trnL-CAA *, trnV-GAC *, trnA-UGC 1*, trnR-ACG *, trnN-GUU *, trnL-UAG, trnI-CAU
37
OtherRNA processingmatK1
Carbon metabolismcemA1
Fatty acid synthesisaccD1
ProteolysisclpP1  21
Component of TIC complexycf11
Hypothetical proteinsycf2 *2
Total number of genes 130
1 Contained one intron in the gene. 2 Contained two introns in the gene. 3 Contained three introns in the gene. * There are two copies in the genome. ** There are three copies in the genome. *** Trans-spliced gene.
Table 3. Statistical analysis of variants and differences in the cp genomes of Hibiscus sinosyriacus and related species.
Variants TypeKruskal–Wallis TestPost hoc Analysis
p-ValueH-GG-AA-H
SSRs7.39 × 10−3 **1.32 × 10−12.60 × 10−3 **6.04 × 10⁻²
Identities4.64 × 10−8 ***9.95 × 10⁻⁷ ***1.006.64 × 10−4 ***
Differences8.52 × 10−3 **3.56 × 10−2 *4.42 × 10−3 **3.24 × 10⁻¹
Gaps1.39 × 10−2 *2.30 × 10−2 *1.17 × 10−2 *6.87 × 10−1
Gaps and differences1.21 × 10−2 *2.67 × 10−2 *8.55 × 10−3 **5.46 × 10⁻¹
The non-parametric Kruskal–Wallis test was used to assess significance, followed by post hoc analyses using the Dunn’s test with Bonferroni correction for multiple comparisons. H, Hibiscus genus; G, Gossypium genus; A, Abelmoschus genus. *** p < 0.001, ** 0.001 ≤ p < 0.01, * 0.01 ≤ p < 0.05.
Table 4. Summary of variation among CDS of nine Hibiscus spp.
NameSNPIndelsVariants Total
Species-Specific SNPCommonTotal SNPSpecies-Specific InsertSpecies-Specific DeletionCommon InsertCommon DeletionTotal Indel
H. sinosyriacus444
H. syriacus46103313
H. coccineus1366087446189975198942
H. mutabilis46556598769156815
H. sabdariffa7670878419151561092991083
H. rosa-sinensis326311637102155172240877
H. trionum8962471326810575214927
H. cannabinus101705806621441092611067
H. taiwanensis46556598775162821
Table 5. Variation of stop codons among genes of nine Hibiscus spp.
Gene NameH. sinosyriacusH. syriacusH. coccineusH. mutabilisH. sabdariffaH. rosa-sinensisH. trionumH. cannabinusH. taiwanensis
atpBTGATGATGATGATAGTGATGATAGTGA
accDTAGTAGTAGTAGTAGTAGTAATAGTAG
petATAATAATAGTAGTAGTAGTAGTAGTAG
rpl16TAGTAGTAATAGTAGTAGTAGTAGTAG
ccsATGATGATGATGATGATAATGATGATGA
Disclaimer/Publisher’s Note: The statements, opinions and data contained in all publications are solely those of the individual author(s) and contributor(s) and not of MDPI and/or the editor(s). MDPI and/or the editor(s) disclaim responsibility for any injury to people or property resulting from any ideas, methods, instructions or products referred to in the content.