Article

Introgression as an Important Driver of Geographic Genetic Differentiation within European White Oaks

1
Thuenen-Institute of Forest Genetics, Sieker Landstrasse 2, 22927 Großhansdorf, Germany
2
Department of Forestry and Landscape Design, Bashkir State Agrarian University, 50-Letiya Oktyabrya Str.-34, 450001 Ufa, Russia
*
Author to whom correspondence should be addressed.
Forests 2023, 14(12), 2279; https://doi.org/10.3390/f14122279
Submission received: 15 October 2023 / Revised: 12 November 2023 / Accepted: 16 November 2023 / Published: 21 November 2023
(This article belongs to the Section Genetics and Molecular Biology)

Abstract

:
The genetic composition of 5797 white oaks assigned in forest inventories as Quercus robur (3342), Quercus petraea (2090), Quercus pubescens (170), or as unspecified Quercus. spp. (195) sampled all over Europe were genotyped at 355 nuclear SNPs and 28 maternally inherited SNPs of the chloroplast and mitochondria. The sampling had a focus on Central and Eastern Europe, as well as the Black Sea and Caucasus region. Using a sparse nonnegative matrix factorization (snmf) algorithm, the nuclear genetic information was best represented by K = 4 different genetic clusters, whereas a principal component analysis visualized three different groups. The snmf run with K = 3 corresponded, for most individuals with the assignment in the forest inventories, to the three different species. The majority of the samples (88%) had an admixture coefficient q > 0.8 for one of the three species clusters, underlining the species integrity with a minor level of admixture. In contrast to Q. petraea, Q. robur and Q. pubescens showed a clear geographic genetic substructure. These large-scale within-species genetic structures were correlated to regionally variable levels of introgression between the species. For Q. petraea, introgression from Q. robur and Q. pubescens was less focused to particular regions, and this widespread inter-specific gene flow reduced the geographic genetic differentiation. The genetic variation at the maternally inherited SNPs led to 12 different haplotypes with a clear cross-species geographic pattern, further supporting the observation of significant hybridization and introgression among the species.

1. Introduction

The three major white oak species in Europe—Quercus robur L., Quercus petraea (Matt.) Liebl., and Quercus pubescens Willd. (Fagaceae)—are of great economic and ecological importance and are promising species adapting to climate change in European forests [1]. The species’ distributions and their dependency on environmental factors have been studied on stand and regional scales [2,3,4]. Recently the different abundance of the species has been linked to differences in their genomic composition and genetic adaptation [2].
For decades, morphological traits, especially leaf traits, have been used to distinguish the European white oak species [5,6,7]. Often these studies incorporate genetic analysis [8,9,10]. In these combined studies, the genetic assignment is used to define the pure or hybrid individuals [11,12,13]. The authors of these types of publications often came up with quite contrasting taxonomical classifications [14]. This is particularly true in the case of Q. pubescens [7,15,16].
From both controlled crosses and population genetic studies of the mating system, we know that a certain level of hybridization among the different white oak species occurs [17,18], although the frequency is low and highly variable among individuals, and there is selection against hybrids [9,19]. The success of the controlled hybridization is not equal, depending on the species and crossing direction [19]. The pattern of large-scale chloroplast haplotype distribution is independent of the species, further indicating the results of hybridization and introgression in the past [20].
Adaptive introgression among the species has been assumed to be a driver for the local adaptation of the European white oaks [21]. Nevertheless, there is genetic variation that is causal for species barriers and maintaining the genetic identity of the white oak species [22].
Recently we studied the large-scale genetic pattern of pedunculate oak and found a significant genetic structure in the northwestern part of Germany that can be partly explained by introgression from Q. petraea [23]. For the present paper, we wanted to expand on the work of our former study on the large-scale genetic structures of pedunculate oaks by examining samples of putative sessile and downy oaks oak trees sampled in different regions in Europe. Unique to our study is the large number of oak samples from the Northern Caucasus and Crimea. This area is known to be a hotspot of white oak species diversity, but in contrast to other hotspots in Italy [12] and Romania [24], it has not received much attention in genetic studies. Being one of the Earth’s most important refugia during several repeated glacial maxima [25] and one of the world’s biodiversity hotspots [26], the region has great species diversity, with a high proportion of endemic taxa [27]. The vast oak forests in this territory contain many species and subspecies of the genus Quercus L., including Q. petraea, Q. robur, and Q. pubescens. The most common and often coexisting white oak species throughout Europe are represented in the Caucasus by several endemic subspecies [28]. The delineation of these taxa is difficult and controversial due to presumable widespread ongoing hybridization and introgression among all the three species [29], leading to continuous overlap in terms of variation in morphological traits [30].
By using a large set of nuclear and plastid SNPs, we first wanted to look for the number of genetic clusters on the species level and then focus on within-species genetic differentiation. This gave us evidence for the real number of biological species. Another key point of focus was to check how good results on species assignment from forest inventories match with the genetic species classification. Furthermore, we intended to study to what extent does introgression among the three main European white oak species provide an explanation for within-species genetic differentiation. Are there differences in this in different regions in Europe, contributing to a large-scale spatial genetic structure?

2. Materials and Methods

2.1. Sampling

We collected samples (cambium or leaves) from 5797 white oak trees at 636 locations all over Europe (Figure 1). The majority of the samples came from Central and Eastern Europe, as well as from the Black Sea and Caucasus region. As putative species, the samples included 3342 Q. robur, 2090 Q. petraea, 170 Q. pubescens, and 195 unspecified white oak samples (Figure 1, Supplementary Table S1). The presumed species of the samples were derived from the species classification of the stands of origin (i.e., based on the work of forests experts in the context of forest inventories and/or the preparation of forest management plans). In general, leaf morphological traits and fruit morphology are considered for this species classification, but no specific protocol exists. Only stands with a single species classification were considered in this study. The sample size varied between 1 and 48 trees at each location. The vast majority (95%) of the samples were collected in forest stands, whereas few samples were taken from provenance trials. Most material was derived from adult trees with diameters at breast height above 20 cm.

2.2. DNA Extraction and Genotyping

The DNA was extracted according to Dumolin et al. [31]. For all samples, 406 polymorphic nuclear loci, 21 polymorphic chloroplast SNPs, and 7 mitochondrial SNPs were analyzed based on targeted genotyping via sequencing [32].
Specifically, single-primer enrichment technology was used for genotyping. Sequencing data with 75 bp single reads at 200× coverage per sample was produced using Illumina NextSeq (LGC Genomics GmbH, Berlin, Germany). Raw reads with an average phred score of <30 over a window of ten bases, as well as reads containing adapter sequences, were trimmed, and reads shorter than 65 bp or containing any Ns were excluded. Read alignments against self-assembled contigs were produced using Bowtie2 v2.2.3 software [33]. Variant calling was carried out using Freebayes v1.3.2. Variant detection on organelle contigs was performed using the ploidy = 1 option and on nuclear contigs using the ploidy = 2 option. Genotypes were filtered for a minimum mean coverage of 3 reads using vcftools v0.1.15 software [34].

2.3. Data Filtering

We used the “quality check” option for the SNPs implemented in the GDA-NT 2021 program [35]. For this, all data were aggregated together as a single population. The thresholds for the data filtering were as follows: the proportion of missing data was <0.1, the mean FIS values at nuclear loci were >−0.3, the effective number of alleles was (v) > 1.02. This filtering led to a final set of 355 nuclear SNPs, 14 chloroplast SNPs, and 7 mitochondria SNPs. Each of the 5797 individuals had less than 10% missing data at the remaining set of 376 SNPs.

2.4. Sparse Non-Negative Matrix Factorization

We computed the ancestry proportions of all individuals using the sNMF function implemented in the R package LEA [36] as a fast alternative to the STRUCTURE program [37]. The application of STRUCTURE is time consuming and relies on assumptions such as Hardy–Weinberg Equilibrium. Further, STRUCTURE results are sensitive to uneven sample sizes [38]. The sNMF function applies a sparse non-negative matrix factorization algorithm [39]. We ran the function with all 355 nuclear SNPs for all K-values from 1 to 10, with 40 repetitions each. The value of K that minimized cross-entropy was selected. The function was also applied within each of the three species for all individuals with an admixture coefficient q > 0.8 for the respective species. Within the species, all K-values from 1 to 10 with 40 repetitions were tested, and the K with minimized cross-entropy was selected.

2.5. Principal Component Analysis (PCA)

We transformed the genotypes at each of the 355 nSNPs into a matrix of 0, 0.5, and 1, coding for absence, heterozygosity, and homozygosity for the major allele at each locus. The matrix was then used for a PCA using PAST software version 4.03 [40].

2.6. Haplotypes

We used the DNA sequences of the 21 chloroplast SNPs and the 7 mitochondrial SNPs to develop a haplotype network using the minimum spanning method [41], as implemented in the POPART (software, version 1.7) [42]. The haplotype network was made to provide insights into the phylogenetic relationship of the different haplotypes.

3. Results

3.1. Number of Genetic Clusters Using All Individuals

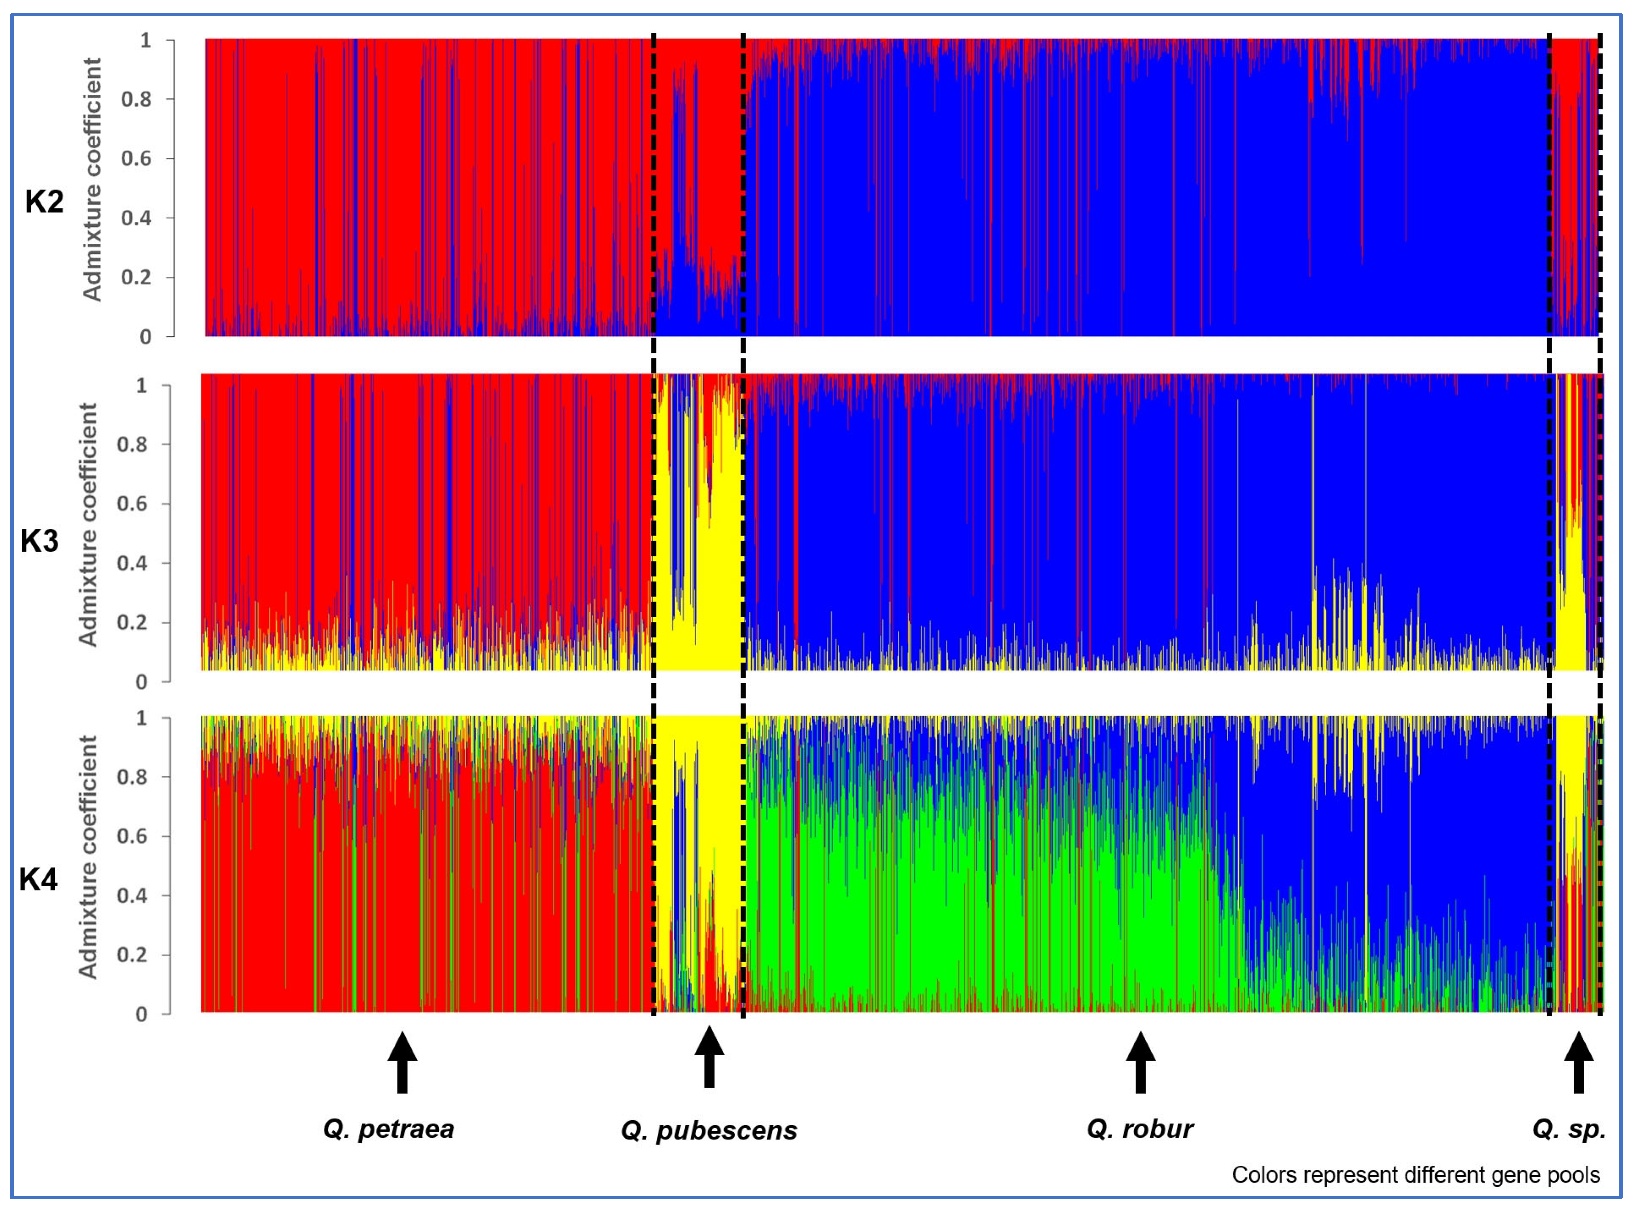
The sNMF runs came up with K = 4 as best fit to the data for all 5797 white oak trees, but the difference in cross-entropy to K = 3 was small (Supplementary Figure S1). The main change between K = 3 and K = 4 was that the putative Q. robur trees were subdivided into two groups in K = 4 (Figure 2). The difference between K = 2 and K = 3 was that the supposed Q. pubescens became grouped together with the Q. petraea in K = 2.
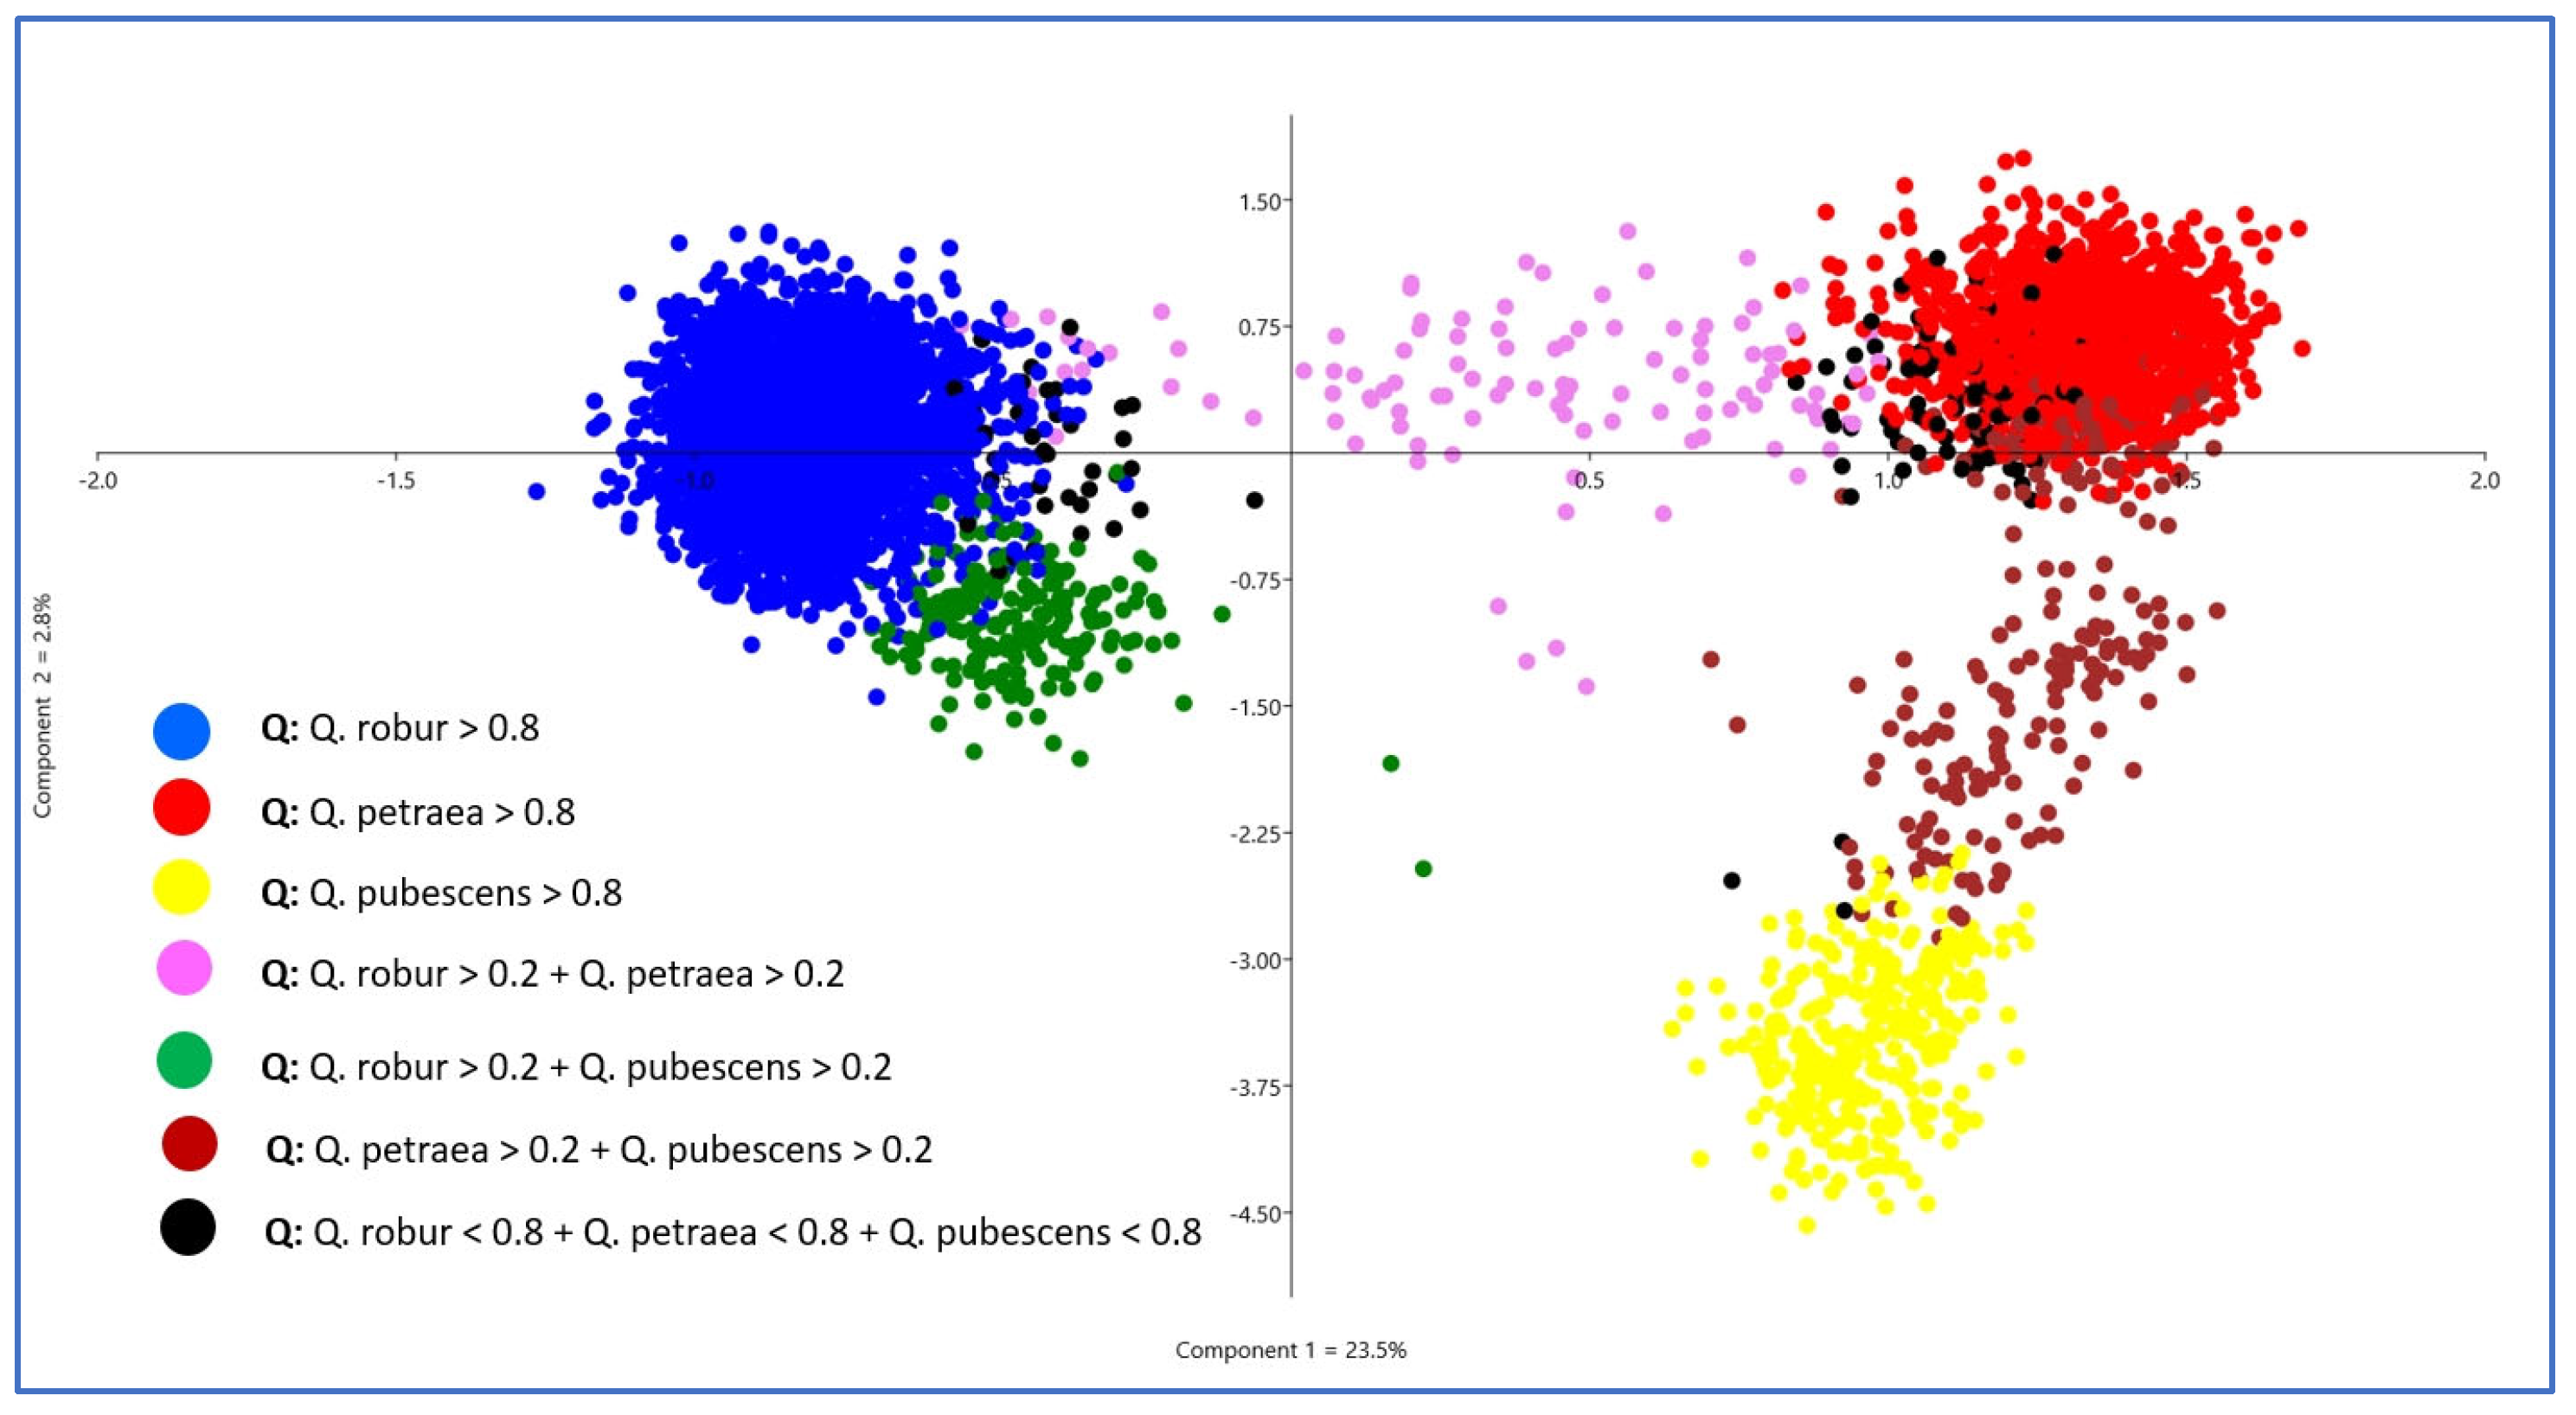
The PCA resulted in three clearly visible clouds of points, indicating the presence of three genetic groups (species) and matching well with the biologically meaningful sNMF run K = 3. For K = 3, the intermediate individuals between the centers of the PCA point clouds also fit well with admixture proportions (Figure 3). Furthermore, the sNMF run K = 3 also matched well with the a priori species declarations (Table 1). The majority of the red-marked individuals were sampled as Q. petraea, the blue ones as Q. robur, and the yellow ones as Q. pubescens. For all further analyses, we used the individual admixture coefficients of the sNMF run with K = 3 to assign individuals with K1 > 0.8 as Q. petraea (red), K2 > 0.8 as Q. robur (blue), and K3 > 0.8 as Q. pubescens (yellow).
For the selected sNMF run with K = 3, 88% of all individuals had ancestral coefficients larger than 0.8. The pre-classification of species was confirmed with the corrects species admixture proportion q ≥ 0.8 for 91% of the Q. robur, 67% of Q. petraea, and 69% of Q. pubescens (Table 1). A proportion of 3% of the Q. robur individuals were genetically assigned to Q. petraea. Most misclassifications were observed for Q. petraea, with 11% being genetically Q. robur and 6% Q. pubescens. A proportion of 31% of the Q. pubescens individuals had admixture proportions of a second species > 20%. From the group of unspecified white oak trees (Q. sp.), 52% of the individuals had an admixture proportion q > 0.2 for two species.
Interestingly, none of the pre-classified Q. petraea trees in the Caucasus–Crimea region had an admixture proportion for the Q. petraea gene pool of at least 0.8, and none of the putative Q. pubescens trees in Western and Southern Europe had q values of the Q. pubescens gene pool > 0.8.
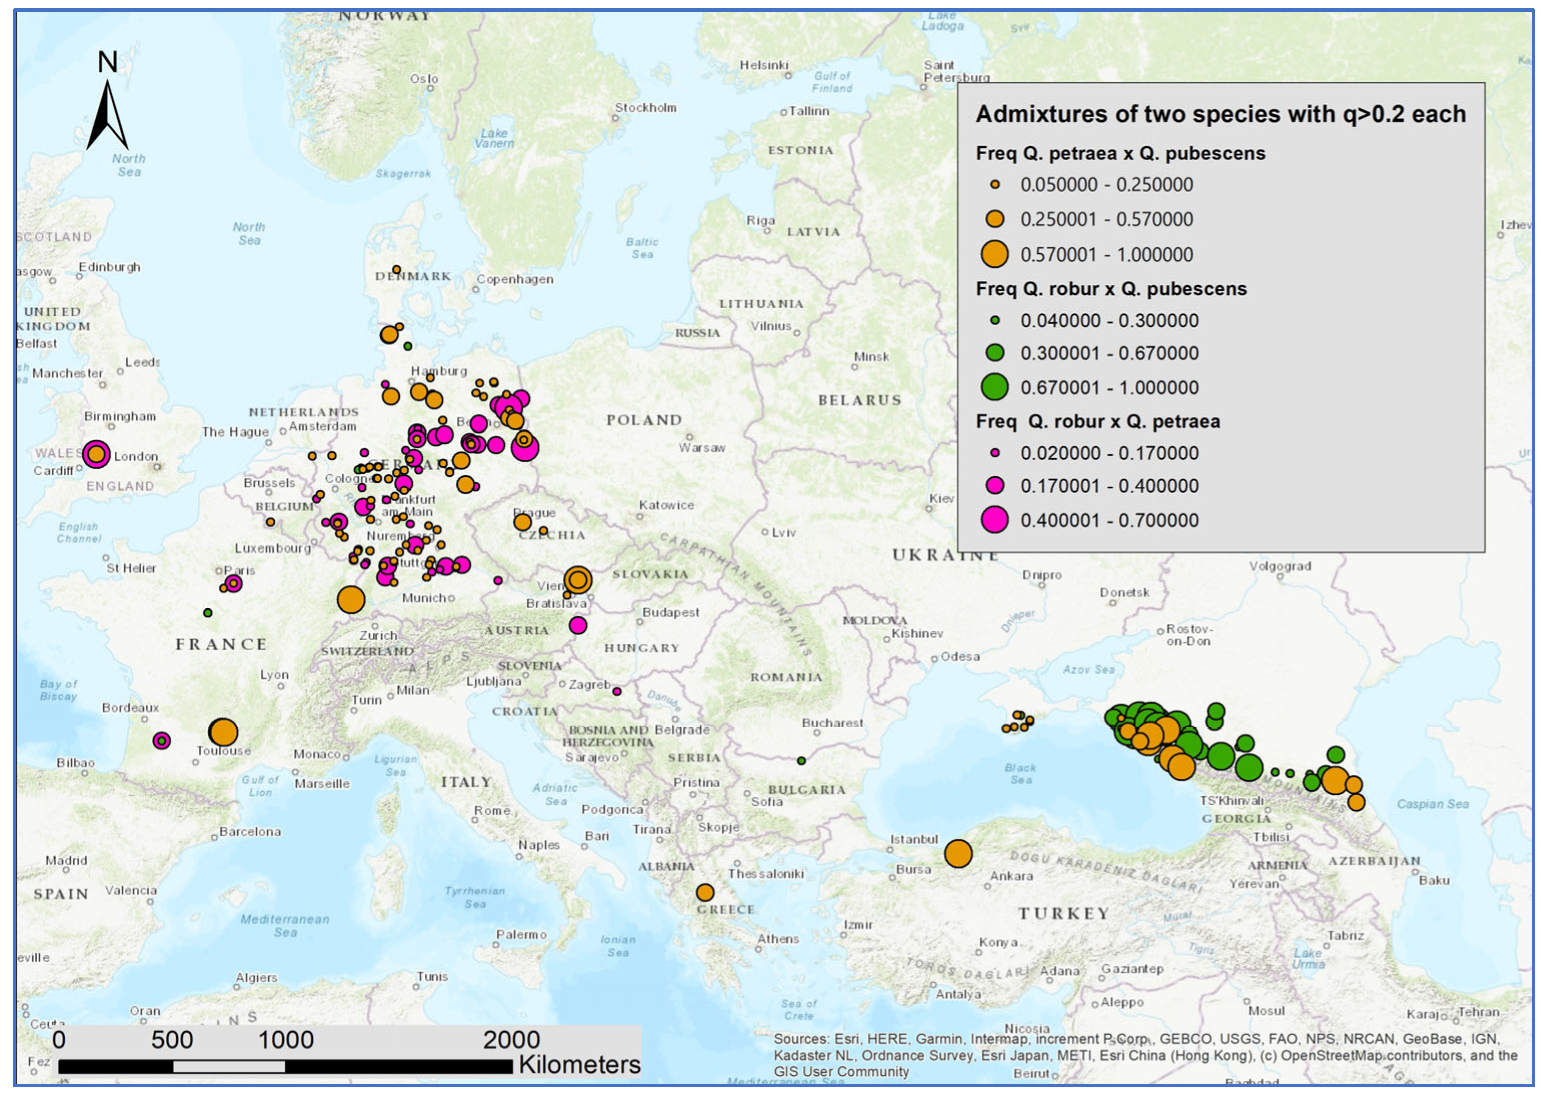
As an indicator of ongoing hybridization and/or stronger introgression, for the samples at each location, we computed the relative frequency of individuals with admixture proportions of q > 0.2 for two oak species (Figure 4). The Caucasus region has both several locations with intermediate individuals of Q. robur and Q. pubescens (green) and several locations with higher proportions of intermediate individuals of Q. petraea and Q. pubescens (brown). Intermediate individuals of Q. robur and Q. petraea (pink) occurred in Western and Central Europe. In all areas, intermediate individuals of the gene pools of Q. petraea and Q. pubescens could be found. This was also the case in regions where the Q. pubescens is either not present or extremely rare, at least nowadays (e.g., North and East Germany and Denmark).

3.2. Genetic Structure within Species

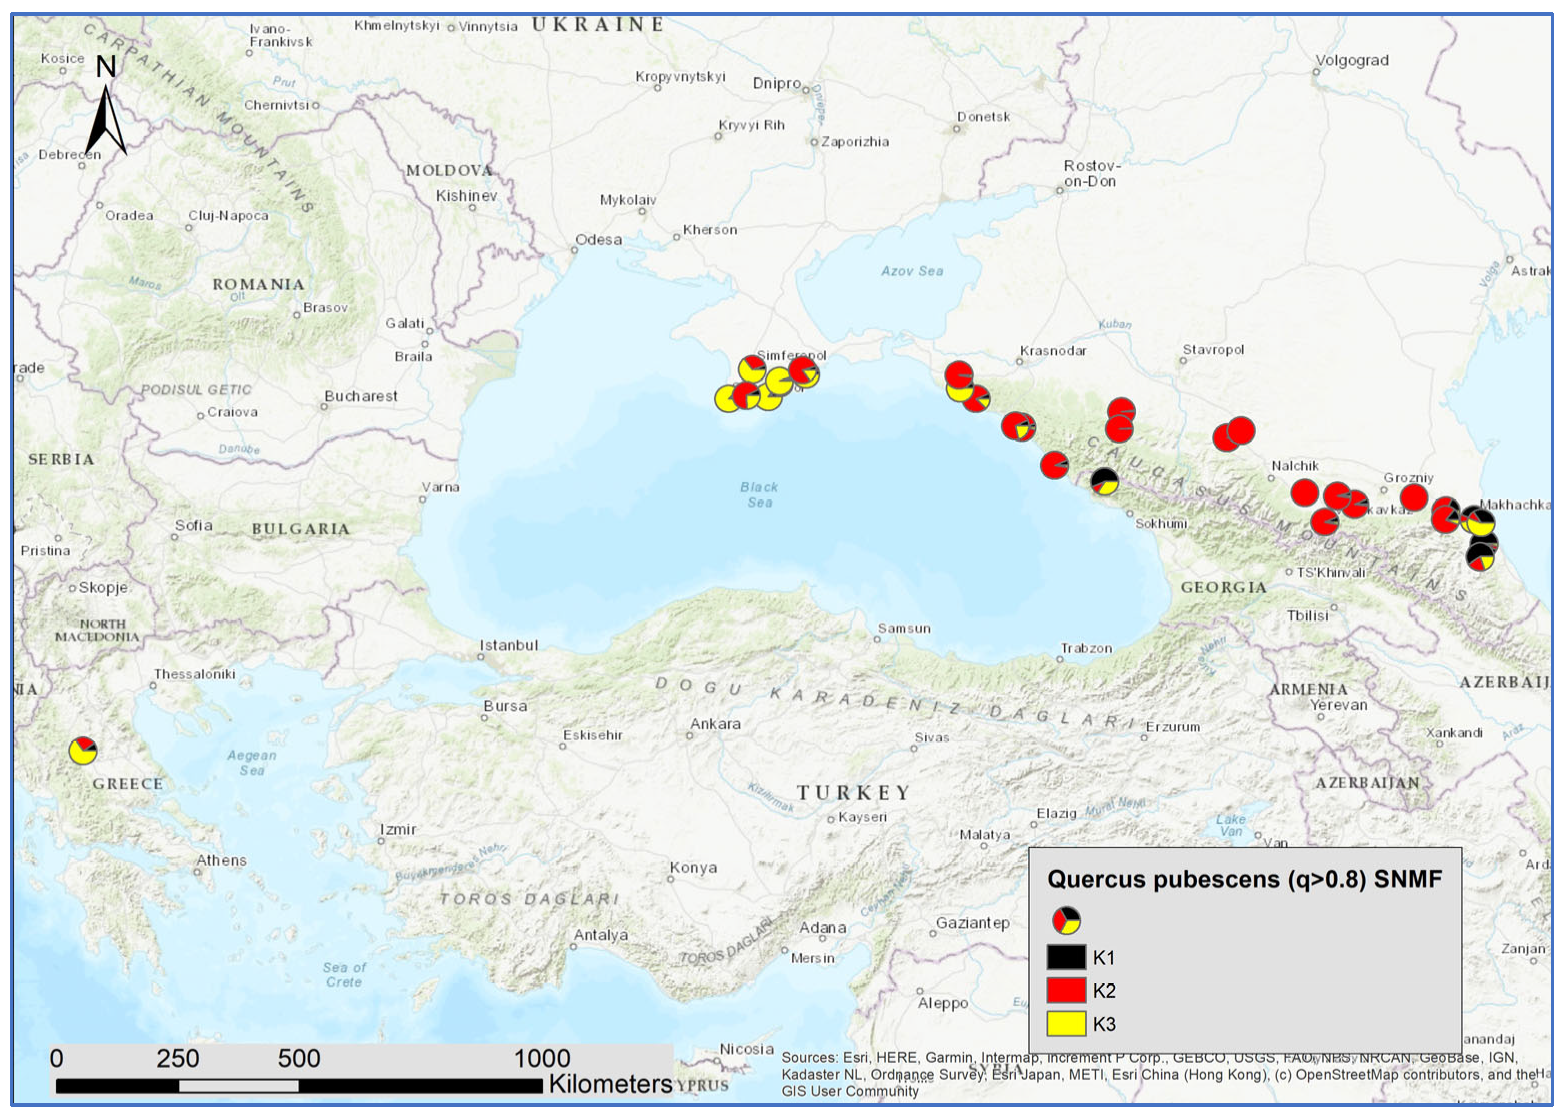
Next, we used all individuals with an admixture coefficient q > 0.8 for the three species clusters as entities for a within-species analysis of the genetic structures, applying the sNMF algorithm. By doing so, 3287 individuals were assigned to Q. robur, 1525 to Q. petraea, and 298 to Q. pubescens. For Q. robur, K = 2; for Q. petraea, K = 1, and for Q. pubescens, K = 3 were identified as the optimal numbers of genetic clusters with the minimized cross-entropy (Supplementary Figures S2–S4). In contrast to Q. petraea, there was a clear geographic pattern for the distribution of the admixture coefficient for the Q. robur and Q. pubescens clusters (Figure 5 and Figure 6).
For Q. robur and Q. pubescens, significant correlations between the within-species genetic clusters and the species clusters were observed (Table 2). This indicates the different levels of introgression. The cluster K1 of Q. robur was strongly correlated with the species cluster of Q. petraea. K1 is dominant in Western and Central Europe and occurred in the Caucasus (Figure 5). K2 of Q. robur was more frequent in Eastern Europe and the Caucasus. This cluster was correlated with the species cluster of Q. pubescens.
For Q. pubescens, there was a strong correlation of K3 with Q. petraea. K3 was more frequent in Crimea and the western and eastern part of the Caucasus and Greece (Figure 5). Furthermore, K1 was positively correlated with the species cluster of Q. petraea. This cluster was more present in the central and eastern parts of the Caucasus.

3.3. Distribution of Haplotypes

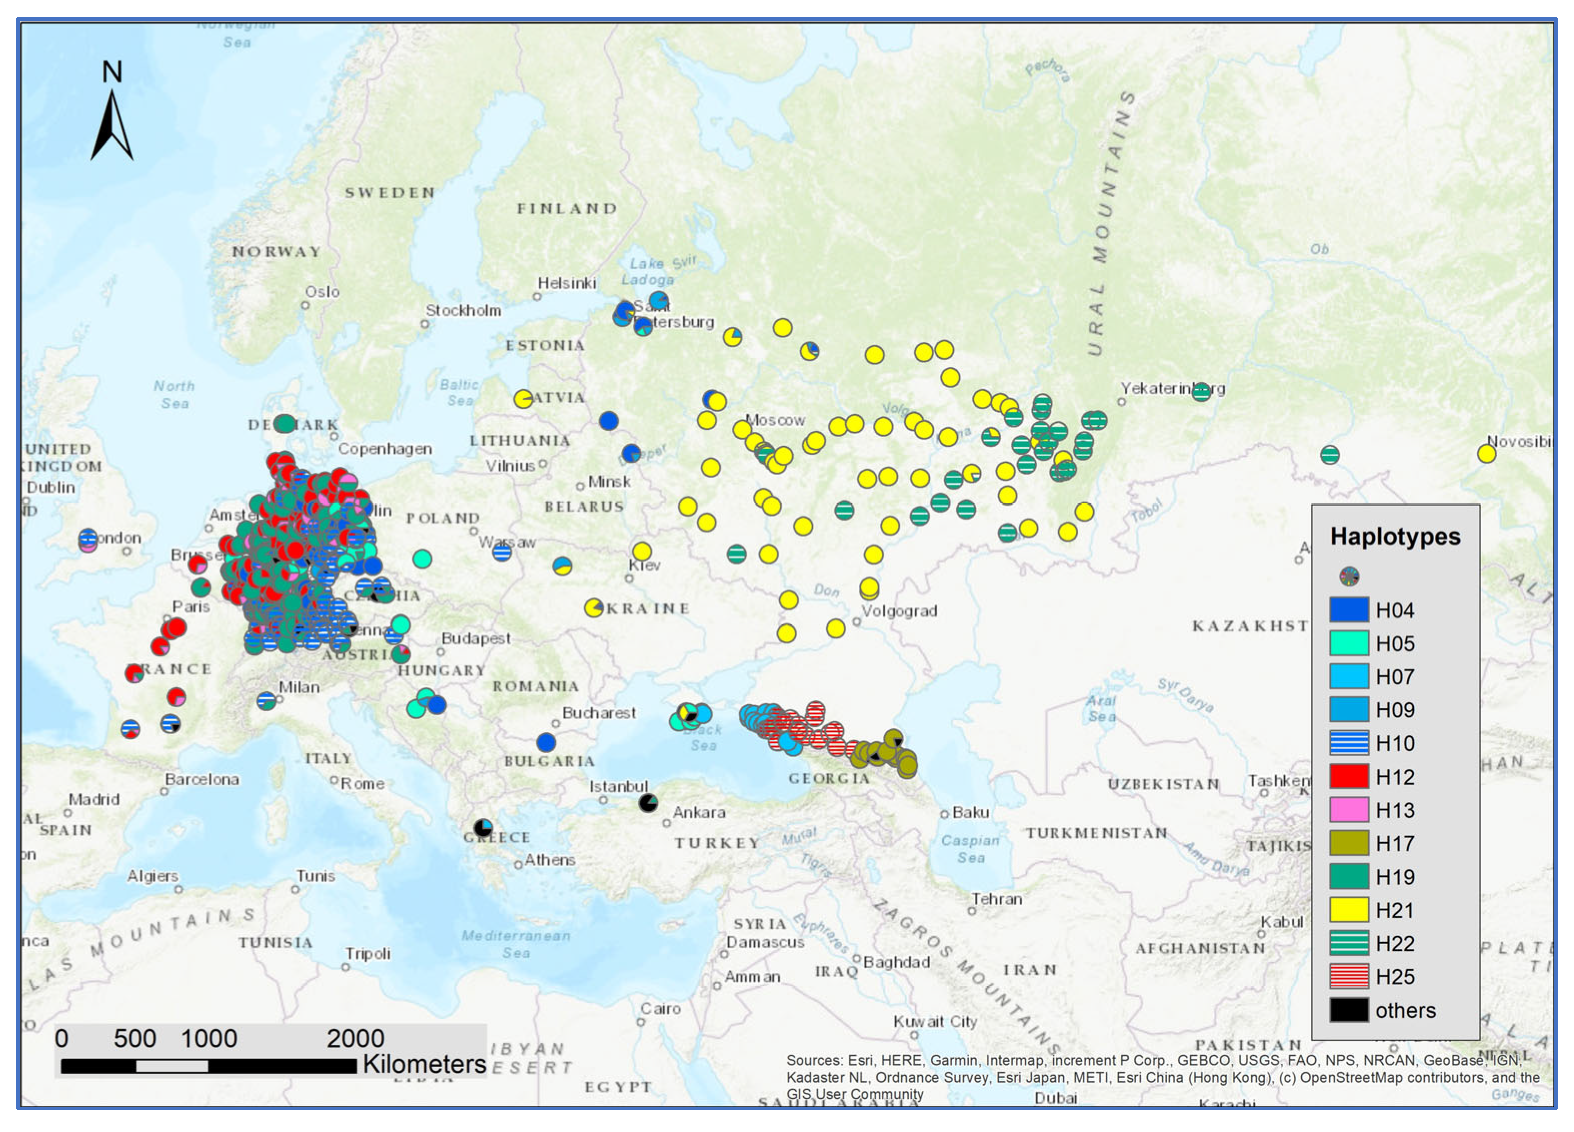
The genetic composition at the SNPs of chloroplast and mitochondria revealed 12 relatively frequent haplotypes (Supplementary Figure S5). The distribution of haplotypes showed a regional pattern independent of the composition of white oak species (Figure 7). Interestingly, haplotypes H25, H17, H07 were newly identified. These haplotypes are different from the other haplotypes in the eastern range of the white oak distribution in Europe. A distinct structure of haplotype distribution was observed for the Caucasus and Crimea: H5 was dominant in Crimea, H07 occurred in part of Crimea and was dominant in the western part of the Caucasus, H25 dominated the middle part of the Caucasus and H17 the eastern area (Supplementary Figure S6).

4. Discussion

4.1. Species Integrity and Introgression

The PCA indicated the presence of three main groups, and the assignment of the individuals to one of three genetic groups in the sNMF run K = 3 agreed with the pre-classification for Q. robur, Q. petraea, and Q. pubescens in the majority of cases. A total of 88% of all individuals had an admixture coefficient q > 0.8. Thus, there is a visible trace of hybridization or introgression, but the species integrity is still intact. How can we explain this? Hybridization and introgression among the three species have been reported in several publications. Our observation of species integrity is supported by an intense study with controlled crosses among Q. robur and Q. petraea [19], observing strong intrinsic post-mating prezygotic barriers and a weaker barrier on early hybrid fitness. However, this study also found high differences for these barriers among genotypes, still allowing for a certain level of hybridization. With controlled back-crosses, Olrik and Kjaer [43] successfully generated offspring for a 56-year-old hybrid among Q. petraea and Q. robur with pollen from both species. Paternity analysis in mixed oak stands also revealed the occurrence of hybrids [17,44]. Thus, natural hybrids, as the necessary first step of our observed introgression, occur in relevant frequencies. The proportion of hybrids and the direction of introgression depends very much on the abundance of the white oak species. The rare species serve as seed trees, receiving proportionally more pollen from the dominant species [45]. In hotspots of white oak diversity, such as the southwest of France [22], parts of Switzerland [46], Italy [12], and Romania [24], the hybridization occurred in different combinations of the three species (Q. robur, Q. petraea, and Q. pubescens). The question is, what happens to the hybrids? It is clear that there is an ecological specification of the three oak species in regard to their adaptation to drought and soil conditions [21]. Q. robur has been reported to be tolerant to wet soils, and Q. petraea and Q. pubescens have been reported to be more tolerant to dry soils, whereas Q. pubescens also grows well on limy soils [47]. This differentiated adaptation is thought to be one reason for the species integrity, causing selection against hybrids in favor of the pure species [48]. The observation of higher percentages of hybrids in younger stages compared to adult trees fits this hypothesis [44]. In agreement with our new genetic data, there seems to be a balance between processes that would lead to a loss of species integrity (ongoing hybridization over several generations) and the stabilizing process of species-specific genetic adaptation to certain environments. Hybrids might have a higher viability at intermediate environments [49].

4.2. Introgression as a Source of Within-Species Geographic Genetic Differentiation

The level of admixture between the oak species varied in the different regions. None of the putative Q. pubescens trees in Western and Southern Europe had an admixture of Q. pubescens > 0.8, and none of the sampled putative Q. petraea trees in Crimea and the Caucasus had an Q. petraea admixture > 0.8. On the other hand, the Caucasus region had many individuals with higher levels of two species admixtures for the combinations Q. robur × Q. pubescens and Q. petraea × Q. pubescens. This fits well with former studies on the complex taxonomical composition of the oaks in this region [28]. Regionally different levels of hybridization have also been found for Q. pubescens in Croatia [50]. Surprisingly, oaks at several locations in Germany, Denmark, and Czechia have been found to have Q. pubescens ancestry > 0.2, despite the fact that Q. pubescens is very rare in that region. Furthermore, the large-scale genetic structures for individuals with q > 0.8 were statistically correlated with variable levels of introgression between the species. The gene pool of Q. robur showed introgression from Q. petraea in Western and Central Europe and from Q. pubescens in the Caucasus region. The genetic substructures of Q. pubescens were influenced by Q. petraea in the Caucasus. In Crimea and the middle part of the Caucasus, there was evidence for the introgression of Q. robur into Q. pubescens.
It should be noted that the sample sizes for the three species were very uneven. With only 170 putative Q. pubescens trees among 5797 sampled individuals, this species was strongly underrepresented in our study, and most of these Q. pubescens individuals came from the Black Sea region, whereas Southern and Western Europe was only weakly covered. Although the sNMF method, used in this study to search for genetic groups, is known to be less sensitive to different sample sizes compared to the STRUCTURE program [38,39,51], there might be still an impact. This might explain, to some extent, why sampled putative Q. pubescens trees in France and Southern Germany were not identified as individuals with q > 0.8. On the other hand, the Q. pubescens gene pool also appeared in individuals outside the natural species range (e.g., North Germany). This cannot easily be explained with uneven sampling. We assume this is a sign of an old introgression that happened in the western glacial refugial areas or during the re-migration path to the present area after the glacial periods. For an isolated Q. pubescens population in Poland, no signs of recent introgression from Q. robur or Q. petraea could be found by the authors of [52]. On the other hand, in a study on 24 smaller Q. pubescens stands in Germany, Kätzel et al. [53] found clear genetic evidence for hybridization mostly with from Q. petraea.
An interesting question is why did we not observe a genetic substructure for Q. petraea? One explanation could be that Q. petraea had stronger introgression and that our arbitrary threshold of q > 0.8 for trees to be assigned to a particular species was too high for many individuals pre-classified as sessile oak. This is particularly the case for the regions of the Black Sea and the Caucasus. Thus, these trees could not contribute to a genetic within-species substructure of Q. petraea. Furthermore, Q. petraea received introgression from Q. robur in many locations in Central and Western Europe and in many regions from Q. pubescens. An indication for strong hybridization among Q. petraea and Q. pubescens was also observed based on morphological and genetic data in Italy [54]. This broad inter-species gene flow could have reduced the genetic differentiation and thus the large-scale spatial genetic structure.
The impact of introgression on large-scale genetic structures has been observed for other tree species as well. Smid et al. [55] found a geographically defined hybrid zone between two Alnus species in Serbia, and for an endangered Quercus species in China, An et al. [56] found geographic differences in the level of introgression.

4.3. White Oak Species Hotspots in Crimea and the Northern Caucasus

We studied individuals pre-classified as Q. robur, Q. petraea, and Q. pubescens in Crimea and the Caucasus. With a threshold of 0.8 for the species assignment, we assigned individuals to Q. robur and Q. pubescens but did not identify a single Q. petraea tree. All the putative Q. petraea individuals had admixtures of Q. robur or Q. petraea higher than 0.2. This aptly illustrates the general higher admixtures in the region. The haplotype distribution in this region also differed from the rest of the distribution range. At the time of writing, only three studies that examine the gene pool of populations of oaks from the Black Sea and Caspian Sea basins using modern genetic markers are available. Earlier, the phylogeography of Q. petraea (subsp. iberica) and six related oak taxa was investigated in Georgia for sequences of two chloroplast intergenic spacers [28]. In another publication, two locations of Q. robur from the Krasnodar region of Russia (among 40 populations of pedunculate oak from the Russian Plain, Belarus, Poland, and Ukraine) were studied via sequencing three fragments of chloroplast DNA, as well as by analyzing the polymorphism of five chloroplast microsatellite loci [57]. Recently, Semerikova et al. [58] studied the chloroplast variability of the three oaks species in the Balkan and Crimea regions. Similar to our findings, they observed haplotypes unique for the region and found an overlapping of haplotypes from the Balkan region and the western part of Crimea and different haplotypes shared between the eastern part of Crimea and the western part of the Caucasus. Similar to many previous studies [20,58,59], we observed no clear differences in the haplotype frequencies among species in the same regions. This strongly underlines the presence of regular hybridization and introgression among the white oak species.

5. Conclusions

Our genetic data confirmed the subdivision in three biological species for the samples assigned in forest inventories as Q. robur, Q. petraea, and Q. pubescens. Individuals classified as Q. petraea and Q. pubescens in the framework of forest inventories were more erroneous than those assigned as Q. robur. We found genetic evidence for regionally different levels of introgression among the studied white oak species and that these regionally different levels of introgression contribute significantly to the within-species geographic genetic differentiation of Q. robur and Q. pubescens. The opposite effect of a reduced within-species geographic genetic differentiation was observed for Q. petraea due to widespread introgression from Q. robur and Q. pubescens.

Supplementary Materials

The following supporting information can be downloaded at: https://www.mdpi.com/article/10.3390/f14122279/s1. Table S1: Information for each sample on geographic origin and species pre-classification. Figure S1: Optimal number of genetic clusters for the minimized cross-entropy for the sNMF runs using all 5797 oak individuals. Figure S2: Optimal number of genetic clusters for the minimized cross-entropy for the sNMF runs with all Quercus robur individuals with q > 0.8. Figure S3: Optimal number of genetic clusters for the minimized cross-entropy for the sNMF runs with all Quercus petraea individuals with q > 0.8. Figure S4: Optimal number of genetic clusters for the minimized cross-entropy for the sNMF runs with all Quercus pubescens individuals with q > 0.8. Figure S5: Minimum spanning haplotype network generated with the software PopArt, version 1.7 for the 12 relatively frequent haplotypes. Figure S6: Spatial distribution of the haplotype frequencies at all oak samples in the Caucasus.

Author Contributions

B.D., C.B.-J. and Y.Y. developed the concept and methodology of the study. Sampling was carried out by Y.Y., V.Y. and C.B.-J. Lab work was supervised by C.B.-J. and M.M. was responsible for the bioinformatics. Data analysis and original draft preparation were carried out by B.D., C.B.-J., V.Y. and Y.Y. and M.M. contributed to draft improvements. All authors have read and agreed to the published version of the manuscript.

Funding

This work was supported via a grant from the Waldklimafonds WKF-22WC4111 01 (German Federal Ministry of Food and Agriculture & German Federal German Ministry for the Environment, Nature Conservation and Nuclear Safety), grant No 19-16-00084 from the Russian Science Foundation, and grant REC-RMG-2022 from the Ministry of Education and Science of the Republic of Bashkortostan in support of the contribution of Yulay Yanbaev.

Data Availability Statement

The genotype data, including geographic co-ordinates is available at DYRAD: http://doi:10.5061/dryad.dz08kps4d.

Acknowledgments

We are thankful to Alwin Janßen, Jörg Kleinschmit, Ralf Kätzel, Dagmar Schneck, Wilfried Steiner, Bernd Rose, and Hans-Peter Ehrhart for supporting the sampling and selection of oak stands in Germany, and we thank Antoine Kremer, Jaroslaw Burczyk, and Giovanni Giuseppe Vendramin for providing samples from France, Poland, and Italy collected in the framework of the EU FORGER project. We are also thankful to the former Evoltree members for providing us with additional oak material from France, Hungary, Switzerland, and Finland and to our colleague Muhidin Seho for providing material from Bulgaria, Bosnia and Herzegovina, and Croatia. We thank the three anonymous reviewers for their helpful comments on former versions of the manuscript. We are also grateful to Stefan Jencsik, Petra Hoffmann, and Susanne Hoppe for their technical assistance with laboratory work.

Conflicts of Interest

The authors declare no conflict of interest.

References

  1. Dyderski, M.K.; Paz, S.; Frelich, L.E.; Jagodzinski, A.M. How much does climate change threaten European forest tree species distributions? Glob. Chang. Biol. 2018, 24, 1150–1163. [Google Scholar] [CrossRef]
  2. Reutimann, O.; Dauphin, B.; Baltensweiler, A.; Gugerli, F.; Kremer, A.; Rellstab, C. Abiotic factors predict taxonomic composition and genetic admixture in populations of hybridizing white oak species (Quercus sect. Quercus) on regional scale. Tree Genet. Genomes 2023, 19, 22. [Google Scholar] [CrossRef]
  3. Diekmann, M. Ecological behaviour of deciduous hardwood trees in Boreo-nemoral Sweden in relation to light and soil conditions. For. Ecol. Manag. 1996, 86, 1–14. [Google Scholar] [CrossRef]
  4. Bertrand, R.; Perez, V.; Gégout, J.C. Disregarding the edaphic dimension in species distribution models leads to the omission of crucial spatial information under climate change: The case of Quercus pubescens in France. Glob. Chang. Biol. 2012, 18, 2648–2660. [Google Scholar] [CrossRef]
  5. Kremer, A.; Dupouey, J.L.; Deans, J.D.; Cottrell, J.; Csaikl, U.; Finkeldey, R.; Espinel, S.; Jensen, J.; Kleinschmit, J.; Van Dam, B.; et al. Leaf morphological differentiation between Quercus robur and Quercus petraea is stable across western European mixed oak stands. Ann. For. Sci. 2002, 59, 777–787. [Google Scholar] [CrossRef]
  6. Musarella, C.M.; Cano-Ortiz, A.; Fuentes, J.C.P.; Navas-Ureña, J.; Gomes, C.J.P.; Uinto-Canas, R.; Cano, E.; Spampinato, G. Similarity analysis between species of the genus Quercus L. (Fagaceae) in southern Italy based on the fractal dimension. PhytoKeys 2018, 113, 79–95. [Google Scholar] [CrossRef]
  7. Viscosi, V.; Fortini, P.; D’Imperio, M. A statistical approach to species identification on morphological traits of European white oaks: Evidence of morphological structure in Italian populations of Quercus pubescens sensu lato. Acta Bot. Gall. 2011, 158, 175–188. [Google Scholar] [CrossRef]
  8. Viscosi, V.; Lepais, O.; Gerber, S.; Fortini, P. Leaf morphological analyses in four European oak species (Quercus) and their hybrids: A comparison of traditional and geometric morphometric methods. Plant Biosyst. 2009, 143, 564–574. [Google Scholar] [CrossRef]
  9. Jensen, J.; Larsen, A.; Nielsen, L.R.; Cottrell, J. Hybridization between Quercus robur and Q. petraea in a mixed oak stand in Denmark. Ann. For. Sci. 2009, 66, 12. [Google Scholar] [CrossRef]
  10. Kleinschmit, J.R.G.; Bacilieri, R.; Kremer, A.; Roloff, A. Comparison of morphological and genetic traits of pedunculate oak (Q. robur L.) and sessile oak (Q. petraea (MATT) LIEBL). Silvae Genet. 1995, 44, 256–269. [Google Scholar]
  11. Marcysiak, K.; Lewandowska, A.; Mazur, M.; Meyza, K.; Gawlak, M.; Kaluski, T. Ambiguous leaf morphology of Central European white oaks and their hybrids in an atypical mixed stand. Plant Biosyst. 2022, 156, 635–648. [Google Scholar] [CrossRef]
  12. Fortini, P.; Di Marzio, P.; Di Pietro, R. Differentiation and hybridization of Quercus frainetto, Q. petraea, and Q. pubescens (Fagaceae): Insights from macro-morphological leaf traits and molecular data. Plant Syst. Evol. 2015, 301, 375–385. [Google Scholar] [CrossRef]
  13. Rellstab, C.; Bühler, A.; Graf, R.; Folly, C.; Gugerli, F. Using joint multivariate analyses of leaf morphology and molecular-genetic markers for taxon identification in three hybridizing European white oak species (Quercus spp.). Ann. For. Sci. 2016, 73, 669–679. [Google Scholar] [CrossRef]
  14. Bussotti, F.; Grossoni, P. European and Mediterranean oaks: Taxonomic problems. Ital. For. E Mont. 1997, 52, 240–260. [Google Scholar]
  15. Enescu, C.M.; Curtu, A.L.; Sofletea, N. Is Quercus virgiliana a distinct morphological and genetic entity among European white oaks? Turk. J. Agric. For. 2013, 37, 632–641. [Google Scholar] [CrossRef]
  16. Di Pietro, R.; Conte, A.L.; Di Marzio, P.; Gianguzzi, L.; Spampinato, G.; Caldarella, O.; Fortini, P. A multivariate morphometric analysis of diagnostic traits in southern Italy and Sicily pubescent oaks. Folia Geobot. 2020, 55, 163–183. [Google Scholar] [CrossRef]
  17. Gerber, S.; Chadoeuf, J.; Gugerli, F.; Lascoux, M.; Buiteveld, J.; Cottrell, J.; Dounavi, A.; Fineschi, S.; Forrest, L.L.; Fogelqvist, J.; et al. High rates of gene flow by pollen and seed in oak populations across Europe. PLoS ONE 2014, 9, e85130. [Google Scholar] [CrossRef]
  18. Truffaut, L.; Chancerel, E.; Ducousso, A.; Dupouey, J.L.; Badeau, V.; Ehrenmann, F.; Kremer, A. Fine-scale species distribution changes in a mixed oak stand over two successive generations. New Phytol. 2017, 215, 126–139. [Google Scholar] [CrossRef]
  19. Abadie, P.; Roussel, G.; Dencausse, B.; Bonnet, C.; Bertocchi, E.; Louvet, J.M.; Kremer, A.; Garnier-Gere, P. Strength, diversity and plasticity of postmating reproductive barriers between two hybridizing oak species (Quercus robur L. and Quercus petraea (Matt) Liebl.). J. Evol. Biol. 2012, 25, 157–173. [Google Scholar] [CrossRef]
  20. Petit, R.J.; Brewer, S.; Bordacs, S.; Burg, K.; Cheddadi, R.; Coart, E.; Cottrell, J.; Csaikl, U.M.; van Dam, B.; Deans, J.D.; et al. Identification of refugia and post-glacial colonisation routes of European white oaks based on chloroplast DNA and fossil pollen evidence. For. Ecol. Manag. 2002, 156, 49–74. [Google Scholar] [CrossRef]
  21. Leroy, T.; Louvet, J.M.; Lalanne, C.; Le Provost, G.; Labadie, K.; Aury, J.M.; Delzon, S.; Plomion, C.; Kremer, A. Adaptive introgression as a driver of local adaptation to climate in European white oaks. New Phytol. 2020, 226, 1171–1182. [Google Scholar] [CrossRef]
  22. Leroy, T.; Rougemont, Q.; Dupouey, J.L.; Bodenes, C.; Lalanne, C.; Belser, C.; Labadie, K.; Le Provost, G.; Aury, J.M.; Kremer, A.; et al. Massive postglacial gene flow between European white oaks uncovered genes underlying species barriers. New Phytol. 2020, 226, 1183–1197. [Google Scholar] [CrossRef]
  23. Degen, B.; Yanbaev, Y.; Mader, M.; Ianbaev, R.; Bakhtina, S.; Schroeder, H.; Blanc-Jolivet, C. Impact of gene flow and introgression on the range wide genetic structure of Quercus robur (L.) in Europe. Forests 2021, 12, 1425. [Google Scholar] [CrossRef]
  24. Curtu, A.L.; Gailing, O.; Finkeldey, R. Evidence for hybridization and introgression within a species-rich oak (Quercus spp.) community. BMC Evol. Biol. 2007, 7, 15. [Google Scholar] [CrossRef]
  25. Leroy, S.A.G.; Arpe, K. Glacial refugia for summer-green trees in Europe and south-west Asia as proposed by ECHAM3 time-slice atmospheric model simulations. J. Biogeogr. 2007, 34, 2115–2128. [Google Scholar] [CrossRef]
  26. Myers, N.; Mittermeier, R.A.; Mittermeier, C.G.; da Fonseca, G.A.B.; Kent, J. Biodiversity hotspots for conservation priorities. Nature 2000, 403, 853–858. [Google Scholar] [CrossRef]
  27. Tarkhnishvili, D. Historical Biogeography of the Caucasus; NOVA Science Publishers: Hauppauge, NY, USA, 2014. [Google Scholar]
  28. Ekhvaia, J.; Simeone, M.C.; Silakadze, N.; Abdaladze, O. Morphological diversity and phylogeography of the Georgian durmast oak (Q. petraea subsp. iberica) and related Caucasian oak species in Georgia (South Caucasus). Tree Genet. Genomes 2018, 14, 15. [Google Scholar] [CrossRef]
  29. Lepais, O.; Petit, R.J.; Guichoux, E.; Lavabre, J.E.; Alberto, F.; Kremer, A.; Gerber, S. Species relative abundance and direction of introgression in oaks. Mol. Ecol. 2009, 18, 2228–2242. [Google Scholar] [CrossRef]
  30. Rushton, B. Natural hybridization within the genus Quercus L. [introgression]. Ann. Sci. For. 1993, 50, 73–90. [Google Scholar] [CrossRef]
  31. Dumolin, S.; Demesure, B.; Petit, R.J. Inheritance of chloroplast and mitochondrial genomes in pedunculate oak investigated with an efficient PCR method. Theor. Appl. Genet. 1995, 91, 1253–1256. [Google Scholar] [CrossRef]
  32. Degen, B.; Blanc-Jolivet, C.; Bakhtina, S.; Ianbaev, R.; Yanbaev, Y.; Mader, M.; Nürnberg, S.; Schröder, H. Applying targeted genotyping by sequencing with a new set of nuclear and plastid SNP and indel loci for Quercus robur and Quercus petraea. Conserv. Genet. Resour. 2021, 13, 345–347. [Google Scholar] [CrossRef]
  33. Langmead, B.; Salzberg, S.L. Fast gapped-read alignment with Bowtie 2. Nat. Methods 2012, 9, 357–359. [Google Scholar] [CrossRef]
  34. Danecek, P.; Auton, A.; Abecasis, G.; Albers, C.A.; Banks, E.; DePristo, M.A.; Handsaker, R.E.; Lunter, G.; Marth, G.T.; Sherry, S.T.; et al. The variant call format and VCFtools. Bioinformatics 2011, 27, 2156–2158. [Google Scholar] [CrossRef]
  35. Degen, B. GDA-NT 2021-a computer program for population genetic data analysis and assignment. Conserv. Genet. Resour. 2022, 14, 347–350. [Google Scholar] [CrossRef]
  36. Frichot, E.; Francois, O. LEA: An R package for landscape and ecological association studies. Methods Ecol. Evol. 2015, 6, 925–929. [Google Scholar] [CrossRef]
  37. Pritchard, J.K.; Stephens, M.; Donnelly, P. Inference of population structure using multilocus genotype data. Genetics 2000, 155, 945–959. [Google Scholar]
  38. Puechmaille, S.J. The program structure does not reliably recover the correct population structure when sampling is uneven: Subsampling and new estimators alleviate the problem. Mol. Ecol. Resour. 2016, 16, 608–627. [Google Scholar] [CrossRef]
  39. Frichot, E.; Mathieu, F.; Trouillon, T.; Bouchard, G.; Francois, O. Fast and efficient estimation of individual ancestry coefficients. Genetics 2014, 196, 973–983. [Google Scholar] [CrossRef]
  40. Hammer, Ø.; Harper, D.A.; Ryan, P. Paleontological statistics software package for education and data analysis. Paleontol. Electron. 2001, 4, 1–9. [Google Scholar]
  41. Kruskal, J.B. On the shortest spanning subtree of a graph and the traveling salesman problem. Proc. Am. Math. Soc. 1956, 7, 48–50. [Google Scholar] [CrossRef]
  42. Leigh, J.W.; Bryant, D. POPART: Full-feature software for haplotype network construction. Methods Ecol. Evol. 2015, 6, 1110–1116. [Google Scholar] [CrossRef]
  43. Olrik, D.C.; Kjaer, E.D. The reproductive success of a Quercus petraea × Q. robur F1-hybrid in back-crossing situations. Ann. For. Sci. 2007, 64, 37–45. [Google Scholar] [CrossRef]
  44. Curtu, A.L.; Gailing, O.; Finkeldey, R. Patterns of contemporary hybridization inferred from paternity analysis in a four-oak-species forest. BMC Evol. Biol. 2009, 9, 9. [Google Scholar] [CrossRef]
  45. Salvini, D.; Bruschi, P.; Fineschi, S.; Grossoni, P.; Kjaer, E.D.; Vendramin, G.G. Natural hybridisation between Quercus petraea (Matt.) Liebl. and Quercus pubescens Willd. within an Italian stand as revealed by microsatellite fingerprinting. Plant Biol. 2009, 11, 758–765. [Google Scholar] [CrossRef]
  46. Reutimann, O.; Gugerli, F.; Rellstab, C. A species-discriminatory single-nucleotide polymorphism set reveals maintenance of species integrity in hybridizing European white oaks (Quercus spp.) despite high levels of admixture. Ann. Bot. 2020, 125, 663–676. [Google Scholar] [CrossRef]
  47. Timbal, J.; Aussenac, G. An overview of ecology and silviculture of indigenous oaks in France. Ann. Sci. For. 1996, 53, 649–661. [Google Scholar] [CrossRef]
  48. Lazic, D.; Hipp, A.L.; Carlson, J.E.; Gailing, O. Use of genomic resources to assess adaptive divergence and introgression in oaks. Forests 2021, 12, 690. [Google Scholar] [CrossRef]
  49. De Dios, R.S.; Benito-Garzón, M.; Sainz-Ollero, H. Hybrid zones between two european oaks: A plant community approach. Plant Ecol. 2006, 187, 109–125. [Google Scholar] [CrossRef]
  50. Franjic, J.; Liber, Z.; Skvorc, Z.; Idzojtic, M.; Sostaric, R.; Stancic, Z. Morphological and molecular differentiation of the Croatian populations of Quercus pubescens Willd. (Fagaceae). Acta Soc. Bot. Pol. 2006, 75, 123–130. [Google Scholar] [CrossRef]
  51. Kalinowski, S.T. The computer program STRUCTURE does not reliably identify the main genetic clusters within species: Simulations and implications for human population structure. Heredity 2011, 106, 625–632. [Google Scholar] [CrossRef]
  52. Chybicki, I.J.; Oleksa, A.; Kowalkowska, K.; Burczyk, J. Genetic evidence of reproductive isolation in a remote enclave of Quercus pubescens in the presence of cross-fertile species. Plant Syst. Evol. 2012, 298, 1045–1056. [Google Scholar] [CrossRef]
  53. Kätzel, R.; Kamp, T.; Höltken, A.M.; Becker, F.; Riederer, H.J.; Schröder, J. Populations of Pubescent Oak (Quercus pubescens Willd.) and its hybrids north of the Alps. Landbauforschung 2014, 64, 73–84. [Google Scholar] [CrossRef]
  54. Bruschi, P.; Vendramin, G.G.; Bussotti, F.; Grossoni, P. Morphological and molecular differentiation between Quercus petraea (Matt.) Liebl. and Quercus pubescens Willd. (Fagaceae) in Northern and Central Italy. Ann. Bot. 2000, 85, 325–333. [Google Scholar] [CrossRef]
  55. Smid, J.; Douda, J.; Krak, K.; Mandak, B. Analyses of hybrid viability across a hybrid zone between two Alnus species using microsatellites and cpDNA-Markers. Genes 2020, 11, 770. [Google Scholar] [CrossRef]
  56. An, M.; Deng, M.; Zheng, S.S.; Jiang, X.L.; Song, Y.G. Introgression threatens the genetic diversity of Quercus austrocochinchinensis (Fagaceae), an endangered Oak: A case inferred by molecular markers. Front. Plant Sci. 2017, 8, 15. [Google Scholar] [CrossRef]
  57. Semerikova, S.A.; Isakov, I.Y.; Semerikov, V.L. Chloroplast DNA variation and phylogeography of Pedunculate Oak (Quercus robur L.) in the eastern part of the range. Russ. J. Genet. 2021, 57, 47–60. [Google Scholar] [CrossRef]
  58. Semerikova, S.; Podergina, S.; Tashev, A.; Semerikov, V. Phylogeography of oaks in the Crimea reveals Pleistocene refugia and migration routes. Russ. J. Ecol. 2023, 54, 197–212. [Google Scholar] [CrossRef]
  59. Konig, A.O.; Ziegenhagen, B.; van Dam, B.C.; Csaikl, U.M.; Coart, E.; Degen, B.; Burg, K.; de Vries, S.M.G.; Petit, R.J. Chloroplast DNA variation of oaks in western Central Europe and genetic consequences of human influences. For. Ecol. Manag. 2002, 156, 147–166. [Google Scholar] [CrossRef]
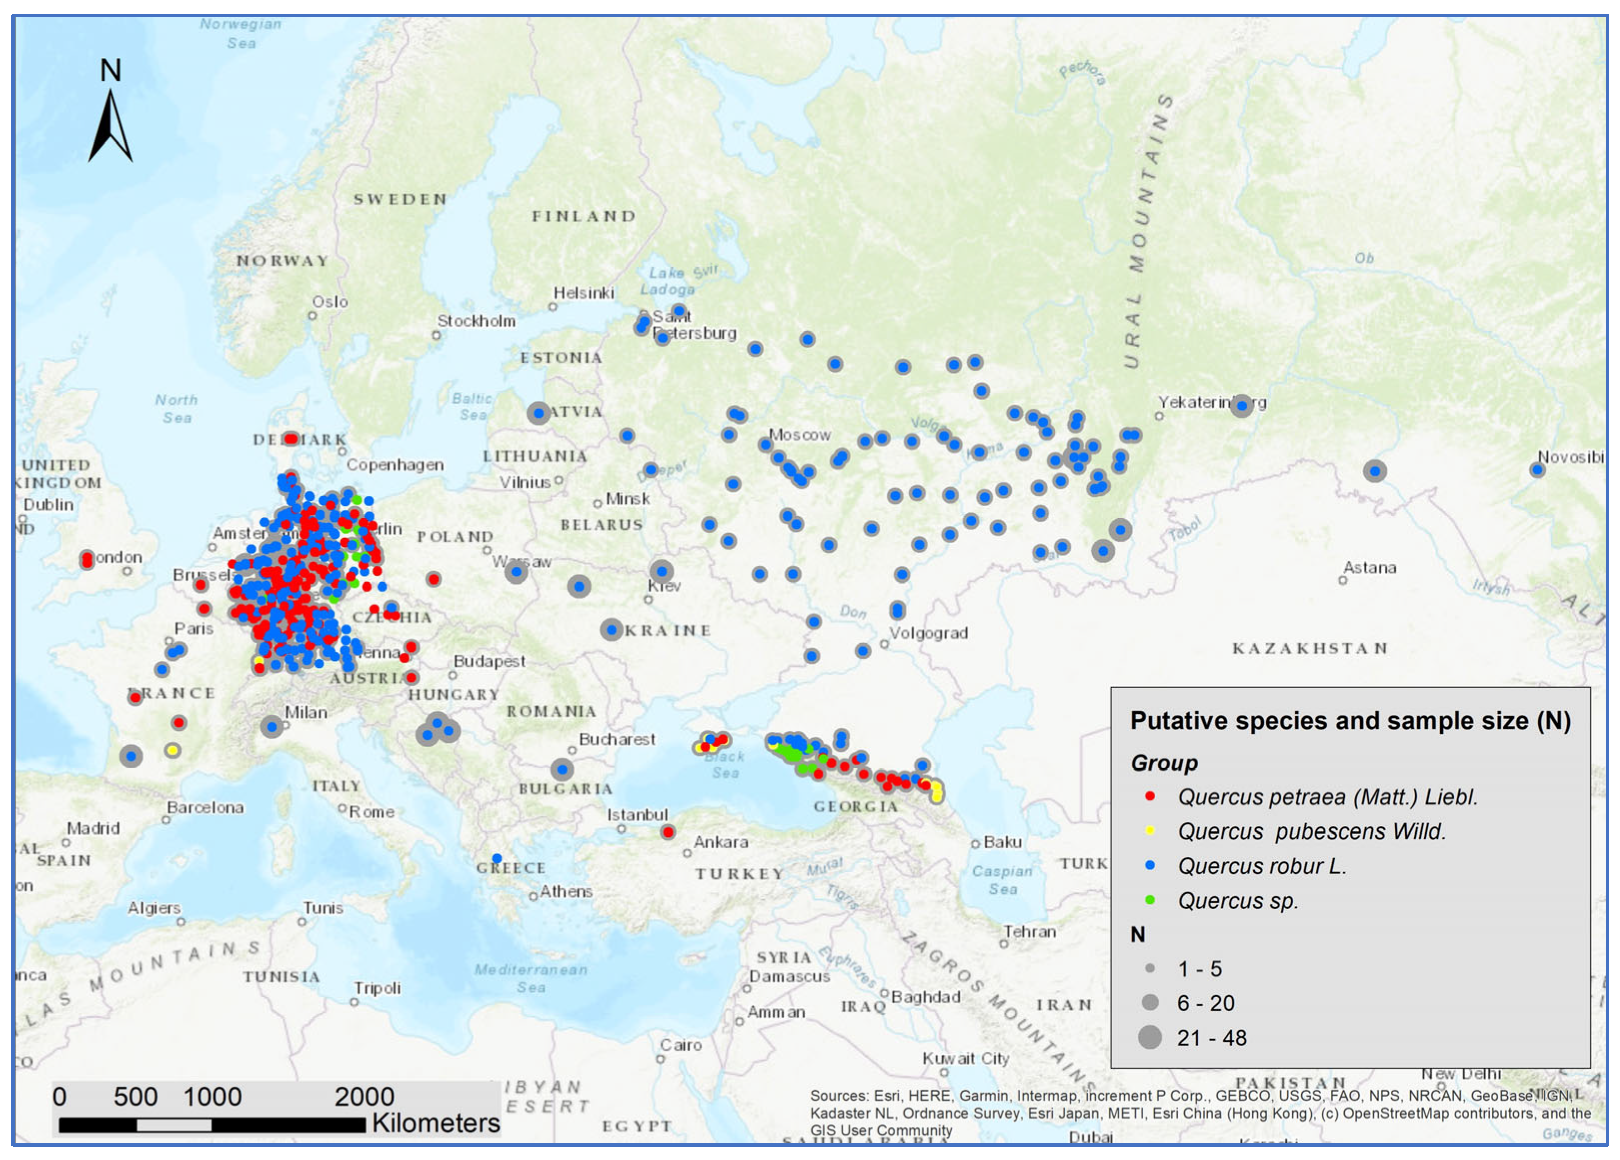
Figure 1. Location of the 5797 collected white oaks and the putative species assignment.
Forests 14 02279 g001
Figure 2. Bar plots for the admixture coefficients of all 5797 oaks for K = 2, K = 3, and K = 4 of the sNMF runs with the lowest cross-entropy; individuals were grouped according to the pre-classification of the species. The colors represent the different gene pools.
Forests 14 02279 g002
Figure 3. Results of a PCA using the 355 nSNPs of all 5797 white oaks. The colors of the points have been selected according to the admixture coefficients of the sNMF run with K = 3.
Forests 14 02279 g003
Figure 4. Map with the spatial distribution of locations with higher proportions of admixtures.
Forests 14 02279 g004
Figure 5. Spatial distribution of admixture coefficient (determined by applying the sNMF-algorithm for K = 2 of individuals assigned as Q. robur L.) (q > 0.8).
Forests 14 02279 g005
Figure 6. Spatial distribution of admixture coefficient (determined by applying the sNMF-algorithm for K = 3 of individuals assigned as Quercus pubescens Willd.).
Forests 14 02279 g006
Figure 7. Spatial distribution of the haplotype frequencies at all 636 sampled locations.
Forests 14 02279 g007
Table 1. Percentages of individuals with ancestor proportions q > 0.8 in the groups of pre-defined species and the unspecified group “Q. sp.”.
Pre-ClassificationNQ. robur
K2 > 0.8 (%)
Q. petraea
K1 > 0.8 (%)
Q. pubescens K3 > 0.8 (%)Admixtures
>0.2 (%)
Q. robur334291306
Q. petraea20901167616
Q. pubescens170006931
Q. sp.19519121752
Table 2. Spearman’s rank correlation coefficients between within-species genetic clusters and species genetic clusters. ns p > 0.05, *** p < 0.001.
Within-Species
Structure
KQ. petraea (K1)Q. robur (K3)Q. pubescens (K2)
Q. robur
(N = 3287)
1+0.381 ***−0.162 ***−0.098 ***
2−0.381 ***+0.162 ***+0.098 ***
Q. petraea (N = 1525)1−0.013 ns+0.023 ns−0.001 ns
2+0.013 ns−0.023 ns+0.001 ns
Q. pubescens (N = 298)1+0.229 ***+0.232 ***−0.262 ***
2−0.641 ***−0.114 ns+0.501 ***
3+0.523 ***−0.052 ns−0.350 ***
Disclaimer/Publisher’s Note: The statements, opinions and data contained in all publications are solely those of the individual author(s) and contributor(s) and not of MDPI and/or the editor(s). MDPI and/or the editor(s) disclaim responsibility for any injury to people or property resulting from any ideas, methods, instructions or products referred to in the content.