
Remote Sensing Indicators of Spongy Moth (Lymantria dispar L.) Damage to Birch Stands in Western Siberia
 , and
, and 
Abstract
:1. Introduction
- -
- What factors contribute to varying levels of insect attacks in nearby plantations?
- -
- How do the phases of leaf defoliation and refoliation relate to one another?
- -
- Does the condition of trees in sample plots with different levels of insect damage to their leaf apparatus correlate with the level of damage caused by phyllophagous insects?
2. Materials and Methods
2.1. Satellite Data Acquisition and Processing
- -
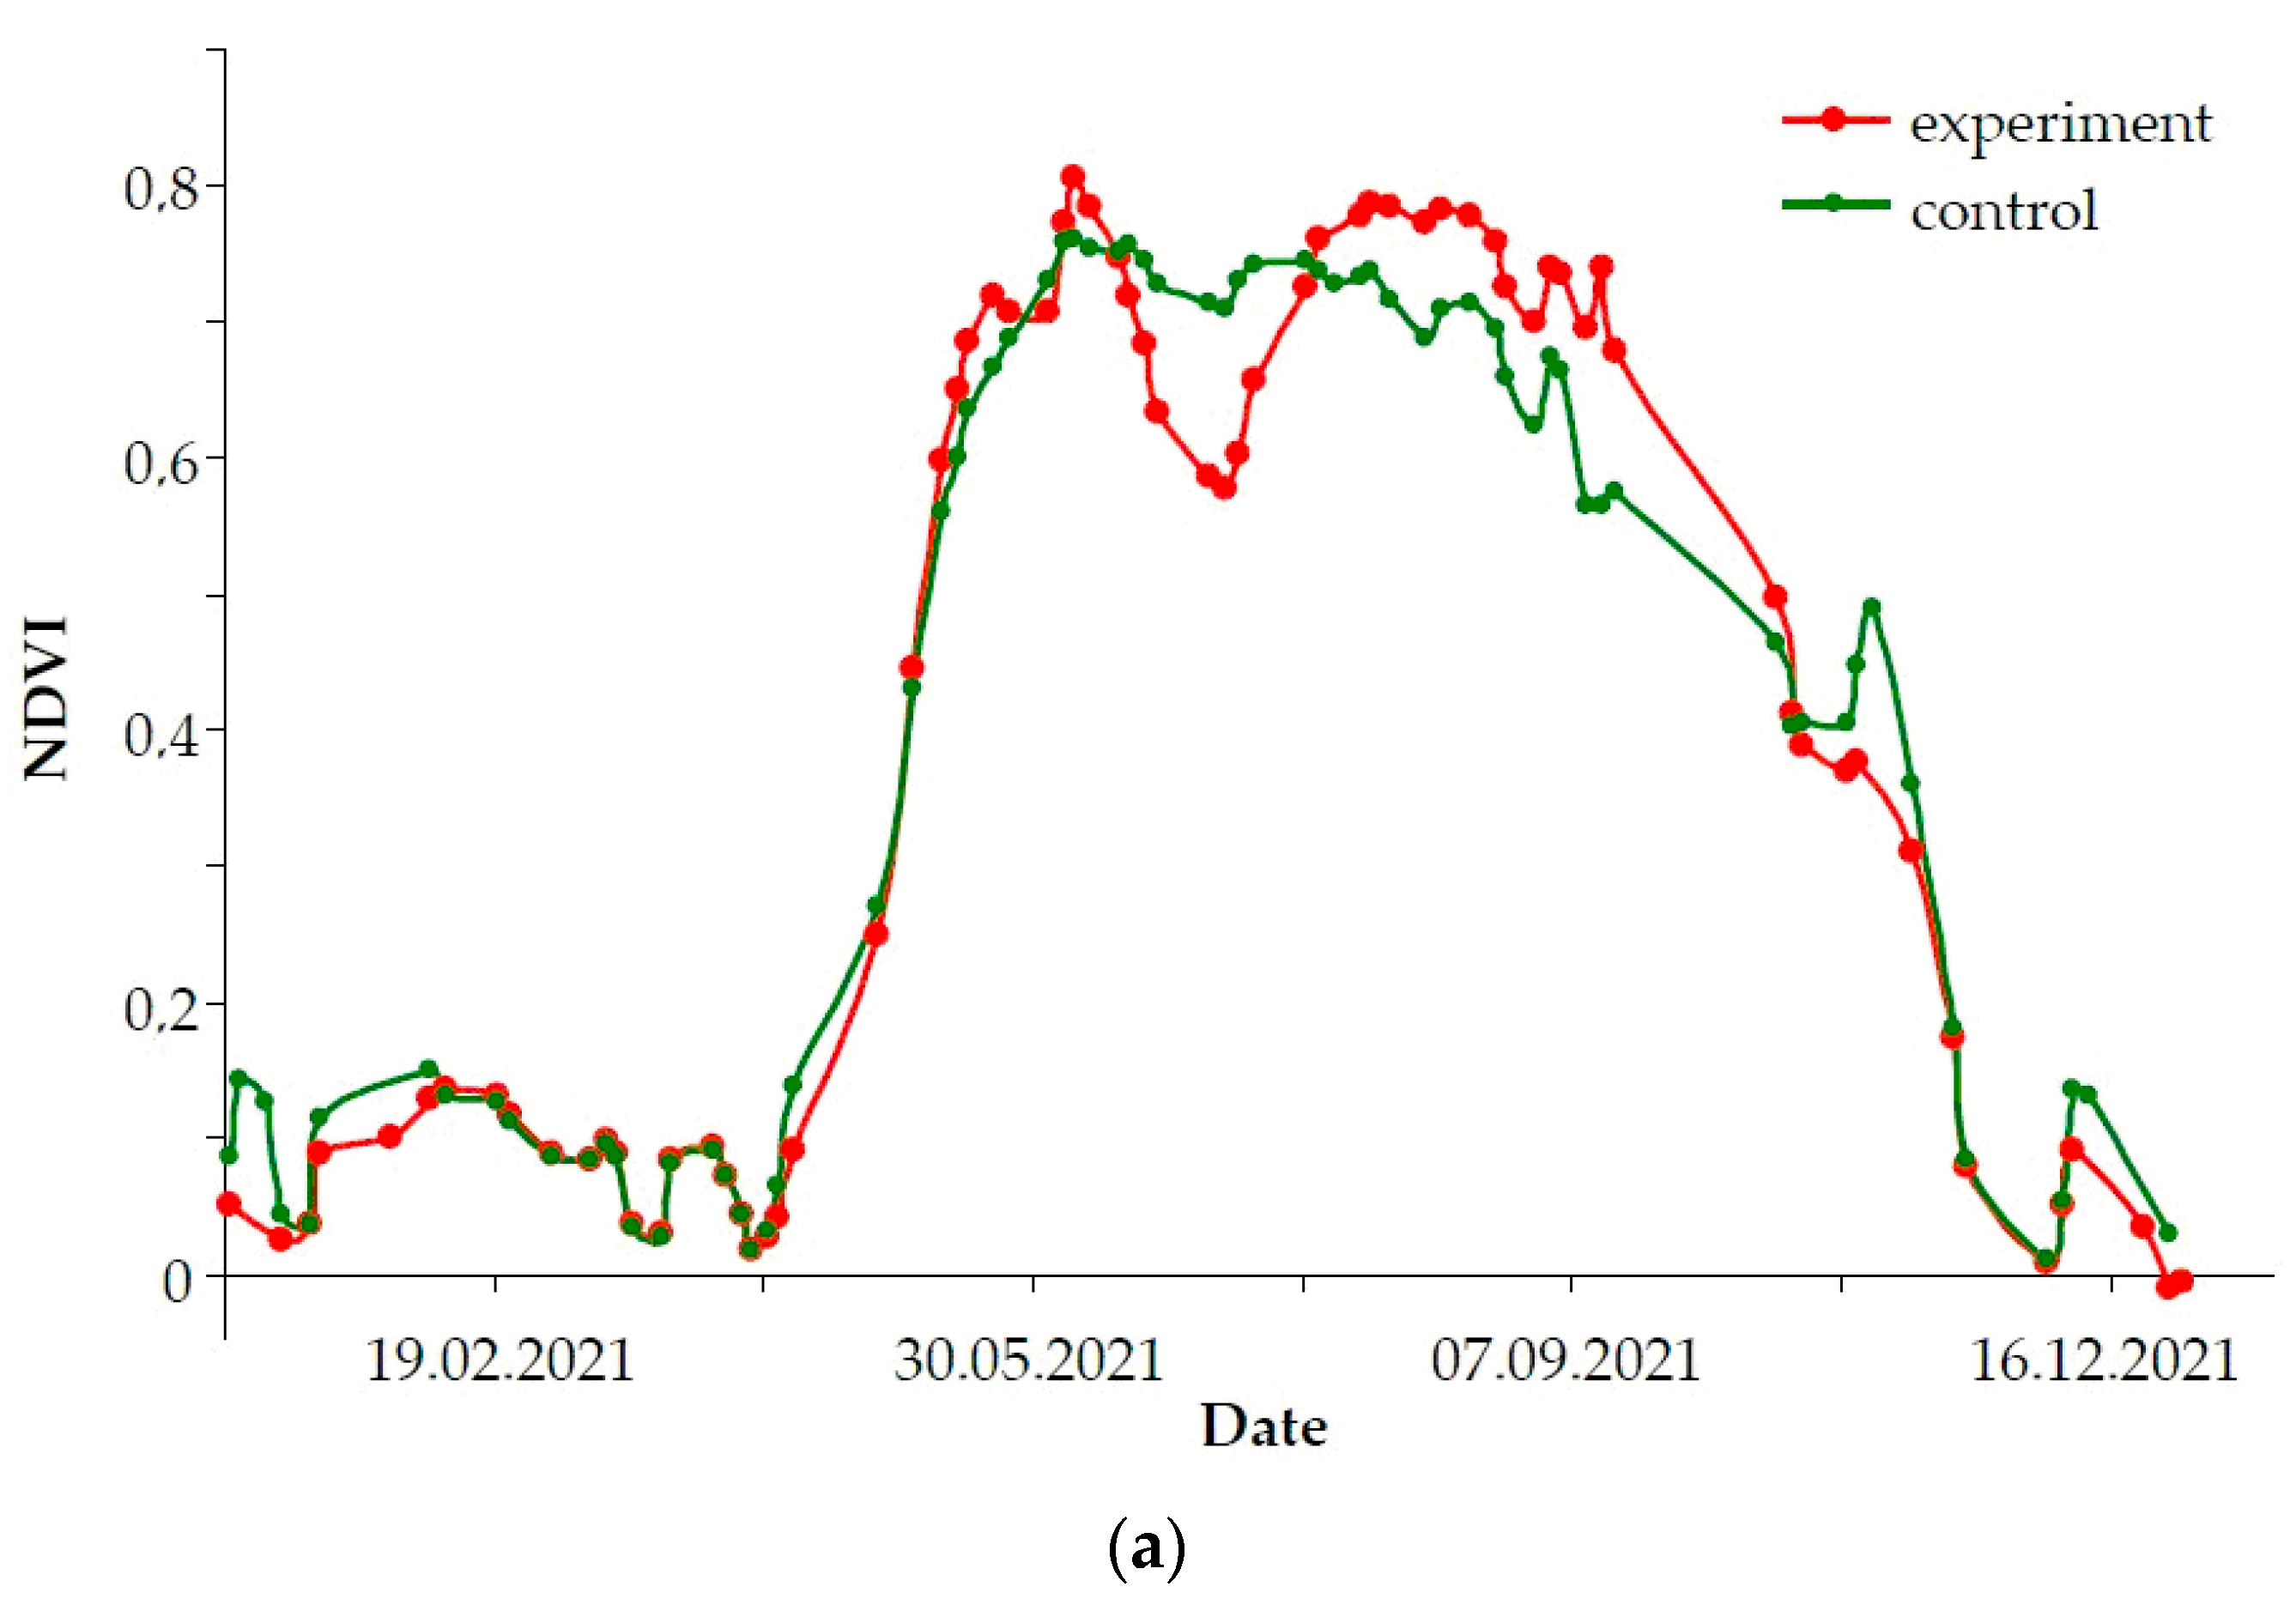
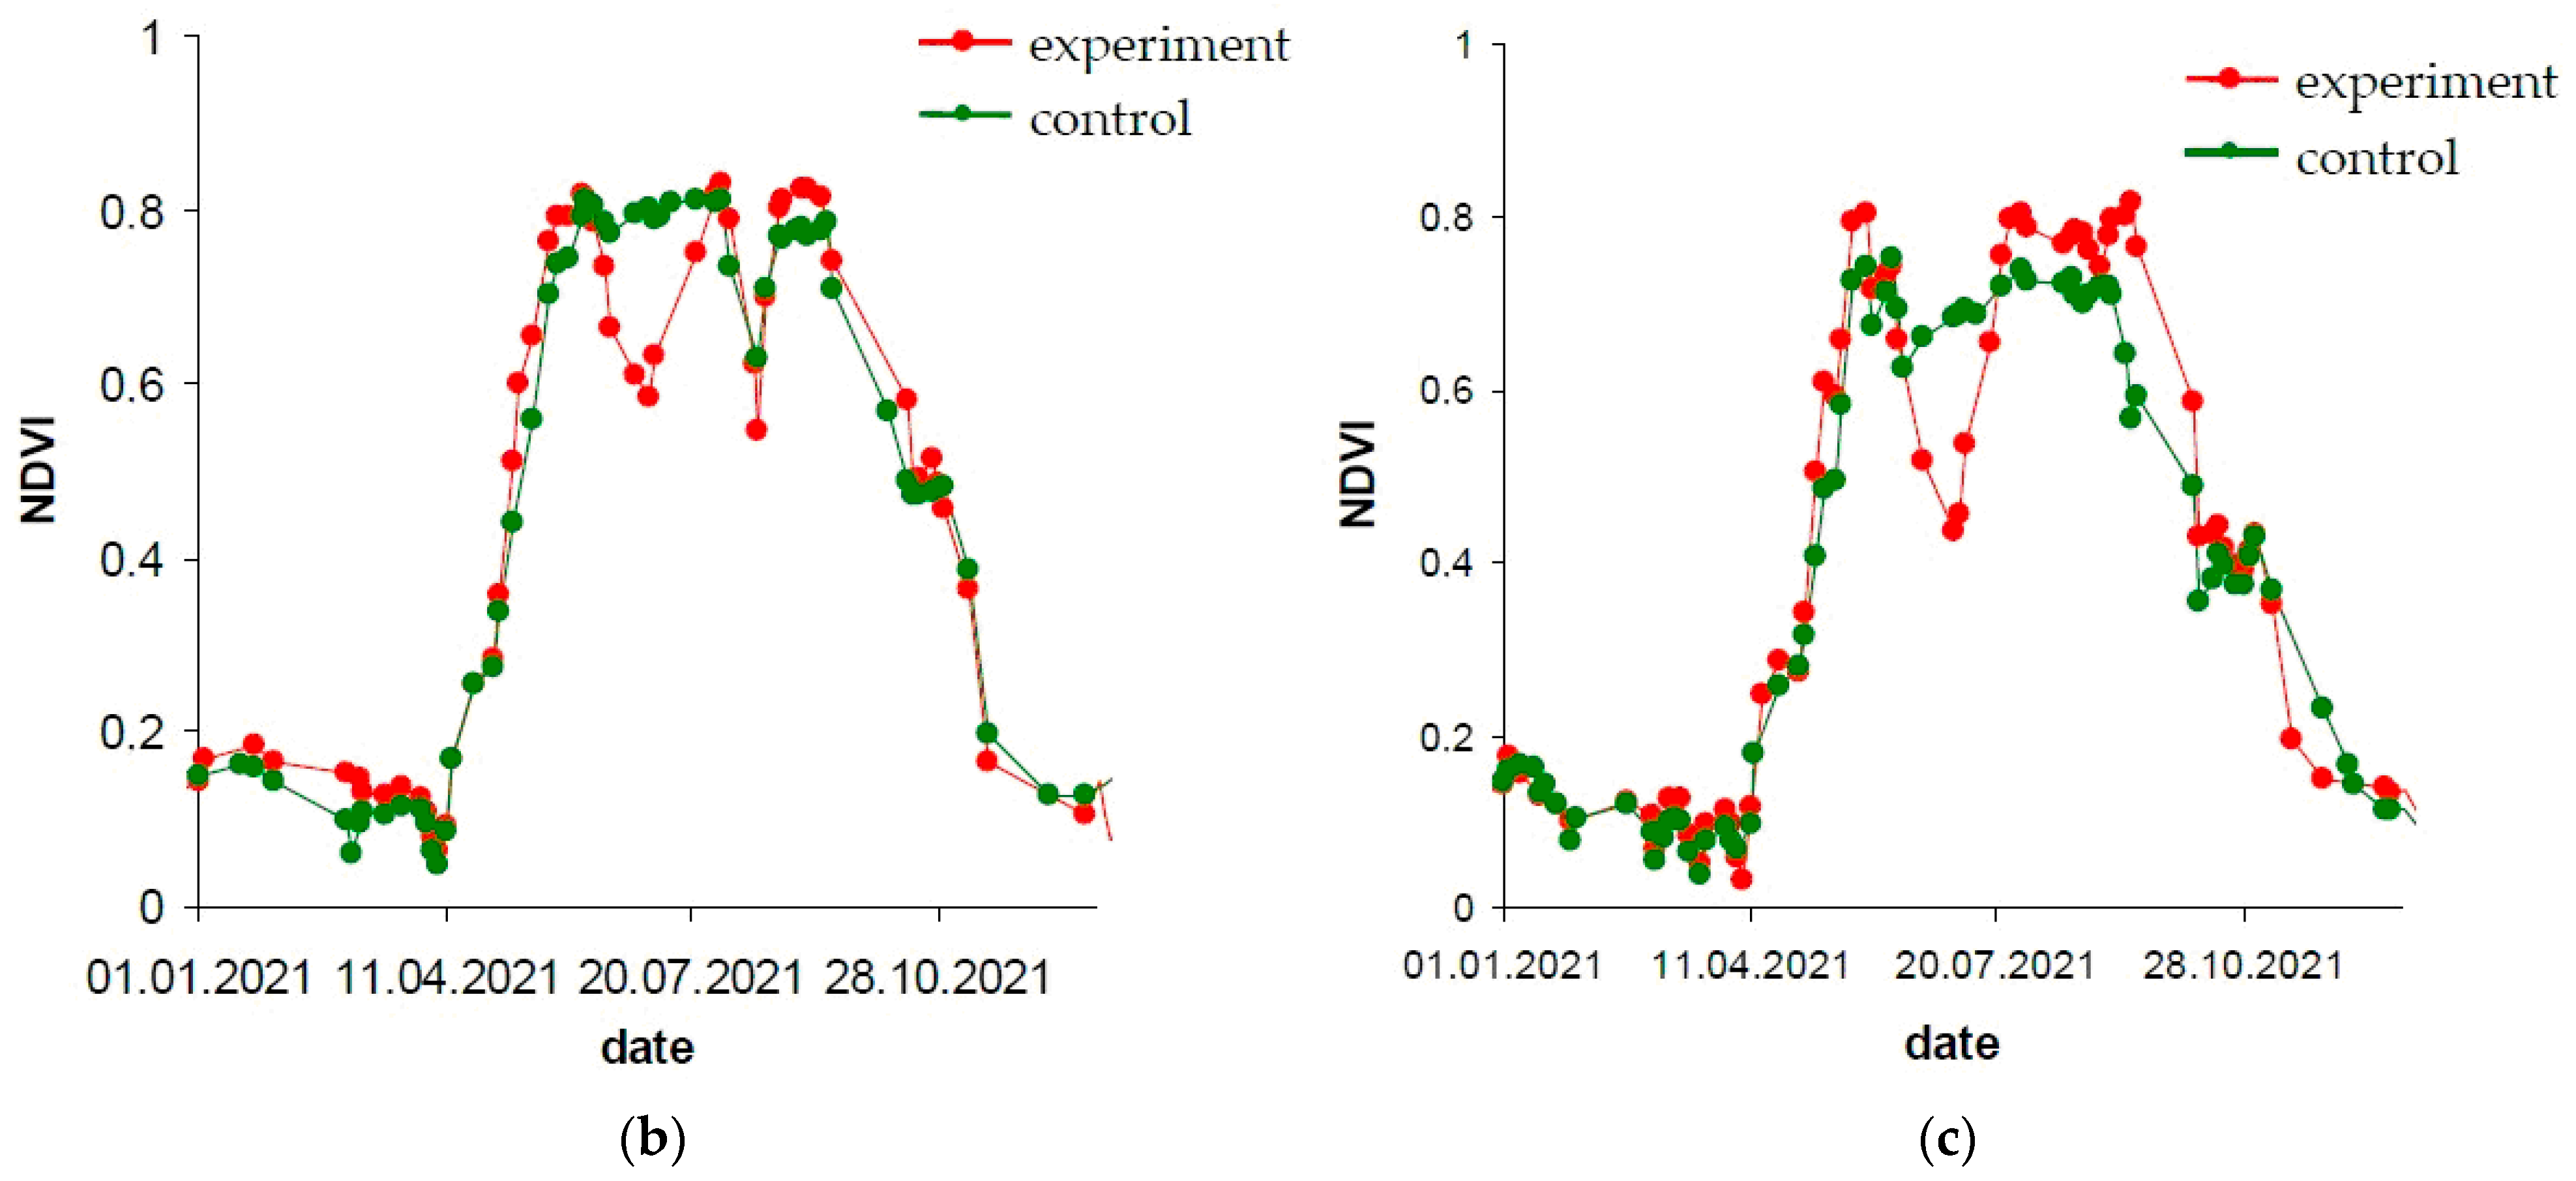
- Availability of the calculated Normalized Difference Vegetative Index (NDVI) for all studied territories. In this paper, the NDVI is calculated using the standard formula:where NIR and Red are the normalized values of the reflection intensity in the near-infrared and red ranges of the spectrum for a given point on the Earth’s surface [13].
- -
- Open access to the NDVI indicator time series via EO-browser analysis system of Sentinel-2 satellite data (https://apps.sentinel-hub.com/eo-browser/, accessed on 15 September 2023).
- -
- High spatial resolution up to 10 m per pixel.
- -
- Possibility of obtaining a sample of averaged NDVI time series for selected contours of the study sites directly through the EO-browser system.
- -
- In order to improve the accuracy of the obtained observations, we used images with the cloudiness level not exceeding 5%.
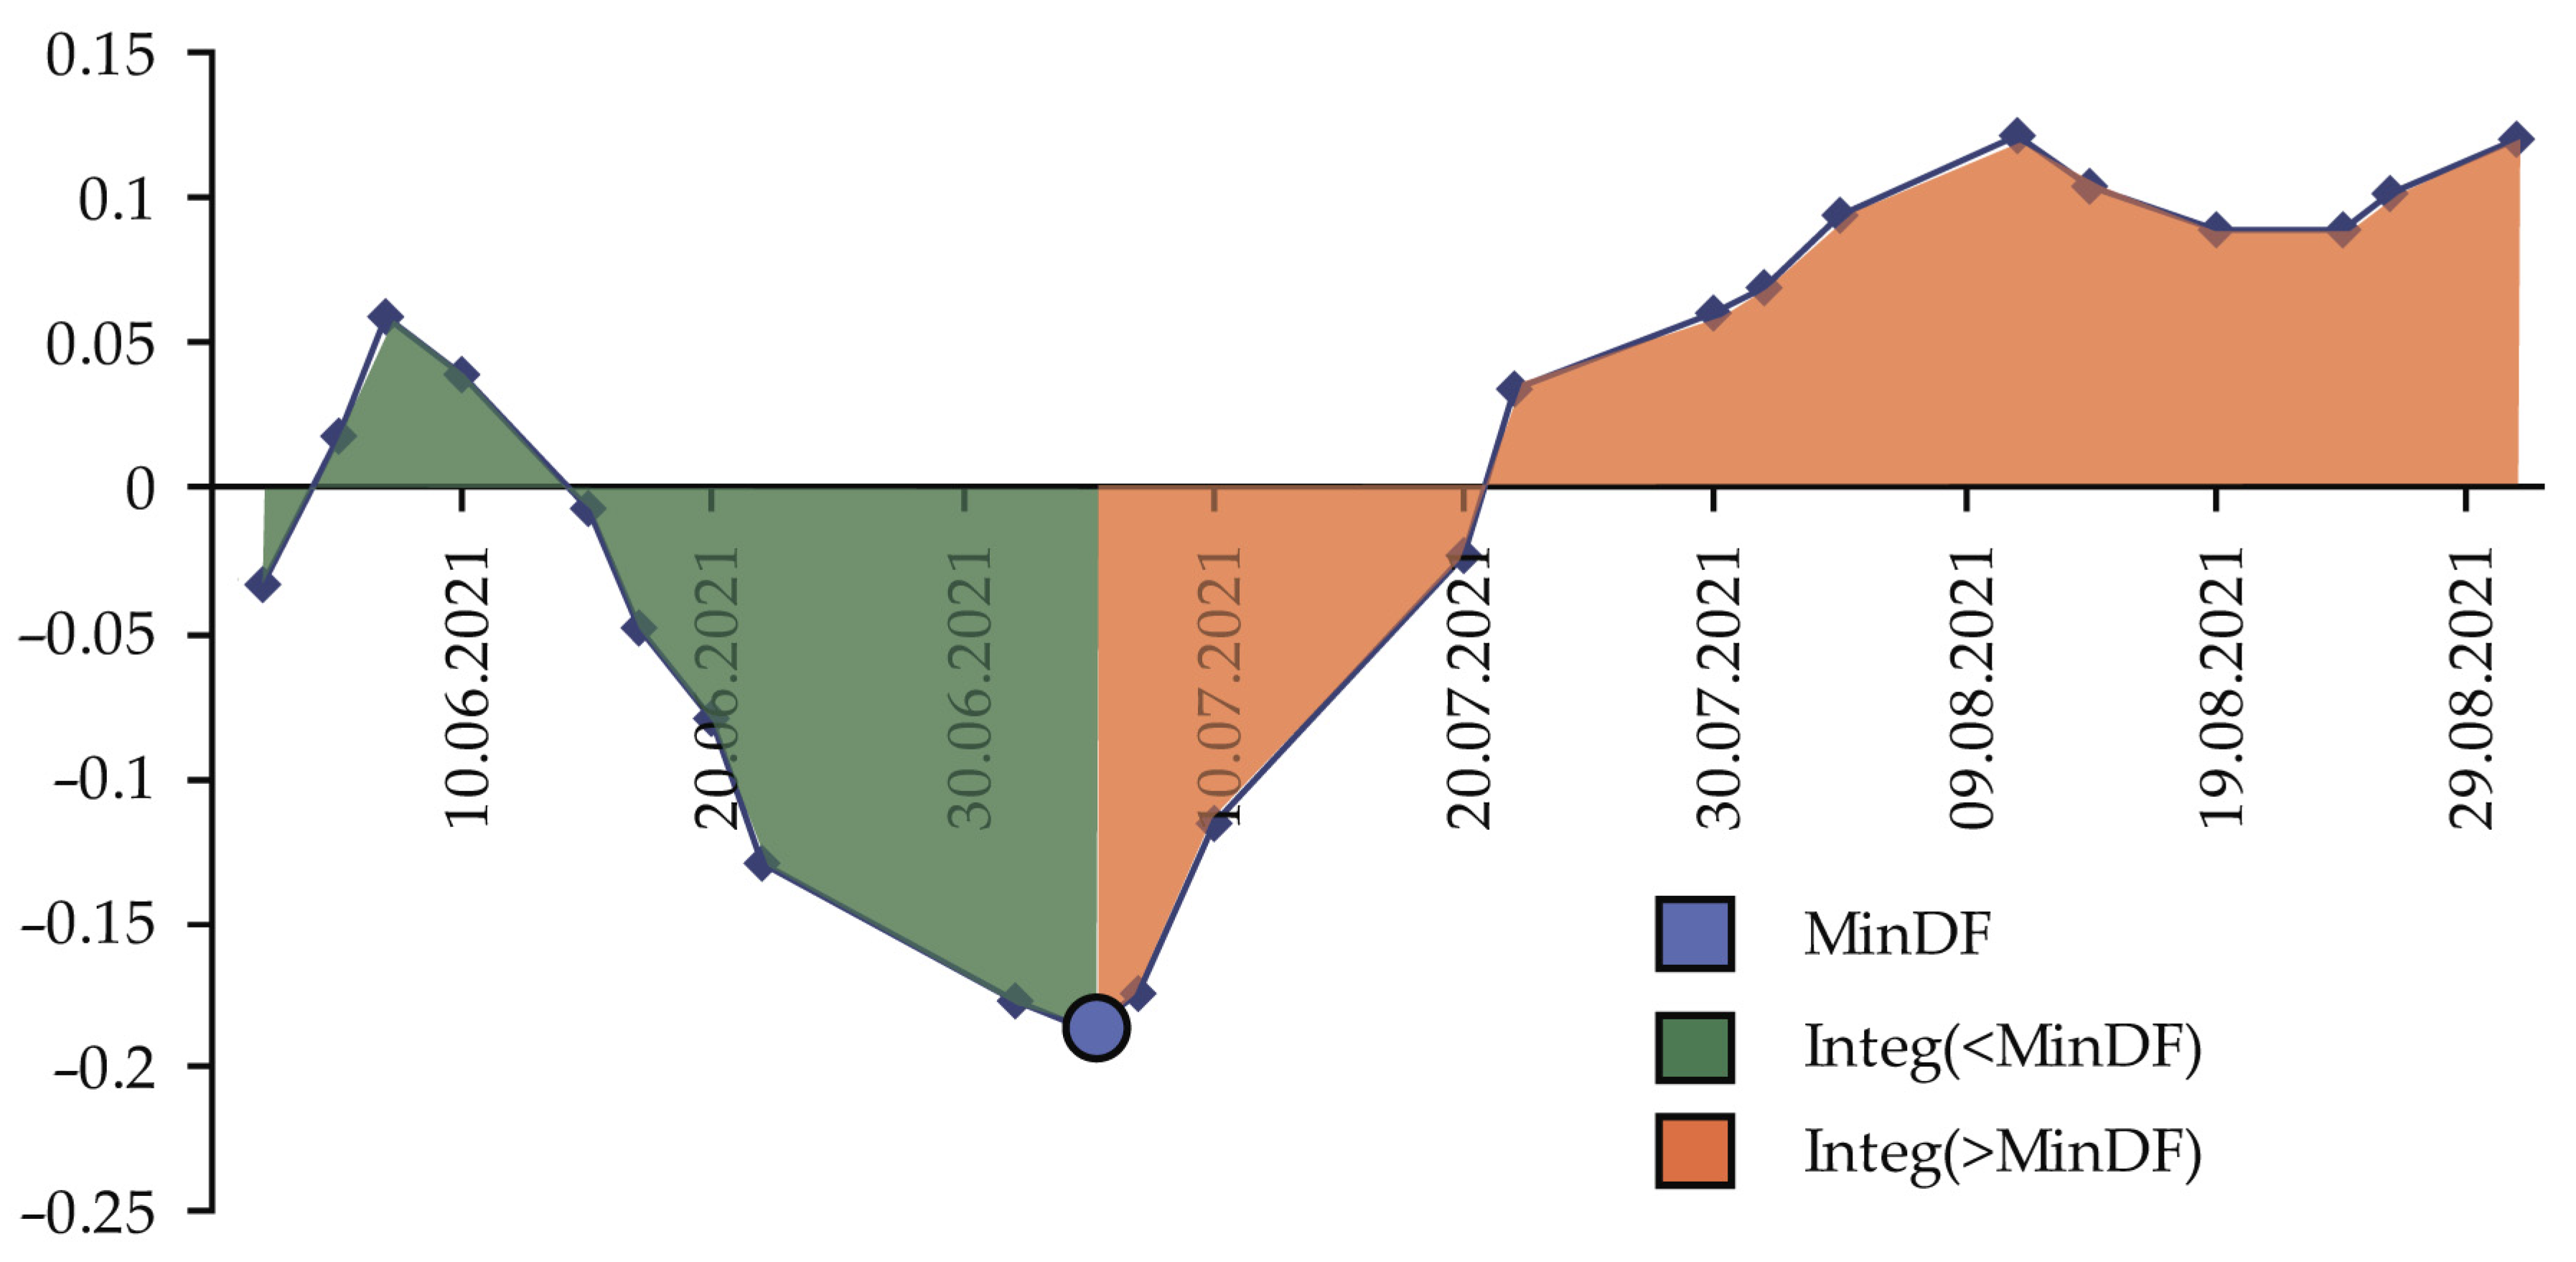
- MinDF—minimum DF value for the period: maximum stand damage.
- TMinDF—MinDF time point, which defines the moment of maximum stand damage.
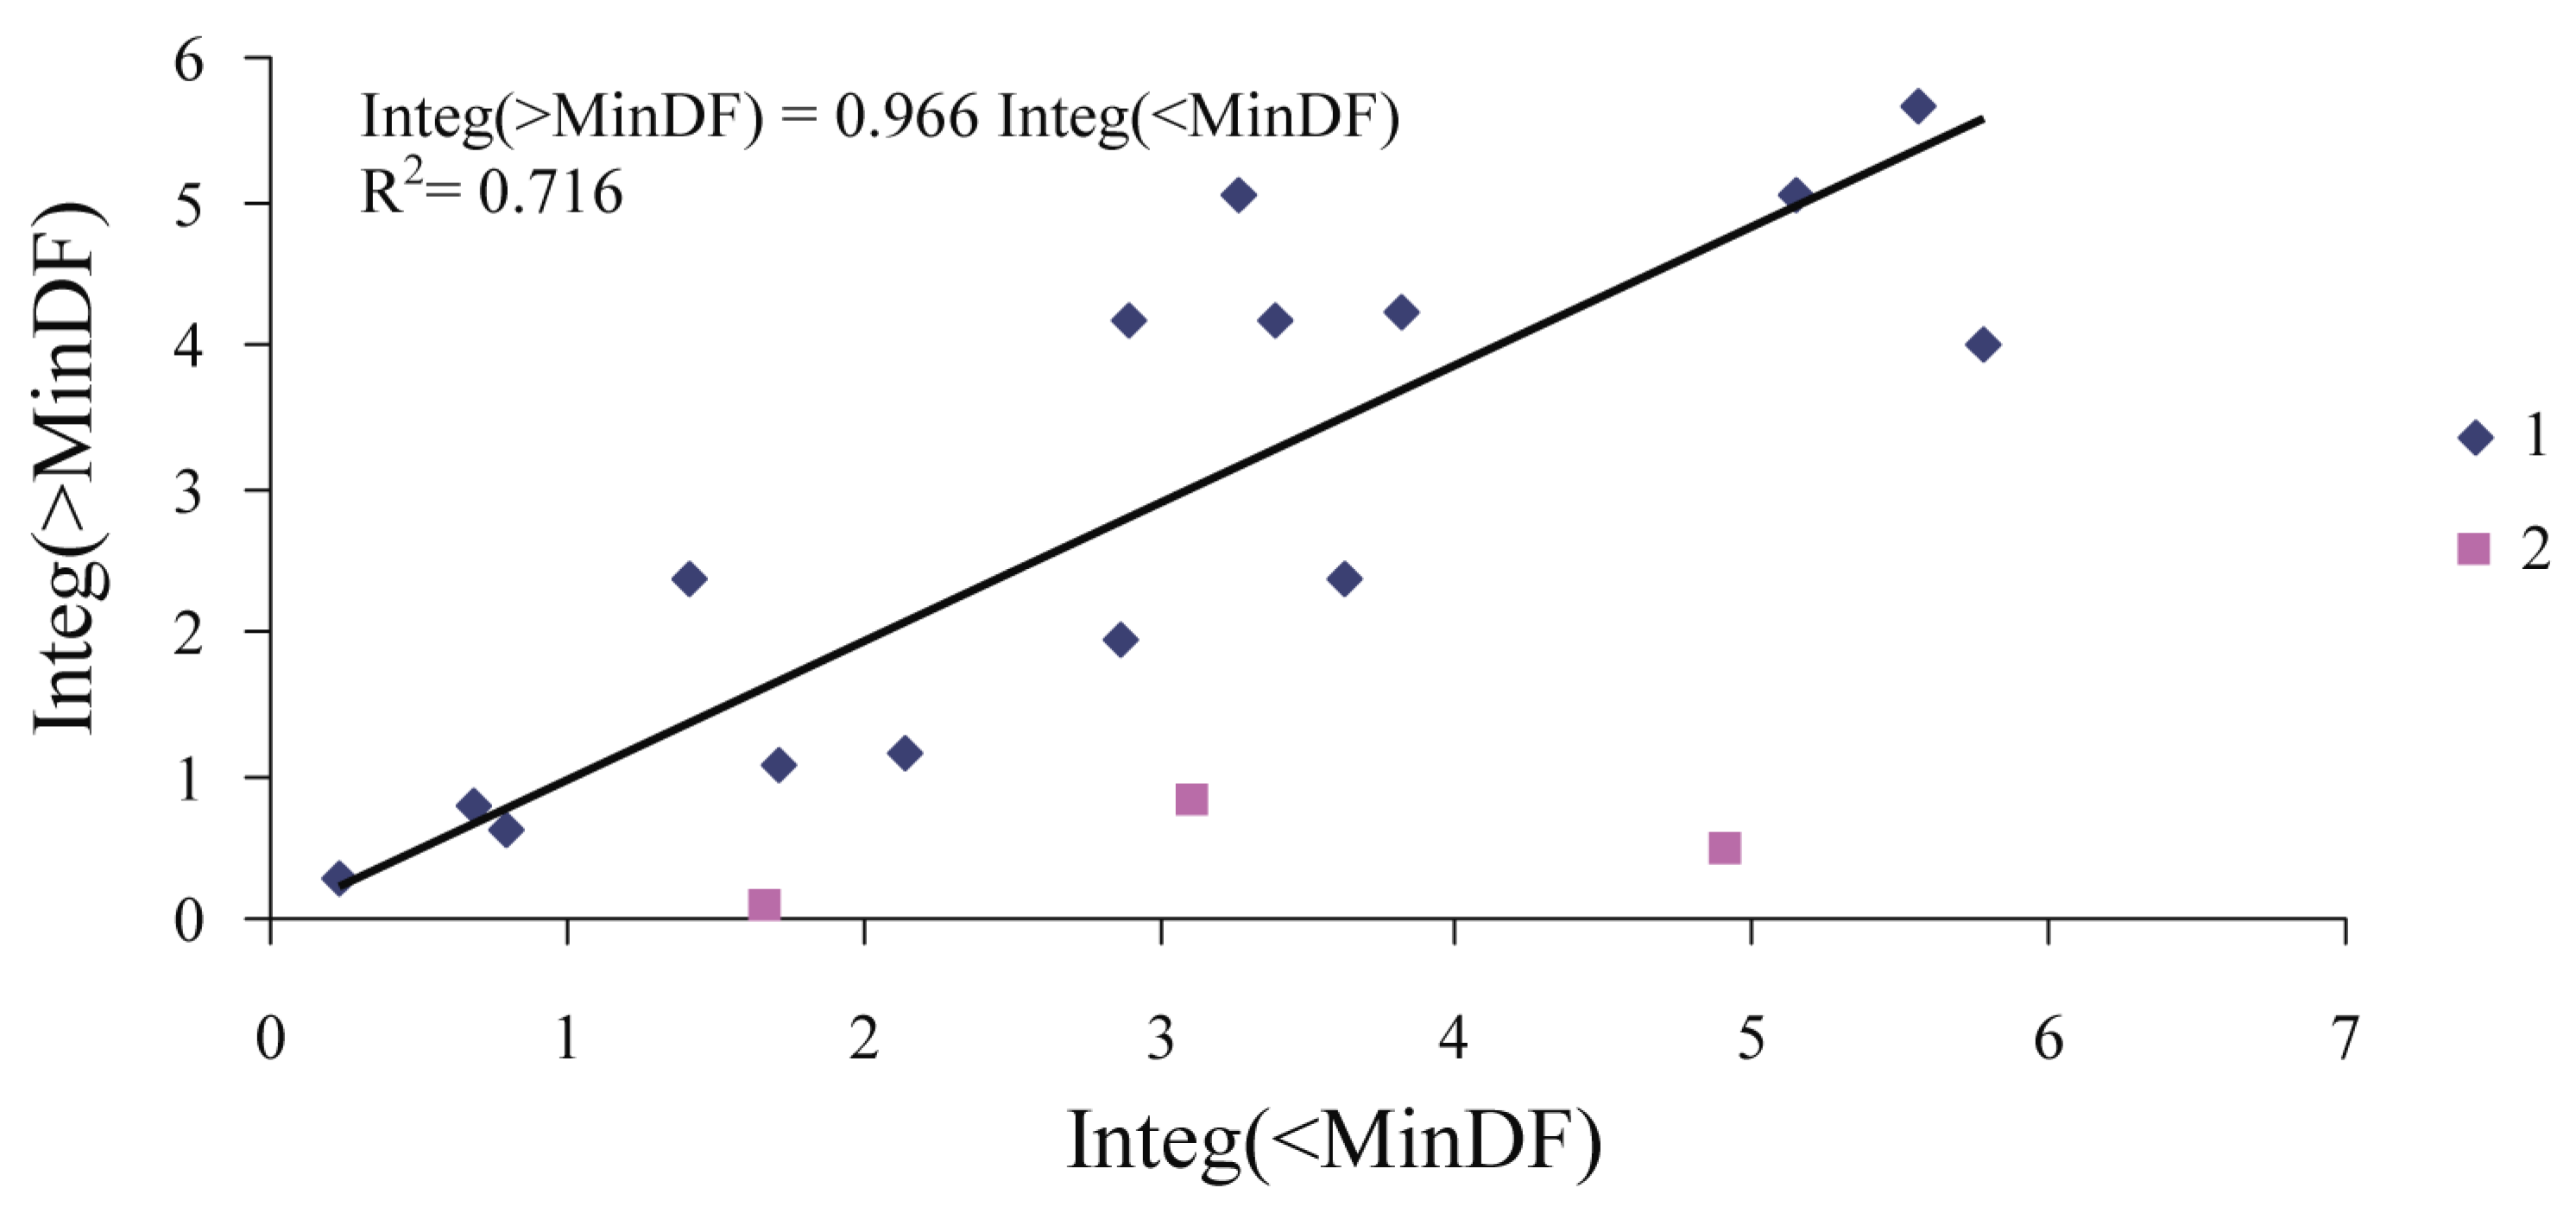
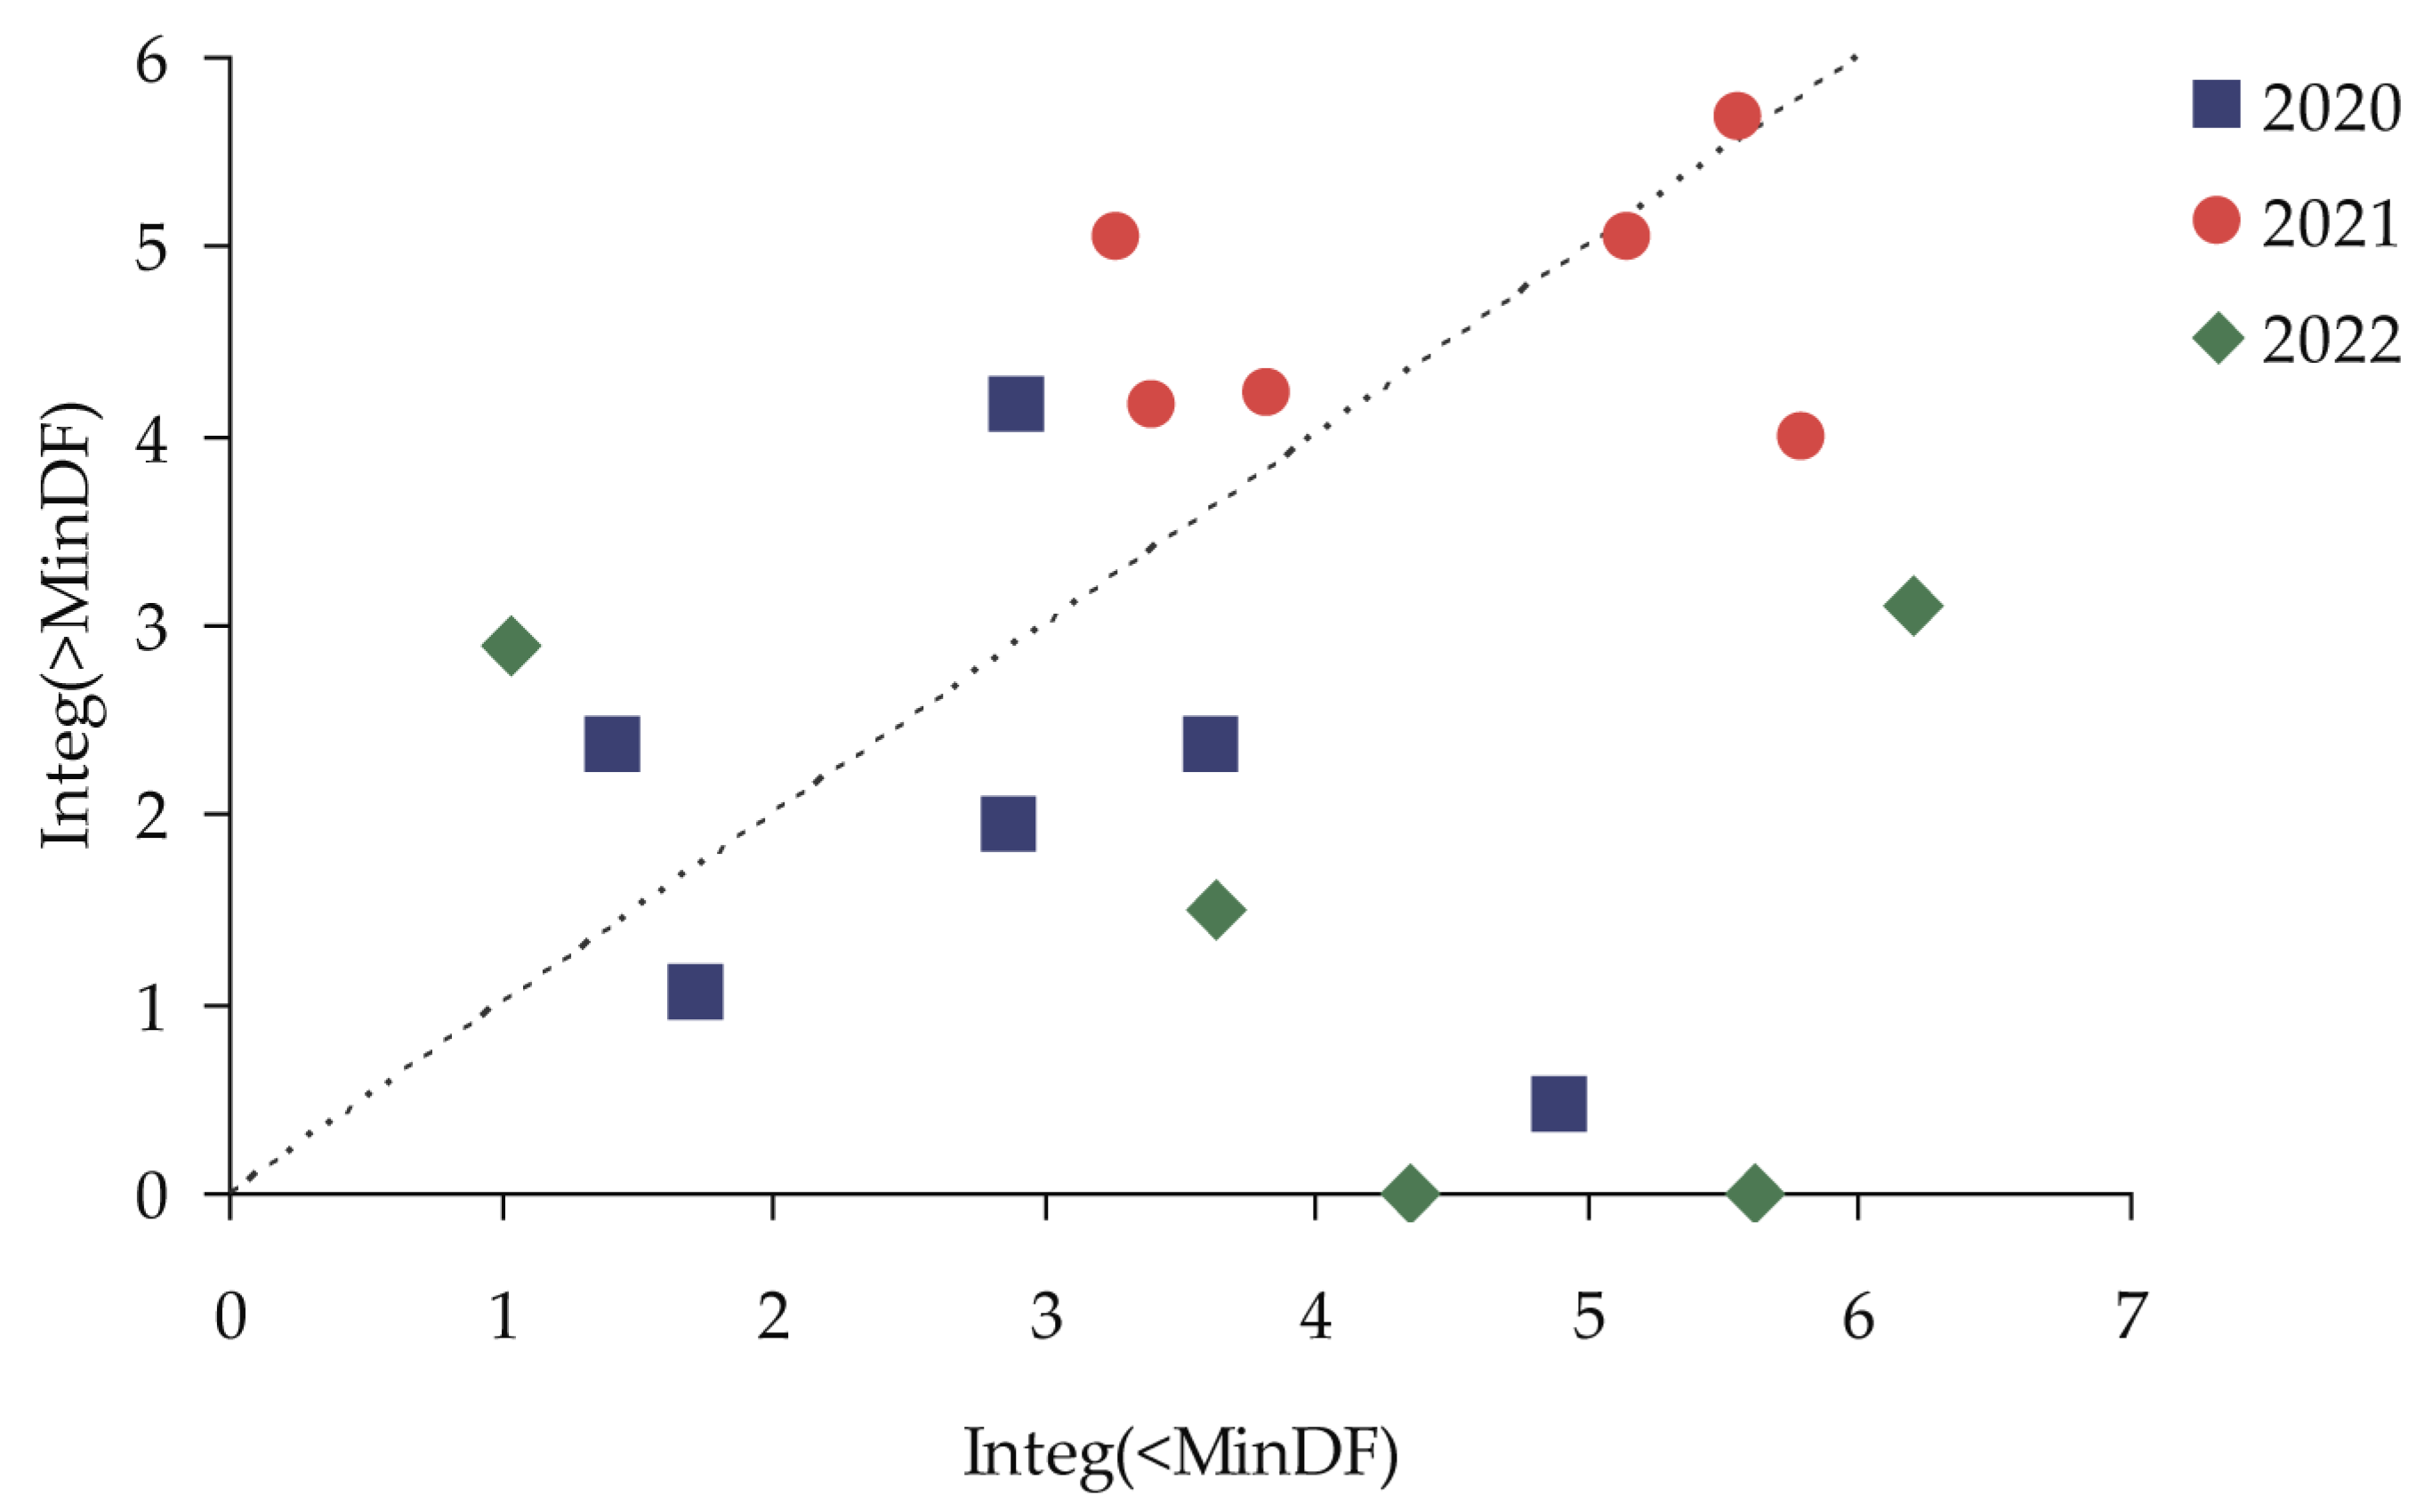
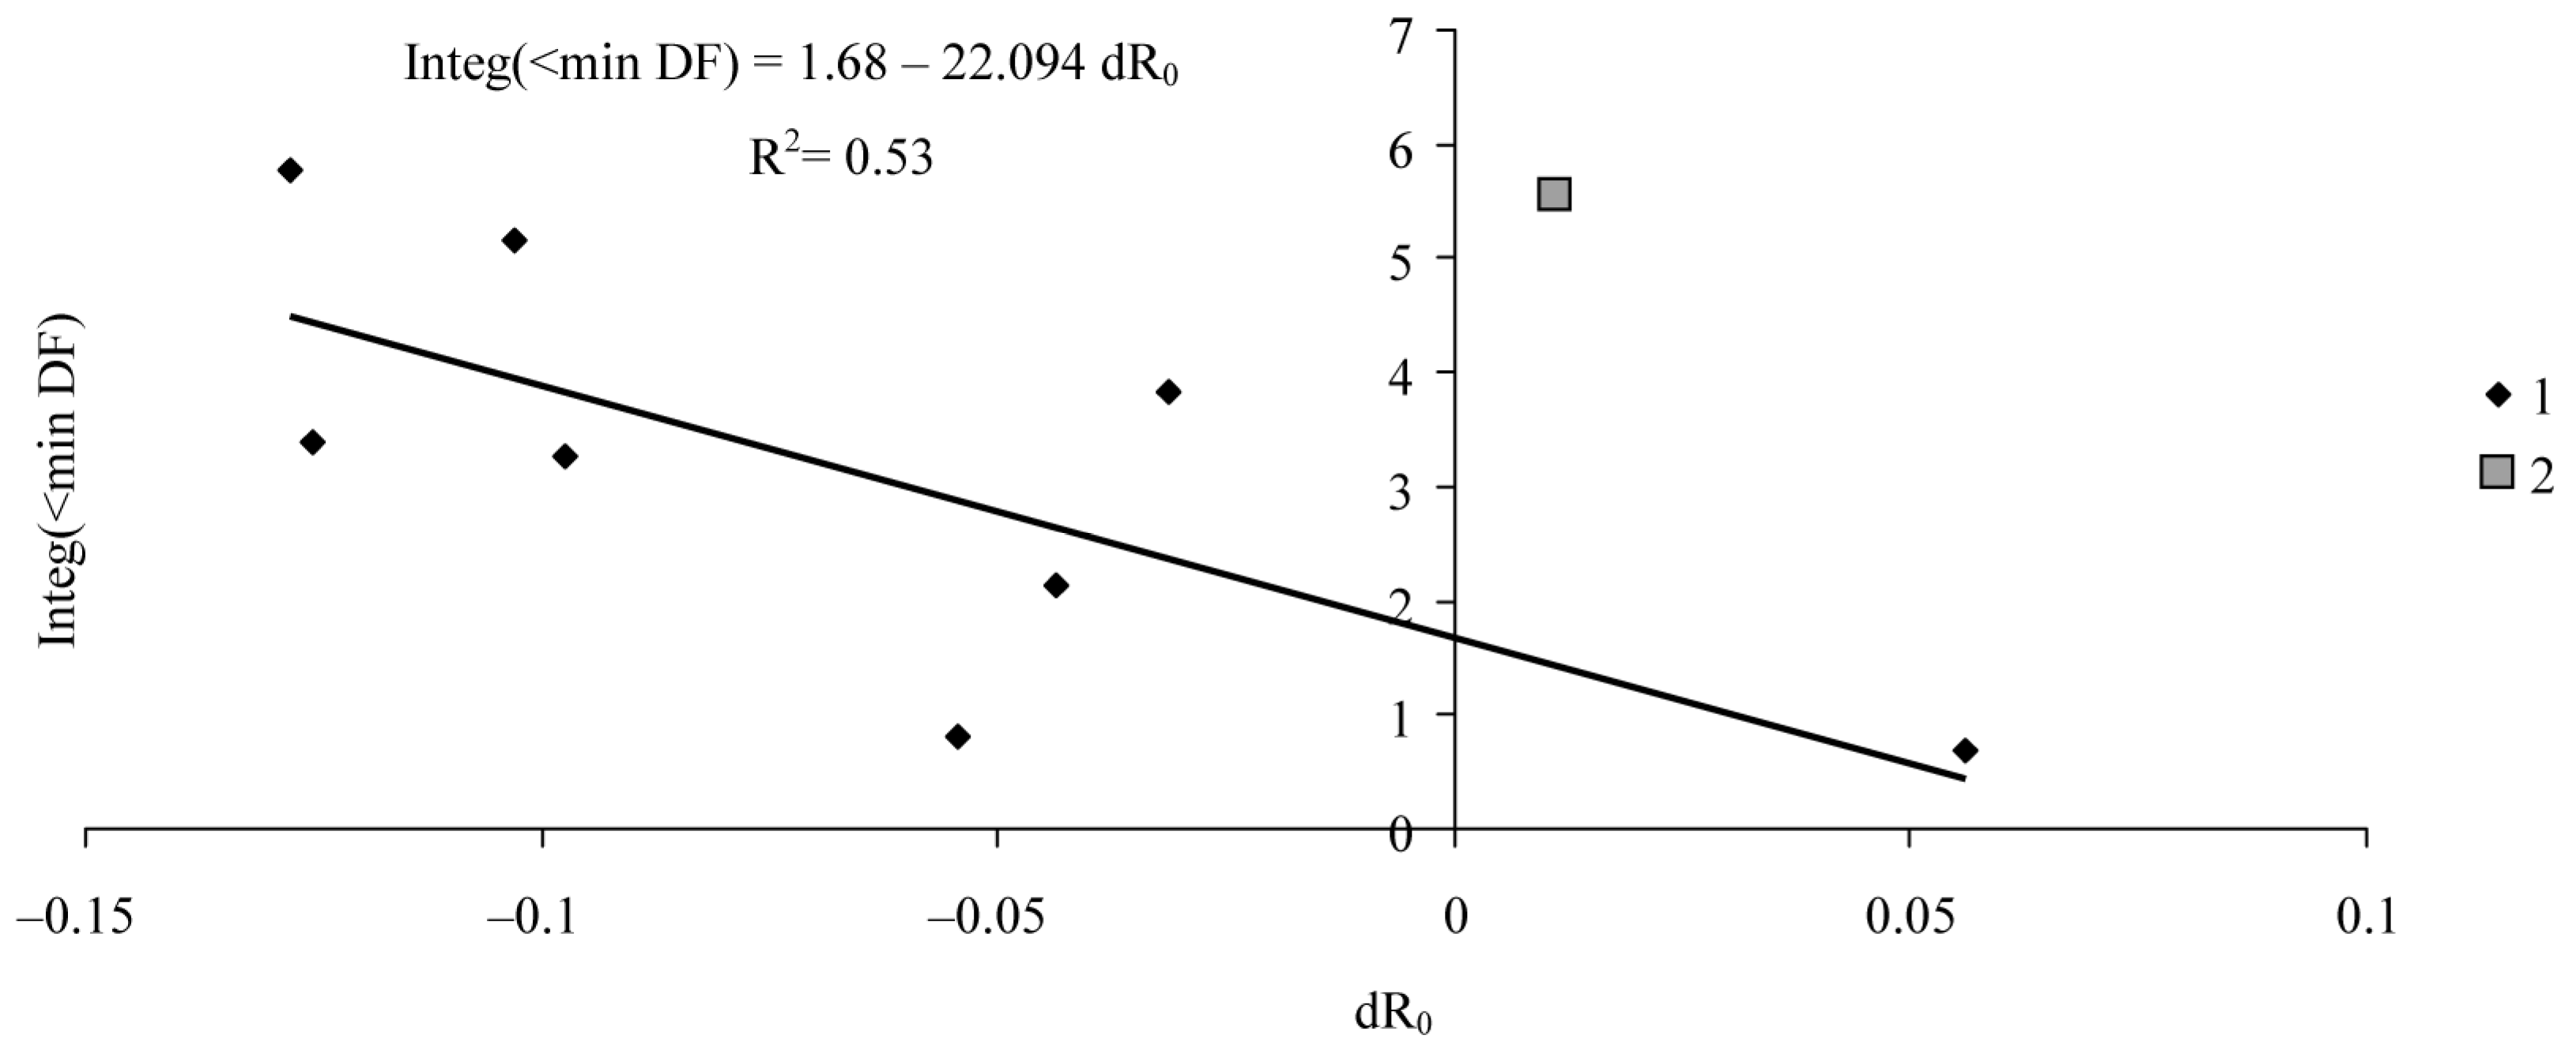
- Integ(<MinDF)—integral sum of indicator during defoliation: defines the defoliation intensity for the whole time up to the moment of MinDF.
- Integ(>MinDF)—integral sum of the indicator during refoliation after MinDF has been reached.
2.2. Assessing Tree Condition Using Biophysical Methods
3. Results
4. Discussion
5. Conclusions
Author Contributions
Funding
Data Availability Statement
Conflicts of Interest
References
- Fraterrigo, J.M.; Ream, K.; Knoepp, J.D. Tree mortality from insect infestation enhances carbon stabilization in southern Appalachian forest soils. J. Geophys. Res. Biogeosci. 2018, 123, 2121–2134. [Google Scholar] [CrossRef]
- Peltzer, D.A.; Allen, R.B.; Lovett, G.M.; Whitehead, D.; Wardle, D.A. Effects of biological invasions on forest carbon sequestration. Glob. Change Biol. 2010, 16, 732–746. [Google Scholar] [CrossRef]
- Jepsen, J.U.; Hagen, S.B.; Ims, R.A.; Yoccoz, N.G. Climate change and outbreaks of the geometrids Operophtera brumata and Epirrita autumnata in sub-arctic birch forest: Evidence of a recent outbreak range expansion. J. Anim. Ecol. 2008, 77, 257–264. [Google Scholar] [CrossRef] [PubMed]
- Jepsen, J.U.; Kapari, L.; Hagen, S.B.; Schott, T.; Vindstad, O.P.L.; Nilssen, A.C.; Ims, R.A. Rapid northwards expansion of a forest insect pest attributed to spring phenology matching with sub-Arctic birch. Glob. Change Biol. 2011, 17, 2071–2083. [Google Scholar] [CrossRef]
- Weed, A.S.; Ayers, M.P.; Hicke, J.A. Consequences of climate change for biotic disturbances in North American forests. Ecol. Monogr. 2013, 83, 441–470. [Google Scholar] [CrossRef]
- Pureswaran, D.S.; De Grandpré, L.; Paré, D.; Taylor, A.; Barrette, M.; Morin, H.; Régnière, J.; Kneeshaw, D.D. Climate-induced changes in host tree-insect phenology may drive ecological state-shift in boreal forests. Ecology 2015, 96, 1480–1491. [Google Scholar] [CrossRef]
- Kallio, P.; Lehtonen, J. Birch forest damage caused by Oporina autumnata (Bkh.) in 1966–99 in Utsjoki. Kevo Subarct. Res. Stn. 1974, 10, 55–69. [Google Scholar]
- Sharov, A.A.; Colbert, J.J. A model for testing hypotheses of gypsy moth Lymantria dispar L. population dynamics. Ecol. Model. 1996, 84, 31–51. [Google Scholar] [CrossRef]
- Soukhovolsky, V.G.; Ponomarev, V.I.; Sokolov, G.I.; Tarasova, O.V.; Krasnoperova, P.A. Gypsy moth Lymantria dispar L. in the Southern Urals: Features of population dynamics and modeling. Russ. J. Gen. Biol. 2015, 3, 179–194. (In Russian) [Google Scholar] [CrossRef]
- Inoue, M.N.; Suzuki-Ohno, Y.; Haga, Y.; Aarai, H.; Sano, T.; Martemyanov, V.V.; Kunimi, Y. Population dynamics and geographical distribution of the gypsy moth Lymantria dispar in Japan. For. Ecol. Manag. 2019, 434, 154–164. [Google Scholar] [CrossRef]
- Martemyanov, V.; Bykov, R.; Demenkova, M.; Gninenko, Y.; Romancev, S.; Bolonin, I.; Mazunin, I.; Belousova, I.; Akhanaev, Y.; Pavlushin, S.; et al. Genetic evidence of broad spreading of Lymantria dispar in the West Siberian Plain. PLoS ONE 2019, 14, e0220954. [Google Scholar] [CrossRef] [PubMed]
- Tucker, C.; Sellers, P. Satellite remote sensing of primary production. Int. J. Remote Sens. 1986, 7, 1395–1416. [Google Scholar] [CrossRef]
- Crippen, R.E. Calculating the vegetation index faster. Remote Sens. Environ. 1990, 34, 71–73. [Google Scholar] [CrossRef]
- Liu, J.; Kummerow, C.D.; Elsaesser, G.S. Identifying and analyzing uncertainty structures in the TRMM Microwave Imager precipitation product. Int. J. Remote Sens. 2017, 38, 23–42. [Google Scholar] [CrossRef]
- Rechid, D.; Raddatz, T.; Jacob, D. Parameterization of snow-free land surface albedo as a function of vegetation phenology based on MODIS data and applied in climate modelling. Theor. Appl. Climatol. 2009, 95, 245–255. [Google Scholar] [CrossRef]
- Bayarjargal, Y.; Karnieli, A.; Bayasgalan, M.; Khudulmur, S.; Gandush, C.; Tucker, C. A comparative study of NOAA–AVHRR derived drought indices using change vector analysis. Remote Sens. Environ. 2006, 105, 9–22. [Google Scholar] [CrossRef]
- Cunha, M.; Richter, C. A time-frequency analysis on the impact of climate variability on semi-natural montane meadows. IEEE Trans. Geosci. Rem. Sens. 2014, 52, 6156–6164. [Google Scholar] [CrossRef]
- Jacquin, A.; Sheeren, D.; Lacombe, J.P. Vegetation cover degradation assessment in Madagascar savanna based on trend analysis of MODIS NDVI time series. Int. J. Appl. Earth Observ. Geoinform. 2010, 12, 3–10. [Google Scholar] [CrossRef]
- Liang, L.; Chen, Y.; Hawbaker, T.J.; Zhu, Z.L.; Gong, P. Mapping mountain pine beetle mortality through growth trend analysis of time-series Landsat data. Rem. Sens. 2014, 6, 5696–5716. [Google Scholar] [CrossRef]
- Senf, C.; Seidl, R.; Hostert, P. Remote sensing of forest insect disturbances: Current state and future directions. Int. J. Appl. Earth Observ. Geoinform. 2017, 60, 49–60. [Google Scholar] [CrossRef]
- Verbesselt, J.; Zeileis, A.; Herold, M. Near real-time disturbance detection using satellite image time series. Remote Sens. Environ. 2012, 123, 98–108. [Google Scholar] [CrossRef]
- Jingzong, Z.; Shijie, C.; Gen, Z.; Yongjun, M.; Yi, Z.; Jianping, H. Detecting Pest-Infested Forest Damage through Multispectral Satellite Imagery and Improved UNet. Sensors 2022, 22, 7440. [Google Scholar] [CrossRef]
- Cardil, A.; Otsu, K.; Pla, M.; Silva, C.A.; Brotons, L. Quantifying pine processionary moth defoliation in a pine-oak mixed forest using unmanned aerial systems and multispectral imagery. PLoS ONE 2019, 14, e0213027. [Google Scholar] [CrossRef]
- Soukhovolsky, V.; Krasnoperova, P.; Kovalev, A.; Sviderskaya, I.; Tarasova, O.; Ivanova, Y.; Akhanaev, Y.; Martemyanov, V. Differentiation of Forest Stands by Susceptibility to Folivores: A Retrospective Analysis of Time Series of Annual Tree Rings with Application of the Fluctuation-Dissipation Theorem. Forests 2023, 14, 1385. [Google Scholar] [CrossRef]
- Carter, J.K.; Blanchard, R.O. Electrical resistance to phloem width in red maple. Can. J. For. Res. 1978, 8, 90–93. [Google Scholar] [CrossRef]
- Davis, W.; Shigo, A.; Weyrick, R. Seasonal changes in electrical resistance of inner bark in red oak, red maple and eastern white pine. For. Sci. 1979, 25, 282–286. [Google Scholar]
- Feldman, Y.; Ermolina, I.; Hayashi, Y. Time domain dielectric spectroscopy study of biological systems. IEEE Trans. Dielectr. Electr. Insul. 2003, 10, 728–753. [Google Scholar] [CrossRef]
- Fissenko, S.; Fissenko, M. Vegetation variations of electric resistance of trees. Int. Sci. Ravine 2016, 18, 39–43. [Google Scholar]
- Soukhovolsky, V.G.; Voronin, V.I.; Oskolkov, V.A.; Kovalev, A.V. Express estimation of the physiological state of woody plants by dielectric characteristics of tree stem tissues. Lesnoy Zhurnal Russ. For. J. 2021, 2, 70–85. [Google Scholar] [CrossRef]
- Gabriel, S.; Lau, R.W.; Gabriel, C. The dielectric properties of biological tissues. 2. Measurements in the frequency range 10 Hz to 20 GHz. Phys. Med. Biol. 1996, 41, 2251–2269. [Google Scholar] [CrossRef]
- Ksenzhek, O.; Petrova, S.; Kolodyazhny, M. Electrical properties of plant tissues. Resistance of a maize leaf. Plant Physiology. 2004, 30, 61–67. [Google Scholar]
- Schanne, O.; Ruiz, P.; Ceretti, E. Impedance Measurements in Biological Cells; John Wiley & Sons: New York, NY, USA, 1978; 430p. [Google Scholar]
- Shortly, W.S.; Shigo, A.L.; Berry, P.; Abusambra, J. Electrical resistance in tree cambium zones relationship to rates of growth and wound closure. For. Sci. 1977, 23, 326–329. [Google Scholar]
- Hardle, W.; Simar, L. Applied Multivariate Statistical Analysis; Springer: Berlin/Heidelberg, Germany, 2007; 470p. [Google Scholar]
- Kharuk, V.I.; Ranson, K.J.; Kozuhovskaya, A.G.; Kondakov, Y.P.; Pestunov, I.A. NOAA/AVHRR satellite detection of Siberian silkmoth outbreaks in eastern Siberia. Int. J. Remote Sens. 2004, 25, 5543–5556. [Google Scholar] [CrossRef]
- Ponomarev, E.I.; Shvetsov, E.G.; Yakimov, N.D.; Tretyakov, P.D.; Goroshko, A.A.; Sultson, S.M.; Mikhaylov, P.V. Remote Sensing Assessment and Modeling of the Spatial Dynamics of Tree Stand Disturbance after the Impact of Siberian Silk Moth (Dendrolimus sibiricus). Forests 2023, 14, 261. [Google Scholar] [CrossRef]
- Peereman, J.; Bae, S.; Lin, T.C. A comparison of radar and optical remote sensing to detect cyclone-induced canopy disturbance in two subtropical forest landscapes. Environ. Res. Commun. 2022, 4, 101002. [Google Scholar] [CrossRef]
- Bae, S.; Müller, J.; Förster, B.; Hilmers, T.; Hochrein, S.; Jacobs, M.; Leroy, B.M.L.; Pretzsch, H.; Weisser, W.W.; Mitesser, O. Tracking the temporal dynamics of insect defoliation by high-resolution radar satellite data. Methods Ecol. Evol. 2021, 13, 121–132. [Google Scholar] [CrossRef]


| Year | Plot | MInDF | Date MInDF | Integ(<MinDF) | Integ(>MinDF) | Insect Attack |
|---|---|---|---|---|---|---|
| 2020 | PP03 | −0.181 | 14.07.2020 | 2.898 | 4.162 | Possible |
| 2020 | PP04 | −0.157 | 22.07.2020 | 3.618 | 2.362 | Impossible |
| 2020 | PP05 | −0.021 | 27.07.2020 | 2.866 | 1.947 | Impossible |
| 2020 | PP06 | −0.009 | 24.08.2020 | 4.907 | 0.467 | Impossible |
| 2020 | PP07 | −0.014 | 30.07.2020 | 1.408 | 2.373 | Impossible |
| 2020 | PP08 | −0.152 | 09.08.2020 | 1.716 | 1.059 | Impossible |
| 2020 | PP09 | −0.037 | 04.08.2020 | 1.677 | 0.083 | Impossible |
| 2020 | PP10 | −0.081 | 16.08.2020 | 3.120 | 0.827 | Impossible |
| 2020 | PP11 | −0.031 | 15.06.2020 | 0.232 | 0.295 | Impossible |
| 2021 | PP03 | −0.145 | 02.07.2021 | 5.784 | 3.987 | Possible |
| 2021 | PP04 | −0.272 | 02.07.2021 | 5.150 | 5.050 | Possible |
| 2021 | PP05 | −0.363 | 02.07.2021 | 5.557 | 5.676 | Possible |
| 2021 | PP06 | −0.187 | 05.07.2021 | 3.260 | 5.055 | Possible |
| 2021 | PP07 | −0.208 | 03.07.2021 | 3.394 | 4.171 | Possible |
| 2021 | PP08 | −0.198 | 30.06.2021 | 3.821 | 4.216 | Possible |
| 2021 | PP09 | −0.058 | 05.07.2021 | 0.800 | 0.628 | Impossible |
| 2021 | PP10 | −0.031 | 20.07.2021 | 0.681 | 0.801 | Impossible |
| 2021 | PP11 | −0.073 | 27.07.2021 | 2.141 | 1.168 | Impossible |
| 2022 | PP03 | −0.143 | 31.08.2022 | 5.610 | 0.000 | Impossible |
| 2022 | PP04 | −0.022 | 10.07.2022 | 1.041 | 2.903 | Impossible |
| 2022 | PP05 | 0.150 | 09.08.2022 | 19.204 | 2.415 | Impossible |
| 2022 | PP06 | 0.023 | 22.07.2022 | 6.193 | 3.110 | Impossible |
| 2022 | PP07 | −0.129 | 04.08.2022 | 3.625 | 1.495 | Impossible |
| 2022 | PP08 | 0.004 | 31.08.2022 | 4.344 | 0.000 | Impossible |
| 2022 | PP09 | −0.069 | 17.07.2022 | 1.640 | 0.860 | Impossible |
| 2022 | PP10 | −0.039 | 20.06.2022 | 0.408 | 4.517 | Impossible |
| 2022 | PP11 | −0.146 | 09.08.2022 | 4.367 | 0.460 | Impossible |
| Plots | Control | Damage | dR0 | Integ(<=MinDF) | Integ(>MinDF) | ||
|---|---|---|---|---|---|---|---|
| R0(C) | R∞ (C) | R0(A) | R∞ (A) | ||||
| pp03 | 4.50 | 1.61 | 4.50 | 1.98 | −0.13 | 5.78 | 3.99 |
| pp04 | 4.73 | 1.77 | 4.67 | 2.01 | −0.10 | 5.15 | 5.05 |
| pp05 | 4.75 | 1.73 | 4.67 | 1.61 | 0.01 | 5.56 | 5.68 |
| pp06 | 4.73 | 1.73 | 4.58 | 1.87 | −0.10 | 3.26 | 5.05 |
| pp07 | 4.52 | 1.80 | 4.32 | 1.94 | −0.12 | 3.39 | 4.17 |
| pp08 | 4.58 | 1.92 | 4.60 | 2.03 | −0.03 | 3.82 | 4.22 |
| pp09 | 4.41 | 1.93 | 4.49 | 2.15 | −0.05 | 0.80 | 0.63 |
| pp10 | 4.54 | 1.98 | 4.56 | 1.86 | 0.06 | 0.68 | 0.80 |
| pp11 | 4.52 | 2.07 | 4.54 | 2.19 | −0.04 | 2.14 | 1.17 |
| Parameters | Values | Std.Err. | t-Test | p-Value |
|---|---|---|---|---|
| dR0, Integ(<MinDF) | ||||
| Ad | 1.68 | 0.74 | 2.28 | 0.06 |
| Bd | −22.09 | 8.44 | −2.62 | 0.04 |
| R2 | 0.53 | |||
| adjR2 | 0.46 | |||
| F-test | 6.86 | |||
| dR0, Integ(>MinDF) | ||||
| Ar | 1.72 | 0.82 | 2.11 | 0.08 |
| Br | −21.46 | 9.34 | −2.30 | 0.06 |
| R2 | 0.47 | |||
| adjR2 | 0.38 | |||
| F-test | 5.28 | |||
| Plot | D1, Date | D2, Date | D3, Date | T1, Days | T2, Days |
|---|---|---|---|---|---|
| PP03 | 30.05.2021 | 09.06.2021 | 02.07.2021 | 10 | 23 |
| PP04 | 31.05.2021 | 07.06.2021 | 05.07.2021 | 7 | 28 |
| PP05 | 05.06.2021 | 07.06.2021 | 02.07.2021 | 2 | 25 |
| PP06 | 07.06.2021 | 15.06.2021 | 02.07.2021 | 8 | 17 |
| PP07 | 08.06.2021 | 15.06.2021 | 28.06.2021 | 7 | 13 |
| PP08 | 05.06.2021 | 15.06.2021 | 30.06.2021 | 10 | 15 |
| PP09 | 05.06.2021 | 12.06.2021 | 02.07.2021 | 7 | 20 |
| PP10 | 05.06.2021 | 15.06.2021 | 25.06.2021 | 10 | 10 |
| PP11 | 01.06.2021 | 06.06.2021 | 20.06.2021 | 5 | 14 |
| Parameters | Value | Std.Err. | t-Test | p-Value |
|---|---|---|---|---|
| T1 | ||||
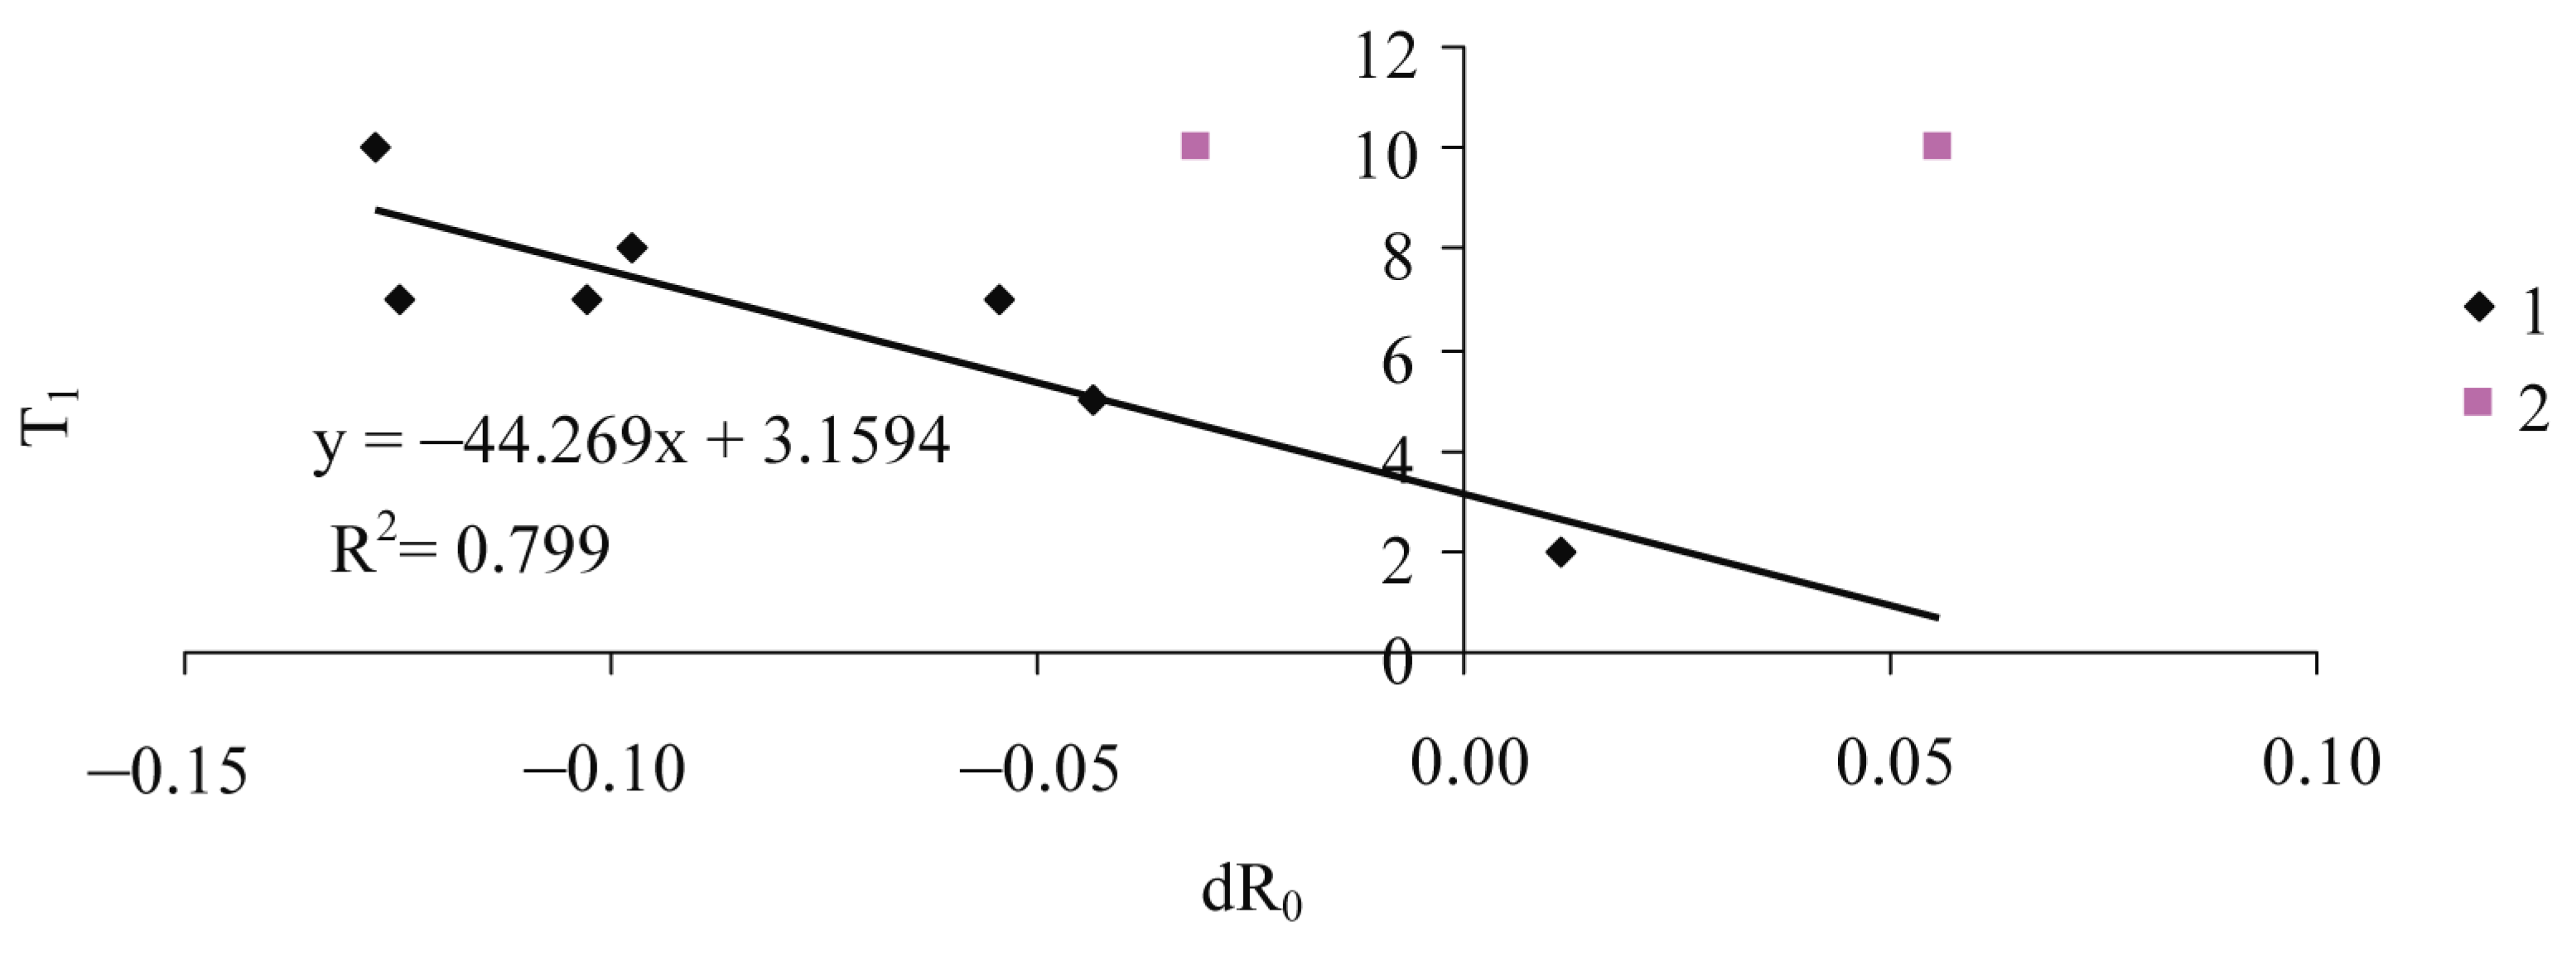
| Intercept | 3.16 | 0.90 | 3.53 | 0.02 |
| Slope | −44.27 | 9.93 | −4.46 | 0.01 |
| R2 | 0.80 | |||
| F-test | 19.90 | |||
| T2 | ||||
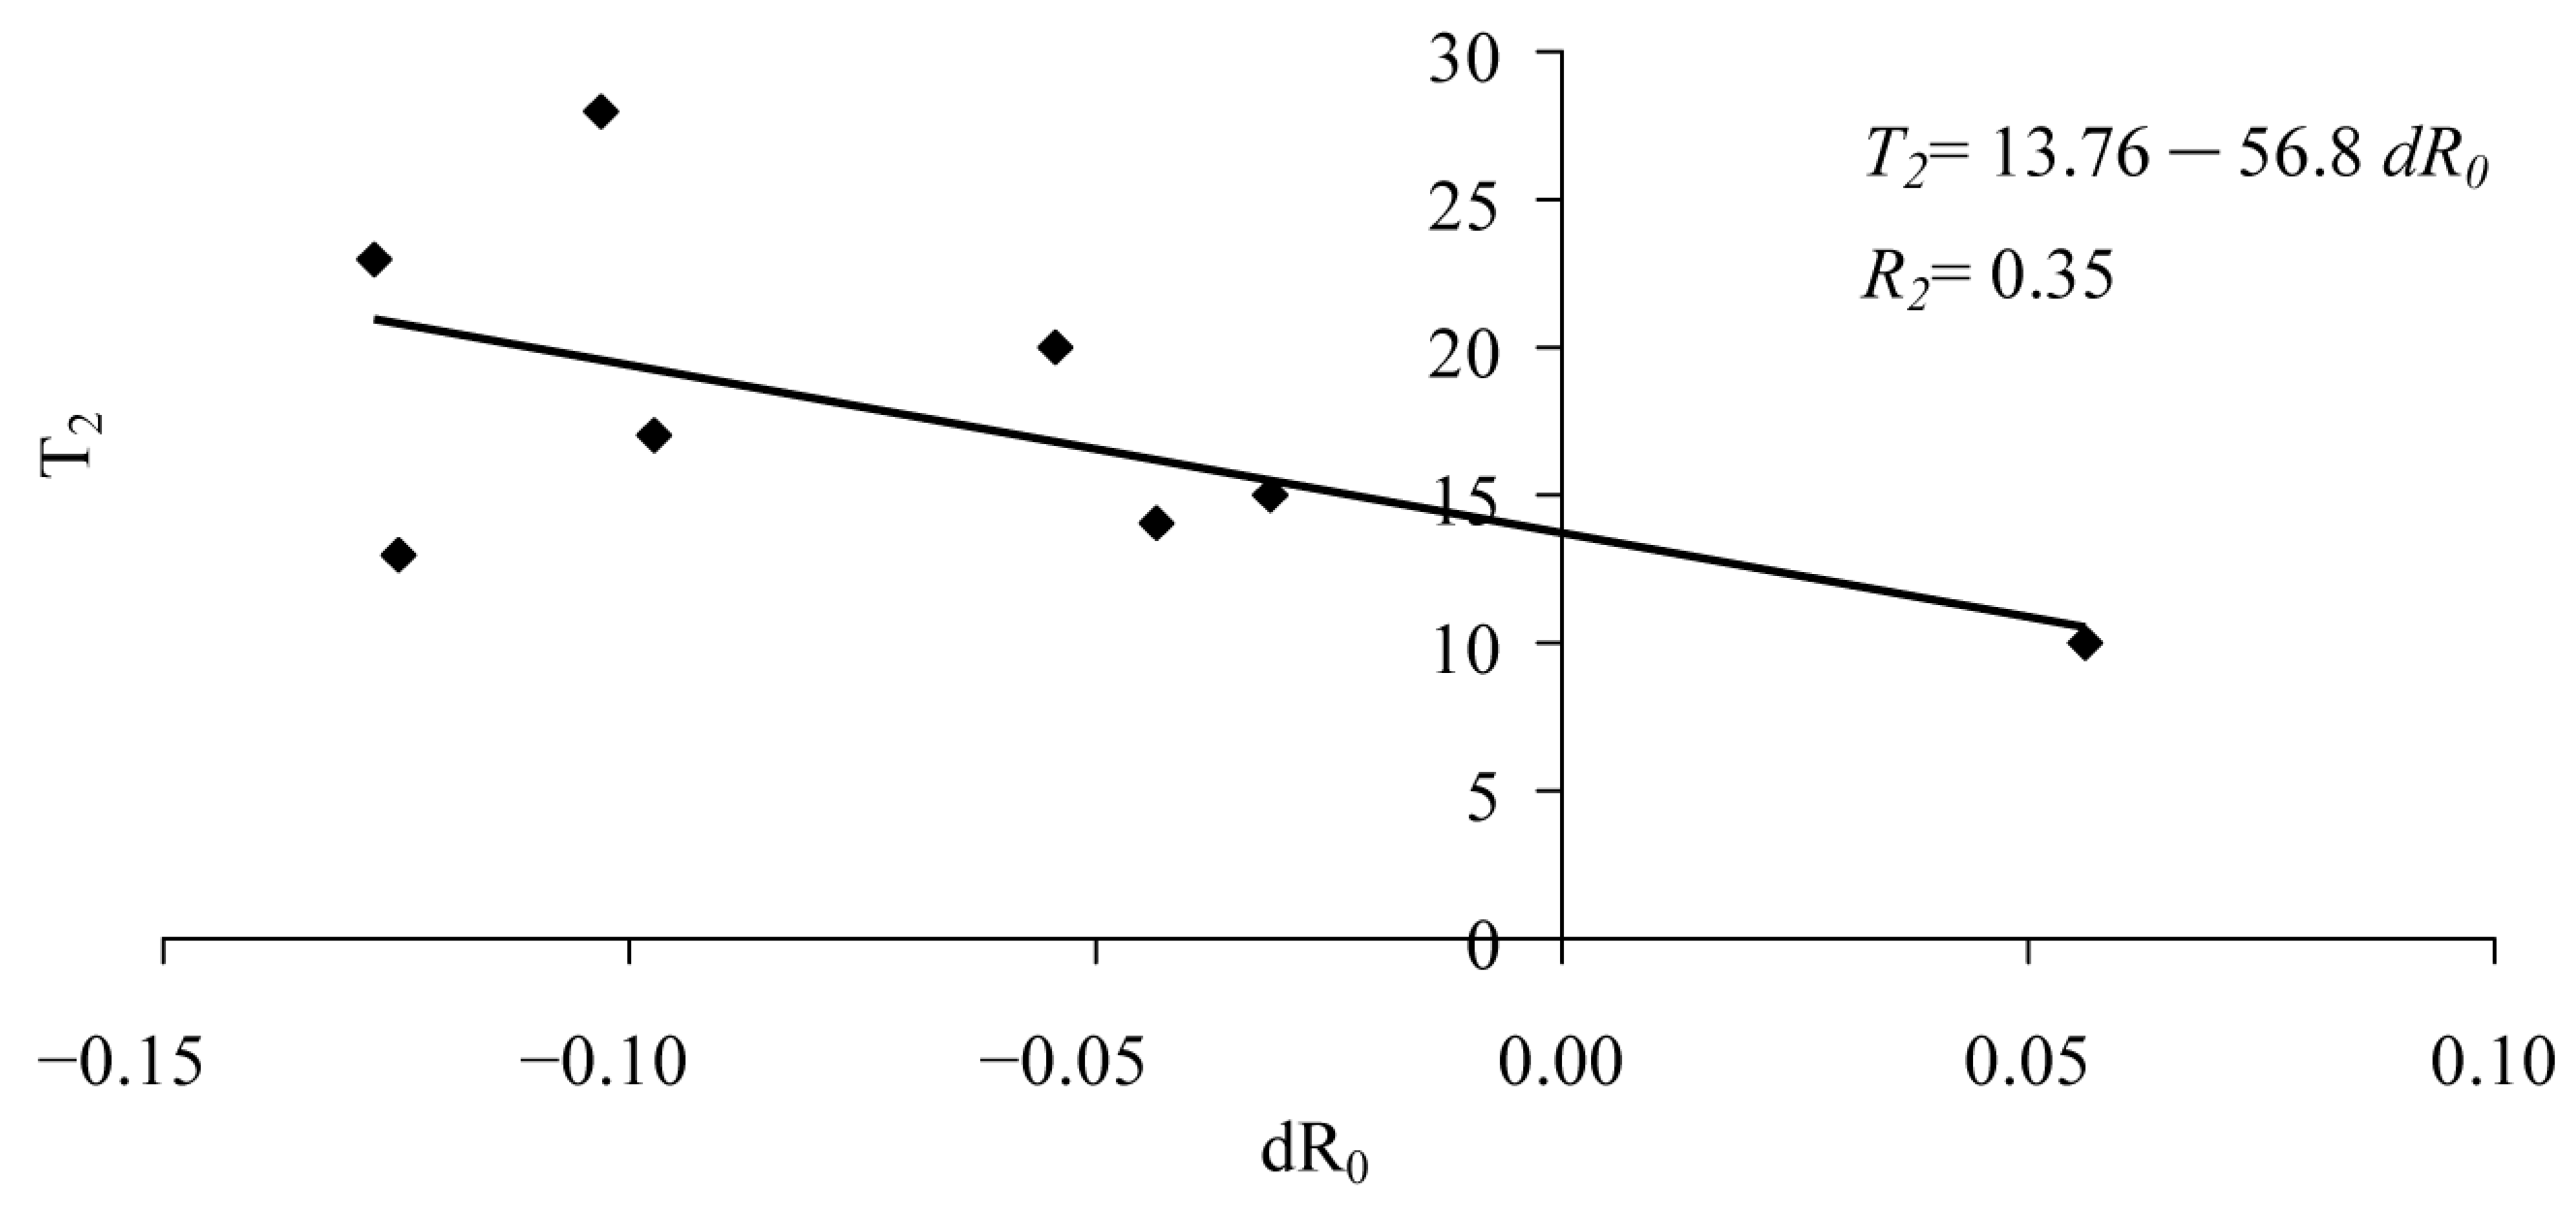
| Intercept | 13.76 | 2.75 | 5.00 | 0.00 |
| Slope | −56.81 | 31.53 | −1.80 | 0.12 |
| R2 | 0.35 | |||
| F-test | 3.2 | |||
| T1/T2 | ||||
| Intercept | 27.88 | 5.30 | 5.26 | 0.00 |
| Slope | −1.17 | 0.59 | −1.97 | 0.10 |
| R2 | 0.39 | |||
| F-test | 3.9 | |||
Disclaimer/Publisher’s Note: The statements, opinions and data contained in all publications are solely those of the individual author(s) and contributor(s) and not of MDPI and/or the editor(s). MDPI and/or the editor(s) disclaim responsibility for any injury to people or property resulting from any ideas, methods, instructions or products referred to in the content. |
© 2023 by the authors. Licensee MDPI, Basel, Switzerland. This article is an open access article distributed under the terms and conditions of the Creative Commons Attribution (CC BY) license (https://creativecommons.org/licenses/by/4.0/).
Share and Cite
Kovalev, A.; Soukhovolsky, V.; Tarasova, O.; Akhanaev, Y.; Martemyanov, V. Remote Sensing Indicators of Spongy Moth (Lymantria dispar L.) Damage to Birch Stands in Western Siberia. Forests 2023, 14, 2308. https://doi.org/10.3390/f14122308
Kovalev A, Soukhovolsky V, Tarasova O, Akhanaev Y, Martemyanov V. Remote Sensing Indicators of Spongy Moth (Lymantria dispar L.) Damage to Birch Stands in Western Siberia. Forests. 2023; 14(12):2308. https://doi.org/10.3390/f14122308
Chicago/Turabian StyleKovalev, Anton, Vladislav Soukhovolsky, Olga Tarasova, Yuriy Akhanaev, and Vyacheslav Martemyanov. 2023. "Remote Sensing Indicators of Spongy Moth (Lymantria dispar L.) Damage to Birch Stands in Western Siberia" Forests 14, no. 12: 2308. https://doi.org/10.3390/f14122308
APA StyleKovalev, A., Soukhovolsky, V., Tarasova, O., Akhanaev, Y., & Martemyanov, V. (2023). Remote Sensing Indicators of Spongy Moth (Lymantria dispar L.) Damage to Birch Stands in Western Siberia. Forests, 14(12), 2308. https://doi.org/10.3390/f14122308