Article

Analysis of Wildfire Danger Level Using Logistic Regression Model in Sichuan Province, China

1
Key Laboratory of National Forestry and Grassland Administration on Forest Ecosystem Protection and Restoration of Poyang Lake Watershed, College of Forestry, Nanchang 330045, China
2
College of Forestry, Jiangxi Agricultural University, Nanchang 330045, China
3
College of Environmental and Resource Sciences, Zhejiang A&F University, Hangzhou 311300, China
*
Author to whom correspondence should be addressed.
Forests 2023, 14(12), 2352; https://doi.org/10.3390/f14122352
Submission received: 22 October 2023 / Revised: 14 November 2023 / Accepted: 17 November 2023 / Published: 29 November 2023
(This article belongs to the Special Issue Fire Ecology and Management in Forest)

Abstract

:
Sichuan Province preserves numerous rare and ancient species of plants and animals, making it an important bio-genetic repository in China and even the world. However, this region is also vulnerable to fire disturbance due to the rich forest resources, complex topography, and dry climate, and thus has become one of main regions in China needing wildfire prevention. Analyzing the main driving factors influencing wildfire incidence can provide data and policy guidance for wildfire management in Sichuan Province. Here we analyzed the spatial and temporal distribution characteristics of wildfires in Sichuan Province based on the wildfire spot data during 2010–2019. Based on 14 input variables, including climate, vegetation, human factors, and topography, we applied the Pearson correlation analysis and Random Forest methods to investigate the most important factors in driving wildfire occurrence. Then, the Logistic model was further applied to predict wildfire occurrences. The results showed that: (1) The southwestern Sichuan Province is a high-incidence area for wildfires, and most fires occurred from January to June. (2) The most important factor affecting wildfire occurrence is monthly average temperature, followed by elevation, monthly precipitation, population density, Normalized Difference Vegetation Index (NDVI), NDVI in the previous month, and Road kernel density. (3) The Logistic wildfire prediction model yielded good performance, with the area under curve (AUC) values higher than 0.94, overall accuracy (OA) higher than 86%, true positive rate (TPR) values higher than 0.82, and threat score (TS) values higher than 0.71. The final selected prediction model has an AUC of 0.944, an OA of 87.28%, a TPR of 0.829, and a TS of 0.723. (4) The results of the prediction indicate that extremely high danger of wildfires (probability of fire occurrence higher than 0.8) is concentrated in the southwest, which accounted for about 1% of the area of the study region, specifically in Panzhihua and Liangshan. These findings demonstrated the effectiveness of the Logistic model in predicting forest fires in Sichuan Province, providing valuable insights regarding forest fire management and prevention efforts in this region.

1. Introduction

Wildfires are important disturbances and critical processes in terrestrial ecosystems [1,2,3], and they are major natural disasters for forests [4,5]. Wildfires shape and influence the vegetation structure and distribution [6], disrupt the carbon cycle balance in forest ecosystems [7], exacerbate soil erosion and air pollution [8], and can even lead to a sharp decline in biodiversity [9], threatening socioeconomic health and sustainable development [10]. Many countries are threatened by wildfires, especially those in southern Europe, like Portugal, Italy, Spain, and so on; over 800,000 hectares were burned in 2018 alone [11]. Over 80% of the Australian population was affected by wildfires and more than 1 million animals were killed as a result of the fires in Australia between 2019 and 2020 [12,13]. Over the past decade, wildfires consumed 2.3% of the world’s land area each year, with direct losses amounting to hundreds of millions of dollars [14,15,16]. Wildfires have a significant impact on lives, property, and ecosystems [17].
Owing to climate change and other factors, the risk of wildfires to humans and the environment is increasing [16,18]. Extreme heat, e.g., severe and long-lasting heatwaves and droughts [19,20], can lead to more frequent wildfires [21,22,23] and can lengthen the global wildfire weather season [24]. Some vegetation that does not normally burn becomes dry and flammable [25,26], like tropical rainforests [27], permafrost [28,29], and peat bogs [30]. Recent reports indicate that the areas where wildfires are occurring are shifting [31,32]. The risk of fires is increasing in some of the less fire-prone regions, such as Europe, Poland, and Slovakia [33,34,35]. Significant greenhouse gas emissions and forest loss from wildfires could further accelerate climate change, with more people and animals suffering the impacts [36,37,38]. As a result, scientific analysis of wildfire risk and forecast of fire probability is critical for wildfire prevention, fighting, and management.
Wildfire prediction has been conducted using physical, statistical, and machine learning models [39]. Since the building of physical models is mostly dependent on fuel ignition mechanisms, which are more expensive and have a specific application scenario, statistical models and machine learning models are primarily employed for wildfire prediction in large-scale scenarios [40]. Statistical models (e.g., Logistic models, LR) and machine learning models (e.g., Random Forest Model, RF) are often widely used models in wildfire prediction [41,42,43,44]. The processes for predicting wildfires through LR and RF models are mostly the same; both are processed by dichotomizing historical fire data, selecting the driving factors whose influence is significant, and lastly constructing the model. The LR model is frequently employed in wildfire prediction owing to its ease of use, high forecast accuracy, and quality of fitting [45]. The LR model can indicate the linkage between wildfire occurrence and driving factors, but it is constrained by normality and linear requirements, which preclude the direct selection of acceptable variables. The RF model, on the other hand, is a nonparametric prediction approach that selects important variables automatically and is not subject to overfitting [46,47,48]. However, the RF model cannot calculate regression coefficients and is not highly explanatory for the relationship between drivers and the occurrence of wildfire. Therefore, it is necessary to combine these methods together to predict the fire risk probability.
Sichuan Province, China’s biggest forestry province, protects numerous rare and ancient species of plants and animals and acts as a key biological gene pool in China and around the world [49]. However, due to its abundant forest resources, high load of fuel, complex topography, and seasonal drought climate [50], Sichuan Province is a high-incidence location for wildfires and has long been an important region for forest management in China [51]. In recent years, research on wildfires in Sichuan Province has focused on the spatial and temporal distribution characteristics of wildfire [49], the impact of climate change on wildfire [51,52,53], the spatial distribution of fuels [54], and regional fire forecast [55,56]. The majority of the research examined the relationship between wildfires and meteorological elements on an annual scale, suggesting that meteorological factors have a significant impact on wildfires in Sichuan Province [57]. They neglected to consider the impact of monthly climatic conditions and human activities on the occurrence of wildfires in Sichuan Province. As a result, the risk of wildfire occurrence in Sichuan Province was analyzed in this study by using satellite-monitored fire sites in Sichuan Province from 2010 to 2019 and combining the driving factors that may affect the occurrence of wildfire, such as the current month’s meteorological factors, the previous month’s meteorological factors, the topography, the roads, and the population density, among others [45,58].
The purpose of this work is to analyze the spatial and temporal distribution of wildfires and determine which factors have a greater influence on the occurrence of fires while also evaluating the applicability of the LR model in mapping the probability of fire occurrence and providing suitable fire management opinions.

2. Materials and Methods
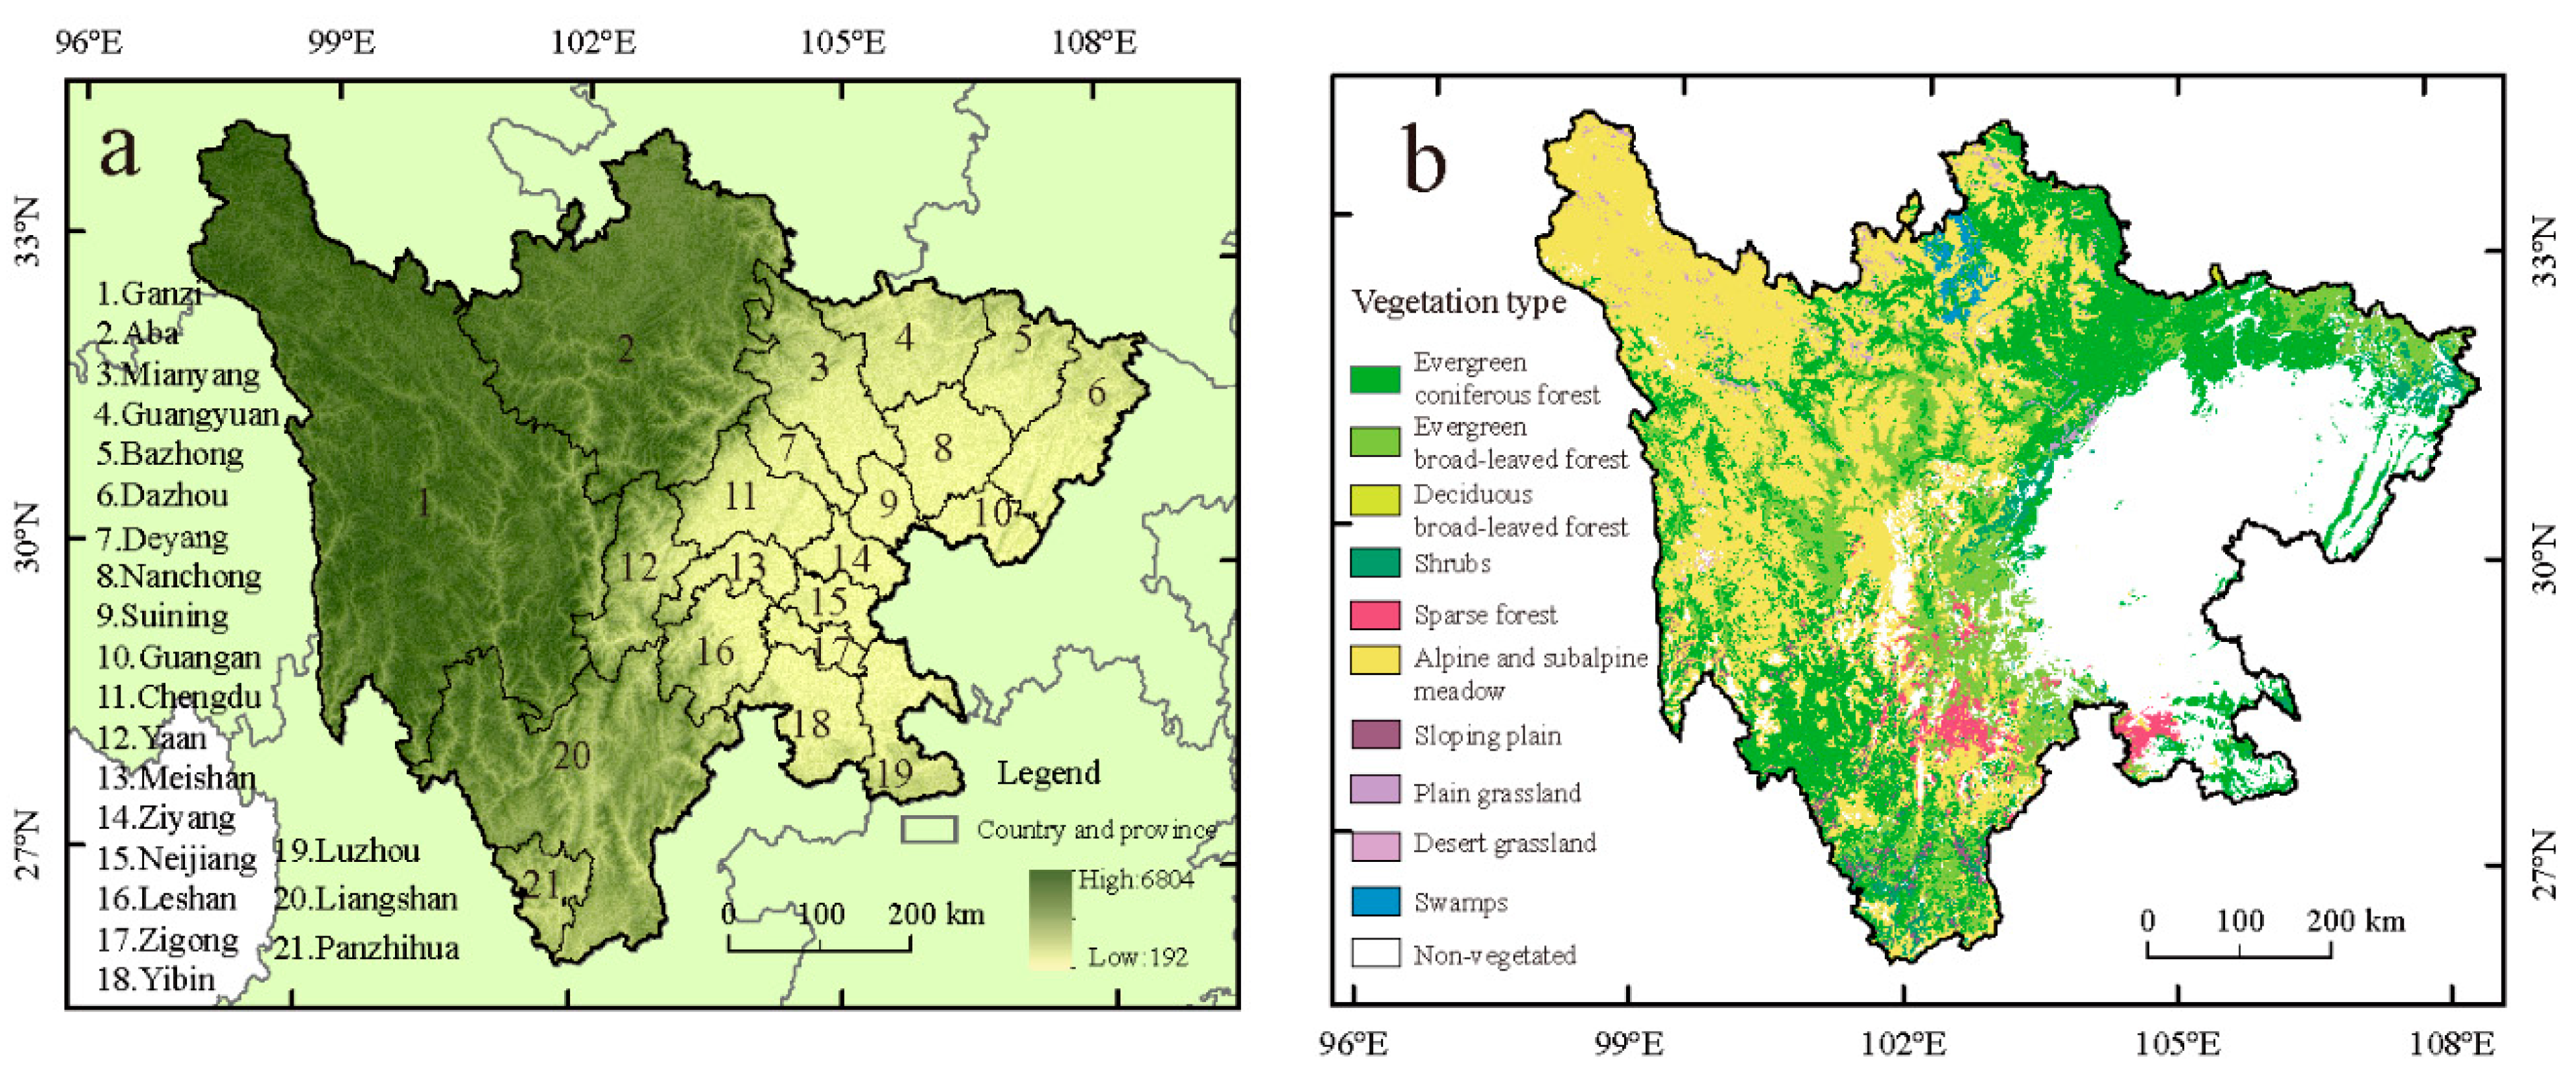
2.1. Study Region

Sichuan is located in the southwest of China (97°21′–108°33′ E, 26°03′ and 34°19′ N), with 21 municipal-level administrative districts (Figure 1a). It has an area of 485,000 km2 and a population of approximately 83.75 million [59]. Sichuan Province’s overall terrain is high in the east and low in the west, with evident three-dimensional distribution. The west is mainly composed of highland with elevations above 4000 m, while the east is mainly composed of basins and hills with elevations between 1000 and 3000 m [53].
Due to the large difference in geographical altitude and geomorphology, the zonal and vertical changes in the climate of Sichuan Province are very significant, with the monsoon humid zone in the east and the Tibetan Plateau zone in the west [53]. And Sichuan Province has a higher forest area (1926.37 × 104 ha). The total volume of living wood is around 20.2 billion m3 [59]. The abundant forest resources, complex topographical circumstances, and distinctive climates are all factors that contribute to the frequent occurrence of wildfire.

2.2. Data and Preprocessing

2.2.1. Wildfire Spot Data Sources and Processing

The fire spot data were gathered from the National Meteorological Satellite Center of China Meteorological Administration’s FY-3 satellite VIRR fire spot data (http://nsmc.org.cn/nsmc/cn/home/index.html, accessed on 15 September 2023). The VIRR (Visible and infrared radiometer) fire spot data is the second-level product generated after scanning by the VIRR detector on the FY-3 satellite [60]. VIRR fire spot data provides a temporal resolution of 1 day and a spatial resolution of 1 km. The VIRR fire spot data format is HDF5, which enables for direct extraction of information on daily monitored fires, such as the time of observation, latitude and longitude, and the fire spot data’s confidence level. The confidence level is assigned four values: 200, 100, 50, and 20, where 200 indicates the fire spot data, 100 indicates the cloud area fire spot data, 50 indicates the likely fire spot data, and 20 indicates a possible noise source [61]. In this study, we use Python 3.8 software to download, batch extract, and process the VIRR hotspots of Sichuan Province from 2010 to 2019. As the satellite-collected ignition data is partially unreliable, we only keep the data with a confidence level of 200 as the ignition point to ensure data accuracy. Then, based on vegetation-type data (Figure 1b) (The data for the digital vegetation map of China came from the Center for Resource and Environmental Science and Data (https://www.resdc.cn/, accessed on 15 September 2023), only fire spot data in forest land were extracted, yielding a total of 6168 fire spots.
The binomial logistic regression model requires binary target variables. In order to meet this requirement, non-fire spot data (1.5 times the number of fire spot data) and fire spot data must be generated at random and combined to make sampling plot data [43,46]. The steps for creating non-fire spot data are as follows [46,62]: (1) Create a 1 km buffer centered on the fire spot data. (2) Use ArcGIS’s Create Random Point tool to generate 1.5 times the number of fire spot data points (9252) in the woodland beyond the fire buffer zone. (3) Use Excel to randomly assign time to non-fire spot data as the fundamental data for building a wildfire occurrence prediction model. This step ensures that the non-fire spot data is bi-randomized in both time and space when it is created. Finally, we obtain the basic sample dataset M, which contains 6168 fire spot data points and 9252 non-fire spot data points for a total of 15,420 data points.

2.2.2. Meteorological Data

Meteorological data were obtained from the National Tibetan Plateau Science Data Center (https://data.tpdc.ac.cn/home, accessed on 15 September 2023). The dataset was generated by downscaling the CRU 0.5° global climate dataset and the WorldClim global high-resolution climate dataset using the Delta spatial downscaling method. The dataset was evaluated by 496 national weather stations across China, and the validation results are reliable [63,64,65,66,67,68]. In this study, we downloaded the monthly mean temperature and monthly precipitation of Sichuan Province during 2010–2019 with a spatial resolution of 0.0083333° (about 1 km).

2.2.3. NDVI Data and Vegetation Type

The NDVI data used in the study were taken from the MOD13A2 (16-day synthetic product dataset) with a spatial resolution of 1 km (https://www.gscloud.cn/home#page1/2, accessed on 15 September 2023). We use the GEE platform to synthesize month-by-month averaged NDVI imagery from 2010 to 2019 [69,70], and a total of 120 images were collected.
The data for the digital vegetation map of China (1 km resolution) came from the Center for Resource and Environmental Science and Data (https://www.resdc.cn/, accessed on 15 September 2023). We categorized the vegetation types in Sichuan Province into 11 categories using ArcGIS, and only the forest type was preserved [71]. Forest types include evergreen coniferous forest, evergreen broadleaved forest, deciduous broadleaved forest, shrubs, sparse forest, alpine and subalpine meadow, sloping plain, plain grassland, desert grassland, swamps, and non-vegetated (Figure 1b). Both the data on fire spot data and the data on non-fire spot data were extracted from the forest types.

2.2.4. Topography, Road Network and Population

GDEMV2 digital elevation model (DEM) at a resolution of 30 m (Figure 1b) downloaded from Geospatial Data Cloud (https://www.gscloud.cn/, accessed on 15 September 2023). The Slope and Slope Direction tool in ArcGIS extracted slope and slope direction from the ELE, and the values were extracted and allocated to the base dataset using ArcGIS 10.8 software.
The road network data was downloaded from Open Street Map (https://www.openstreetmap.org/directions, accessed on 15 September 2023). Roads, railways, and waterways are all included in the data. The kernel density analysis tool in ArcGIS was then used to generate kernel density values for roads, railways, and waterways, which were subsequently extracted to the sample dataset.
Population data from WorldPop (https://hub.worldpop.org/project/categories?id=3, accessed on 15 September 2023) with a temporal resolution of 1 year and a spatial resolution of 1 km. We used the GEE platform to download and process the population distribution map of Sichuan Province from 2010 to 2019. Table 1 has a full description of all influencing factors.

2.3. Analysis Methods

2.3.1. Factor Normalization Treatment

Due to the varied data resolutions and different data ranges, data normalization is needed before model establishment using these data. To eliminate these problems, this study applied the extreme difference normalization method [43]. The Equation (1) is shown below:
X i * = x i x m i n x m a x x m i n
where X i * and x i represent the values before and after data normalization, and   x m a x and x m i n   represent the maximum and minimum values in the base data, respectively.
However, Equation (1) cannot be used to standardize the data for slope. Equation (2) was utilized in this work to standardize the slope [43].
x α = sin α
where α is the slope and x α is the normalised value.
The slope direction was categorized in the way described in Table 2.

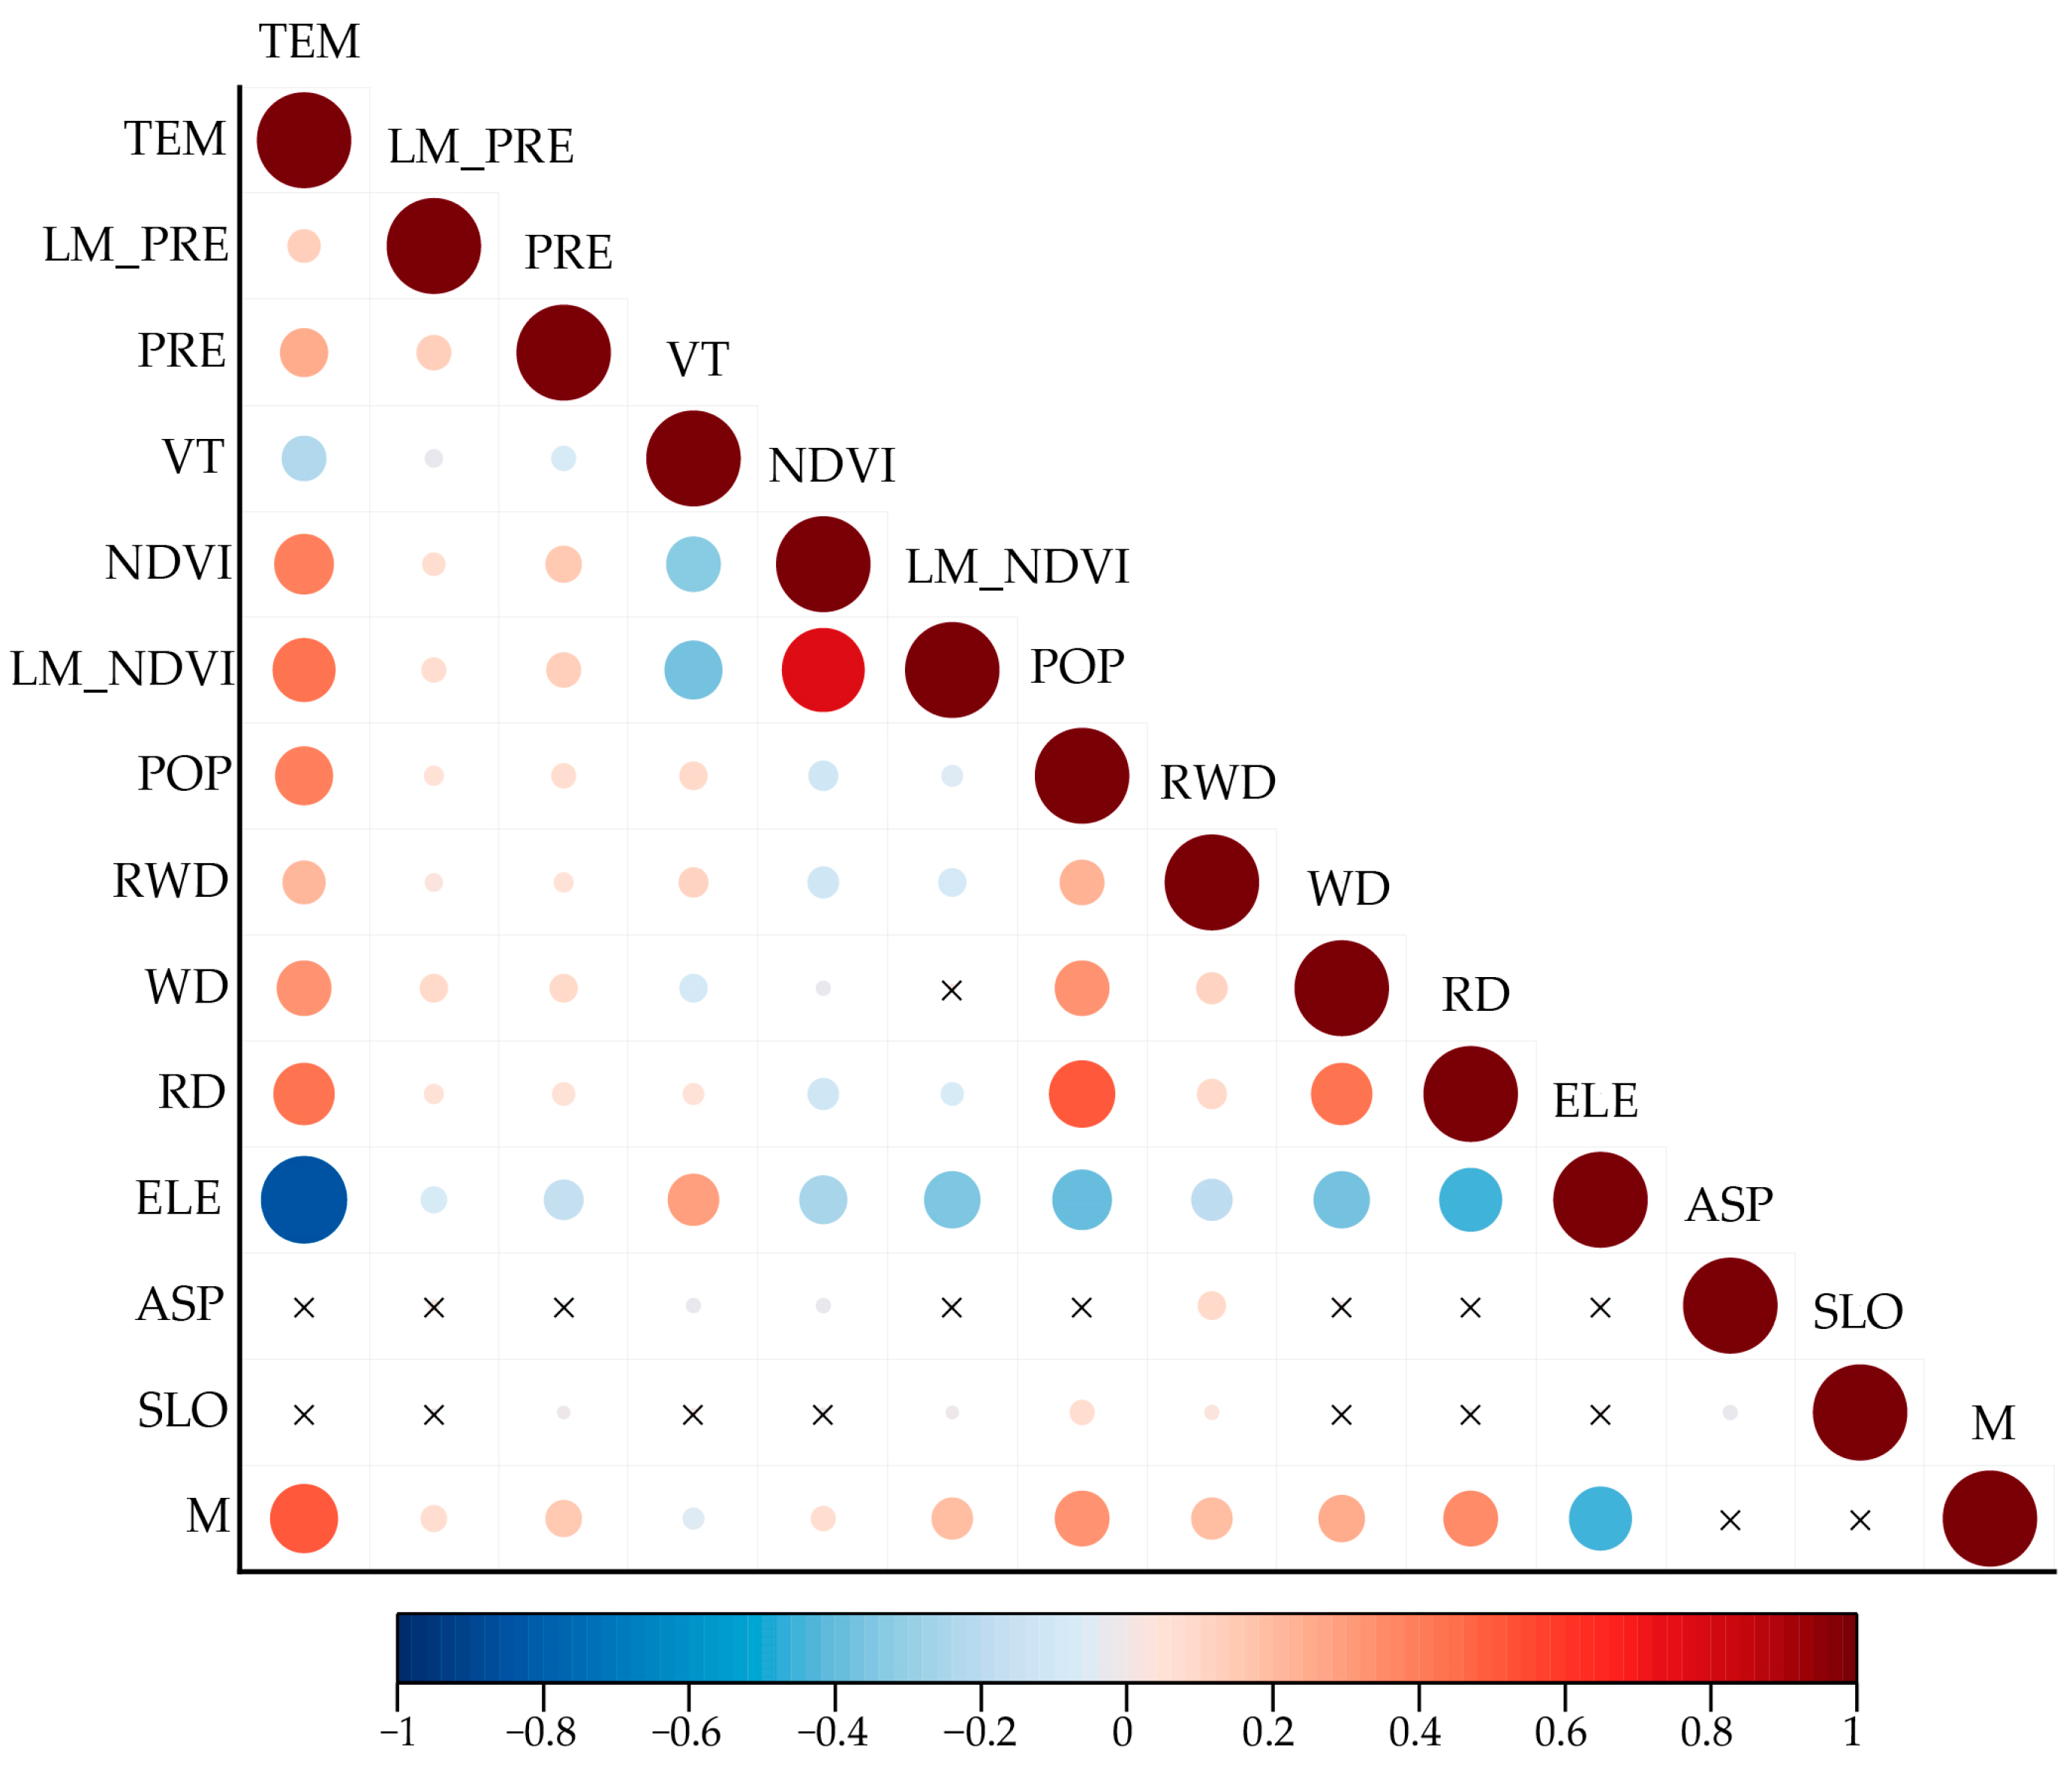
2.3.2. Multicollinearity Test of Model Input Variables

To increase model accuracy, independent variables with multicollinearity should be selected before establishing the model. A high degree of covariance between the independent variables can result in bigger biased results and lower model accuracy [43]. In this study, we use variance inflation factors (VIF) and tolerance (TOL) to test multicollinearity. The roles of VIF and TOL are opposite. The more the multicollinearity between the independent variables, the bigger the value of VIF; when VIF is greater than 5, there is no multicollinearity between the factors, and it is suitable for model creation [72].

2.3.3. Identification of Significant Variables

Since some non-significant factors may cause mistakes or uncertainties in model creation, selecting proper factors is critical for model establishment. Pearson Correlation analysis (PCA) and Random Forest (RF) importance ranking are used for selecting factors in this study. PCA is widely used for assessing the correlation between two variables and ranges from −1 to 1. When its absolute value is greater, it suggests a stronger correlation between two factors. RF is an integrated learning method with a decision tree-based learner that works well for classification and regression computations [43,73]. After RF fitting the data, the factors are ordered by the amount of their contribution to the data; the larger the IncMSE (increase in mean squared error) value, the stronger the factor’s influence on the data [73,74]. We use the R package “randomForest” to fit RF to the data and then calculate the importance value of each factor.
In this study, we first do PCA analysis on the factors that survived the VIF test to determine which factors were related to the basic sample data. The factors will then be sorted according to their RF importance, yielding factors with a large impact on the data being analyzed. These factors will eventually be considered in the development of the model.

2.3.4. Binary Logistic Regression Model

Binary logistic regression (LR) is a statistical model used to predict binary variables. It has been used by many scientists to predict the probability of wildfires [41,42,43]. This study also used the LR model to predict the probability of wildfire occurrence. When y = 1, there are wildfires, and when y = 0, there are no wildfires. By using the fire spot data values as the dependent variable and the factors that were ranked by the VIF test, PCA analysis, and RF importance in the preceding section as the independent variables, we created an LR model. If the likelihood of a wildfire (y = 1) is P, then the probability of no wildfire (y = 0) is 1 − P. The likelihood of a wildfire occurring is modeled in relation to each variable as follows.
P ( y = 1 ) = e b 0 + b i x i 1 + e b 0 + b i x i
Can be transformed to:
ln P 1 P = b 0 + b i x i
P(y = 1) is the likelihood of a wildfire, x i is the ith fire risk factor, b i is the fitted factor’s coefficient, reflecting the amount of contribution of the independent variable x i to the chance of fire P, and b 0 is a constant term.

2.3.5. Model Training and Validation

The receiver operating characteristic (ROC) curve is frequently used in evaluating a model’s accuracy. Area Under Curve (AUC) is the area contained by the coordinate axis under the ROC curve, and it is frequently utilized to quantify the model and reflect its accuracy. The AUC value is typically between 0.5 and 1, and the closer the number is to 1, the greater the model’s prediction effect. When the AUC value is greater than 0.8, the model has good predictive ability, and when the AUC value is greater than 0.9, the model has better predictive capacity [41]. Furthermore, the confusion matrix (Table 3) is frequently used to evaluate model predictions.
TP indicates the number of properly predicted fire spot data points, TN indicates the number of correctly predicted non-fire spot data points, FP indicates the number of wrongly predicted fire spot data points, and FN indicates the number of incorrectly predicted non-fire spot data points.
Adopt (5)–(7) calculation overall accuracy (OA), Recall, TS and other indicators.
OA = T P + T N T P + F P + T N + T P
Recall = T P T P + F N
T S = T P T P + F N + F P
where OA denotes the number of correctly categorized fire spot data divided by the total number of points. Recall (also known as true positive rate) is a measure of the number of correctly identified fire spot data points to the total number of fire spot data points. TS (Critical Success Index) is a measure of the overall performance of the classifier model, with 1 representing the perfect model score and each inaccurate prediction (FP or FN) lowering the value of TS [75].
The LR model was employed in this study to forecast the likelihood of wildfire. First, all obtained sample data M are randomly separated into a training set (70%) and an independent test set (30%) [76]. We repeatedly constructed five intermediate datasets, M1, M2, M3, M4, and M5, to reduce the impact of sample randomness division on the selection of model variables, and trained the five intermediate datasets on the same modeling using SPSS. Then the most suitable model M0 is chosen as the final prediction model based on the AUC, ACC, TS, and Sensitivity model evaluation indicators. Finally, based on the LR prediction findings, the inverse distance weighting method (IDW) is utilized to assess the spatial interpolation of wildfire probability in Sichuan Province and divide the wildfire risk level in Sichuan Province. Table 4 shows how the probability of a wildfire is separated into five tiers [43].

3. Results

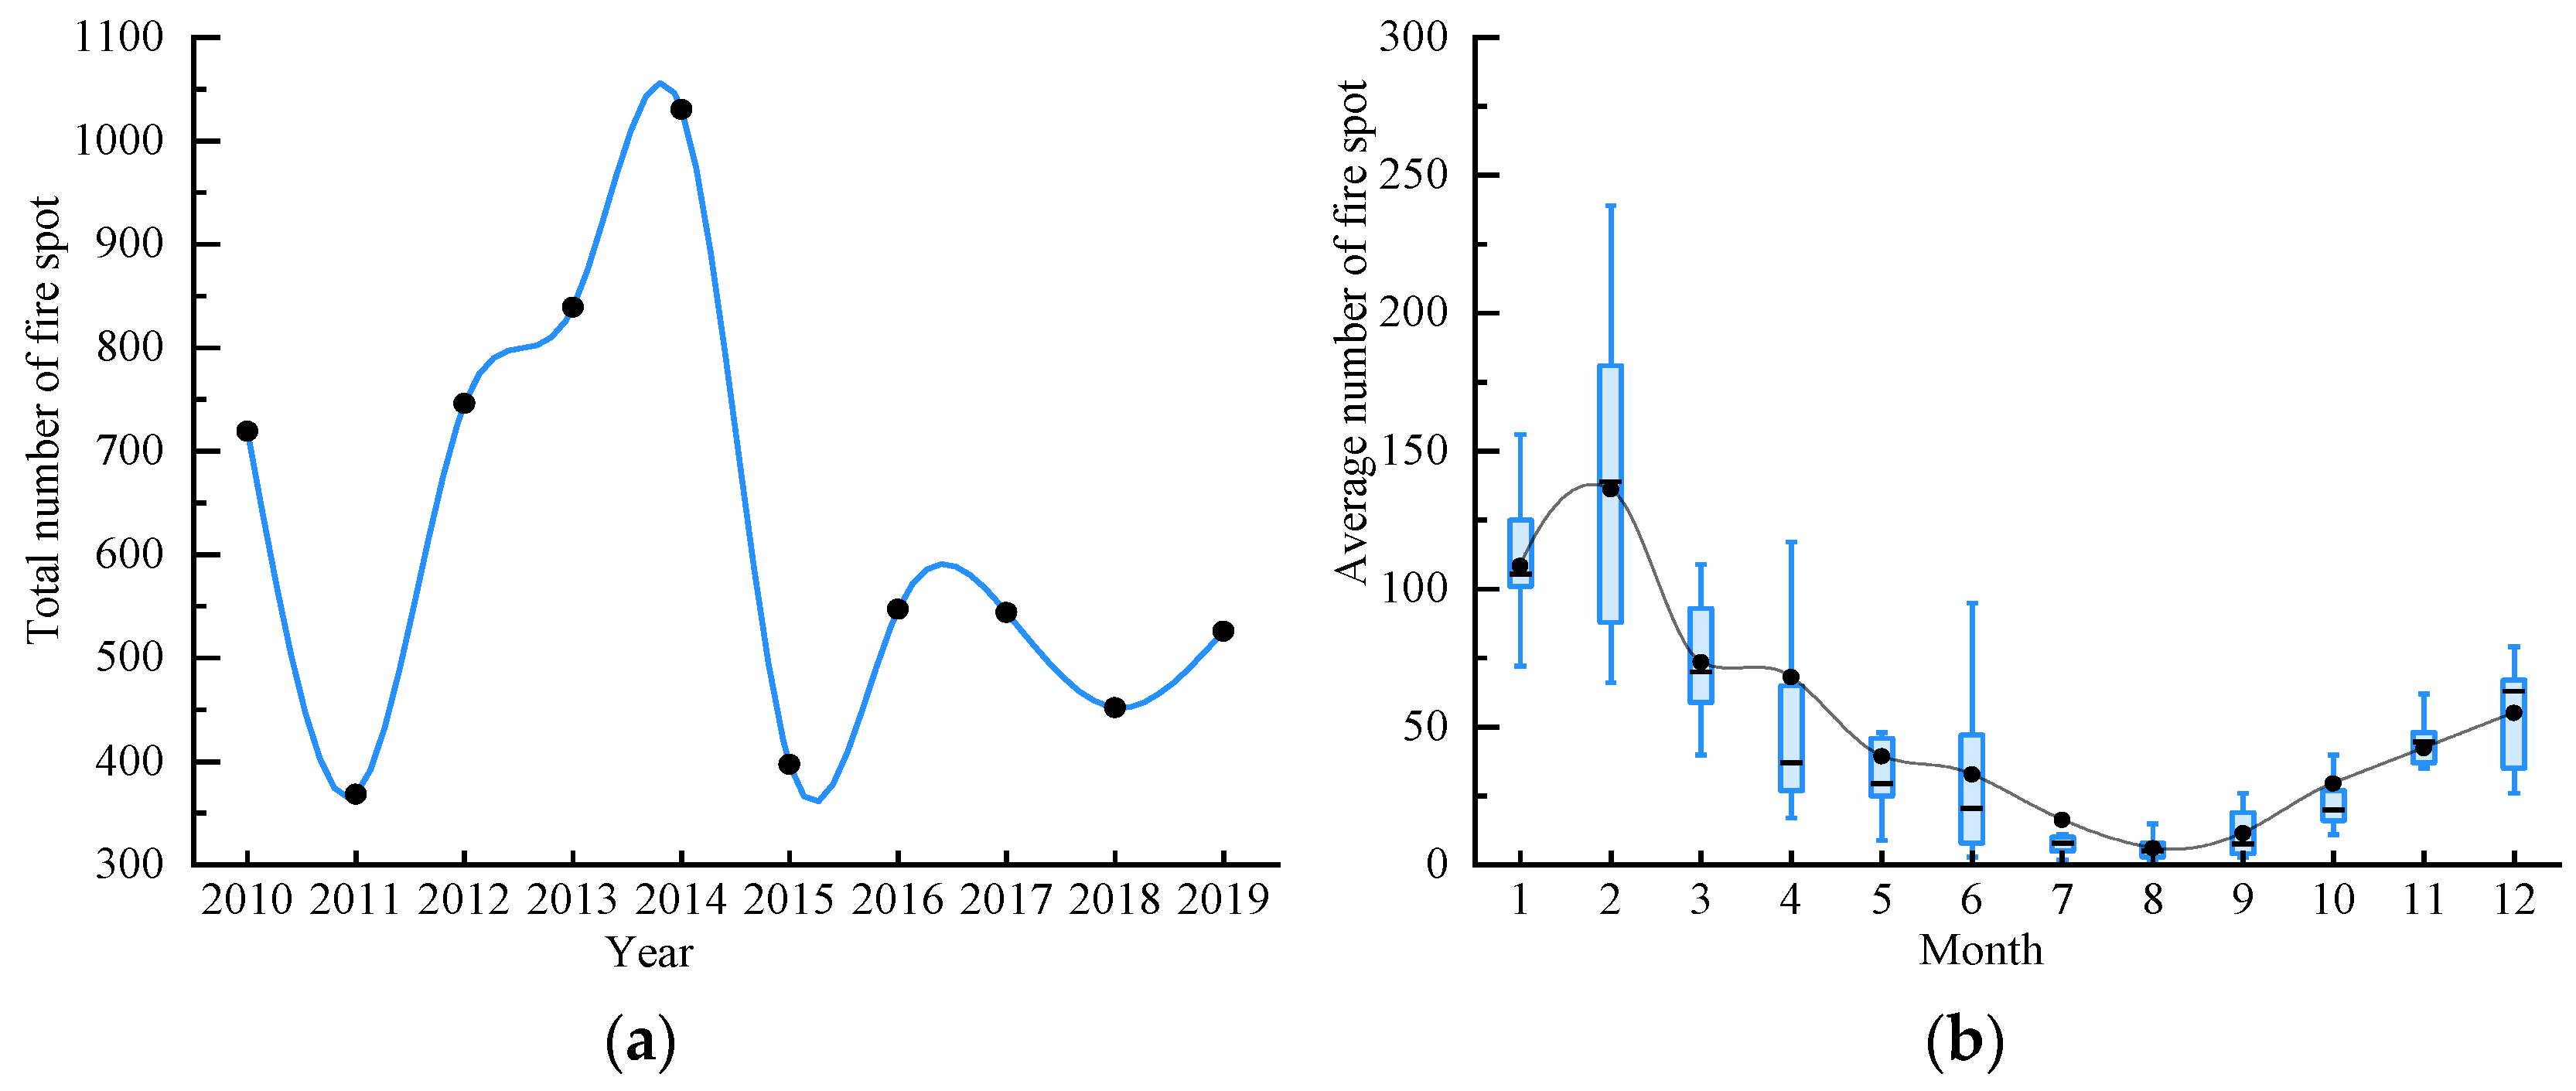
3.1. Temporal and Spatial Distribution Patterns of Fire Spots

This study collected a total of 6168 wildfire spots in Sichuan Province from 2010 to 2019 based on the VIRR fire spot data of the Fengyun-3 satellite. The number of wildfire spots in Sichuan Province fluctuated greatly among years and months. The total number of fire spots first increased, peaked in 2014, and then began to decline. The number of fire spots fluctuated more dramatically between 2010 and 2014, and from 2014 to 2019(Figure 2a). In total, 1030 fire spots were found in 2014, followed by 2013, 2012, and 2010. The years 2011, 2015, and 2017 had the fewest fire spots.
Wildfire spots displayed most frequently from December to the following June (Figure 2b). The month with the most wildfire spots was February, and the month with the fewest spots was August. The overall number of fires in February accounted for 22.05% of the total numbers, while January, March, and April accounted for 17.56%, 11.92%, and 11.02% of the total, respectively. August only accounted for 0.99% of the total, followed by July and September, which accounted for 2.38% and 1.85% of the total, respectively.
Wildfire spots were mostly located in the western and southern areas of Sichuan (Figure 3). Panzhihua City had the most wildfire spots, accounting for 42.74% of all fire spots. Liangshan City and Ganzi City had the second highest occurrence of fire spots, accounting for 37.92% and 14.19% of the total fire spots, respectively. Many cities, such as Nanchong City, Ziyang City, and Suining City, had no wildfire spots during 2010–2019.

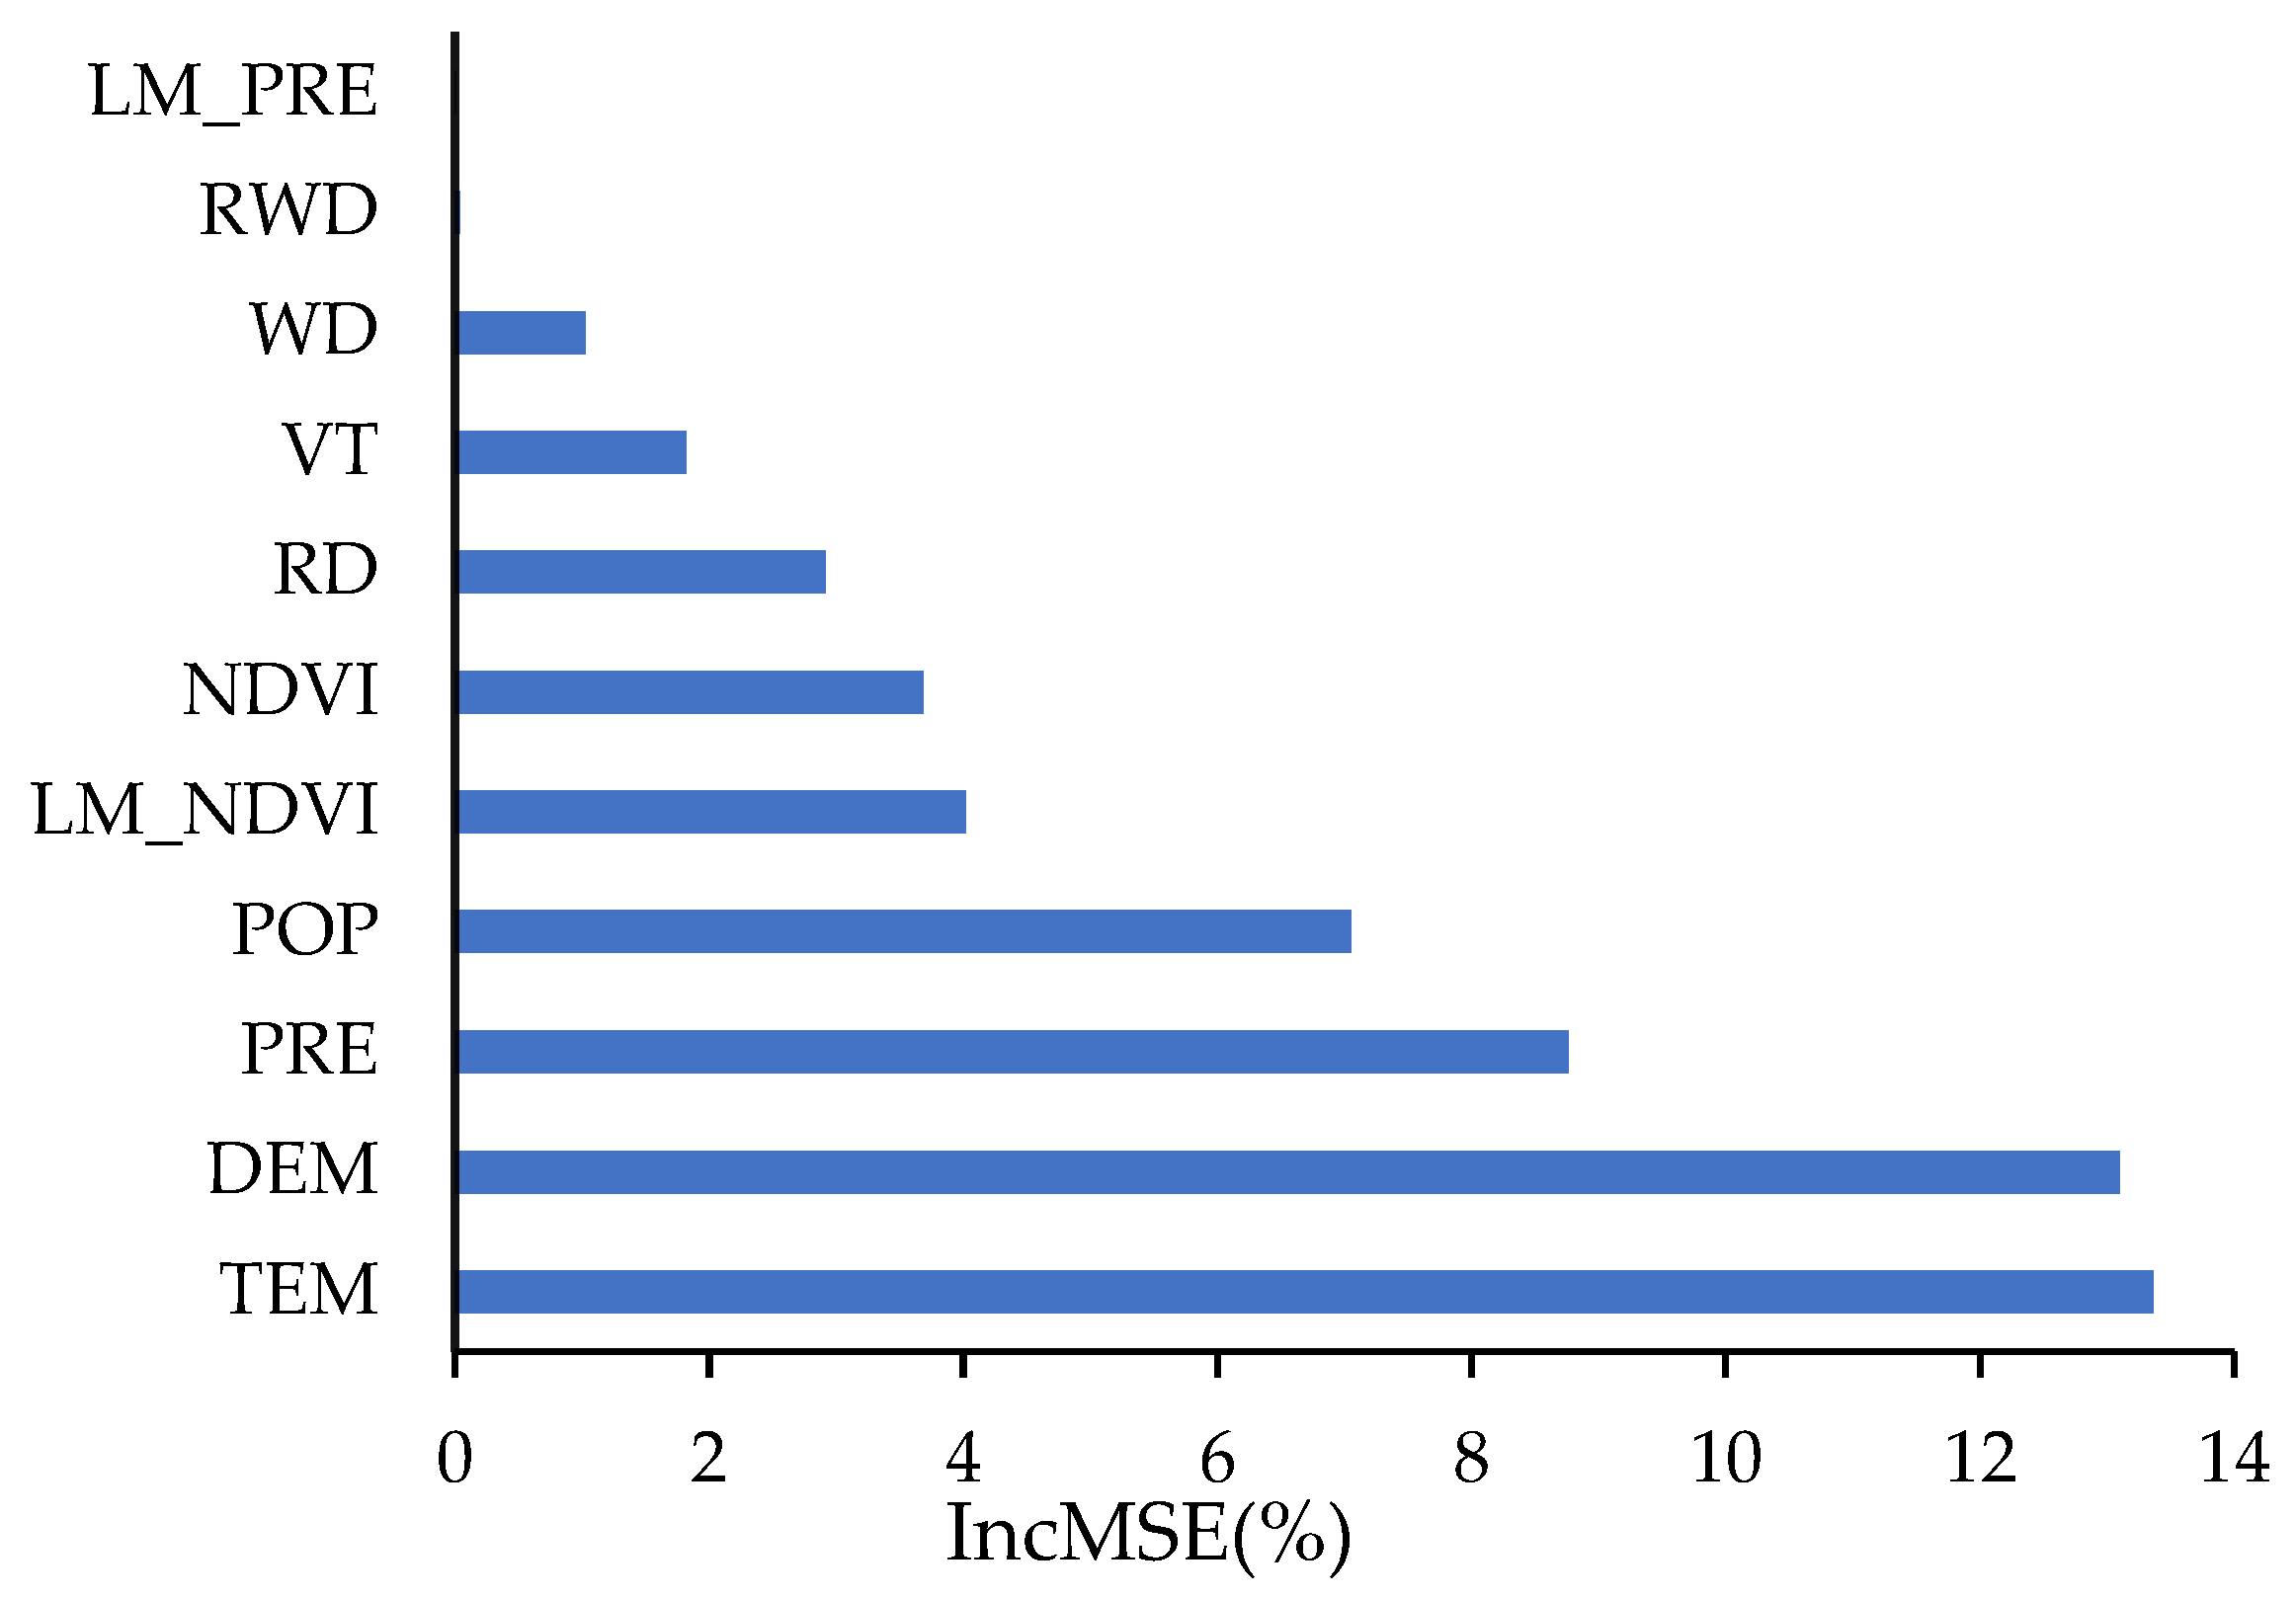
3.2. Major Contributing Factors Identification

VIF was applied to test the multicollinearity of all model input variables, and thus select the main factors. The VIF results for the 14 initial factors are shown in Table 5. The VIF values of LM_TEM and TEM were greater than 5, whereas the remaining factors had VIF values less than 5. Therefore, the LM_TEM is removed. After excluding the variable LM_TEM, we reran the RF model and the calculated VIF values based on remaining factors were less than 5, and no multicollinearity was found. Therefore, the remaining 13 variables were further used for correlation analysis.
Figure 4 illustrated the PCA correlations between the identified 13 variables at the wildfire spots. Based on the PCA, SLOPE and ASPECT had no correlations with the dependent variables and should be eliminated. Finally, 11 major influencing factors were identified, including TEM, LM_PRE, PRE, VT, NDVI, LM_NDVI, POP, RWD, WD, RD, ELE, and M.
The significance of each identified variable to fire spots was further determined using the RF algorithms. Figure 5 showed that TEM was the most important factor influencing wildfire spots, followed by ELE and PRE, POP, LM_NDVI, NDVI, RD, and NDVI. The importance values of WD, RWD, and LM_PRE were less than 0.02, suggesting that they have little effect on wildfire occurrence and were thus ignored in the model formulation.
Based on the results of the VIF test (Table 5), Pearson’s correlation analysis (Figure 4), and RF important ranking (Figure 5), a total of seven factors including TEM, ELE, PRE, POP, LM_NDVI, NDVI, and RD, were chosen as the input variables for the final model development.

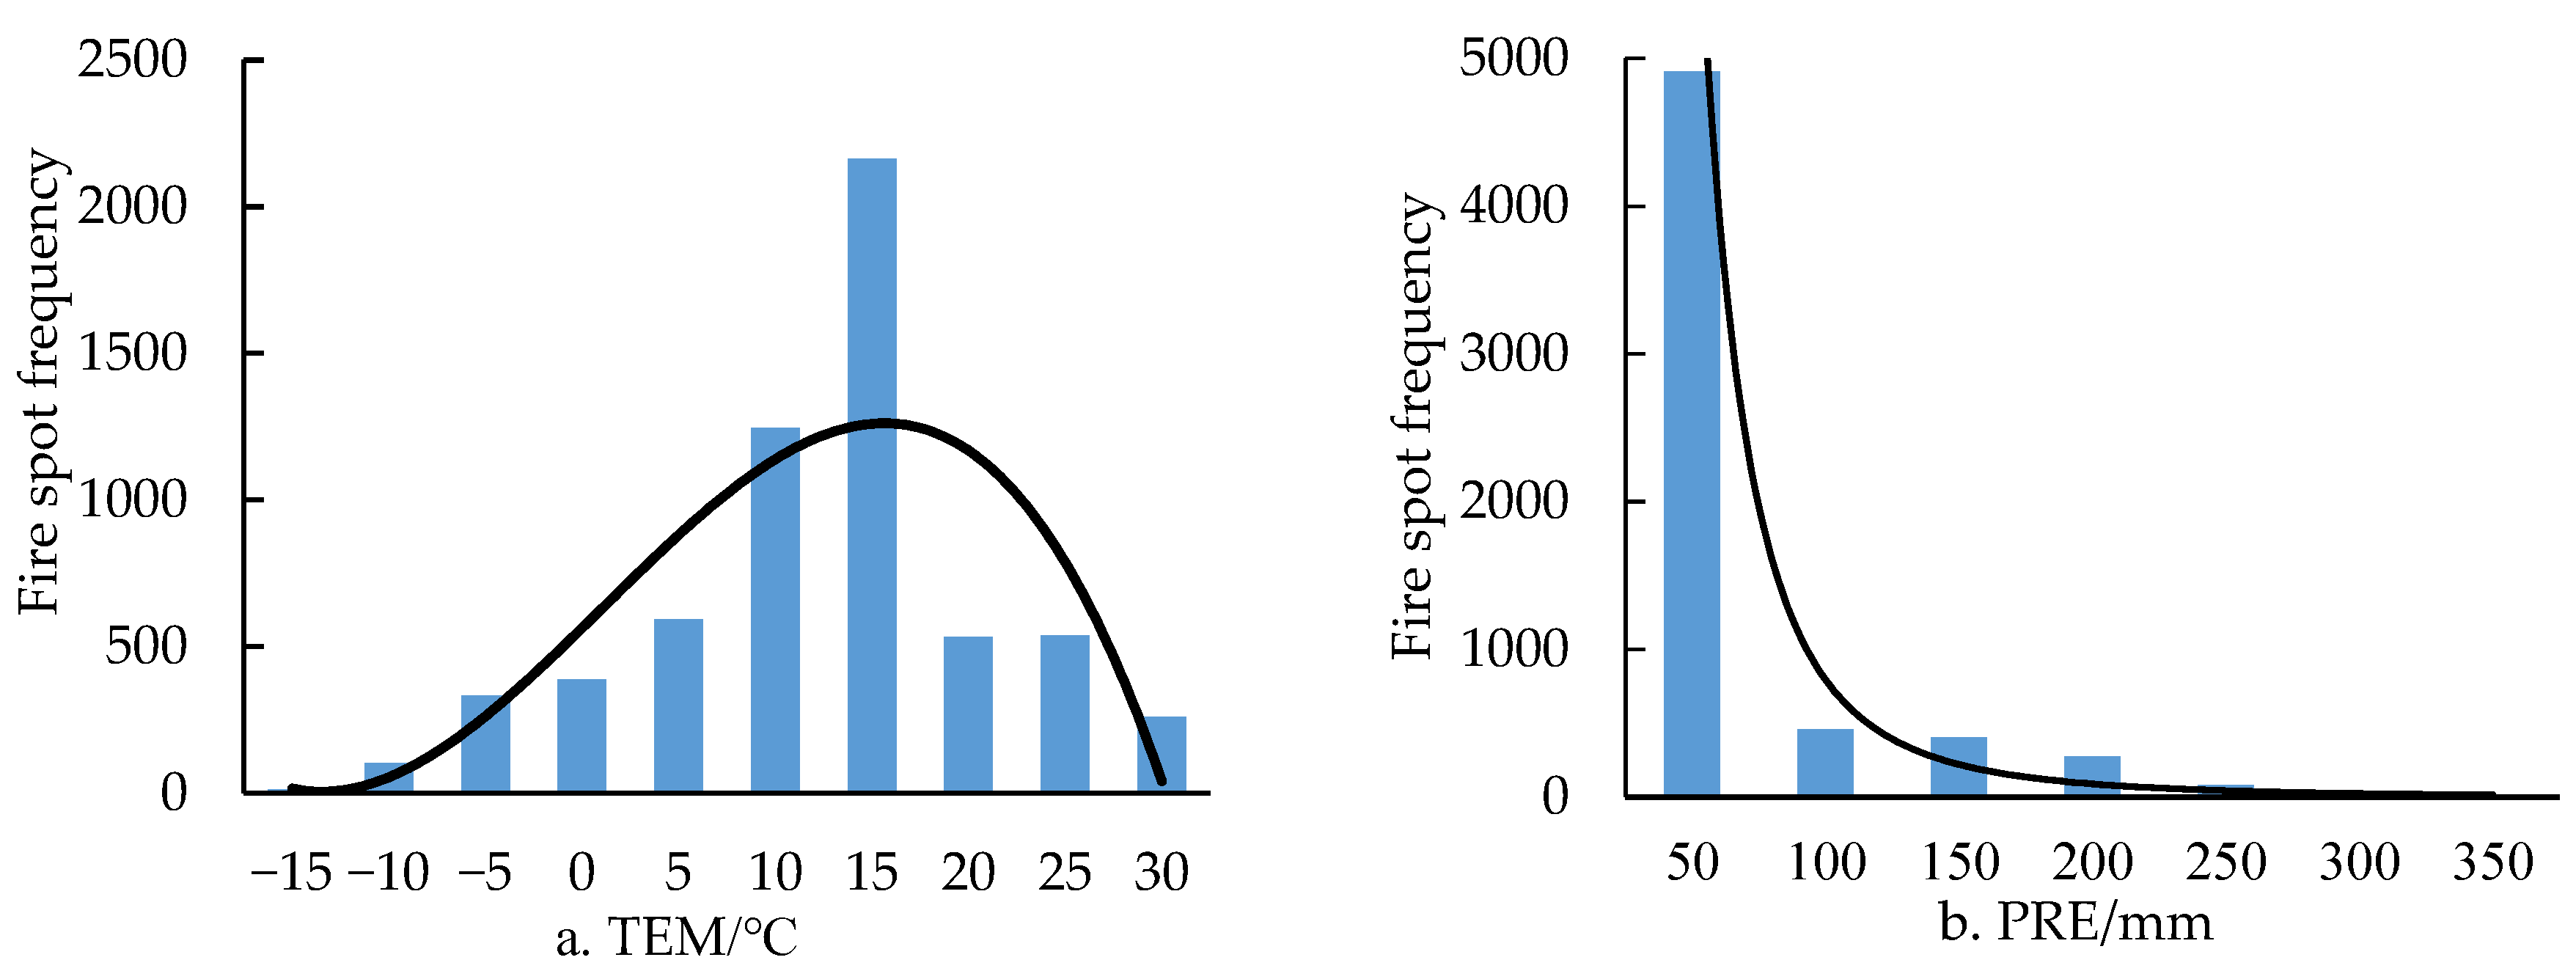
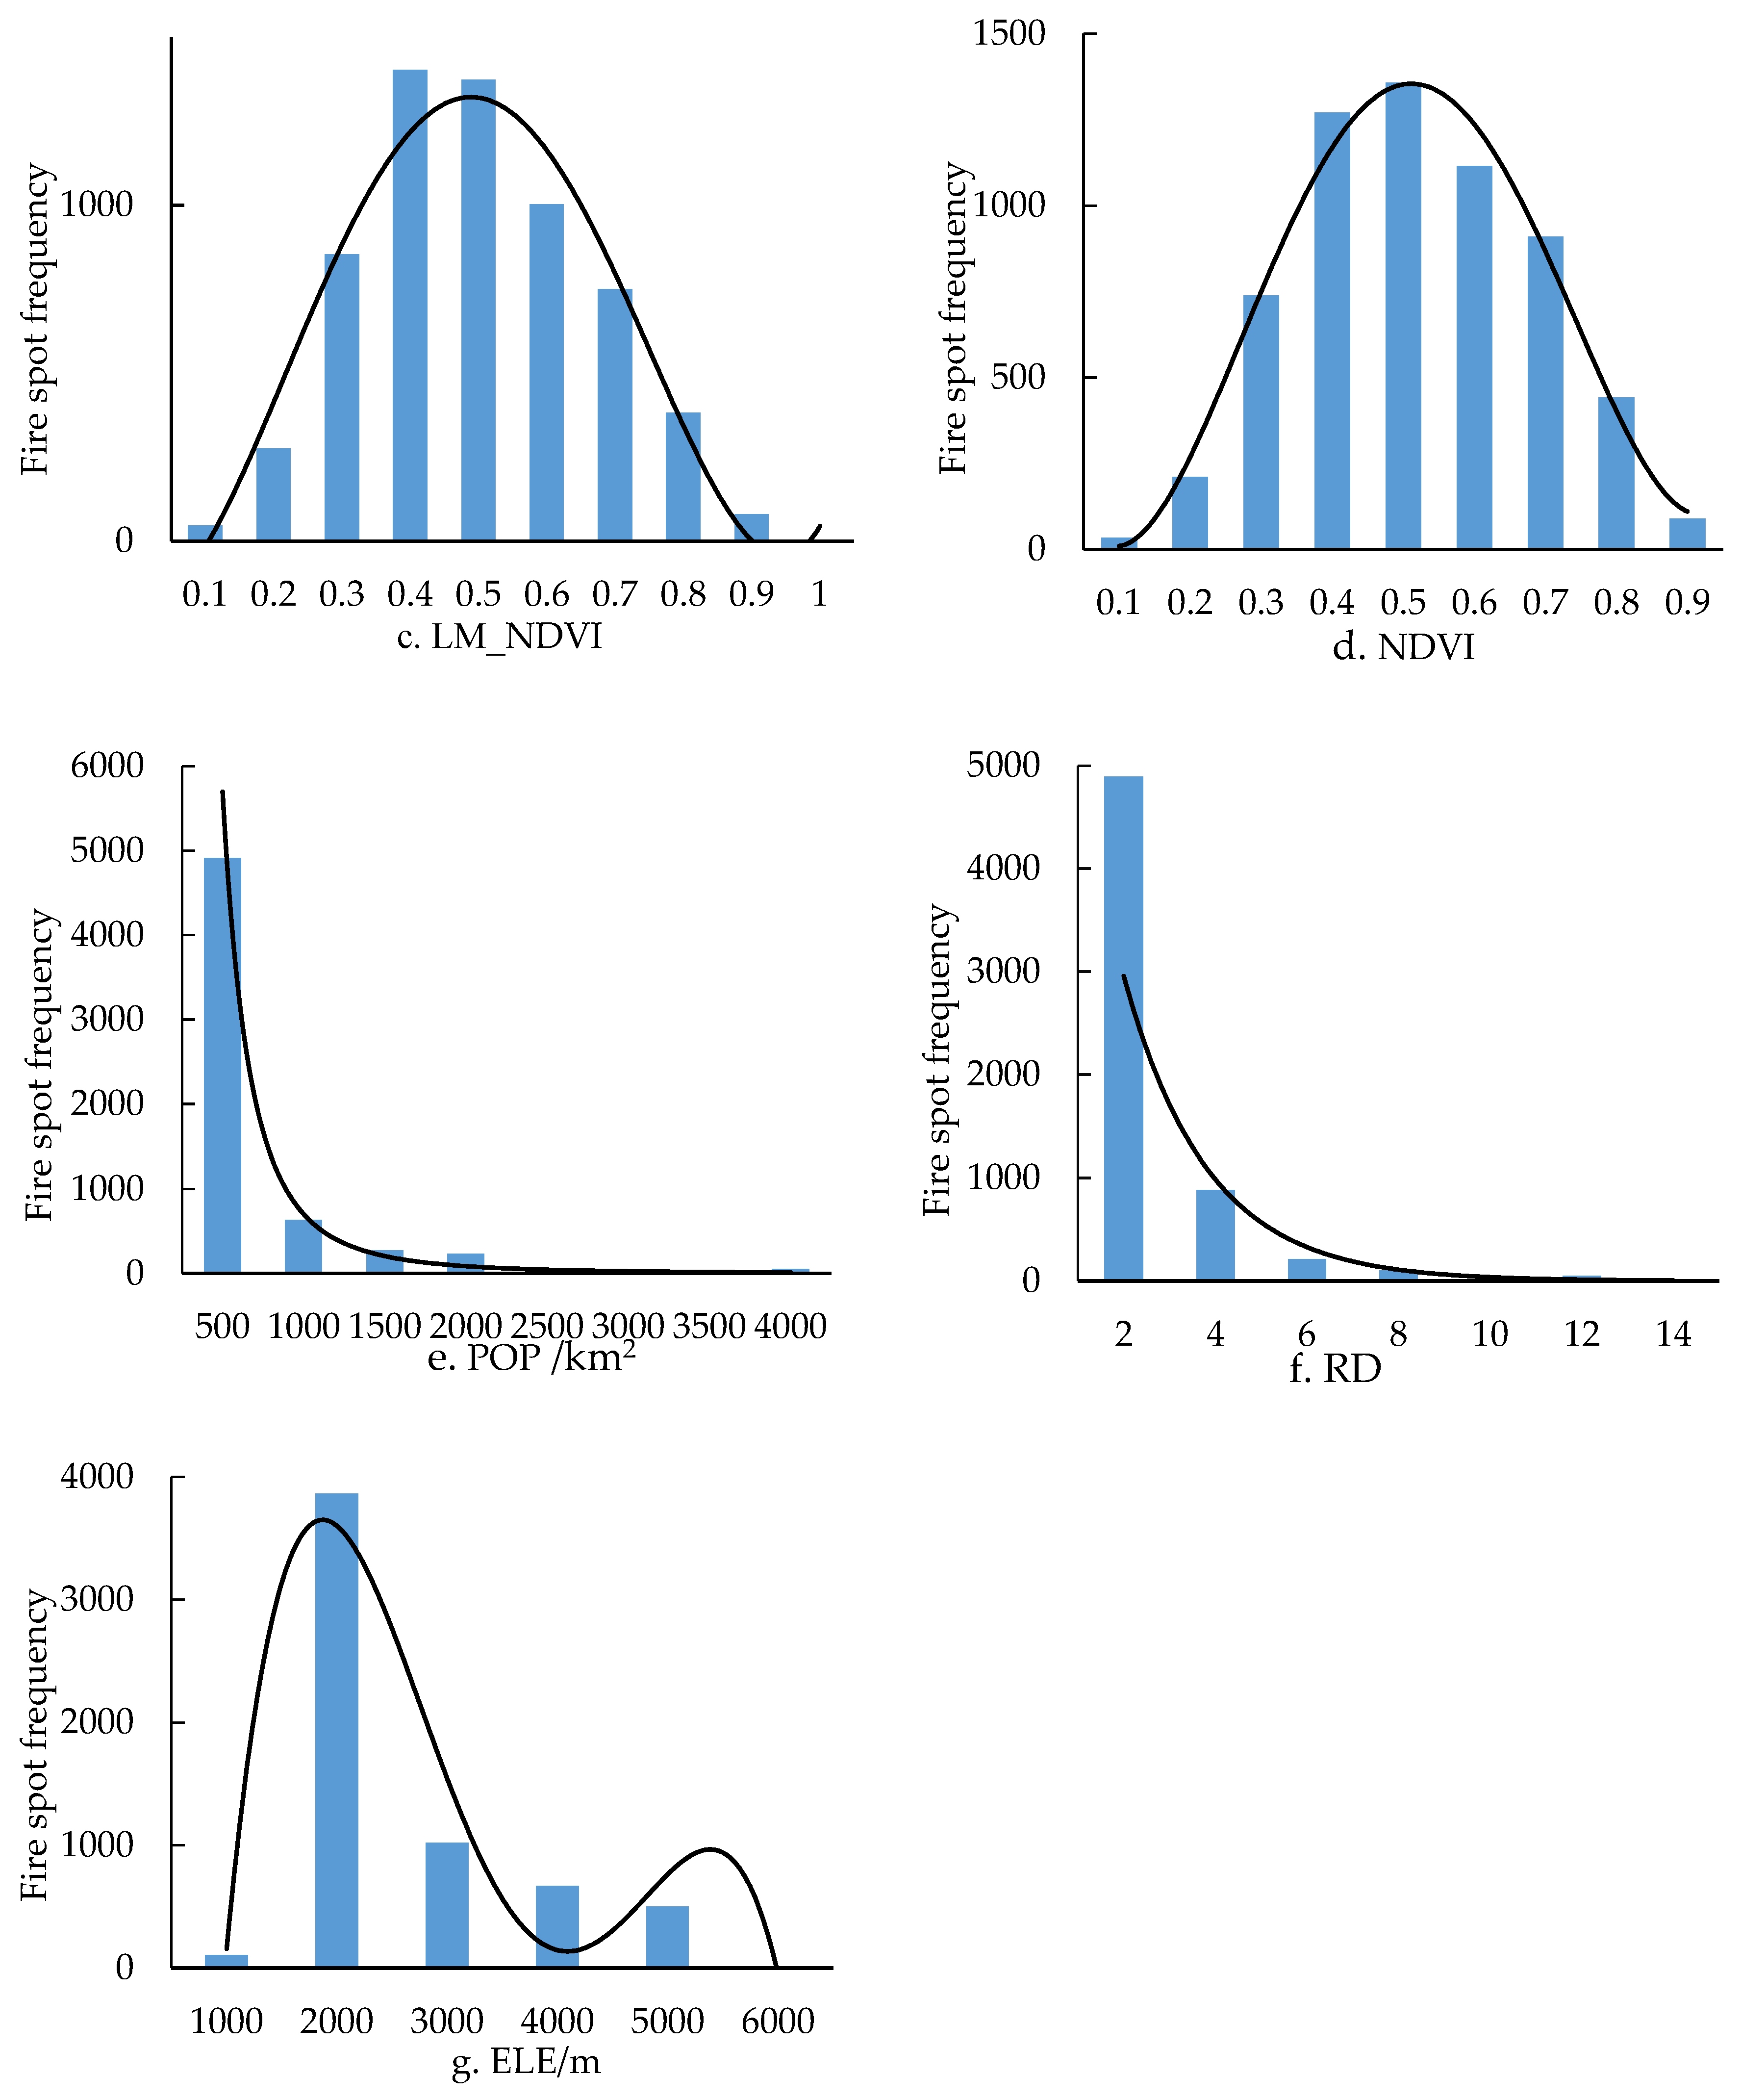
3.3. The Effects of Different Factors on Wildfire Occurrence

The relationships between the driving factors TEM, ELE, PRE, POP, LM_NDVI, NDVI, RD, and fire occurrence were shown in Figure 6. As shown in Figure 6a,b, most fire spots were mainly distributed between temperatures of 10 °C~15 °C and precipitation of 0~50 mm, which matches closely to the winter and spring climate in Sichuan. With rising temperature, the moisture of flammable materials drops, making fires more likely.
The NDVI and LM_NDVI values along with the most fire spots ranged between 0.4–0.6 (Figure 6c,d). NDVI is positively related to the forest coverage. Population density and road density also revealed a clear positive contribution with the frequency of fires, which gradually dropped as population density and road density increased (Figure 6e,f). Fire spots were primarily spread in areas with a population density of 500 people/km2 and a road density of 0 to 2. The fire spots were mostly distributed in suburban or rural areas, where the land is less populated, the forest coverage is higher, and the fire control is less feasible, resulting in higher fire occurrence in these areas. When the altitude is between 0 and 1000 m, the frequency of fires is lower (Figure 6g); when the altitude is between 1000 m and 2000 m, the frequency of fires increases; and once the altitude is greater than 2000 m, the frequency of fire spots falls steadily with altitude. As altitude increases, temperature reduces, and the moisture of ignited substances increases.

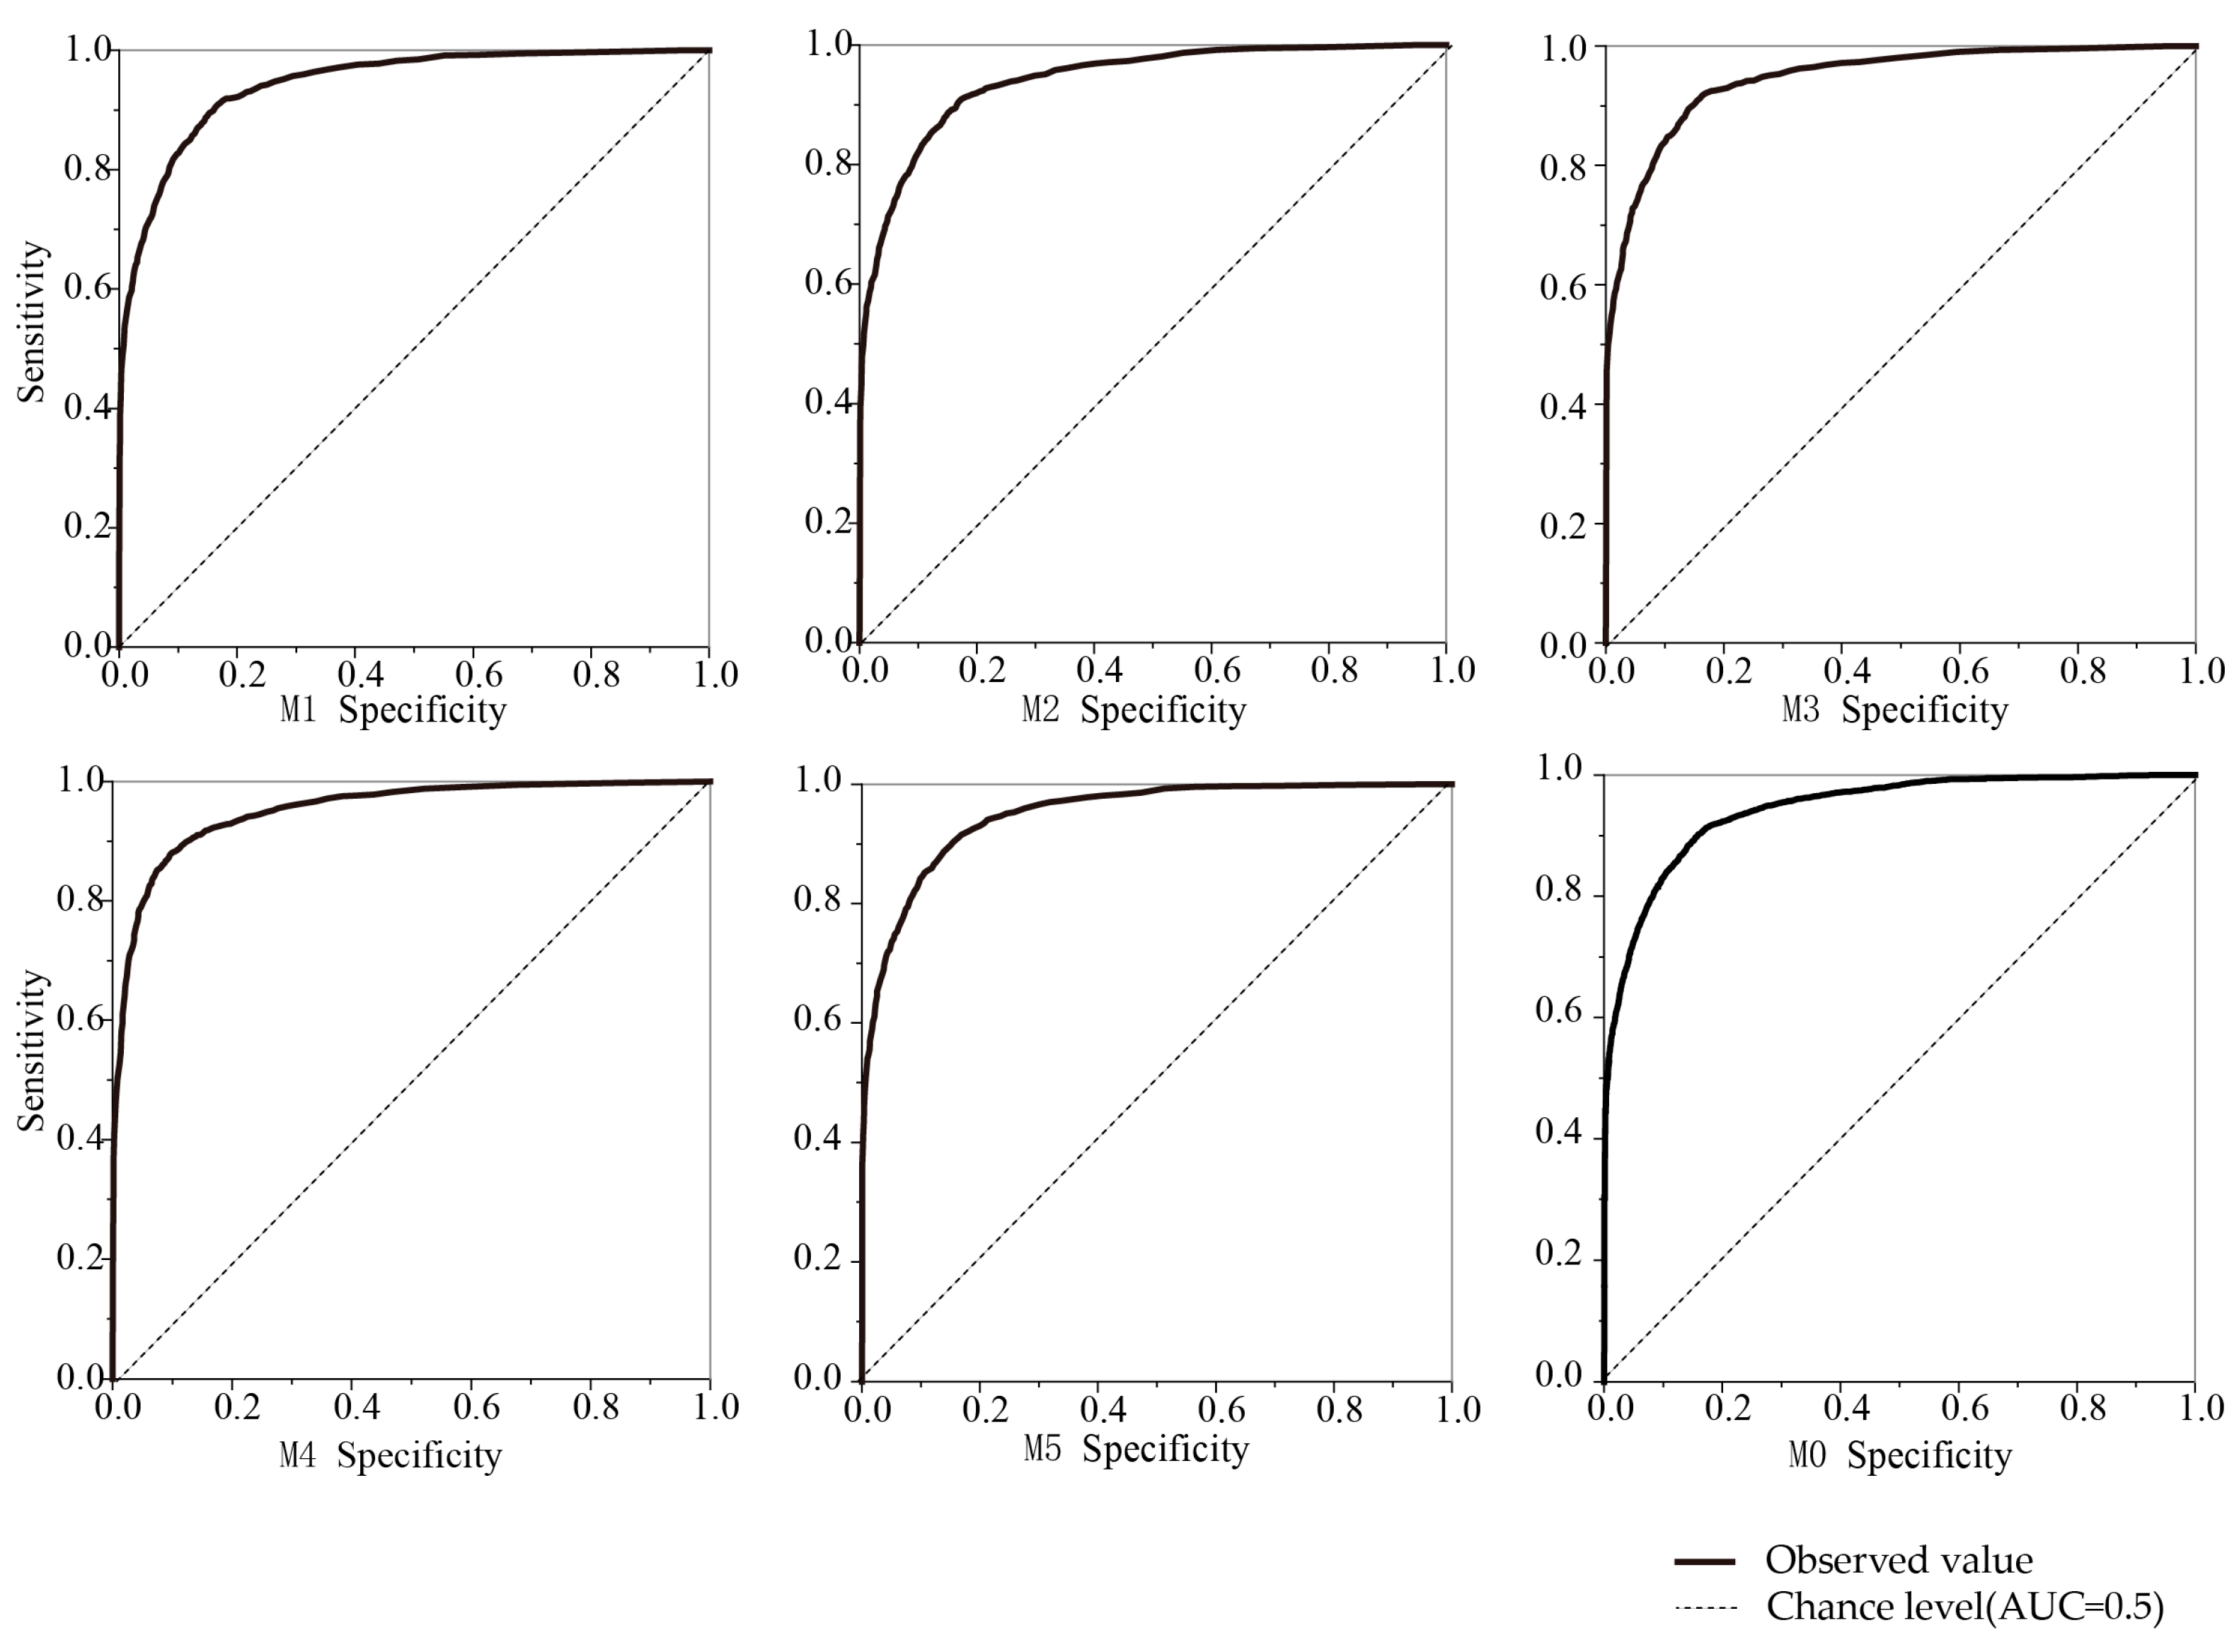
3.4. Model Prediction Accuracy

We put each of the five sample models collected into the LR danger model for fitting. The wildfire prediction model can be further applied to generate the corresponding specificity index and sensitivity index using ROC curve analysis, as illustrated in Figure 7. The model coefficients with the highest indicators among the five models (M1–M5) were selected as the coefficients of the final model M0.
The results showed that the AUC values of the five sample groups were high and close, and they were greater than 0.94 (Table 6). The prediction accuracy ranged from 87.25% to 89.36%, and the overall accuracy was 87.28%, indicating the high predictive capability of these models on wildfire probability in Sichuan Province.
The Logistic wildfire danger probability model is fitted based on the regression coefficients:
ln P 1 P = 21.186   TEM 0.953 PRE + 72.503 POPULATION 2.352 NDVI + 2.372   LM NDVI   + 9.975 DEM + 2.082 RD 16.15

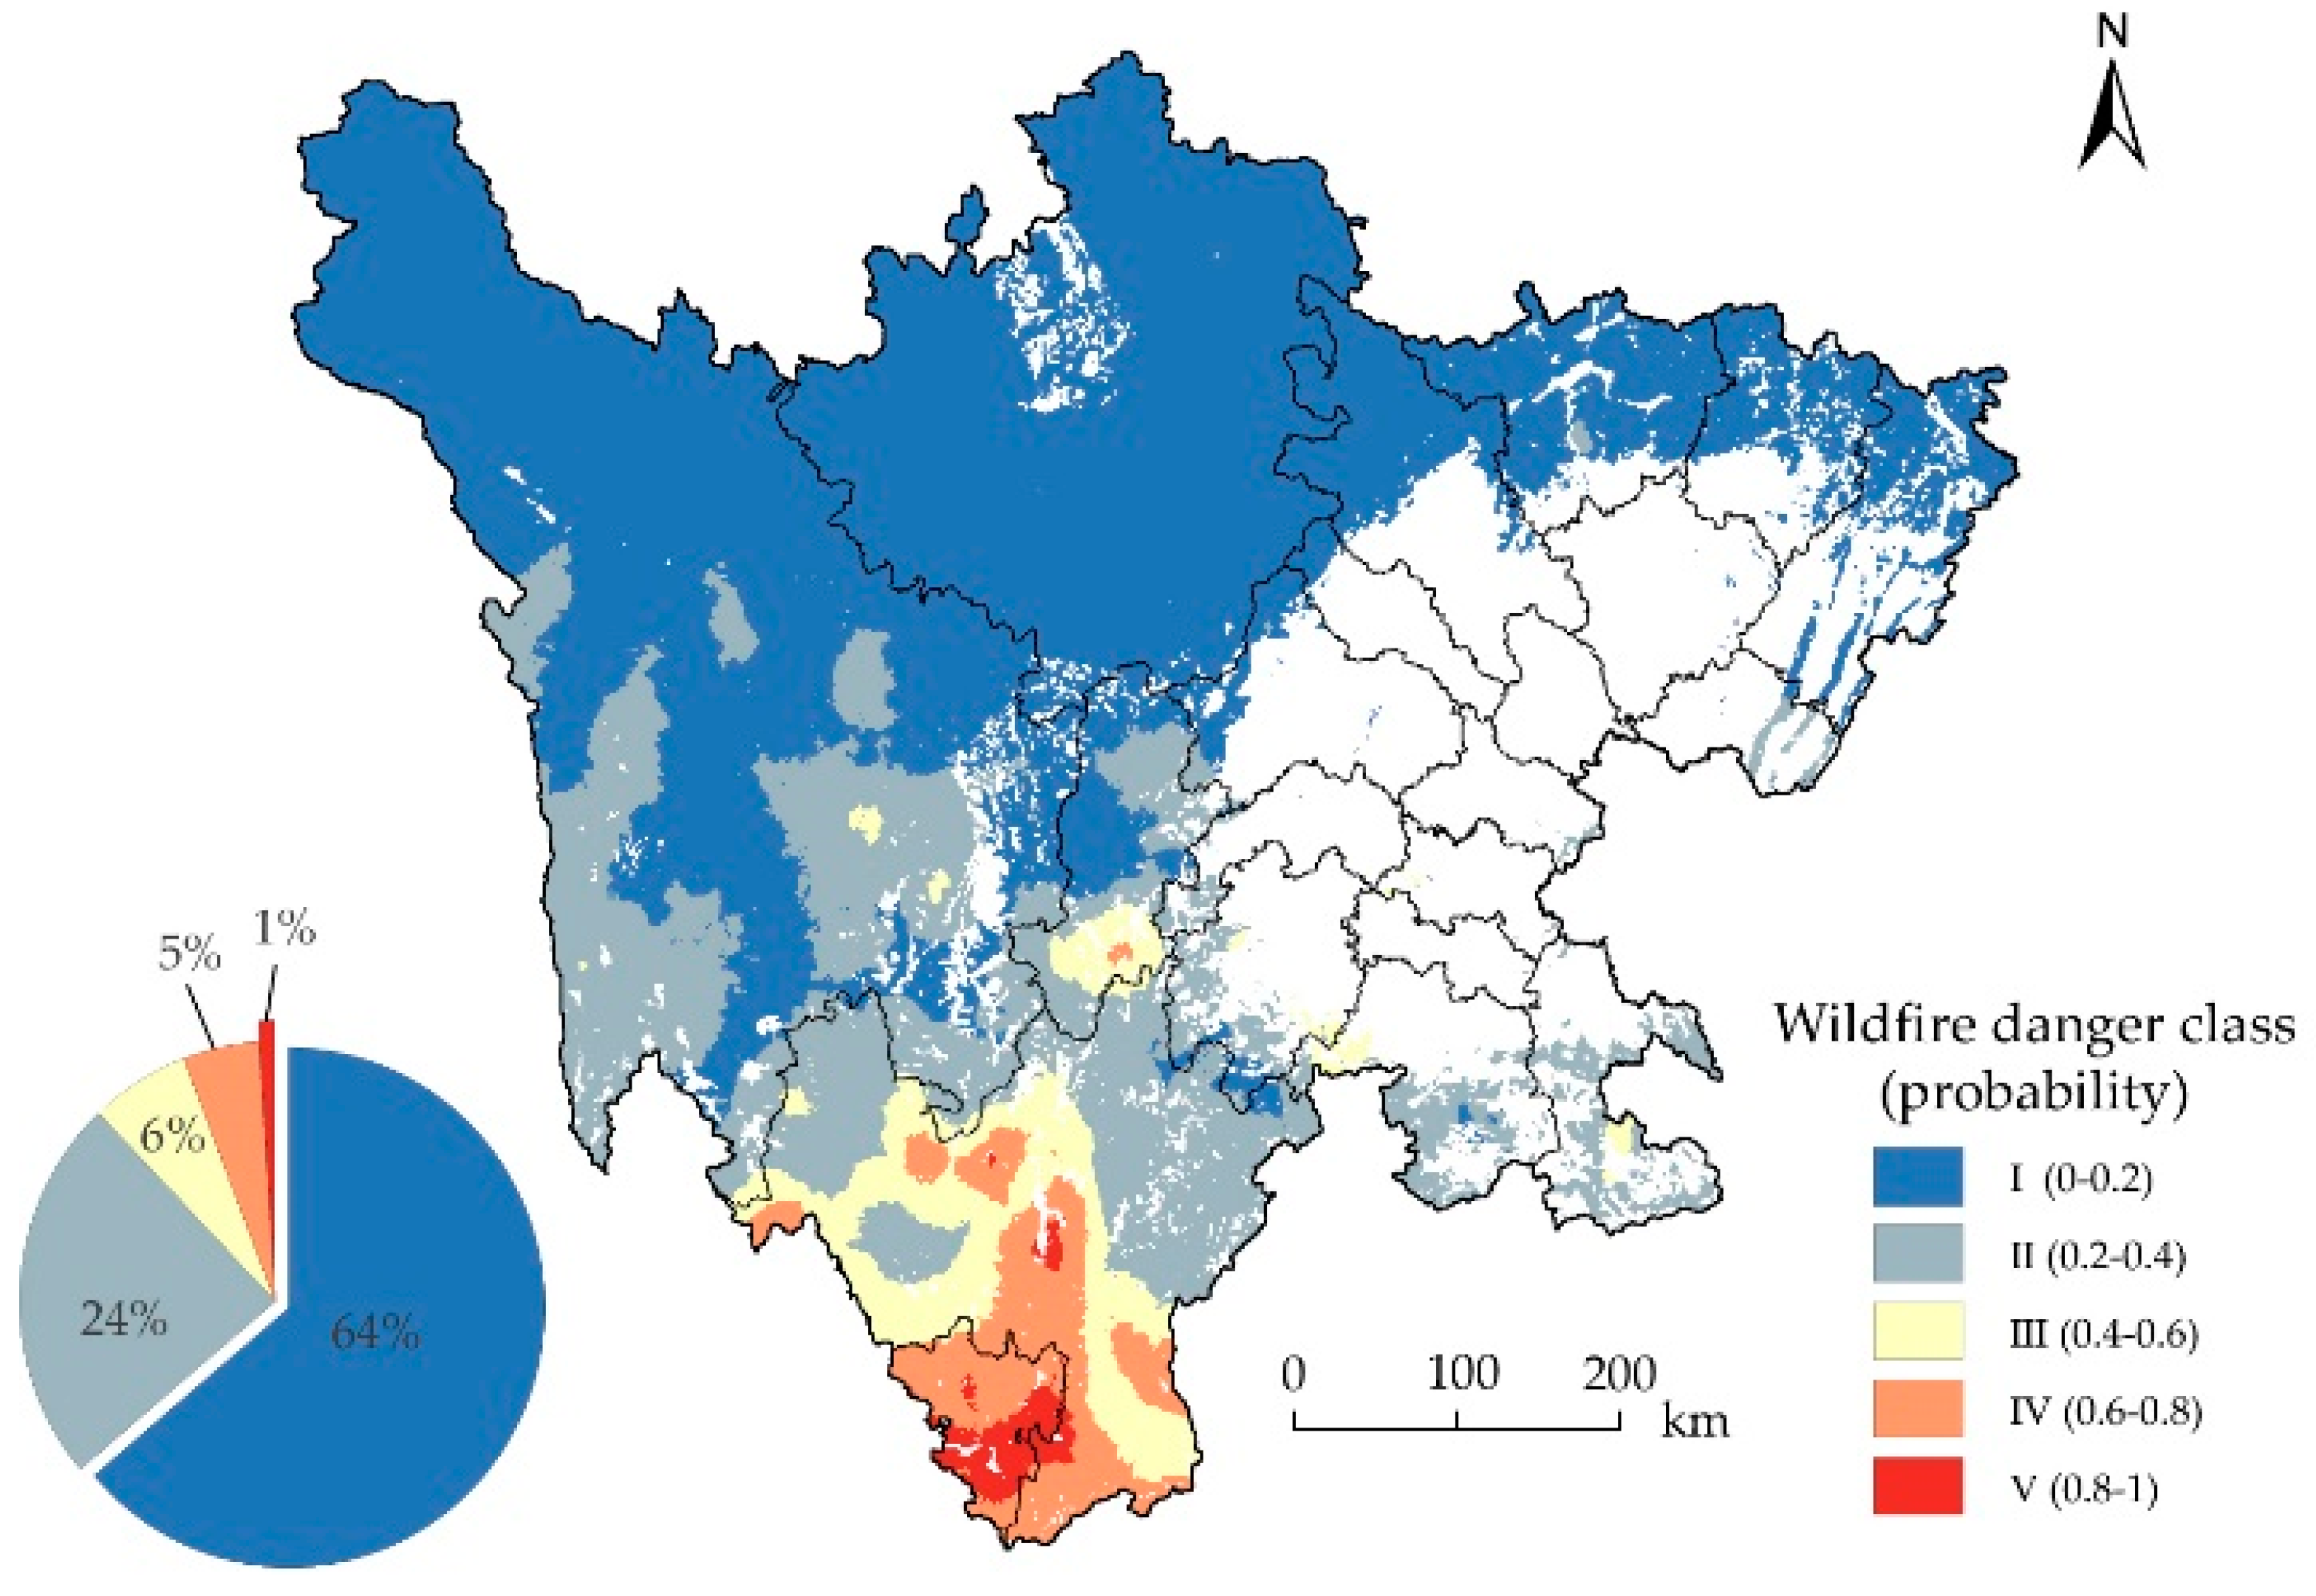
3.5. Probability of Fire Occurrence

Wildfires in Sichuan Province were forecasted and categorized into fire danger classes using seven variables: TEM, ELE, PRE, POPULATION, LM_NDVI, NDVI, and RD. The LR model predicted the probability of fire occurrence, the inverse distance weighting (IDW) approach was used to perform spatial interpolation of wildfires in Sichuan Province, and the wildfire occurrence probability class zoning map of Sichuan Province was produced.
As shown in Figure 8, the probability of wildfire occurrence is lower than 0.4 in most places; in simpler terms, the wildfire danger level is categorized as lower than Class II. The regions with high wildfire danger (Class IV) and extremely high wildfire danger levels (Class V), where the probability of wildfire occurrence exceeds 0.6, are primarily situated in southern and central Sichuan Province, including Panzhihua City, Liangshan City, and parts of Yaan City. These regions account for approximately 6% of the area within the study region (Figure 8). These areas have larger forest area and are located in dry and hot river valleys and high hills with dry environments, making them important wildfire prevention and control areas. The regions with medium wildfire danger level (Class III) are primarily found in the western and central regions, including Liangshan City, Ganzi City, Yaan City, and Leshan City, and they accounted for 6% the area of the study region. Despite the higher altitude, richer forest resources, and lower anthropogenic activity, wildfire prevention and management cannot be ignored. The majority of Class II and Class I fire danger zones are located in the north and northeast, specifically Ganzi City, northern Aba City, and Mianyang City, and they accounted for 24% of the area of the study region. The northern region is located in the high mountain plateau area, where the altitude is higher and air temperature is lower, making wildfires less likely. The majority of the northeastern region is composed of plains, where population density is higher and forest cover is lower, also making wildfires less likely.

4. Discussion

4.1. Confidence of Fire Spot Data

Satellite fire spot data for analyzing fire danger in the region is distinguished by excellent accuracy, reliability of data, ease of use, and convenience, and it is now widely accepted by academics [44,46,77,78]. The hotspots that satellites monitor, however, are not all flames because of problems with algorithms and cloud masking [77]. Confidence levels are provided for fire spot data to minimize inaccuracies at the time of monitoring, but the determination of the optimal threshold for confidence remains a problem. There are four assignments of confidence in the VIRR fire spot data from the Fengyun-3 satellite (fire spot data, cloud area fire spot data, possible fire spot data, possible noise). And in the official MODIS Fire spot documentation, the confidence values range from 0 to 100 and are categorized into three levels (low, nominal, and high). Most of the scholars chose the fire spot data with high confidence level as the data for their studies [79], while some chose all of them as the data for their studies [46]. The choice of confidence level for the data may have a direct impact on the accuracy of the data, which then affects the accuracy of the fire danger model. In order to increase the accuracy of the fire spot data, we immediately removed some fire spot data (such as water bodies, etc.) on non-forested area. However, some human-initiated fires (planned burn removals, etc.) do not have the same conditions and probability of igniting as abrupt fires, and as a result, they should be analyzed in the following phase in conjunction with real official data to improve the accuracy of the study.

4.2. Spatiotemporal Variation Patterns of Wildfires in Sichuan Province

The number of wildfires in Sichuan Province overall increased during 2010–2019, showing an increasing trend until 2014, and then a dramatic declining trend. This is comparable to the study from Zhang et al. [70]. This could be because the frequency of fires has been considerably reduced in Sichuan Province as a result of the emphasis on wildfire management and policy reform (e.g., limiting human activity in ignition, prescribed burning, increased density of forest clearings and surveillance equipment, etc.) [47,57]. Fire spots in Sichuan Province were primarily distributed from December to the following June, when frequent folk activities (e.g., Spring Festival, Lantern Festival, and Qingming Festival) and the dry climate in winter and spring contribute to the high frequency of wildfires during these months [57]. It has long been a critical location for wildfire protection, particularly in the southwest. For example, Panzhihua City, Liangshan City, and the southern Ganzi City are located in the dry and hot river valley zone, and the region’s persistent dryness in winter and high temperature in spring are two of the factors contributing to the frequent occurrence of wildfires [51]. Furthermore, the region is home to ethnic minorities, and the use of fire for folklore purposes, among other things, may be one of the reasons for the frequent fires [57].

4.3. The Main Factors Responsible for Wildfire

Among meteorological factors, the present month’s average temperature and precipitation are the key drivers of wildfire; this finding is consistent with the conclusions of most research [41,42,43,46]. Temperature and precipitation primarily influence the likelihood of wildfires occurring by affecting the moisture of flammable materials, which further influence the likelihood of wildfire. Wildfires are more likely to begin and spread when the moisture of flammable materials is less than 30%, according to [69]. High summer temperatures and extended early spring seasons, for example, are the primary reasons why fires in the western United States have become increasingly common [80].
Altitude has a stronger impact on fires in Sichuan Province than other topographic factors, which is consistent with the findings of Wang et al. [57]. As elevation increases, temperatures decrease, relative humidity increases, and the frequency of wildfires gradually decreases [42,45,57]. Elevation cannot always be used as a primary reference for wildfires [81]. The influence of microclimates and cyclonic weather can also have a positive effect on wildfire occurrence as elevation increases [82,83]. Altitude directly influences the frequency of fires by affecting the moisture of combustible materials or the type of combustible materials [84]. However, as the climate warms, these beneficial effects of altitude decline [80,85]. Among the vegetation factors, the effect of the current month’s NDVI and the previous month’s NDVI is greater. NDVI is a good indicator of the growth of vegetation, and as vegetation cover increases, the combustible fuel is higher and the probability of fires is greater [44,86].
Although the majority of fires are caused by human activities, this study found that the frequency of fire spots steadily reduces as population density and road density increase, which is consistent with the results of Zhu et al. [39]. Socioeconomic factors greatly influence fire occurrence. As the population and roadways grow, the availability of fire-fighting facilities and the professionalism of the management teams enhance the likelihood of fire detection and extinguishment, reducing the incidence of fires [87,88].

4.4. Model Uncertainty

The LR model was used to examine the driving causes of wildfire occurrence in Sichuan Province, and seven factors including TEM, ELE, PRE, POPULATION, LM_NDVI, NDVI, and RD, were finally chosen to drive the simulated ensemble. The findings showed that the LR model’s prediction accuracy was 87.28% and the AUC value was 0.944, indicating that the model can successfully predict wildfire danger in Sichuan Province and thus can be applied in this region.
There are various methods available for predicting wildfires at present, such as regionally weighted regression models [44,76], which can better account for regional geospatial variability. As a result, we need to compare the differences and applicability of different approaches that can aid in the management of actual wildfire. Furthermore, the prevalence of wildfires is varied, and the key factors influencing the occurrence of wildfires vary by region [39,41,42,43,46,53]. In the following studies, we will further divide the study region and introduce different driving factors to increase the model’s accuracy.

4.5. Limitations and Future Works

The main objective of this study was to investigate the main factors affecting the occurrence of wildfires in Sichuan Province and to model the probability of wildfires and danger level. However, due to data limitations, we are currently only able to collect fire point data from 2010–2019, which is a relatively short period for analyses of temporal trends in wildfires. In future studies, we will adjust and improve the accuracy of the model by collecting more comprehensive data to optimize the model.
The data from wildfire spots used in this study were monitored by the FY3 meteorological satellite, including human and nature-caused ignitions. The incidence of lightning-caused fires is primarily influenced by meteorological factors, whereas human-caused fires are more constrained by socio-economic conditions [89]. The fire spots in this study were not differentiated into lightning- and human-caused fires in order to analyze the primary influencing factors of wildfires. The prevention and control measures for wildfires vary depending on the type of fire source [90]. Therefore, the significance of model simulation results for managing fire sources is weakened by this.
Fuels serve as the foundation for wildfires, and fuel characteristics have been utilized by numerous scholars to assess fire danger [91]. Among these characteristics, fuel load is identified as the primary factor influencing wildfire occurrences. In this study, NDVI is employed to demonstrate that fuel coverage can partially reflect the fuel load above ground. However, it does not account for the fuel load under trees and underground.
Most wildfires are caused by lightning [92] and humans [93]. These limitations impact the accuracy of wildfire occurrence probability simulation. To enhance the simulation accuracy of the wildfire occurrence probability model, we plan to consider new factors, such as ignition sources [94], local microclimate [83], and fuel loads [95] in our modelling. In different regions, factors such as climate [96], season [97], and topography [82] have different impacts on fires, and we will also consider analyzing the factors contributing to the occurrence of wildfires in different climatic zones in the study area, which will provide more suitable recommendations for government management. Apart from that, the immediate monitoring of wildfires can also help to significantly reduce the occurrence of fires [16]. In our next work, we will combine different data to assess the occurrence of fires and analyze some fires that are not detected by satellites, so as to help the government make better decisions when setting up watchtowers.

5. Conclusions

In this paper, the VIRR fire spot data in Sichuan Province from 2010 to 2019 are taken as an illustrative example. We analyzed the spatial and temporal distribution characteristics of wildfire spots in Sichuan Province, and the vegetation, terrain, road network, and population factors for the occurrence of wildfires by adopting the VIF and Pearson correlation analyses and random forest importance ranking. The logistic regression (LR) is adopted to establish prediction models. The main conclusions are as follows:
(1)
Annual fluctuations were not significantly related to the occurrence of wildfires in Sichuan Province, but significantly correlated with monthly change and geographical differences. Wildfire spots are displayed most frequently from December to the following June. They were mostly located in the western and southern part of Sichuan, in areas like Panzhihua City, Liangshan City, and Ganzi City.
(2)
Temperature, elevation, precipitation, population density, NDVI of last month, NDVI, and road density are the crucial factors influencing the occurrence of wildfires in Sichuan Province.
(3)
The LR regression model is more suitable in the analysis of the probability of wildfire occurrence in Sichuan Province, and the model accuracy is higher.
(4)
Based on the results of the prediction, wildfires are concentrated in the southwestern portion, in areas such as Panzhihua and Liangshan cities, which are critical for wildfire prevention due to their locations in the dry and hot river valley and their dry climate. Some central areas also have a high incidence of wildfire, such as Ganzi City, Yaan City and Leshan City, which are rich in forest resources, and should not be overlooked for wildfire prevention.

Author Contributions

Conceptualization, Q.Y.; Methodology, W.P., G.C. and Q.Y.; Software, W.P.; Formal analysis, W.P., Y.W. and G.L.; Investigation, W.P., G.L., R.D. and Z.C.; Resources, Q.Y.; Data curation, Y.W., R.D. and P.H.; Writing—original draft, W.P. and Q.Y.; Writing—review & editing, Y.W., G.C., G.L., Q.Y., R.D., P.H. and Z.C.; Supervision, Q.Y.; Project administration, Q.Y. All authors have read and agreed to the published version of the manuscript.

Funding

This research received no external funding.

Data Availability Statement

The original contributions presented in the study are included in the article. Further inquiries can be directed to the corresponding author.

Conflicts of Interest

The authors declare no conflict of interest.

References

  1. Baker, A.G.; Catterall, C. Managing fire-dependent vegetation in Byron Shire, Australia: Are we restoring the keystone ecological process of fire? Ecol. Manag. Restor. 2016, 17, 47–55. [Google Scholar] [CrossRef]
  2. Dantas, V.D.L.; Batalha, M.A.; Pausas, J.G.; Inouye, B.D. Fire drives functional thresholds on the savanna-forest transition. Ecology 2013, 94, 2454–2463. [Google Scholar] [CrossRef] [PubMed]
  3. Krawchuk, M.A.; Moritz, M.A.; Yavitt, J.B. Constraints on global fire activity vary across a resource gradient. Ecology 2011, 92, 121–132. [Google Scholar] [CrossRef] [PubMed]
  4. Adab, H.; Kanniah, K.D.; Solaimani, K. Modeling forest fire risk in the northeast of Iran using remote sensing and GIS techniques. Nat. Hazards 2013, 65, 1723–1743. [Google Scholar] [CrossRef]
  5. Coogan, S.C.P.; Robinne, F.; Jain, P.; Flannigan, M.D. Scientists’ warning on wildfire—A Canadian perspective. Can. J. For. Res. 2019, 49, 1015–1023. [Google Scholar] [CrossRef]
  6. Zeng, N.; Mariotti, A.; Wetzel, P. Terrestrial mechanisms of interannual CO2 variability. Glob. Biogeochem. Cycles 2005, 19, GB1016. [Google Scholar] [CrossRef]
  7. Gonzalez, P.; Neilson, R.P.; Lenihan, J.M.; Drapek, R.J. Global patterns in the vulnerability of ecosystems to vegetation shifts due to climate change. Glob. Ecol. Biogeogr. 2010, 6, 768–775. [Google Scholar] [CrossRef]
  8. Yue, X.; Unger, N. Fire air pollution reduces global terrestrial productivity. Nat. Commun. 2018, 9, 5413. [Google Scholar] [CrossRef]
  9. Kelly, L.T.; Giljohann, K.M.; Duane, A.; Aquilué, N.; Archibald, S.; Batllori, E.; Bennett, A.F.; Buckland, S.T.; Canelles, Q.; Clarke, M.F.; et al. Fire and biodiversity in the Anthropocene. Science 2020, 370, eabb0355. [Google Scholar] [CrossRef]
  10. Hantson, S.; Arneth, A.; Harrison, S.; Yue, C. The status and challenge of global fire modelling. Biogeosci. Discuss. 2016, 11, 3359–3375. [Google Scholar] [CrossRef]
  11. Alló, M.; Loureiro, M.L. Assessing preferences for wildfire prevention policies in Spain. For. Policy Econ. 2020, 115, 102145. [Google Scholar] [CrossRef]
  12. Boer, M.M.; Resco De Dios, V.; Bradstock, R.A. Unprecedented burn area of Australian mega forest fires. Nat. Clim. Chang. 2020, 10, 171–172. [Google Scholar] [CrossRef]
  13. Ward, M.; Tulloch, A.I.T.; Radford, J.Q.; Williams, B.A.; Reside, A.E.; Macdonald, S.L.; Mayfield, H.J.; Maron, M.; Possingham, H.P.; Vine, S.J.; et al. Impact of 2019–2020 mega-fires on Australian fauna habitat. Nat. Ecol. Evol. 2020, 4, 1321–1326. [Google Scholar] [CrossRef] [PubMed]
  14. Brown, P.T.; Hanley, H.; Mahesh, A.; Reed, C.; Strenfel, S.J.; Davis, S.J.; Kochanski, A.K.; Clements, C.B. Climate warming increases extreme daily wildfire growth risk in California. Nature 2023, 621, 760–766. [Google Scholar] [CrossRef]
  15. Flannigan, M.D.; Krawchuk, M.A.; de Groot, W.J.; Wotton, B.M.; Gowman, L.M. Implications of changing climate for global wildland fire. Int. J. Wildland Fire 2009, 18, 483. [Google Scholar] [CrossRef]
  16. Moritz, M.A.; Batllori, E.; Bradstock, R.A.; Gill, A.M.; Handmer, J.; Hessburg, P.F.; Leonard, J.; McCaffrey, S.; Odion, D.C.; Schoennagel, T.; et al. Learning to coexist with wildfire. Nature 2014, 515, 58–66. [Google Scholar] [CrossRef]
  17. Doerr, S.H.; Santín, C. Global trends in wildfire and its impacts: Perceptions versus realities in a changing world. Philos. Trans. R. Soc. B Biol. Sci. 2016, 371, 20150345. [Google Scholar] [CrossRef]
  18. Hong, H.; Jaafari, A.; Zenner, E.K. Predicting spatial patterns of wildfire susceptibility in the Huichang County, China: An integrated model to analysis of landscape indicators. Ecol. Indic. 2019, 101, 878–891. [Google Scholar] [CrossRef]
  19. Bonan, D.B.; Siler, N.; Roe, G.H.; Armour, K.C. Energetic Constraints on the Pattern of Changes to the Hydrological Cycle under Global Warming. J. Clim. 2023, 36, 3499–3522. [Google Scholar] [CrossRef]
  20. Sauter, C.; Fowler, H.J.; Westra, S.; Ali, H.; Peleg, N.; White, C.J. Compound extreme hourly rainfall preconditioned by heatwaves most likely in the mid-latitudes. Weather. Clim. Extrem. 2023, 40, 100563. [Google Scholar] [CrossRef]
  21. Abatzoglou, J.T.; Williams, A.P.; Barbero, R. Global Emergence of Anthropogenic Climate Change in Fire Weather Indices. Geophys. Res. Lett. 2019, 46, 326–336. [Google Scholar] [CrossRef]
  22. Field, R.D.; van der Werf, G.R.; Fanin, T.; Fetzer, E.J.; Fuller, R.; Jethva, H.; Levy, R.; Livesey, N.J.; Luo, M.; Torres, O.; et al. Indonesian fire activity and smoke pollution in 2015 show persistent nonlinear sensitivity to El Niño-induced drought. Proc. Natl. Acad. Sci. USA 2016, 113, 9204–9209. [Google Scholar] [CrossRef] [PubMed]
  23. Mokhov, I.I.; Chernokulsky, A.V.; Shkolnik, I.M. Regional model assessments of fire risks under global climate changes. Dokl. Earth Sci. 2006, 411, 1485–1488. [Google Scholar] [CrossRef]
  24. Jolly, W.M.; Cochrane, M.A.; Freeborn, P.H.; Holden, Z.A.; Brown, T.J.; Williamson, G.J.; Bowman, D.M.J.S. Climate-induced variations in global wildfire danger from 1979 to 2013. Nat. Commun. 2015, 6, 7537. [Google Scholar] [CrossRef] [PubMed]
  25. Bowman, D.M.J.S.; Kolden, C.A.; Abatzoglou, J.T.; Johnston, F.H.; van der Werf, G.R.; Flannigan, M. Vegetation fires in the Anthropocene. Nat. Rev. Earth Environ. 2020, 1, 500–515. [Google Scholar] [CrossRef]
  26. Thorley, J.; Srivastava, S.K.; Shapcott, A. What type of rainforest burnt in the South East Queensland’s 2019/20 bushfires and how might this impact biodiversity. Austral Ecol. 2023, 48, 616–642. [Google Scholar] [CrossRef]
  27. Truong, T.X.; Nhu, V.; Phuong, D.T.N.; Nghi, L.T.; Hung, N.N.; Hoa, P.V.; Bui, D.T. A New Approach Based on TensorFlow Deep Neural Networks with ADAM Optimizer and GIS for Spatial Prediction of Forest Fire Danger in Tropical Areas. Remote Sens. 2023, 15, 3458. [Google Scholar] [CrossRef]
  28. Boyd, M.A.; Walker, X.J.; Barnes, J.; Celis, G.; Goetz, S.J.; Johnstone, J.F.; Link, N.T.; Melvin, A.M.; Saperstein, L.; Schuur, E.A.G.; et al. Decadal impacts of wildfire fuel reduction treatments on ecosystem characteristics and fire behavior in alaskan boreal forests. For. Ecol. Manag. 2023, 546, 121347. [Google Scholar] [CrossRef]
  29. Han, H.; Yin, Y.; Zhao, Y.; Qin, F. Spatiotemporal Variations in Fractional Vegetation Cover and Their Responses to Climatic Changes on the Qinghai–Tibet Plateau. Remote Sens. 2023, 15, 2662. [Google Scholar] [CrossRef]
  30. Davies, G.M.; Gray, A.; Power, S.C.; Domènech, R. Resilience of temperate peatland vegetation communities to wildfire depends upon burn severity and pre-fire species composition. Ecol. Evol. 2023, 13, e9912. [Google Scholar] [CrossRef]
  31. Shi, K.; Touge, Y. Identifying the shift in global wildfire weather conditions over the past four decades: An analysis based on change-points and long-term trends. Geosci. Lett. 2023, 10, 3. [Google Scholar] [CrossRef]
  32. Zheng, B.; Ciais, P.; Chevallier, F.; Chuvieco, E.; Chen, Y.; Yang, H. Increasing forest fire emissions despite the decline in global burned area. Sci. Adv. 2021, 7, eabh2646. [Google Scholar] [CrossRef] [PubMed]
  33. Pérez-Invernón, F.J.; Gordillo-Vázquez, F.J.; Huntrieser, H.; Jöckel, P. Variation of lightning-ignited wildfire patterns under climate change. Nat. Commun. 2023, 14, 739. [Google Scholar] [CrossRef]
  34. Řehoř, J.; Brázdil, R.; Trnka, M.; Balek, J. Flash droughts in Central Europe and their circulation drivers. Clim. Dynam 2023, 1–15. [Google Scholar] [CrossRef]
  35. Wan, C.; Roy, S.S. Geospatial characteristics of fire occurrences in southern hemispheric Africa and Madagascar during 2001–2020. J. For. Res. 2023, 34, 553–563. [Google Scholar] [CrossRef]
  36. Costa, R.; Baker, J.W. A methodology to estimate postdisaster unmet housing needs using limited data: Application to the 2017 California wildfires. Risk Anal. 2023, 1–18. [Google Scholar] [CrossRef] [PubMed]
  37. Davis, R.E.; Roney, P.C.; Pane, M.M.; Johnson, M.C.; Leigh, H.V.; Basener, W.; Curran, A.L.; DeMarcy, B.; Jang, J.; Schroeder, C.; et al. Climate and human mortality in Virginia, 2005–2020. Sci. Total Environ. 2023, 894, 164825. [Google Scholar] [CrossRef]
  38. Jerin, T.; Chowdhury, M.A.; Azad, M.A.K.; Zaman, S.; Mahmood, S.; Islam, S.L.U.; Mohammad Jobayer, H. Extreme weather events (EWEs)-Related health complications in Bangladesh: A gender-based analysis on the 2017 catastrophic floods. Nat. Hazards Res. 2023. [Google Scholar] [CrossRef]
  39. Zhu, Z.; Zhao, F.; Wang, Q.H.; Gao, Z.L.; Deng, X.F.; Huang, P.G. Driving factors of forest fire and fire risk zoning in Kunming City. J. Zhejiang A&F Univ. 2022, 39, 380–387. [Google Scholar]
  40. Zhu, Z.; Zhao, F.; Wang, Q.H.; Deng, X.F.; Gao, Z.L. Research Progress in Forest Fire Occurrence Prediction Models. World For. Res. 2022, 35, 6. [Google Scholar]
  41. Deng, O.; Li, Y.Q.; Feng, Z.K.; Zhang, D.Y. Model and zoning of forest fire risk in Heilongjiang province based on spatial Logistic. Trans. Chin. Soc. Agric. Eng. 2012, 28, 7. [Google Scholar]
  42. Su, Z.W.; Liu, A.; Guo, F.T.; Liang, H.L.; Wang, W.H.; Lin, F.F. Driving factors and spatial distribution patteren of forest fire in Fujian Province. J. Nat. Disasters 2016, 25, 10. [Google Scholar]
  43. Ma, W.Y.; Feng, Z.K.; Cheng, Z.X.; Wang, F.G. Study on driving factors and distribution pattern of forest fires in Shanxi province. J. Cent. South. Univ. For. Technol. 2020, 40, 57–69. [Google Scholar]
  44. Wang, W.G.; Pan, J.H.; Feng, Y.Y.; Li, Z.; Dong, L.L. Model and Zoning of Fire Risk in GansuProvince based on GWLR and MODIS Imagery. Remote Sens. Technol. Appl. 2017, 32, 514–523. [Google Scholar]
  45. Gao, B.; Chen, X.; Shan, Z.H.; Han, X.Y.; Shan, Y.L.; Yin, S.N.; Yu, B. Prediction of forest fire probability in Daxing’an Mountains area based on Logistic regression model. J. Saf. Sci. Technol. 2022, 18, 163–168. [Google Scholar]
  46. Guo, F.T.; Wang, G.Y.; Su, Z.W.; Liang, H.L.; Wang, W.H.; Lin, F.; Liu, A. What drives forest fire in Fujian, China? Evidence from logistic regression and Random Forests. Int. J. Wildland Fire 2016, 25, 505. [Google Scholar] [CrossRef]
  47. Wang, Z.H.; Dong, H.; Zhao, Y.Y.; He, S.C.; Yuan, Y.B.; Zhang, L.W. Prediction of Forest Fire Risk in Yunnan, Guizhou and Sichuan Using Machine Learning Model. J. Northeast. For. Univ. 2023, 51, 113–119. [Google Scholar]
  48. Zhu, X.; Li, J.W.; Guo, W.; Bi, S.; Wu, Y.F. Forest fire risk prediction model based on machine learning. China Saf. Sci. J. 2022, 32, 152–157. [Google Scholar]
  49. Wang, J.H.; Long, X.H.; Li, D.; Niu, S.K. Spatial Distribution of Forest Fires in Sichuan Province Based on GIS. J. Northeast. For. Univ. 2012, 40, 51–56. [Google Scholar]
  50. Tian, X.R.; Zhao, F.J.; Shu, L.F.; Wang, M.Y. Hotspots from Satellite Monitoring and Forest Fire Weather Index Analysis for Southwest China. For. Res. 2010, 23, 7. [Google Scholar]
  51. Wang, X.; Wang, R.T. Temporal and Spatial Characteristics of Forest Fire in Sichuan and Its Climate Background. Chin. Agric. Sci. Bull. 2014, 30, 155–160. [Google Scholar]
  52. Zhang, X.Y.; Su, X.H. Correlation Analysis on Forest Fire Occurring Frequency and Meteorological Factors in Sichuan. J. Northwest For. Univ. 2017, 32, 176–180. [Google Scholar]
  53. Li, D.; Niu, S.K.; Long, X.H.; Xu, G.X.; Wang, S.; Chen, F. Relationship of forest fires and meteorological factors in Sichuan province. J. Northwest A&F Univ. (Nat. Sci. Ed.) 2013, 41, 67–74. [Google Scholar]
  54. Li, B.; Zhou, J.; Bu, J.W.; Jin, X.B.; Cheng, X.; Pan, B.; Feng, J.D. Analysis of Forest Fire Causes and Application of Lightning Monitoring Data in Muli County. J. Catastrophol. 2021, 36, 125–130. [Google Scholar]
  55. Bai, Y.; Wang, B.; Wu, Y.D.; Liu, B. Fire Environment of Forest Fire Formation in Liangshan Prefecture. For. Resour. Manag. 2020, 49, 116–122. [Google Scholar]
  56. Liu, J.; Guo, H.Y.; Gan, W.W.; Xu, R.X.; Sun, R.; Li, Z.S.; Wang, C.X.; Luo, Y. Study on Spatio-Temporal Distribution and Heterogeneity of Climate Forces of Wildfires in Panxi Region. J. Southwest For. Univ. (Nat. Sci.) 2023, 43, 1–12. [Google Scholar]
  57. Wang, S.; Li, H.; Niu, S. Empirical Research on Climate Warming Risks for Forest Fires: A Case Study of Grade I Forest Fire Danger Zone, Sichuan Province, China. Sustainability 2021, 13, 7773. [Google Scholar] [CrossRef]
  58. Chas-Amil, M.L.; Prestemon, J.P.; McClean, C.J.; Touza, J. Human-ignited wildfire patterns and responses to policy shifts. Appl. Geogr. 2015, 56, 164–176. [Google Scholar] [CrossRef]
  59. Chen, D.C.; Li, W.P.; Cai, X.Y.; Jing, N.; Wang, R.F.; Tang, M.D.; Gao, Y.L. Analysis on the dynamic changes and their influencing factors of forest resources in Sichuan Province. J. Earth Environ. 2021, 12, 425–435. [Google Scholar]
  60. Guo, J.; Zhang, Y.; Zhao, W.; He, Q. Study of forest fire monitoring based on VIRR data from Fengyun-3C satellite. For. Fire Prev. 2015, 45–48. [Google Scholar] [CrossRef]
  61. Yang, J.; Dong, C.H. A New Generation of Fengyun Polar Orbiting Meteorological Satellite Business Products and Applications; Science Press: Beijing, China, 2011; p. 198. [Google Scholar]
  62. Catry, F.X.; Rego, F.C.; Bação, F.L.; Moreira, F. Modeling and mapping wildfire ignition risk in Portugal. Int. J. Wildland Fire 2009, 18, 921–931. [Google Scholar] [CrossRef]
  63. Gong, H.; Zhang, M.; Xiang, X.; Liu, H. 1 km monthly precipitation and temperatures dataset for China from 1952 to 2019 based on new baseline climatology surfaces. Sci. Total Environ. 2022, 906, 167613. [Google Scholar] [CrossRef] [PubMed]
  64. Shouzhang, P. 1-km monthly mean temperature dataset for china (1901–2021). In A Big Earth Data Platform for Three Poles; Northwest Institute of Eco-Environment and Resources: Lanzhou, China, 2019. [Google Scholar]
  65. Shouzhang, P. 1-km monthly precipitation dataset for China (1901–2021). In A Big Earth Data Platform for Three Poles; Northwest Institute of Eco-Environment and Resources: Lanzhou, China, 2020. [Google Scholar]
  66. Peng, S.; Gang, C.; Cao, Y.; Chen, Y. Assessment of climate change trends over the Loess Plateau in China from 1901 to 2100. Int. J. Clim. 2018, 38, 2250–2264. [Google Scholar] [CrossRef]
  67. Peng, S.; Ding, Y.; Wen, Z.; Chen, Y.; Cao, Y.; Ren, J. Spatiotemporal change and trend analysis of potential evapotranspiration over the Loess Plateau of China during 2011–2100. Agric. For. Meteorol. 2017, 233, 183–194. [Google Scholar] [CrossRef]
  68. Ding, Y.; Peng, S. Spatiotemporal Trends and Attribution of Drought across China from 1901–2100. Sustainability 2020, 12, 477. [Google Scholar] [CrossRef]
  69. Xu, M.C.; Ma, W.T. Relationship between Arid Climatic Factors and Forest Fires. J. Glaciol. Geocryol. 2012, 34, 603–608. [Google Scholar]
  70. Zhang, Y.L.; Guo, Y.; Hu, H.Q. Characteristics of Forest Fire Data in Southwest China during 2001–2017. J. Northwest For. Univ. 2021, 36, 179–186. [Google Scholar]
  71. Ye, Q.; Feng, W.Z.; Jiao, G.Y.; Deng, W.P. Drought characteristics and their impacts on vegetation net primary productivity in the subtropical China. Front. Ecol. Evol. 2023, 11, 1181332. [Google Scholar] [CrossRef]
  72. Dormann, C.F.; Elith, J.; Bacher, S.; Buchmann, C.; Carl, G.; Carré, G.; Marquéz, J.R.G.; Gruber, B.; Lafourcade, B.; Leitão, P.J. Collinearity: A review of methods to deal with it and a simulation study evaluating their performance. Ecography 2013, 36, 27–46. [Google Scholar] [CrossRef]
  73. Jin, T.; Hu, X.; Liu, B.; Xi, C.; He, K.; Cao, X.; Luo, G.; Han, M.; Ma, G.; Yang, Y. Susceptibility Prediction of Post-Fire Debris Flows in Xichang, China, Using a Logistic Regression Model from a Spatiotemporal Perspective. Remote Sens. 2022, 14, 1306. [Google Scholar] [CrossRef]
  74. Breiman, L. Random Forests. Mach. Learn. 2001, 45, 5–32. [Google Scholar] [CrossRef]
  75. Schaefer, J.T. The Critical Success Index as an Indicator of Warning Skill. Weather. Forecast. 1990, 5, 570–575. [Google Scholar] [CrossRef]
  76. Rodrigues, M.; De, L.; Fotheringham, S. Modeling the spatial variation of the explanatory factors of human-caused wildfires in Spain using geographically weighted logistic regression. Appl. Geogr. 2014, 48, 52–63. [Google Scholar] [CrossRef]
  77. Earl, N.; Simmonds, I. Spatial and Temporal Variability and Trends in 2001–2016 Global Fire Activity. J. Geophys. Res. Atmos. 2018, 123, 2524–2536. [Google Scholar] [CrossRef]
  78. Ren, J.; Shen, C.M.; Liu, F.; Ye, L.Y. Temporal and spatial dynamics of MODIS fire points in Xishuangbanna, Yunnan during 2011 to 2020. Chin. J. Ecol. 2023, 42, 1953–1962. [Google Scholar]
  79. Zeng, A.C.; Guo, X.S.; Zheng, W.X.; Wei, M.; Jin, Q.F.; Guo, F.T. Temporal and spatial dynamic characteristics of forest fire in Zhejiang Province of eastern China based on MODIS satellite hot spot data. J. Beijing For. Univ. 2020, 42, 39–46. [Google Scholar]
  80. Alizadeh, M.R.; Abatzoglou, J.T.; Luce, C.H.; Adamowski, J.F.; Farid, A.; Sadegh, M. Warming enabled upslope advance in western US forest fires. Proc. Natl. Acad. Sci. USA 2021, 118, e2009717118. [Google Scholar] [CrossRef]
  81. Serbouti, S.; Abbas, Y.; Ettaqy, A.; Boukcim, H.; Achiban, H.; Abderrazzak, B.; Ghachtouli, N.E. Evolution of wildfires, burned areas, and affected species in Middle Atlas forests (Morocco) from 2000 to 2020. Trees For. People 2022, 10, 100319. [Google Scholar] [CrossRef]
  82. Carmo, M.; Moreira, F.; Casimiro, P.; Vaz, P. Land use and topography influences on wildfire occurrence in northern Portugal. Landsc. Urban. Plan. 2011, 100, 169–176. [Google Scholar] [CrossRef]
  83. Wastl, C.; Schunk, C.; Lüpke, M.; Cocca, G.; Conedera, M.; Valese, E.; Menzel, A. Large-scale weather types, forest fire danger, and wildfire occurrence in the Alps. Agric. For. Meteorol. 2013, 168, 15–25. [Google Scholar] [CrossRef]
  84. Heyerdahl Emily, K.; Brubaker Linda, B.; Agee James, K. Spatial controls of historical fire regimes: A multiscale example from the interior west, USA. Ecology 2001, 82, 660–678. [Google Scholar] [CrossRef]
  85. Rogeau, M.; Armstrong, G.W. Quantifying the effect of elevation and aspect on fire return intervals in the Canadian Rocky Mountains. For. Ecol. Manag. 2017, 384, 248–261. [Google Scholar] [CrossRef]
  86. Li, X.W.; Zhao, G.; Yu, X.B.; Yu, Q. Probability models of forest fire risk based on ecology factors in different vegetation regions over China. Acta Ecol. Sin. 2013, 33, 1219–1229. [Google Scholar]
  87. Brosofske, K.D.; Cleland, D.T.; Saunders, S.C. Factors Influencing Modern Wildfire Occurrence in the Mark Twain National Forest, Missouri. South. J. Appl. For. 2007, 31, 73–84. [Google Scholar] [CrossRef]
  88. Stephens, S.L. Forest fire causes and extent on United States Forest Service lands. Int. J. Wildland Fire 2005, 14, 213. [Google Scholar] [CrossRef]
  89. Hu, T.; Zhou, G. Drivers of lightning- and human-caused fire regimes in the Great Xing’an Mountains. For. Ecol. Manag. 2014, 329, 49–58. [Google Scholar] [CrossRef]
  90. Wang, H.; Jin, B.; Zhang, K.; Aktar, S.; Song, Z. Effectiveness in Mitigating Forest Fire Ignition Sources: A Statistical Study Based on Fire Occurrence Data in China. Fire 2022, 5, 215. [Google Scholar] [CrossRef]
  91. Weise, D.R.; Wright, C.S. Wildland fire emissions, carbon and climate: Characterizing wildland fuels. For. Ecol. Manag. 2014, 317, 26–40. [Google Scholar] [CrossRef]
  92. Zacharakis, I.; Tsihrintzis, V.A. Integrated wildfire danger models and factors: A review. Sci. Total Environ. 2023, 899, 165704. [Google Scholar] [CrossRef]
  93. Gaboriau, D.M.; Chaste, É.; Girardin, M.P.; Asselin, H.; Ali, A.A.; Bergeron, Y.; Hély, C. Interactions within the climate-vegetation-fire nexus may transform 21st century boreal forests in northwestern Canada. Iscience 2023, 26, 106807. [Google Scholar] [CrossRef]
  94. Syphard, A.D.; Keeley, J.E. Location, timing and extent of wildfire vary by cause of ignition. Int. J. Wildland Fire 2015, 24, 37. [Google Scholar] [CrossRef]
  95. Calviño-Cancela, M.; Chas-Amil, M.L.; García-Martínez, E.D.; Touza, J. Interacting effects of topography, vegetation, human activities and wildland-urban interfaces on wildfire ignition risk. For. Ecol. Manag. 2017, 397, 10–17. [Google Scholar] [CrossRef]
  96. Spiecker, H.; Kahle, H.P. Climate-driven tree growth and mortality in the Black Forest, Germany—Long-term observations. Glob. Chang. Biol. 2023, 29, 5908–5923. [Google Scholar] [CrossRef] [PubMed]
  97. Rodrigues, M.; Cunill Camprubí, À.; Balaguer-Romano, R.; Coco Megía, C.J.; Castañares, F.; Ruffault, J.; Fernandes, P.M.; Resco De Dios, V. Drivers and implications of the extreme 2022 wildfire season in Southwest Europe. Sci. Total Environ. 2023, 859, 160320. [Google Scholar] [CrossRef] [PubMed]
Figure 1. Location, elevation (a), and vegetation types (b) of Sichuan Province.
Forests 14 02352 g001
Figure 2. The annual (a) and monthly (b) variations of the number of fire spots.
Forests 14 02352 g002
Figure 3. The spatial distribution of wildfire spots in Sichuan Province.
Forests 14 02352 g003
Figure 4. Correlation coefficients based on Pearson Correlation analysis. Note: × indicates not statistically significant. Factor M indicates dependent variable in M dataset (Including fire spot and non-fire spot).
Forests 14 02352 g004
Figure 5. Random Forest importance ranking. IncMSE is the increase in mean squared error (MSE, %). The greater the IncMSE value, the higher the variable’s level of significance [74].
Forests 14 02352 g005
Figure 6. The frequency distributions of fire spots along gradients of different influencing factors ((a): TEM, Monthly average temperature; (b): PRE, Monthly precipitation; (c): LM_NDVI, Normalized Difference Vegetation Index for the last; (d): NDVI, Normalized Difference Vegetation Index; (e): POP, Population density; (f): RD, Road kernel density; (g): ELE, Elevation).
Forests 14 02352 g006aForests 14 02352 g006b
Figure 7. ROC curve fitting results based on the wildfire prediction model.
Forests 14 02352 g007
Figure 8. The spatial characteristic of the occurrence probability and danger of wildfires in Sichuan Province. Classes I, II, III, IV, and V indicate extreme low, low, medium, high, and extreme high danger, respectively. The pie chart illustrates the proportion of total forest area for different wildfire danger levels.
Forests 14 02352 g008
Table 1. Initially selected influencing factors for the occurrence of wildfires in Sichuan Province.
Factor TypeFull NameSymbolSpatial ResolutionFormatUnitSourceReferences
Meteorological factorsMonthly precipitationPRE1 kmContinuousmmNational Tibetan Plateau Data Center. (https://doi.org/10.5281/zenodo.3185722, accessed on 15 September 2023)
Monthly precipitation for the last monthLM_PRE1 kmContinuousmm
Monthly average temperatureTEM1 kmContinuous°C
Monthly average temperature for the last monthLM_TEM1 kmContinuous°C
Vegetation factorsVegetation typeVT1 kmCategorical--Resource and EnvironmentScience and Data Center (http://www.resdc.cn, accessed on 15 September 2023)Guo et al. (2016) [46]
Normalized Difference Vegetation IndexNDVI1 kmContinuous%16-day synthetic product dataset for MOD13A2(https://www.gscloud.cn/home#page1/2, accessed on 15 September 2023)Wang et al. (2017) [44]
Normalized Difference Vegetation Index for the last monthLM_NDVI1 kmContinuous%
Topographic factorsElevationELE30 mContinuousmGeospatial Data Cloud (https://www.gscloud.cn/, accessed on 15 September 2023)Gao et al. (2022) [45]; Guo et al. (2016) [46]
SlopeSLO30 mContinuousangles
AspectASP30 mCategorical--
Waterways kernel densityWDBandwidths 1 kmContinuous--http://download.geofabrik.de/index.html (accessed on 15 September 2023)
Road NetworkRoad kernel densityRDBandwidths 1 kmContinuous--http://download.geofabrik.de/index.html (accessed on 15 September 2023)
Railway kernel densityRWDBandwidths 1 kmContinuous--
PopulationPopulation densityPOP1 kmContinuousnumber/kmhttps://hub.worldpop.org/project/categories?id=3 (accessed on 15 September 2023)Guo et al. (2016) [46]
Table 2. Classification standard of aspect.
AspectAzimuth
Shady slope337.5°~360.0°
Semi-shady slope67.5°~112.5°, 292.5°~337.5°
Sunny slope157.5°~247.5°
Semi-sunny slope112.5°~157.5°, 247.5°~292.5°
Table 3. Confusion Matrix.
Observed
Fire Spot DataNo Fire Spot Data
Predictedfire spot dataTPFP
no fire spot dataFNTN
Table 4. Fire danger level classification.
The Probability of a WildfireFire DangerDanger Level
0~0.2IExtreme low danger
0.2~0.4IILow danger
0.4~0.6IIIMedium danger
0.6~0.8IVHigh danger
0.8~1VExtreme high danger
Table 5. The results of multicollinearity test.
FactorVIF Value (All Factors)VIF Value (Removing LM_TEM)
LM_TEM6.316---
TEM5.5493.933
LM_PRE1.0361.034
PRE1.1021.093
ELE4.4603.807
ASP1.0121.012
SLO1.0091.009
VT1.2851.272
LM_NDVI2.8852.883
NDVI2.8542.630
POP1.5371.533
RWD1.1541.143
RD1.7361.717
WD1.3181.317
Table 6. Accuracy assessment results based on the five models.
AUCACC (%)TPRTS
M10.94487.250.8240.718
M20.94186.810.8280.713
M30.94587.550.8300.734
M40.95389.360.8610.762
M50.94987.590.8300.721
M00.94487.280.8290.723
Disclaimer/Publisher’s Note: The statements, opinions and data contained in all publications are solely those of the individual author(s) and contributor(s) and not of MDPI and/or the editor(s). MDPI and/or the editor(s) disclaim responsibility for any injury to people or property resulting from any ideas, methods, instructions or products referred to in the content.

