Abstract
Dendrogenomics is a new interdisciplinary approach that allows joint analysis of dendrological and genomic data and opens up new ways to study the temporal dynamics of forest treelines, delineate spatial and temporal population structures, decipher individual tree responses to abiotic and biotic stresses, and evaluate the adaptive genetic potential of forest tree populations. These data are needed for the prediction of climate change effects and mitigation of the negative effects. We present here an association analysis of the variation of 27 individual tree traits, including adaptive dendrophenotypes reflecting the individual responses of trees to drought stress, such as the resistance (Rt), recovery (Rc), resilience (Rs), and relative resilience (RRs) indexes measured in 136 Siberian larch trees in 5 populations in the foothills of the Batenevsky Ridge (Kuznetsk Alatau, Republic of Khakassia, Russia), with variation of 9742 SNPs genotyped using ddRADseq in the same trees. The population structure of five closely located Siberian larch populations was relatively weak (FST = 0.018). We found that the level of individual heterozygosity positively correlated with the Rc and RR indices for the five studied drought periods and partly with the Rs indices for three drought periods. It seems that higher individual heterozygosity improves the adaptive capabilities of the tree. We also discovered a significant negative relationship between individual heterozygosity and the Rt index in four out of five periods, which means that growth slows down during droughts more in trees with higher individual heterozygosity and is likely associated with energy and internal resource reallocation toward more efficient water and energy usage and optimization of larch growth during drought years. We found 371 SNPs with potentially adaptive variations significantly associated with the variation of adaptive dendrophenotypes based on all three different methods of association analysis. Among them, 26 SNPs were located in genomic regions carrying functional genes: 21 in intergenic regions and 5 in gene-coding regions. Based on the obtained results, it can be assumed that these populations of Siberian larch have relatively high standing adaptive genetic variation and adaptive potential underlying the adaptations of larch to various climatic conditions.
1. Introduction
Droughts have become more frequent and drastic due to climate change [1,2], especially in boreal forests [3,4]. Therefore, it is very important to find whether tree populations possess sufficient standing genetic variation that may help trees to adapt to environmental stresses such as droughts. One of the most efficient approaches to find such variation is to search for genes whose variation is associated with the variation of adaptive dendrophenotypes using genome-wide genetic markers [5]. Our main hypothesis was that there are genes whose variation is significantly associated with individual responses of trees to the droughts, and therefore, our main objective was to study the association between the phenotypic variation of important adaptive traits related to the drought response and the genetic variation of individual trees and populations of Siberian larch (Larix sibirica Ledeb.) in the south area mostly affected by climate change [6,7,8,9,10,11].
Siberian larch is a coniferous tree common in Russia, Kazakhstan, Mongolia, and China. This is one of the key species of Siberian boreal forests, whose wood is superior in performance to many other coniferous species and has high ecological and economic significance. The wide range of Siberian larch includes both tundra zones in the north and forest and forest-steppe zones of Altai and Sayan Mountains in southern East Siberia [12,13,14].
The constant moisture deficit typical of the forest-steppe zone of southern East Siberia is gradually increasing with an increase in average annual temperatures due to global climate change, which, along with periodic droughts, affects the structure and dynamics of forest ecosystems. L. sibirica is a relatively drought-resistant species because of its high level of phenotypic plasticity and genetic variation. However, under the influence of rapidly increasing environmental stress, such as a decrease in the amount of summer precipitation, intense and recurring droughts, fires, and pest infestations, there is a concern that larch will not be able to effectively adapt to the new conditions associated with global warming [10,15,16].
Dendrochronological data based on measurements of annual tree wood growth rings contain a lot of information about the individual responses of trees to biotic and abiotic environmental factors [7,8,17,18,19,20,21,22,23]. In turn, the ability to individually genotype a large number of trees in populations for thousands of genes and genetic markers makes it possible to link genetic variation with the variation of specific dendrophenotypes [5,24,25,26,27,28]. This interdisciplinary approach, allowing the integration of dendrochronology, dendroecology, and genomics, has been gaining popularity in recent years [5,29,30,31].
According to the results of dendroclimatic studies conducted in the region of southern East Siberia, Siberian larch has successfully adapted to the modern conditions of the forest-steppe zone [20]. To understand the genetic mechanisms of this adaptation, we searched for DNA markers whose variation is associated with the variation of individual dendrophenotypes, reflecting the individual response of a tree to abiotic stress such as drought. For this purpose, genome-wide genotyping of a large number of trees in five populations was performed, and the structure of Siberian larch populations, genetic diversity, and genetic basis of adaptation to growing conditions within the forest-steppe zone of the foothills of the Batenevsky Ridge (Kuznetsk Alatau, southern East Siberia, Russia) were analyzed.
2. Materials and Methods
2.1. Sampling and Dendrophenotypes
The samples were collected from 150 trees in five populations in the foothills of the Batenevsky Ridge in the eastern part of the Kuznetsk Alatau, Republic of Khakassia (southern East Siberia, Russia) (Figure 1). This mountain system is characterized by a slight difference in elevation (500–1200 m above sea level), and most of its area is covered with mixed forest consisting of Siberian larch, Scots pine (Pinus sylvestris L.), and silver birch (Betula pendula Roth.). On the drier southern and southeastern slopes, open forest is interspersed with steppe areas. The forests of the study area are part of the state forest; forest districts are located on the ridge. The climate of the region is sharply continental, with large seasonal and daily temperature differences, hot summers, and frosty winters with little snow lasting from November to March. Despite the significant size of the study area, the high and similar variation in larch growth allows us to consider the forest-steppe ecotone of the Batenevsky Range as an integral geographical object, which is characterized by a unity of fluctuations in environmental conditions and the responses of vegetation to them [14]. Samples of larch wood and needles were collected at five population sites located 30–50 km apart in the forest-steppe zone along the foothills of the Batenevsky Ridge (Figure 1). The sites were selected on well-lit slopes oriented from southwest to southeast (Table 1).

Table 1.
The five population sampling sites of Siberian larch used in the study.
Wood core samples were extracted from 150 mature, undamaged, live larch trees at chest level. The samples were collected and processed using standard dendrochronological techniques [32]. Individual tree ring widths (TRWs) were measured using the LINTAB device (Rinntech-Metriwerk GmbH & Co. KG, Heidelberg, Germany; https://rinntech.info/products/lintab, accessed on 14 October 2023) using the TSAP-Win program [33]. The TRWs were cross-dated, and the dating was checked using the COFECHA program [34]. The average TRW, generalized raw chronologies (avTRW) and their variance (varTRW) were used as dendrophenotypes.

Figure 1.
Larch distribution area in Eurasia according to [14] (upper part, adapted with permission from Figure 1 in [13]) and location of the five population sampling sites of Siberian larch used in this study (lower part, adapted with permission from [35]): Bidja (BID), Bograd (BOGR), Kamyziak (KAM), Son (SON), and Tuim (TUIM). See also Table 1 for details.

Five drought periods (1951, 1963–1965, 1974–1976, 1999, and 2015, respectively) that occurred more than 6 years apart were selected from climatic extremes that significantly suppressed larch growth on a regional scale. To select drought periods, years with low values (<mean − SD) for the standardized precipitation–evapotranspiration index (SPEI) and/or precipitation averaged for the current April–July and/or previous June–September, as well as high temperatures (>mean + SD) over the current May–July and/or previous July-September, were identified in the study area (53.5–54.5° N, 89.5–91.5° E). Then, those periods with the simultaneous occurrence of several of these climatic deviations that also were accompanied by the formation of narrow tree rings (<mean − SD for averaged local tree-ring chronology) across all or most of the sampling sites were selected as drought periods. More detailed explanations of the selection of the drought periods exactly in these sampling sites, as well as the reasoning for the used seasonal timeframe of the climatic factors impacting significantly larch growth, can be found in [35]. To analyze the effect of this stress on larch growth, we used the resistance (Rt = Gd/Gprev), recovery (Rc = Gpost/Gd), and resilience (Rs = Gpost/Gprev) indices proposed by Lloret et al. (2011) [36], where Gprev is the average growth during the 3 years before the drought, Gd is the average growth during the drought, and Gpost is the average growth during the 3 years after the drought, as calculated from the tree-ring series of each tree after their standardization (omission of age-related trends fitted by cubic smoothing splines) using the ARSTAN program [37]. A more detailed description can also be found in [35]. The relative resilience indices (RRs) were also used, calculated as RRs = Rs − Rt. Additionally, the age of the tree at the time of collection (Age), the average length of 15 needles (avLn), and the variance of these 15 needle length measurements (varLn) were used as phenotypic traits. The radial growth trends (trendTRW) for each tree and the mean chronology for each population were calculated as the slope of the linear regression of the respective indexed time series after standardization (i.e., after elimination of the long-term trends related to tree size, age, and forest stand dynamics) for the 30-year period of the years 1990–2019. Phenotypic data that were not normally distributed according to the Shapiro–Wilk test were normalized using the rank-based inverse normal transformation (INT) algorithm. A total of 26 dendrophenotypic traits were considered in this study (Table 2).
Table 2.
Description of the dendrophenotypes.
A pairwise Wilcoxon rank-sum test was performed to compare the dendrophenotypes and individual heterozygosity data between populations using the pairwise.wilcox.test command from the basic R package stats [38]. The Benjamini–Hochberg procedure was used as a method of multiple testing correction.
2.2. DNA Extraction and ddRAD Sequencing
DNA was isolated from the needles of the collected larch samples using the CTAB method [39]. The DNA concentration was assessed using a Qubit 2.0 fluorimeter (Thermo Fisher Scientific, Waltham, MA, USA). The purity and quality of the isolated DNA were also assessed using an Implen NanoPhotometer P330 (Implen, München, Germany). High-quality DNA samples with an A260/230 of approximately 1.8 and a concentration of 20–150 ng/μL were selected for this study.
The preparation of the ddRAD-seq libraries was based on a modified version of the protocol [40]. The DNA samples were treated with two restriction enzymes, EcoRI and MseI [41]. Validation of the prepared ddRAD-seq library pools before sequencing was performed on an Agilent 2200 TapeStation System (Agilent Technologies, Santa Clara, CA, USA). Single-end sequencing of the ddRAD-seq libraries was performed in three lanes using 100 cycles on a NovaSeq 6000 sequencer (Illumina, San Diego, CA, USA).
2.3. SNP Calling
The obtained sequencing data underwent several stages of initial processing: filtering, trimming according to quality indicators, and demultiplexing using the process_radtags utility included in the Stacks software version 2.65 [42]. Reads from each sample were then aligned to the Siberian larch reference genome [43] using Bowtie2 version 2.3 [44].
Variant calling was performed using the Gstacks utility from the Stacks software. The resulting set of alignment-covered loci was subjected to several filtering steps using the Populations utility to retain only loci that were present in at least 75% of all samples and in 75% of samples within each population. The maximum level of observed heterozygosity of the site should not exceed 0.85, and the frequency of the minor allele should not be less than 0.05. SNPs that were in linkage disequilibrium (LD) (r2 > 0.8) were removed. Imputation of missing values was performed using the LD-kNNi method in TASSEL v.5.0 [45].
2.4. Genetic Structure of Populations
General indicators of genetic diversity, such as the mean observed (HO) and expected (HE) heterozygosities, nucleotide diversity (π), mean individual fixation index (FIS), and their associated standard errors (s.e.), were estimated using the Stacks v2.5 software. The pairwise FST values among all the populations tested and their confidence intervals (using 10,000 bootstrap samples) were estimated using the R package StAMPP [46]. To determine the population structure, principal component analysis (PCA) was performed based on allele frequency data using the R ade4 package [47]. Sparse non-negative matrix factorization (sNMF) analysis was performed using LEA [48], and the estimation of individual ancestries was performed using the Admixture algorithm implemented in the AdmixPipe program [49]. Hierarchical analysis of molecular variance (AMOVA) was performed using Arlequin v. 3.5.1.2 [50]. The Mantel test to identify correlations between genetic and geographic distances was performed on two datasets: for 84 individual trees of the KAM, BID, and SON populations, for which the exact coordinates of the trees were recorded and the IBS genetic distance matrix was calculated; and for five populations using the average coordinates and the matrix of Nei’s genetic distances using the R package vegan v. 2.6-2 [51].
2.5. Associations between Dendrophenotypes and Individual Heterozygosity
For each sample tree, the individual level of heterozygosity was calculated as the number of polymorphic sites in the heterozygous state divided by the total number of polymorphic sites genotyped for a given sample. The correlations between individual heterozygosity and dendrophenotypes were analyzed using Spearman’s rank correlation and Pearson’s correlation coefficient using the R stats package [38].
2.6. Genotype–Phenotype Associations
The genotype–dendrophenotype associations were analyzed using the general linear model (GLM) and mixed linear model (MLM) in the TASSEL software version 5.0, where each site is an independent variable and each dendrophenotype is a dependent (response) variable. MLM analysis considers the confounding factors such as the pairwise kinship matrix K (reflecting relatedness between individuals) and population structure (the Q-matrix coefficients reflecting ancestry contributions into individuals), whereas GLM analysis accounts only for the population structure. The K-matrix of relatedness was calculated using the centered IBS method. The Q-matrix was obtained using the sNMF algorithm for the most probable number of population clusters (K), which equaled two for our samples. To search for associations whose weak signals were systematically observed in several different periods of drought, common overlapping SNPs were found for the SNP–dendrophenotype associations that passed the filtering threshold of p-value < 0.01.
The genotype–phenotype associations were also assessed using the Bayesian sparse linear mixed model (BSLMM) implemented in the GEMMA software package v.0.97 [52]. BSLMM is a polygenic model that accounts for the contribution of single SNPs with large effects, as well as the simultaneous contribution of multiple SNPs with smaller effects, on phenotypic variation. To achieve this, BLSMM includes the main effects of individual SNPs as predictors of the phenotype and the polygenic effect resulting from the combination of multiple SNPs with small effects. To identify significant genotype–phenotype associations for each trait, a posterior inclusion probability (PIP) threshold of >0.25 was used.
2.7. SNP Annotation
To analyze the genomic regions where SNPs associated with dendrophenotypes were located, annotation of the Siberian larch reference genome assembly was used [53]. Annotation of selected markers was performed using the SNPdat program [54]. Additionally, for SNPs associated with dendrophenotypes, the ±1000 bp long nucleotide sequences flanking the SNPs were extracted from the genome assembly using SNP coordinates, and a search for homologs of these extracted sequences was performed in the NCBI BLAST “nt” database [55].
3. Results
3.1. Dendrophenotypes
In order to understand how the values of dendrophenotypic traits differ between populations and among individuals, the pairwise Wilcoxon rank-sum test was performed (Table S1) and box-plots for each trait were generated (Figure 2), respectively. They demonstrated that some population samples were different from each other for some traits, and there was significant phenotypic variation between individuals (Table S1).
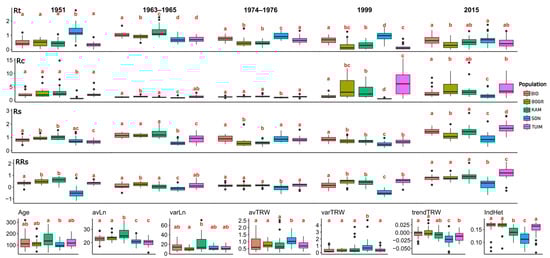
Figure 2.
Box-plot of 27 dendrophenotypic traits, including age of the tree (Age), average needle length (avLn), variance of needle length (varLn), average tree ring width (avTRW), variation of tree ring width (varTRW), radial growth trends (1990–2019) (trendTRW), individual heterozygosity (IndHet) and indexes of the tree response to the drought in different years (1951, 1963–1965, 1974–1976, 1999 and 2015): resistance (Rt), recovery (Rc), resilience (Rs), and relative resilience (RRs1) in five population samples BID, BOGR, KAM, SON, and TUIM (see Figure 1 and Table 1). Letters a, b and c under boxes depict whether differences between population samples are statistically significant, at least at p < 0.05, based on the pairwise Wilcoxon rank-sum test (see also Table S1).
The average age (Age) of the studied trees was 124 years, ranging from 34 (kam2 tree) to 319 (bid24 tree) (Table S1). The highest average age was in the KAM sample, 153.8 ± 13.9 years; the lowest average age was in the SON sample, 102.8 ± 5.6 years (Table S1). Only between these two samples was there a significant difference in age based on the Wilcoxon rank-sum test (p = 0.019; Table S1).
The average needle length (avLn) for all the trees was 22.8 ± 0.3 cm, varying widely from 12.5 cm in the kam28 tree to 36.9 cm in the kam7 tree, and on average, from 20.1 ± 0.5 in the TUIM sample to 21.1 ± 0.5 in SON, 22.9 ± 0.5 in BID, 23.5 ± 0.5 in BOGR, and 26.5 ± 0.9 in KAM (Table S1). The samples differed significantly between each other (p < 0.05; Table S1), except for the BID–BOGR and SON–TUIM pairs.
The average variance of the needle length (varLn) across all the trees was 14.4 ± 0.8 cm (Table S1), varying insignificantly between samples from 10.5 ± 0.9 in BOGR to 12.2 ± 0.9 in TUIM, 12.7 ± 1.0 in SON, 14.3 ± 1.6 in BID, and 21.5 ± 3.0 in KAM, except only for the BOGR and KAM pair (p = 0.048; Table S1).
The average tree ring width (avTRW) for all the trees was 0.87 ± 0.08, varying widely among individual trees from 0.21 ± 0.12 in the kam28 tree to 2.53 ± 1.93 in the kam3 tree, and on average, in the samples from 0.77 ± 0.06 in TUIM to 0.78 ± 0.06 in BOGR, 0.83 ± 0.11 in KAM, 0.85 ± 0.10 in BID, and 1.10 ± 0.07 in SON (Table S1). Among all the sample pairs, only the SON sample was significantly different from all the other samples (p < 0.05; Table S1).
The variance of the tree ring width (varTRW) was varying also widely among individual trees, from 0.01 in the kam28 tree to 4.74 in the son21 tree (Table S1). On average, the largest varTRW was observed in the SON sample (0.97 ± 0.19), while in the other samples, it varied from 0.33 ± 0.04 in BOGR, 0.36 ± 0.07 in BID, 0.43 ± 0.06 in TUIM, and 0.63 ± 0.16 in KAM population samples (Table S1). The only SON sample was significantly different from the all the other samples (p < 0.05; Table S1).
The mean tree radial growth trend (trendTRW) values were negative in 99 out of 135 trees, varying also widely among individual trees, from −0.063 in the son4 tree to 0.040 in the bog9 tree (Table S1). On average, they were slightly negative in all the samples except BOGR (0.001 ± 0.003), varying from −0.022 ± 0.003 in SON to −0.012 ± 0.002 in TUIM, −0.008 ± 0.002 in KAM, and −0.004 ± 0.002 in BID (Table S1). The SON sample was significantly different from all the other samples, and the TUIM sample was also significantly different from the BOGR and BID samples (Table S1).
The growth practically completely ceased (Rt = 0) in 21 trees: bogr1, bogr3, bogr7, bogr9, bogr12, bogr14, kam17, and kam18 during both drought periods 1999 and 2015; tuim2 and tuim26 during the drought period of 1951; kam3, kam20, kam23, kam25, kam26, tuim8, tuim13, tuim15, tuim16, tuim26 during the drought period of 1999; and tuim14 during the drought period of 2015. The resistance (Rt) index very widely varied among individual trees, from Rt4 = 0.00173 in the bogr10 tree during the drought period of 1999 to Rt1 = 2.75 in the son30 tree during the drought period of 1951 (Table S1). Among all the drought periods studied, the highest average resistance index was observed for the drought period of 1963–1965 (Rt2 = 0.91 ± 0.03). Among all the population samples, the highest mean resistance index values were observed in the SON population sample for all the drought periods (Rt1 = 1.26 ± 0.10, Rt3 = 0.95 ± 0.04, Rt4 = 0.94 ± 0.06, Rt5 = 0.70 ± 0.07), except for the 1963–1965 period (Rt2 = 0.71 ± 0.03).
The recovery (Rc) index varied extremely widely among individual trees, from Rc1 = 0.26 in the son18 tree during the drought period of 1951 to as large a value as Rc4 = 290.04 in the bogr10 tree during the drought period of 1999 (Table S1). The highest average value of the Rc index was observed for the 1999 drought (8.31 ± 3.09). For the droughts of 1951 and 1974–1976, the highest Rc values were observed in the KAM population (Rc1 = 4.48 ± 1.31 and Rc3 = 1.40 ± 0.08, respectively); for the droughts of 1963–1965 and 1999, the highest Rc values were observed in the BOGR population (Rc2 = 1.33 ± 0.06 and Rc4 = 24.74 ± 15.38, respectively); and for the 2015 drought, the highest average value recovery index was observed in the TUIM population (Rc5 = 6.29 ± 1.34). The SON population showed the lowest Rc values (significantly different from the other populations) for all the drought periods.
The resilience (Rs) index varied very widely among individual, from Rs4 = 0.21 in the son23 tree during the drought period of 1999 to Rs5 = 2.83 in the kam26 tree during the drought period of 2015 (Table S1). The average value of the Rs index for 136 trees varied from Rs4 = 0.68 ± 0.02 for the 1999 drought to Rs5 = 1.33 ± 0.04 for the 2015 drought. Among the population samples, the highest average values of the Rs index were observed for trees of the KAM population for the droughts of 1951 and 1963–1965 (Rs1 = 1.01 ± 0.04 and Rs2 = 1.30 ± 0.07, respectively, Table S1) and for trees of the SON, BID, and TUIM populations for the droughts of 1974–1976, 1999, and 2015 (Rs3 = 0.89 ± 0.05, Rs4 = 0.85 ± 0.03, and 1.69 ± 0.07, respectively, Table S1). For three of the five drought periods, 1963–1965, 1999, and 2015, the lowest values of the Rs index were observed in the SON population (Rs2 = 0.60 ± 0.04, Rs4 = 0.48 ± 0.03, Rs5 = 0.90 ± 0.07, Table S1), which was significantly different from the other populations (Table S1).
The relative resilience (RRs) index varied also very widely among individual trees, from RRs1 = −1.75 in the son30 tree during the drought period of 1951 to RRs5 = 2.15 in the tuim1 tree during the drought period of 1951 (Table S1). The average value of the RRs index for all the trees varied from RRs5 = 0.78 ± 0.04 for the 2015 drought to RRs2 = 0.09 ± 0.02 for the 1963–1965 drought. The highest values of RRs were observed for the 1951 drought for trees of the KAM population (RRs1 = 0.59 ± 0.05), for the 1963–1965 drought for trees of the BOGR population (RRs2 = 0.25 ± 0.04), and for the last three droughts for trees of the TUIM population (RRs3 = 0.16 ± 0.03, RRs4 = 0.50 ± 0.04, and RRs5 = 1.20 ± 0.10, respectively, Table S1). The lowest values of the RRs index were observed in the SON population for all five drought periods (RRs1 = −0.50 ± 0.10, RRs2 = −0.11 ± 0.04, RRs3 = −0.06 ± 0.05, RRs4 = −0.46 ± 0.04, RRs5 = 0.20 ± 0.08, respectively, Table S1).
In general, the obtained dendrophenotypic data demonstrate that individual trees had very different individual responses to climatic stresses, such as drought, which well justifies the main objective of this study to associate the variation of individual dendrophenotypes that reflect individual tree responses to drought with the genetic variation of the large number of genetic markers genotyped in the same trees.
3.2. SNP Calling
For 150 larch tree samples, 1.8 billion 100 bp long reads were obtained via ddRADseq sequencing. Fourteen trees were excluded from further analysis because of insufficient sequencing quality. After the initial processing and quality filtering, approximately 1.4 billion reads with lengths from 32 to 92 bp were selected for further analysis, with an average of 10,496,058 ± 391,691 reads per sample. On average, 97% of the reads for each sample were successfully mapped to the Siberian larch reference genome. In total, 11,550 SNPs that met the filtering criteria were selected. For pairs of SNPs with LD (r2 > 0.8), only one SNP was selected for further analysis. The final dataset contained 9742 biallelic SNPs genotyped in 136 Siberian larch trees (Data S1).
3.3. Genetic Structure of Populations
For each sample, general parameters of genetic variation, such as the nucleotide diversity (π), observed (HO) and expected (HE) heterozygosities, and fixation index (FIS), were calculated and are presented in Table 3. The levels of heterozygosity based on all 9742 SNPs was almost the same as those based on the 371 SNPs significantly associated with the variation of adaptive dendrophenotypes variation, although the latter ones were slightly higher if they were calculated for all the trees together as a single population.
Table 3.
Values of mean nucleotide diversity (π), observed (HO) and expected (HE) heterozygosities, individual fixation index (FIS), and their associated standard errors (s.e.) calculated for five population samples of Siberian larch based on all 9742 SNPs and 371 SNPs significantly associated with the variation of adaptive dendrophenotypes.
The degree of genetic differentiation was assessed using the FST parameter (Table 4). The maximum FST value was between the SON and BOG samples (0.022), and the minimum value between the TUI and BOG (0.007). The low pairwise FST values obtained indicate that the samples were relatively poorly differentiated and belong to genetically similar populations.
Table 4.
Pairwise FST fixation indexes with 95%confidence intervals in brackets calculated between 5 population samples.
PCA was performed using allele frequency data to identify also the population structure. The analysis revealed that the studied samples do not form clearly defined unambiguous clusters, although two tentative clusters can presumably be distinguished: BID, BOG, and TUI form one cluster, and the SON and KAM samples form another (Figure 3).
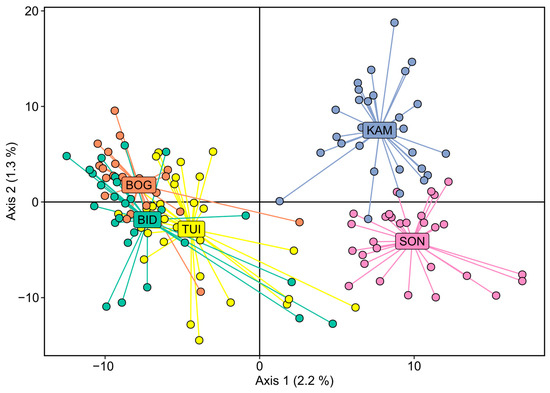
Figure 3.
Principal component analysis (PCA) results for five Siberian larch population samples.
In addition, for a better understanding of the population structure and further association analysis, a search for the most probable number of clusters or subpopulations K for K from 1 to 20 was conducted, with 20 replicates for each number K, and estimates of the contribution of each cluster to individual admixtures of trees (Q-values) were obtained. The ΔK method for selecting the most probable number K showed that the most probable numbers are K = 2 or K = 3. The contributions (“admixture”) of each cluster to individual trees (Q-values) according to the results of the Admixture program are shown in Figure 4. The sNMF algorithm, which was also used to calculate the Q-value matrix, showed similar results. When the number of clusters is K = 2, the trees belonging to the SON and KAM samples represent a separate cluster and are genetically different from the trees collected at other sites.
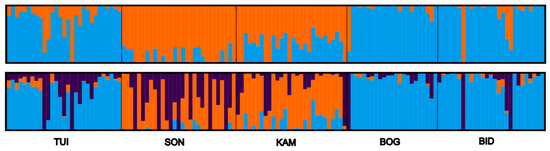
Figure 4.
Admixture of each of the two (K = 2, above) and three (K= 3, below) clusters in individual Siberian larch trees representing five populations (TUI, SON, KAM, BOG, and BID) highlighted by two (for K = 2) or three (for K = 3) different colors, respectively.
According to the Admixture analysis, all the genotypes were divided into two groups: the first group included the TUI, BOG, and BID populations, and the second group was SON–KAM.
AMOVA was conducted and Wright’s fixation indices (F-indices) were calculated for each hierarchical level (Table 5). The highest level of genetic variation was within populations (98.2%).
Table 5.
AMOVA results for five population samples of Siberian larch.
The correlation of the matrices of the pairwise geographic distances with the matrices of the pairwise genetic differences was calculated using the Mantel test: for 84 trees of the KAM, BID, and TUI samples and for 5 populations using average coordinates and Nei’s genetic distance matrix. The resulting test p-values indicate that there is no relationship between the geographic and genetic distances of populations (p = 0.171 and p = 0.558, respectively).
3.4. Associations between Dendrophenotypes and Individual Heterozygosity
For each sample, the individual level of heterozygosity was calculated, with an average 0.144 for all the samples. The lowest average values of individual heterozygosity were obtained for the SON population (0.112 ± 0.005) and the highest for the BOG population (0.164 ± 0.005). The Pearson’s and Spearman’s correlation coefficients of individual heterozygosity and each dendrophenotype were calculated (Table 6). These coefficients were calculated both for data not standardized by chronology and for indices calculated after the standardization procedure. The results were very similar; therefore, Table 6 presents coefficients only based on the unstandardized data.
Table 6.
Pearson’s product-moment (r) and Spearman’s rank (rS) correlation coefficients between dendrophenotypes and individual heterozygosity.
There was a significant positive relationship between the recovery index (Rc), relative resilience index (RRs), and individual heterozygosity for all five drought periods (p-value < 0.05). The resistance index (Rt) showed a significant negative correlation with individual heterozygosity for four droughts, excluding the drought period of 1963–1965 (Rt2). The resilience index (Rs) correlated according to both the Pearson’s and Spearman’s correlation coefficients with individual heterozygosity based on the 1963–1965 and 1999 droughts, but only based on Spearman’s rank correlation coefficient for the 2015 drought data.
Dot-plot graphs of individual heterozygosity (IndHet) and dendrophenotypes (Rt, Rc, Rs, RRs, varTRW, and trendTRW), together with the Pearson’s (r) and Spearman’s rank (rS) correlation coefficients, regression coefficients (R2) and trendlines based on linear, quadratic, cubic and local polynomial regression fitting, are presented for significant cases in Figure S1.
The mean radial growth and mean radial growth trend (trendTRW) are presented in Table 7. The positive trend values mean that the growth rate was increasing over the past 30 years during the period of 1990–2019, taking into account the size–age trend, while negative values mean opposite—that it was decreasing. If the mean value of the growth index is more than one, then the trees have grown on average faster over the past 30 years than in their entire life; if less than one, then slower. The growth rate was slightly decreasing in four out of five populations, despite the fact that the trees have grown on average faster over the past 30 years than in their entire life in three out of five populations. A significant positive correlation between the radial growth trend (trendTRW) and individual heterozygosity was discovered. That is, the trees with higher heterozygosity demonstrate less of a decrease in the growth rate.
Table 7.
The mean radial growth and mean radial growth trend (trendTRW) over the past 30 years during the period of 1990–2019 in five population sites of Siberian larch.
3.5. Genotype–Dendrophenotype Associations
According to the BSLMM, the proportion of variation in dendrophenotypes explained by the available genotypes (PVE) averaged 0.77, varying from the minimum value of 0.39 for the Rt5 index to the maximum value of 0.98 for avTRW. At the same time, the proportion of genetic variation explained by the variants with a relatively large effect (PGE) was 0.44 on average and varied from 0.03 in Rc4 to 0.96 in avTRW. For 21 out of 26 dendrophenotypes, the BSLMM method found associated SNPs with PIP values >25% (the estimated frequency by which an SNP has a sparse effect in the MCMC). In total, 2523 SNPs with presumably adaptive variation were selected using the BSLMM method, 453 of which were associated with more than 1 dendrophenotype.
According to the MLM, 1440 SNPs in total were associated with at least 1 of 26 dendrophenotypes, among which 565 were associated with 2 to 8 dendrophenotypes simultaneously.
According to the GLM, 2102 SNPs in total were associated with at least 1 of 26 dendrophenotypes, among which 1179 were associated with more than 1 dendrophenotype and 1 SNP (LS.4109781.252) was associated with 10 different dendrophenotypes.
A total of 4109 significant SNPs were detected using any of the 3 methods. Among them, 965 SNPs were detected by both GLM and MLM, and 371 SNPs by all 3 methods (Figure 5).
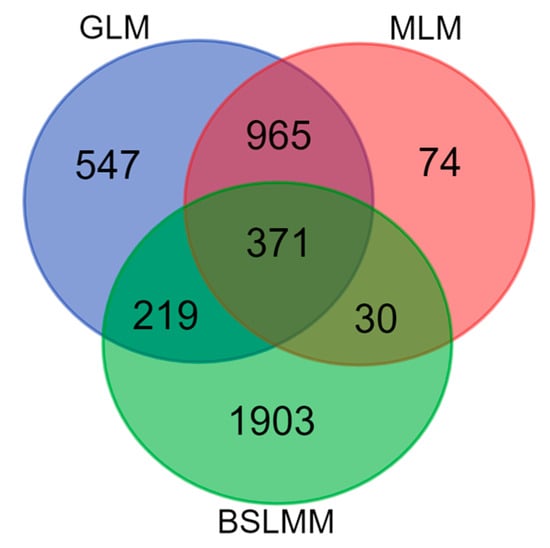
Figure 5.
Venn diagram summarizing the results of the search for SNPs associated with at least one of 26 dendrophenotypes using three methods: BSLMM, GLM and MLM.
3.6. SNP Annotation
For the 371 SNPs found by all 3 association analysis methods, we analyzed the genomic regions in which these SNPs were localized (Table S2). According to the genomic annotation data of Siberian larch, only 26 SNPs were located in scaffolds with annotated genome features, whereas the rest were located in unannotated scaffolds. The majority of the successfully annotated adaptive markers were located in intergenic regions; only five were located in the coding regions of genes, and three of them were nonsynonymous and resulted in amino acid substitutions (Table 8).
Table 8.
Annotation of 26 potentially adaptive SNPs.
For all the intervals of the nucleotide sequences (±1000 bp from the SNP or the maximum possible interval when the range of 2000 bp exceeded the scaffold size limits) containing SNPs associated with dendrophenotypes, homologs were searched in the NCBI BLAST database. Highly homologous sequences were found for 57 intervals containing SNPs, and most matches were found with genomic sequences and mostly unknown mRNAs and hypothetical proteins of white spruce (Picea glauca), Sitka spruce (Picea sitchensis), and Loblolly pine (Pinus taeda). Only for eight intervals were homologous sequences containing annotated genes or other structural units of the plant genome found in the NCBI GenBank database. For example, for the SNP locus LS.4643215.2651, which is associated with the dendrophenotype avLn according to GLM and MLM, as well as with the Rc3 index according to BSLMM, a homology was found with the mRNA encoding multiprotein-bridging factor 1c (MBF1, XM_028068828) of cowpea (Vigna unguiculata). It is a transcription cofactor whose molecular function is to form a bridge between transcription factors and the basal transcription machinery. They are involved in developmental processes and stress responses [75].
SNP LS.3970711.165 associated with the dendrophenotypes Rc4 and RRs4 according to GLM and MLM and with the RRs4 index according to BSLMM is located in a locus homologous to the mRNA encoding copper methylamine oxidase-like (XM_022162594) of oilseed sunflower (Helianthus annuus), which is involved in the mechanisms of protection against pathogens [76].
SNP LS.890128.210, associated with Rs3 according to BSLMM and Rs2 according to MLM and GLM is located in a locus homologous to the gene encoding the MYB6 transcription factor of Monterey pine (Pinus radiata, KY196189), which is involved in the regulation of the biosynthesis of secondary metabolites [77].
SNP LS.3903843.2180, which is associated with five dendrophenotypes (Rc2, Rc3, Rs2, RRs2 and RRs3) according to GLM, Rc2, Rc3, RRs2 and RRs3 according to MLM, and with Rs3 according to BSLMM, is located in a locus homologous to the mRNA of RING-H2 finger protein ATL3-like of wild soybean (G. soja, XM_028350422). There are also larch annotation data for this SNP (Table 8).
SNP LS.4382060.16010, which is associated with dendrophenotypes RRs1, Rs1, Rs3, Rs5, and Rt3 according to GLM, Rs3 according to MLM, and Rc1 according to BSLMM, is located in a locus homologous to the mitochondrial gene encoding ribosomal protein S4 of eastern white pine (Pinus strobus, MN9653 08), which is involved in the formation of plant disease resistance [78].
SNP LS.29920.18803, which is associated with avLn, Rs1, and Rt4 according to GLM and MLM, Rs2 and Rt2 according to GLM, and Rc1 according to BSLMM, is located in a locus homologous to the gene encoding polygalacturonase of breadseed poppy (Papaver somniferum, XM_026530000), which is responsible for the degradation of cell wall pectin and is involved in the processes of organ aging and the response to biotic stress in plants [79].
Homologues related to retrotransposons were identified for two sequences. Thus, the interval containing SNP LS.9095140.133, which is associated with the dendrophenotype Rs4 according to GLM and MLM and with avLn according to BSLMM, was aligned to the sequence encoding the RNA-directed DNA polymerase of cabbage (Brassica oleracea, XM_013761928). The sequence containing SNP LS.4042787.3127, which is associated with dendrophenotypes RRS1, RC1, RS2, RT1 and RT3 according to GLM, with RRS1, RC1 and RT1 according to MLM, and with RS5 according to BSLMM, was homologous to the sequence of retrotransposons of maritime pine (Pinus pinaster, DQ394069) and Monterey pine (AJ004945).
4. Discussion
The results of the presented genome-wide analysis of the structure and genetic variation of natural populations of Siberian larch in the foothills of the Batenevsky Range are generally consistent with previous conclusions about the relatively weak population structure of closely located Siberian larch populations: the value of FST = 0.018 observed in this study is very close to the value of FST = 0.017 based on a larger dataset of 25,143 SNPs obtained earlier for Siberian larch in the Altai-Sayan region [80].
The genetic differentiations between two groups identified on the basis of population structure analysis (FCT), between populations within groups (FSC), and between all the populations (FST) are consistent with the results previously obtained for larch and based on a larger dataset of SNPs [80,81]. The largest proportion of the genetic variance, 98%, was within the studied samples, and only 1% of the variance was due to differences between groups.
The results of the PCA showed that the samples were weakly genetically differentiated, which was expected because of the relatively short distances between sampling sites (about 50 km). Some trees from some populations demonstrated higher genetic similarity to trees from other populations according to the results of the cluster analysis (Figure 3). This is not surprising and can be expected, since the distance between populations is only tens of kilometers, there are no clear gaps between them such as treeless areas or forests that do not include larch, and there are no pronounced geographical barriers. Thus, some gene flow and genetic exchange can be expected between these populations, especially considering that larch is a wind-pollinated and wind-propagated species with small and light winged seeds. It is possible that the observed distribution reflects the predominance of southwestern and western winds in the basin of this region in combination with landscape restrictions. In particular, the SON and KAM populations are located approximately upwind of the remaining populations. Minimal genetic differentiation was observed between the TUI and BOG populations. There was no correlation between the geographic distance and the relatedness of trees in the study area.
The lack of a significant correlation between individual heterozygosity and the avTRW and varTRW dendrophenotypes is consistent with those previously obtained by Babushkina et al. [24] for two populations of Siberian larch based on the eight most polymorphic microsatellite loci (SSRs), although in the case of varTRW, it was negative according to Spearman’s rank correlation coefficient (rS = −0.164) and almost significant (p = 0.056), which may partly indicate that increased heterozygosity stabilizes individual development, reducing the variance of wood growth. There was also no correlation between individual heterozygosity and age, average needle length, or variance in needle length.
According to recently obtained preliminary data for 124 Siberian pine (Pinus sibirica Du Tour) trees growing in the same region 150–250 km to the south of study area, there was no significant correlation between individual heterozygosity based on 13,914 biallelic SNPs and avTRW, although a significant negative correlation of the varTRW with individual heterozygosity was also found (rS = −0.303) (data not published).
The presence of a significant positive correlation between individual heterozygosity and the recovery (Rc) and relative resilience (RRs) indices for all the studied drought periods and partly the resilience (Rs) indices for three drought periods suggests that differences in the drought resistance of individual Siberian larch trees are associated with the level of individual heterozygosity, the increase in which improves the adaptive capabilities of the organism.
However, we also discovered a significant negative relationship between the level of heterozygosity and the resistance index (Rt), which directly reflects the efficiency of larch growth during the drought years in four out of five periods. Perhaps one of the adaptive mechanisms of larch involves a sharp reduction in growth during periods of drought as part of a survival strategy, which is more pronounced in trees with a higher level of individual heterozygosity. Whether this is a consequence of increased homeostasis or heterosis and overdominance is difficult to determine and requires additional research.
It is interesting to note that the confidence intervals for the correlation trends are narrower in the upper-to-middle intervals (0.14–0.15) of the heterozygosity values, and he trendlines based on the quadratic, cubic and local polynomial regression fitting better approximate the correlation between individual heterozygosity and dendrophenotypes with higher regression coefficients (Figure S1). It can be a signature of the “optimal” heterozygosity reflecting the stable individual growth and response to the stress factors and providing the maximum adaptation of an individual or a population to the environment in which the individual or population was formed and in which it now exists (in sensu [82,83,84]).
The search for genotype–phenotype associations using three different methods revealed 371 potentially adaptive SNPs. Only 26 SNPs were located in genomic regions carrying functional genes: 21 in intergenic regions and 5 in gene-coding regions. The genetic diversity summary parameters based on 371 potentially adaptive SNPs were only slightly higher than those that were based on all 9742 SNPs (Table 3). It seems that a limited number of SNPs are needed to appropriately assess genetic diversity.
It is important to note that the growth rate was slightly decreasing in four out of five populations over the past 30 years during the period of 1990–2019. This is likely related to the climate change, particularly reflecting the increased water deficit caused by warming. These observations are corroborated by recent climate-driven decreasing trends in the grain crop yields observed in the steppe territories of the study region [85]. However, creation of large water reservoirs has so far mitigated most of the drying climatic trends in the region [86] comparing to most of continental Asia, where severely declining tree growth and forest die-off were observed recently in many places on southern and lower fringes of forested areas [6,87].
5. Conclusions
Several regions of the genome and genes have been identified, the variation of which is associated with the variation of important adaptive traits, dendrophenotypes. We certainly realize the limits of the RADseq method and that the obtained genomic data could be insufficient to uncover all the genes and genetic mechanism that are responsible for adaptation to drought, although those that are found could be of interest for the scientific community. We identified several SNPs in candidate genes whose variation was associated with important adaptive dendrophenotypes. Based on these results, it can be assumed that Siberian larch has relatively high adaptive genetic variation and potential in the studied area. It seems well adapted to abiotic stresses such as droughts. However, the negative growth trend observed in four out of five populations could be a sign of the beginning negative effect of climate change. The results of this study will allow for a deeper understanding of the genetic mechanisms underlying the adaptations of larch to various climatic conditions. This study allowed us to detect important genes, and we obtained SNPs with significant adaptive variation that can be potentially used as genetic markers in the marker-aided breeding for stress tolerance as well as for creating a SNP genotyping chip for monitoring adaptive genetic variation in other larch populations, although more SNP genotyping data, preferably based on the whole-genome sequencing, are required for developing a comprehensive high-density SNP genotyping assay to study larch. The presented approach, which includes both dendrophenotypic and genetic data, can serve as a scientific basis for optimizing nature management, developing methods for the rational use of the studied species, identifying populations with good genetic potential and conducting environmental monitoring.
Supplementary Materials
The following supporting information can be downloaded at https://www.mdpi.com/article/10.3390/f14122358/s1, Figure S1: Dot-plot graphs of individual heterozygosity (IndHet) and dendrophenotypes (Rt, Rc, Rs, RRs, varTRW, and trendTRW) for significant cases with the Pearson’s (r) and Spearman’s rank (rS) correlation coefficients, regression coefficients (R2) and trendlines based on linear (L), quadratic (Q), cubic (C) and local polynomial (LP) regression fitting. The gray area highlights the 95% confidence interval; Table S1: Individual and mean values of 27 traits in 136 trees and 5 populations and pairwise Wilcoxon rank-sum test p-values for 27 traits adjusted according to the Benjamini–Hochberg procedure; Table S2: Annotation summary of 371 SNPs; Data S1: Genotypes of 9742 SNPs in the vcf format.
Author Contributions
Conceptualization, K.V.K.; methodology, S.V.N., D.F.Z., L.V.B., E.A.B. and K.V.K.; software, S.V.N., V.V.S., D.F.Z. and L.V.B.; validation, S.V.N.; formal analysis, S.V.N., N.V.O., V.V.S., D.F.Z., L.V.B., E.A.B. and K.V.K.; investigation, S.V.N., N.V.O., V.V.S., D.F.Z., L.V.B., E.A.B. and K.V.K.; resources, N.V.O., D.F.Z., L.V.B., E.A.B. and K.V.K.; data curation, S.V.N., V.V.S., D.F.Z., L.V.B. and E.A.B.; writing—original draft preparation, S.V.N. and K.V.K.; writing—review and editing, S.V.N., N.V.O., V.V.S., D.F.Z., L.V.B., E.A.B. and K.V.K.; visualization, S.V.N. and K.V.K.; supervision, N.V.O., D.F.Z., E.A.B. and K.V.K.; project administration, K.V.K., N.V.O. and E.A.B.; funding acquisition, K.V.K. All authors have read and agreed to the published version of the manuscript.
Funding
The Siberian larch and Siberian stone pine parts used in this study were supported by the two Russian Science Foundation grants 19-14-00120 and 22-14-00083, respectively.
Data Availability Statement
The data presented in this study are all available in the article and the files with the supplementary material.
Acknowledgments
The authors are grateful to the Department of High-Performance Computing of the Siberian Federal University and to its head, Dmitry A. Kuzmin, for providing access to the high-performance computer cluster.
Conflicts of Interest
The authors declare no conflict of interest.
References
- Mukherjee, S.; Mishra, A.; Trenberth, K.E. Climate Change and Drought: A Perspective on Drought Indices. Curr. Clim. Chang. Rep. 2018, 4, 145–163. [Google Scholar] [CrossRef]
- Cook, B.I.; Mankin, J.S.; Anchukaitis, K.J. Climate Change and Drought: From Past to Future. Curr. Clim. Chang. Rep. 2018, 4, 164–179. [Google Scholar] [CrossRef]
- Gauthier, S.; Bernier, P.; Kuuluvainen, T.; Shvidenko, A.Z.; Schepaschenko, D.G. Boreal forest health and global change. Science 2015, 349, 819–822. [Google Scholar] [CrossRef] [PubMed]
- Brecka, A.F.J.; Shahi, C.; Chen, H.Y.H. Climate change impacts on boreal forest timber supply. For. Policy Econ. 2018, 92, 11–21. [Google Scholar] [CrossRef]
- Krutovsky, K.V. Dendrogenomics is a new interdisciplinary field of research of the adaptive genetic potential of forest tree populations integrating dendrochronology, dendroecology, dendroclimatology, and genomics. Russ. J. Genet. 2022, 58, 1273–1286. [Google Scholar] [CrossRef]
- Liu, H.; Park Williams, A.; Allen, C.D.; Guo, D.; Wu, X.; Anenkhonov, O.A.; Liang, E.; Sandanov, D.V.; Yin, Y.; Qi, Z.; et al. Rapid warming accelerates tree growth decline in semi-arid forests of inner Asia. Global Chang. Biol. 2013, 19, 2500–2510. [Google Scholar] [CrossRef] [PubMed]
- Zhirnova, D.F.; Belokopytova, L.V.; Krutovsky, K.V.; Kholdaenko, Y.A.; Babushkina, E.A.; Vaganov, E.A. Spatial-coherent dynamics and climatic signals in the radial growth of Siberian stone pine (Pinus sibirica Du Tour) in subalpine stands along the Western Sayan Mountains. Forests 2022, 13, 1994. [Google Scholar] [CrossRef]
- Belokopytova, L.V.; Zhirnova, D.F.; Krutovsky, K.V.; Mapitov, N.B.; Vaganov, E.A.; Babushkina, E.A. Species- and age-specific growth reactions to extreme droughts of the keystone tree species across forest-steppe and sub-taiga habitats of South Siberia. Forests 2022, 13, 1027. [Google Scholar] [CrossRef]
- Kharuk, V.I.; Petrov, I.A.; Dvinskaya, M.L.; Im, S.T.; Shushpanov, A.S. Comparative reaction of larch (Larix sibirica Ledeb.) radial increment on climate change in the forest steppe and highlands of Southern Siberia. Contemp. Probl. Ecol. 2018, 11, 388–395. [Google Scholar] [CrossRef]
- Dulamsuren, C.; Hauck, M.; Leuschner, C. Recent drought stress leads to growth reductions in Larix sibirica in the western Khentey, Mongolia. Glob. Chang. Biol. 2010, 16, 3024–3035. [Google Scholar] [CrossRef]
- Barchenkov, A.P.; Petrov, I.A.; Shushpanov, A.S.; Golyukov, A.S. Climatic response of larch (Larix sp.) radial increment in provenances on the Krasnoyarsk forest steppe. Contemp. Probl. Ecol. 2023, 16, 620–630. [Google Scholar] [CrossRef]
- Abaimov, A.P. Geographical distribution and genetics of Siberian larch species. In Permafrost Ecosystems. Ecological Studies; Osawa, A., Zyryanova, O., Matsuura, Y., Kajimoto, T., Wein, R., Eds.; Springer: Dordrecht, The Netherlands, 2010; Volume 209, pp. 41–58. [Google Scholar] [CrossRef]
- Semerikov, V.L.; Iroshnikov, A.I.; Lascoux, M. Mitochondrial DNA variation pattern and postglacial history of the Siberian larch (Larix sibirica Ledeb.). Russ. J. Ecol. 2007, 38, 147–154. [Google Scholar] [CrossRef]
- Bobrov, E.G. Forest-Forming Conifers of the USSR; Nauka Publishing: Leningrad, Russia, 1978; 188p. [Google Scholar]
- Urban, J.; Rubtsov, A.V.; Urban, A.V.; Shashkin, A.V.; Benkova, V.E. Canopy transpiration of a Larix sibirica and Pinus sylvestris forest in Central Siberia. Agric. For. Meteorol. 2019, 271, 64–72. [Google Scholar] [CrossRef]
- Dulamsuren, C.; Hauck, M.; Bader, M.; Oyungerel, S.; Osokhjargal, D.; Nyambayar, S.; Leuschner, C. The different strategies of Pinus sylvestris and Larix sibirica to deal with summer drought in a northern Mongolian forest–steppe ecotone suggest a future superiority of pine in a warming climate. Can. J. For. Res. 2009, 39, 2520–2528. [Google Scholar] [CrossRef]
- Schweingruber, F.H. Tree Rings and Environment Dendroecology; Haupt: Berne, Switzerland; Stuttgart, Germany; Vienna, Austria, 1996; ISBN 978-3-258-05458-2. [Google Scholar]
- Fritts, H.C. Tree Rings and Climate; Blackburn Press: Caldwell, NJ, USA, 2001; ISBN 978-1-930665-39-2. [Google Scholar]
- Vaganov, E.A.; Hughes, M.K.; Shashkin, A.V. Growth Dynamics of Conifer Tree Rings: Images of Past and Future Environments; Ecological Studies; Springer: Berlin/Heidelberg, Germany, 2006; ISBN 978-3-540-26086-8. [Google Scholar]
- Babushkina, E.A.; Zhirnova, D.F.; Belokopytova, L.V.; Tychkov, I.I.; Vaganov, E.A.; Krutovsky, K.V. Response of four tree species to changing climate in a moisture-limited area of South Siberia. Forests 2019, 10, 999. [Google Scholar] [CrossRef]
- Belokopytova, L.V.; Babushkina, E.A.; Zhirnova, D.F.; Panyushkina, I.P.; Vaganov, E.A. Climatic response of conifer radial growth in forest-steppes of South Siberia: Comparison of three approaches. Contemp. Probl. Ecol. 2018, 11, 366–376. [Google Scholar] [CrossRef]
- Belokopytova, L.V.; Zhirnova, D.F.; Meko, D.M.; Babushkina, E.A.; Vaganov, E.A.; Krutovsky, K.V. Tree rings reveal the impact of soil temperature on larch growth in the forest-steppe of Siberia. Forests 2021, 12, 1765. [Google Scholar] [CrossRef]
- Rozenberg, P.; Pâques, L.; Huard, F.; Roques, A. Direct and Indirect analysis of the elevational shift of larch budmoth outbreaks along an elevation gradient. Front. For. Glob. Chang. 2020, 3, 86. [Google Scholar] [CrossRef]
- Babushkina, E.A.; Vaganov, E.A.; Grachev, A.M.; Oreshkova, N.V.; Belokopytova, L.V.; Kostyakova, T.V.; Krutovsky, K.V. The effect of individual genetic heterozygosity on general homeostasis, heterosis and resilience in Siberian larch (Larix sibirica Ledeb.) using dendrochronology and microsatellite loci genotyping. Dendrochronologia 2016, 38, 26–37. [Google Scholar] [CrossRef]
- Johnson, J.S.; Gaddis, K.D.; Cairns, D.M.; Konganti, K.; Krutovsky, K.V. Landscape genomic insights into the historic migration of mountain hemlock in response to Holocene climate change. Am. J. Bot. 2017, 104, 439–450. [Google Scholar] [CrossRef]
- Johnson, J.S.; Chhetri, P.; Krutovsky, K.V.; Cairns, D.M. Growth and its relationship to individual genetic diversity of mountain hemlock (Tsuga mertensiana) at alpine treeline in Alaska: Combining dendrochronology and genomics. Forests 2017, 8, 418. [Google Scholar] [CrossRef]
- Johnson, J.S.; Gaddis, K.D.; Cairns, D.M.; Krutovsky, K.V. Seed dispersal at alpine treeline: An assessment of seed movement within the alpine treeline ecotone. Ecosphere 2017, 8, e01649. [Google Scholar] [CrossRef]
- Depardieu, C.; Gérardi, S.; Nadeau, S.; Parent, G.J.; Mackay, J.; Lenz, P.; Lamothe, M.; Girardin, M.P.; Bousquet, J.; Isabel, N. Connecting tree-ring phenotypes, genetic associations and transcriptomics to decipher the genomic architecture of drought adaptation in a widespread conifer. Mol. Ecol. 2021, 30, 3898–3917. [Google Scholar] [CrossRef] [PubMed]
- Cappa, E.P.; Klutsch, J.G.; Sebastian-Azcona, J.; Ratcliffe, B.; Wei, X.; Da Ros, L.; Liu, Y.; Chen, C.; Benowicz, A.; Sadoway, S.; et al. Integrating genomic information and productivity and climate-adaptability traits into a regional white spruce breeding program. PLoS ONE 2022, 17, e0264549. [Google Scholar] [CrossRef] [PubMed]
- Fasanella, M.; Suarez, M.L.; Hasbún, R.; Premoli, A.C. Individual-based dendrogenomic analysis of forest dieback driven by extreme droughts. Can. J. For. Res. 2021, 51, 420–432. [Google Scholar] [CrossRef]
- Heer, K.; Behringer, D.; Piermattei, A.; Bässler, C.; Brandl, R.; Fady, B.; Jehl, H.; Liepelt, S.; Lorch, S.; Piotti, A.; et al. Linking Dendroecology and association genetics in natural populations: Stress responses archived in tree rings associate with SNP genotypes in silver fir (Abies alba Mill.). Mol. Ecol. 2018, 27, 1428–1438. [Google Scholar] [CrossRef]
- Cook, E.R.; Kairiukstis, L.A. (Eds.) Methods of Dendrochronology; Springer: Dordrecht, The Netherlands, 1990; ISBN 978-90-481-4060-2. [Google Scholar]
- Rinn, F. TSAP-Win: Time Series Analysis and Presentation for Dendrochronology and Related Applications. Version 0.55 User Reference. Heidelberg, Germany. 2003. Available online: https://software.rinntech.com/tsap (accessed on 14 October 2023).
- Holmes, R.L. Computer-assisted quality control in tree-ring dating and measurement. Tree-Ring Bull. 1983, 43, 69–78. [Google Scholar]
- Zhirnova, D.F.; Babushkina, E.A.; Belokopytova, L.V.; Vaganov, E.A. To which side are the scales swinging? Growth stability of Siberian larch under permanent moisture deficit with periodic droughts. For. Ecol. Manag. 2020, 459, 117841. [Google Scholar] [CrossRef]
- Lloret, F.; Keeling, E.G.; Sala, A. Components of tree resilience: Effects of successive low-growth episodes in old ponderosa pine forests. Oikos 2011, 120, 1909–1920. [Google Scholar] [CrossRef]
- Cook, E.R.; Krusic, P.J. Program ARSTAN: A Tree-Ring Standardization Program Based on Detrending and Autoregressive Time Series Modeling, with Interactive Graphics; Lamont-Doherty Earth Observatory, Columbia University: Palisades, NY, USA, 2005; 14p. [Google Scholar]
- R Core Team. R: A Language and Environment for Statistical Computing; R Foundation for Statistical Computing: Vienna, Austria, 2013; Available online: https://www.r-project.org (accessed on 14 October 2023).
- Porebski, S.; Bailey, L.G.; Baum, B.R. Modification of a CTAB DNA extraction protocol for plants containing high polysaccharide and polyphenol components. Plant Mol. Biol. Rep. 1997, 15, 8–15. [Google Scholar] [CrossRef]
- Peterson, B.K.; Weber, J.N.; Kay, E.H.; Fisher, H.S.; Hoekstra, H.E. Double digest RADseq: An inexpensive method for de novo SNP discovery and genotyping in model and non-model species. PLoS ONE 2012, 7, e37135. [Google Scholar] [CrossRef] [PubMed]
- Parchman, T.L.; Gompert, Z.; Mudge, J.; Schilkey, F.D.; Benkman, C.W.; Buerkle, C.A. Genome-wide association genetics of an adaptive trait in lodgepole pine: Association mapping of serotiny. Mol. Ecol. 2012, 21, 2991–3005. [Google Scholar] [CrossRef] [PubMed]
- Catchen, J.; Hohenlohe, P.A.; Bassham, S.; Amores, A.; Cresko, W.A. Stacks: An analysis tool set for population genomics. Mol. Ecol. 2013, 22, 3124–3140. [Google Scholar] [CrossRef] [PubMed]
- Kuzmin, D.A.; Feranchuk, S.I.; Sharov, V.V.; Cybin, A.N.; Makolov, S.V.; Putintseva, Y.A.; Oreshkova, N.V.; Krutovsky, K.V. Stepwise large genome assembly approach: A case of Siberian larch (Larix sibirica Ledeb.). BMC Bioinf. 2019, 20, 37. [Google Scholar] [CrossRef] [PubMed]
- Langmead, B.; Salzberg, S.L. Fast gapped-read alignment with Bowtie 2. Nat. Methods 2012, 9, 357–359. [Google Scholar] [CrossRef]
- Bradbury, P.J.; Zhang, Z.; Kroon, D.E.; Casstevens, T.M.; Ramdoss, Y.; Buckler, E.S. TASSEL: Software for association mapping of complex traits in diverse samples. Bioinformatics 2007, 23, 2633–2635. [Google Scholar] [CrossRef] [PubMed]
- Pembleton, L.W.; Cogan, N.O.I.; Forster, J.W. St AMPP: An R package for calculation of genetic differentiation and structure of mixed-ploidy level populations. Mol. Ecol. Resour. 2013, 13, 946–952. [Google Scholar] [CrossRef] [PubMed]
- Dray, S.; Dufour, A.-B. The Ade4 package: Implementing the duality diagram for ecologists. J. Stat. Soft. 2007, 22, 1–20. [Google Scholar] [CrossRef]
- Frichot, E.; François, O. LEA: An R package for landscape and ecological association studies. Methods Ecol. Evol. 2015, 6, 925–929. [Google Scholar] [CrossRef]
- Mussmann, S.M.; Douglas, M.R.; Chafin, T.K.; Douglas, M.E. AdmixPipe: Population analyses in admixture for non-model organisms. BMC Bioinf. 2020, 21, 337. [Google Scholar] [CrossRef]
- Excoffier, L.; Lischer, H.E.L. Arlequin suite ver 3.5: A new series of programs to perform population genetics analyses under Linux and Windows. Mol. Ecol. Resour. 2010, 10, 564–567. [Google Scholar] [CrossRef] [PubMed]
- Oksanen, J.; Simpson, G.; Blanchet, F.; Kindt, R.; Legendre, P.; Minchin, P.; O’Hara, R.; Solymos, P.; Stevens, M.; Szoecs, E.; et al. Vegan: Community Ecology Package. R Package Version 2.6-5. 2023. Available online: https://github.com/vegandevs/vegan (accessed on 14 October 2023).
- Zhou, X.; Carbonetto, P.; Stephens, M. Polygenic Modeling with Bayesian Sparse Linear Mixed Models. PLoS Genet. 2013, 9, e1003264. [Google Scholar] [CrossRef] [PubMed]
- Bondar, E.I.; Feranchuk, S.I.; Miroshnikova, K.A.; Sharov, V.V.; Kuzmin, D.A.; Oreshkova, N.V.; Krutovsky, K.V. Annotation of Siberian larch (Larix sibirica Ledeb.) nuclear genome—One of the most cold-resistant tree species in the only deciduous genus in Pinaceae. Plants 2022, 11, 2062. [Google Scholar] [CrossRef] [PubMed]
- Doran, A.G.; Creevey, C.J. Snpdat: Easy and rapid annotation of results from de novo SNP discovery projects for model and non-model organisms. BMC Bioinform. 2013, 14, 45. [Google Scholar] [CrossRef] [PubMed]
- Clark, K.; Karsch-Mizrachi, I.; Lipman, D.J.; Ostell, J.; Sayers, E.W. GenBank. Nucleic Acids Res. 2016, 44, D67–D72. [Google Scholar] [CrossRef] [PubMed]
- Duan, F.; Ding, J.; Lee, D.; Lu, X.; Feng, Y.; Song, W. Overexpression of SoCYP85A1, a spinach cytochrome P450 gene in transgenic tobacco enhances root development and drought stress tolerance. Front. Plant Sci. 2017, 8, 1909. [Google Scholar] [CrossRef] [PubMed]
- Rao, M.J.; Xu, Y.; Tang, X.; Huang, Y.; Liu, J.; Deng, X.; Xu, Q. CsCYT75B1, a citrus CYTOCHROME P450 gene, is involved in accumulation of antioxidant flavonoids and induces drought tolerance in transgenic Arabidopsis. Antioxidants 2020, 9, 161. [Google Scholar] [CrossRef]
- Xu, W.; Purugganan, M.M.; Polisensky, D.H.; Antosiewicz, D.M.; Fry, S.C.; Braam, J. Arabidopsis TCH4, regulated by hormones and the environment, encodes a xyloglucan endotransglycosylase. Plant Cell 1995, 7, 1555–1567. [Google Scholar] [CrossRef]
- Zhu, J.; Lee, B.-H.; Dellinger, M.; Cui, X.; Zhang, C.; Wu, S.; Nothnagel, E.A.; Zhu, J.-K. A Cellulose synthase-like protein is required for osmotic stress tolerance in Arabidopsis: SOS6 is important for osmotic stress tolerance in plants. Plant J. 2010, 63, 128–140. [Google Scholar] [CrossRef]
- Jinu, J.; Visarada, K.B.R.S.; Kanti, M.; Malathi, V.M. Dehydration stress influences the expression of brevis radix gene family members in sorghum (Sorghum bicolor). Proc. Indian Natl. Sci. Acad. 2022, 88, 324–335. [Google Scholar] [CrossRef]
- Kim, S.J.; Kim, W.T. Suppression of Arabidopsis RING E3 ubiquitin ligase AtATL78 increases tolerance to cold stress and decreases tolerance to drought stress. FEBS Lett. 2013, 587, 2584–2590. [Google Scholar] [CrossRef] [PubMed]
- Suh, J.Y.; Kim, S.J.; Oh, T.R.; Cho, S.K.; Yang, S.W.; Kim, W.T. Arabidopsis Tóxicos En Levadura 78 (AtATL78) Mediates ABA-dependent ROS signaling in response to drought stress. Biochem. Biophys. Res. Commun. 2016, 469, 8–14. [Google Scholar] [CrossRef]
- Wang, W.; Wu, Y.; Shi, R.; Sun, M.; Li, Q.; Zhang, G.; Wu, J.; Wang, Y.; Wang, W. Overexpression of wheat α-mannosidase gene TaMP impairs salt tolerance in transgenic Brachypodium distachyon. Plant Cell Rep. 2020, 39, 653–667. [Google Scholar] [CrossRef]
- Liang, L.; Wang, Q.; Song, Z.; Wu, Y.; Liang, Q.; Wang, Q.; Yang, J.; Bi, Y.; Zhou, W.; Fan, L.-M. O-fucosylation of CPN20 by SPINDLY derepresses abscisic acid signaling during seed germination and seedling development. Front. Plant Sci. 2021, 12, 724144. [Google Scholar] [CrossRef] [PubMed]
- Simpson, P.J.; Tantitadapitak, C.; Reed, A.M.; Mather, O.C.; Bunce, C.M.; White, S.A.; Ride, J.P. Characterization of two novel aldo–keto reductases from Arabidopsis: Expression patterns, broad substrate specificity, and an open active-site structure suggest a role in toxicant metabolism following stress. J. Mol. Biol. 2009, 392, 465–480. [Google Scholar] [CrossRef]
- Seo, Y.S.; Kim, E.Y.; Kim, J.H.; Kim, W.T. Enzymatic characterization of Class I DAD1-like acylhydrolase members targeted to chloroplast in Arabidopsis. FEBS Lett. 2009, 583, 2301–2307. [Google Scholar] [CrossRef] [PubMed]
- Oliw, E.H. Plant and Fungal Lipoxygenases. Prostaglandins Other Lipid Mediat. 2002, 68, 313–323. [Google Scholar] [CrossRef] [PubMed]
- Bateman, A.; Sandford, R. The PLAT domain: A new piece in the PKD1 puzzle. Curr. Biol. 1999, 9, R588–R590. [Google Scholar] [CrossRef]
- Disch, S.; Anastasiou, E.; Sharma, V.K.; Laux, T.; Fletcher, J.C.; Lenhard, M. The E3 ubiquitin ligase BIG BROTHER controls Arabidopsis organ size in a dosage-dependent manner. Curr. Biol. 2006, 16, 272–279. [Google Scholar] [CrossRef]
- Al-Saharin, R.; Hellmann, H.; Mooney, S. Plant E3 ligases and their role in abiotic stress response. Cells 2022, 11, 890. [Google Scholar] [CrossRef]
- Yuan, C.; Li, C.; Zhao, X.; Yan, C.; Wang, J.; Mou, Y.; Sun, Q.; Shan, S. Genome-wide identification and characterization of HSP90-RAR1-SGT1-complex members from Arachis genomes and their responses to biotic and abiotic stresses. Front. Genet. 2021, 12, 689669. [Google Scholar] [CrossRef] [PubMed]
- Song, J.; Mo, X.; Yang, H.; Yue, L.; Song, J.; Mo, B. The U-box family genes in Medicago truncatula: Key elements in response to salt, cold, and drought stresses. PLoS ONE 2017, 12, e0182402. [Google Scholar] [CrossRef] [PubMed]
- Mohapatra, M.D.; Poosapati, S.; Sahoo, R.K.; Swain, D.M. Helicase: A genetic tool for providing stress tolerance in plants. Plant Stress 2023, 9, 100171. [Google Scholar] [CrossRef]
- Zhang, Z.; Hao, Z.; Chai, R.; Qiu, H.; Wang, Y.; Wang, J.; Sun, G. Adenylsuccinate synthetase MoADE12 plays important roles in the development and pathogenicity of the rice blast fungus. J. Fungi 2022, 8, 780. [Google Scholar] [CrossRef]
- Jaimes-Miranda, F.; Chávez Montes, R.A. The Plant MBF1 protein family: A bridge between stress and transcription. J. Exp. Bot. 2020, 71, 1782–1791. [Google Scholar] [CrossRef]
- Rea, G.; Metoui, O.; Infantino, A.; Federico, R.; Angelini, R. Copper amine oxidase expression in defense responses to wounding and Ascochyta rabiei invasion. Plant Physiol. 2002, 128, 865–875. [Google Scholar] [CrossRef]
- Ambawat, S.; Sharma, P.; Yadav, N.R.; Yadav, R.C. MYB transcription factor genes as regulators for plant responses: An overview. Physiol. Mol. Biol. Plants 2013, 19, 307–321. [Google Scholar] [CrossRef]
- Gassmann, W.; Hinsch, M.E.; Staskawicz, B.J. The Arabidopsis RPS4 bacterial-resistance gene is a member of the TIR-NBS-LRR family of disease-resistance genes. Plant J. 1999, 20, 265–277. [Google Scholar] [CrossRef]
- Liu, H.; Ma, Y.; Chen, N.; Guo, S.; Liu, H.; Guo, X.; Chong, K.; Xu, Y. Overexpression of stress-inducible OsBURP16, the β subunit of polygalacturonase 1, decreases pectin content and cell adhesion and increases abiotic stress sensitivity in rice. Plant Cell Environ. 2014, 37, 1144–1158. [Google Scholar] [CrossRef]
- Novikova, S.V.; Sharov, V.V.; Oreshkova, N.V.; Simonov, E.P.; Krutovsky, K.V. Genetic adaptation of Siberian larch (Larix Sibirica Ledeb.) to high altitudes. Int. J. Mol. Sci. 2023, 24, 4530. [Google Scholar] [CrossRef]
- Novikova, S.V.; Oreshkova, N.V.; Sharov, V.V.; Semerikov, V.L.; Krutovsky, K.V. Genetic structure and geographical differentiation of Siberian larch (Larix sibirica Ledeb.) populations based on genome genotyping by sequencing. Contemp. Probl. Ecol. 2023, 16, 631–644. [Google Scholar] [CrossRef]
- Altukhov, Y.P.; Gafarov, N.I.; Krutovskii, K.V.; Dukharev, V.A. Allozyme variability in a natural population of Norway spruce (Picea abies [L.] Karst.). III. Correlation between levels of individual heterozygosity and relative number of inviable seeds. Genetika 1986, 22, 2825–2830, (In Russian, translated in English as Soviet Genetics 1987, 22, 1580–1585). [Google Scholar]
- Altukhov, Y.P. The role of balancing selection and overdominance in maintaining allozyme polymorphism. Genetica 1991, 85, 79–90. [Google Scholar] [CrossRef] [PubMed]
- Dubrova, Y.E.; Salmenkova, E.A.; Altukhov, Y.P.; Kartavtsev, Y.F.; Kalkova, E.V.; Omel’chenko, V.T. Family heterozygosity and progeny body length in pink salmon Oncorhynchus gorbuscha (Walbaum). Heredity 1995, 75, 281–289. [Google Scholar] [CrossRef][Green Version]
- Babushkina, E.A.; Belokopytova, L.V.; Zhirnova, D.F.; Shah, S.K.; Kostyakova, T.V. Climatically driven yield variability of major crops in Khakassia (South Siberia). Int. J. Biometeorol. 2018, 62, 939–948. [Google Scholar] [CrossRef]
- Zhirnova, D.F.; Belokopytova, L.V.; Meko, D.M.; Babushkina, E.A.; Vaganov, E.A. Climate change and tree growth in the Khakass-Minusinsk Depression (South Siberia) impacted by large water reservoirs. Sci. Rep. 2021, 11, 14266. [Google Scholar] [CrossRef]
- Xu, H.J.; Wang, X.P.; Zhang, X.X. Decreased vegetation growth in response to summer drought in Central Asia from 2000 to 2012. Int. J. Appl. Earth Observ. Geoinf. 2016, 52, 390–402. [Google Scholar] [CrossRef]


Disclaimer/Publisher’s Note: The statements, opinions and data contained in all publications are solely those of the individual author(s) and contributor(s) and not of MDPI and/or the editor(s). MDPI and/or the editor(s) disclaim responsibility for any injury to people or property resulting from any ideas, methods, instructions or products referred to in the content. |
© 2023 by the authors. Licensee MDPI, Basel, Switzerland. This article is an open access article distributed under the terms and conditions of the Creative Commons Attribution (CC BY) license (https://creativecommons.org/licenses/by/4.0/).