Article

Transcriptome Analysis of 5-Aminolevulinic Acid Contributing to Cold Tolerance in Tea Leaves (Camellia sinensis L.)

1
Shaanxi Provincial Bioresource Key Laboratory, College of Biological Science and Engineering, Shaanxi University of Technology, Hanzhong 723000, China
2
Qinling-Bashan Mountains Bioresources Comprehensive Development C.I.C., Hanzhong 723001, China
3
Qinba State Key Laboratory of Biological Resources and Ecological Environment, Hanzhong 723001, China
4
Hanzhong Agricultural Technology Extension and Training Center, Hanzhong 723000, China
*
Author to whom correspondence should be addressed.
Forests 2023, 14(2), 198; https://doi.org/10.3390/f14020198
Submission received: 2 November 2022 / Revised: 13 January 2023 / Accepted: 17 January 2023 / Published: 20 January 2023

Abstract

:
Tea (Camellia sinensis L.) is an important perennial cash crop and a typical subtropical plant. It is widely concerned because of its unique flavor and health benefits. In recent years, low temperatures have severely restricted the growth of tea plants and quality of tea products, especially in spring. As a common precursor for all porphyrin compounds, 5-aminolevulinic acid (ALA) is involved in photosynthesis and respiration and plays an active role in improving salt, drought and low-temperature tolerance in plants. However, it is not yet clear what affect exogenous ALA has on tea plants’ tolerance under low temperature. In the present study, we collected and deciphered the transcriptome profiles from Shaancha No. 1 leaf tissues under low temperature (−4 °C) treatment (T-4), exogenous ALA application (T-A), pretreated ALA before low temperature (T-A-4) and untreated control (T-CK). Results showed that 4990 (2375 up- and 2615 down-regulated), 223 (103 up- and 120 down-regulated) and 92 (13 up- and 79 down-regulated) differentially expression genes (DEGs) were identified at T-CK vs. T-4, T-CK vs. T-A and T-4 vs. T-A-4, respectively. Both T-4 and T-A treatments triggered a myriad of stress resistance genes up-regulated related to multiple signaling pathways by means of Kyoto Encyclopedia of Genes and Genomes (KEGG) analysis. This included MAPK, a toll-like receptor that signals pathways involved in cold resistance. However, gene ontology (GO) analysis showed that the DEGs in T-4 treatment were mainly enriched in the phenylpropanoid metabolic and redox processes that were relevant to membrane structure damage response. In contrast, the DEGs in T-A treatment were mainly enriched in cell recognition and amylase activity. Furthermore, in pairwise comparison of T-A-4 vs. T-4, the DEGs were enriched in ascorbate and aldarate, retionol, taurine and hypotaurine, glutathione metabolic pathways and two biosynthesis process including zeatin, diterpenoid biosynthesis, which might contribute to mitigating the damage caused by low temperature. Overall, these results indicated that exogenous ALA application may improve the biochemical attributes and enhance the tolerance to low temperature, which provides a valuable strategy to improve tea quality and cold stress.

1. Introduction

Tea is an ancient and attractive beverage that is consumed worldwide and has both rich flavor and healthful benefits [1]. According to written records, tea cultivation and drinking in China can be dated back to the 6th century AD [2]. Substantial nutrition research has proven that tea leaves contain various salutary ingredients, such as polyphenols, caffeine, flavonoids, vitamins and polysaccharides [3,4,5,6]. The tea plant (Camellia sinensis (L.) O. Kuntze) is the source of commercially grown tea which is distributed in China, India, Sri Lanka, Kenya and Vietnam; China has the largest planting area and greatest output of tea [7]. However, the main tea cultivation areas in China were usually subject to chilling/freezing damage over a prolonged period, which caused various symptoms in tea leaves, including red stain, scorched, coiling, fall off and black spots, consequently affecting yield and quality. Increasing evidence has shown that persistent cold stress halts plant growth by causing physiological damage and metabolic dysfunction in plants [8]. The excessive accumulation of reactive oxygen species (ROS) and malondialdehyde (MDA) in cytoplasm that is triggered by cold stress provoked cellular oxidative injury and membrane lipid peroxidation, ultimately causing irreversible damage to the cell membrane system. In addition, it has been observed in rice plants that chilling stress induced decreased chlorophyll components and depressed photosynthetic efficiency [9]. Studies have also verified that low temperature can retard the accumulation of volatile compounds in tomato fruits, causing them to lose their unique aroma and debase their quality [10]. To address this issue, research has thoroughly examined and deciphered plant molecular mechanism response to cold stress, allowing for a vast difference in breeding cultivars with cold tolerance, such as including responsive genes that are involved in the dehydration-responsive element-binding protein 1s/crepeat-binding factors (DREB-CRT/DRE) pathway, the mitogen-activated protein kinase (MAPK) cascade and transcription factors (TFs) [11]. Meanwhile, plant growth regulators (PGRs), such as 2,4-dichlorophenoxyacetate (2,4-D) and 6-Benzylaminopurine (6-BA), have been shown to play a part in plant growth regulation as well as abiotic stress alleviation [12].
Recently, 5-Aminolevulinic acid (ALA) has been proven to be a potential plant growth regulator with a molecular weight (MW) of 167.59 g mol−1 and the structural formula of C5H9NO3–HCl. ALA is widely found in bacteria, algae, plants and animals, and is an important precursor for synthesis of tetrapyrroles, such as chlorophyll, heme, siroheme, vitamin B12 and phytochromobilin [13]. It is well-established that ALA plays a pivotal role in multiple plant biological processes that occur in response to various disadvantageous circumstances, including salinity [14], drought [15], extreme temperature [16], heavy metal stress [17] and UV stress [18]. For instance, exogenous supplementation of ALA can enhance the drought tolerance of plants, improving the expression of chlorophyll biosynthesis and photosystem II genes [19]. Exposure to saline circumstances and foliar spraying of ALA can alleviate seedlings’ root inhibition and restore membrane permeability by enhancing antioxidant enzyme activities in potato, cucumber and wheat [20,21,22].
In the present study, we investigated the tea leaves under −4 °C treatment (T-4), pretreated ALA before low temperature (T-A-4), exogenous treatment of ALA (T-A) and untreated tea plants (T-CK), by integrating results from high-throughput RNA sequencing. This investigation uncovers the underlying mechanism of ALA treatment on the regulation of tea plants’ growth and provides theoretical and technical basis for the study of cold resistance in tea plants.

2. Materials and Methods

2.1. Sample Preparation and Collection

The tea plant cultivar Camellia sinensis var. Shaancha No. 1 was used in this study. Tea plant seedlings were provided by the Tea Laboratory of Hanzhong Institute of Agricultural Sciences, Shaanxi Province (longitude: E 107°2′12”, latitude: N 32°27′36”). Plant seedings aged two years with consistent growth and size were selected and planted into plastic pots. There were three biological replicates in each pot, and each treatment contained nine pots. Except for control (T-CK, normal growth), there were three treatments: 5-ALA (30 mg/L) pretreatment for two days with normal growth (T-A), cold stress (−4 °C, T-4), 5-ALA (30 mg/L) pretreatment for two days with cold stress (T-A-4). Before cold treatment, all plants were planted in the artificial climate box (25 °C, 12 h light/12 h dark). For the cold treatment, tea plant seedlings were immediately transferred from 25 °C to −4 °C and maintained in the dark. Twelve hours after the −4 °C treatment, leaves were harvested from all seedlings, then all samples were quickly frozen with liquid nitrogen before storing at −80 °C. Three independent biological replicates were conducted for each treatment.

2.2. Measurement of Soluble Sugar, Soluble Protein, and Chlorophyll Contents

The soluble protein was measured according to the method reported by Gao [23]. Photosynthesis of the leaf and the water content was tested. Net photosynthetic rate, intercellular carbon dioxide concentration and stomatal conductance were measured using a portable photosynthesis system (LI-6400; LI-COR, Lincoln, NE, USA). For leaf chamber environment, the chamber temperature, relative humidity and CO2 concentration were set at 25 °C, 70% and 400 μmol mol−1.s−1, respectively; each experiment was repeated 10 times.

2.3. RNA Extraction, Library Construction, and RNA Sequencing

Total RNA from tea leaves was extracted with TRIzol reagent (Invitrogen, Carlsbad, CA, USA) according to the manufacturer’s instructions. The RNA quality and quantity were examined using a DS-11 spectrophotometer (DeNovix, DE, USA), and the RNA integrity was confirmed using an RNA Nano 6000 Assay Kit with an Agilent 2100 Bioanalyser (Agilent Technologies, Santa Clara, CA, USA). Only RNA samples with an RNA Integrity Number (RIN) ≥7.0 were used in the subsequent analysis. Sequencing libraries were generated using NEBNext® Ultra™ RNA Library Prep Kit for Illumina® (NEB, San Diego, CA, USA) following manufacturer’s recommendations, and index codes were added to attribute sequences to each sample, which were then sequenced on the Illumina sequencing platform (Illumina HiSeq 4000, San Diego, CA, USA), and 150-bp paired-end reads were generated.

2.4. RNA-Seq Data Analysis

Raw data (raw reads) of fastq format were firstly processed through in-house perl scripts. In this step, clean data (clean reads) were obtained by removing reads containing adapter, reads containing ploy-N and low-quality reads from raw data. At the same time, Q20, Q30, GC-content and sequence duplication level of the clean data were calculated. All downstream analyses were based on clean data with high quality. Transcriptome assembly was accomplished based on the left.fq and right.fq using Trinity with min_kmer_cov set to 2 by default, and all other parameters were set to default. Gene expression levels were estimated by RSEM for each sample. Clean data were mapped back onto the assembled transcriptome, and the read count for each gene was obtained from the mapping results. Differential expression analysis of two conditions/groups was performed using the DESeq R package (1.10.1). DESeq provides statistical routines for determining differential expression in digital gene expression data using a model based on the negative binomial distribution. The resulting p-values were adjusted using the Benjamini and Hochberg’s approach for controlling the false discovery rate. Genes with FDR < 0.005 & |log2 (Foldchange)| > 1 found by DESeq were assigned as differentially expressed.

2.5. GO and KEGG Analysis

Genes were classified by GO annotation into three categories: biological process, cellular compartment and molecular function. For each category, a two-tailed Fisher’s exact test was employed to test the enrichment of the differentially expressed protein against all identified genes. The KEGG database was used to identify enriched pathways by a two-tailed Fisher’s exact test to test the enrichment of the differentially expressed genes against all identified genes. The pathways and GO terms with a p < 0.05 were considered significant. All differentially expressed genes were searched against the STRING database for protein–protein interaction analysis. All interactions with a confidence score ≥0.7 (high confidence) were used.

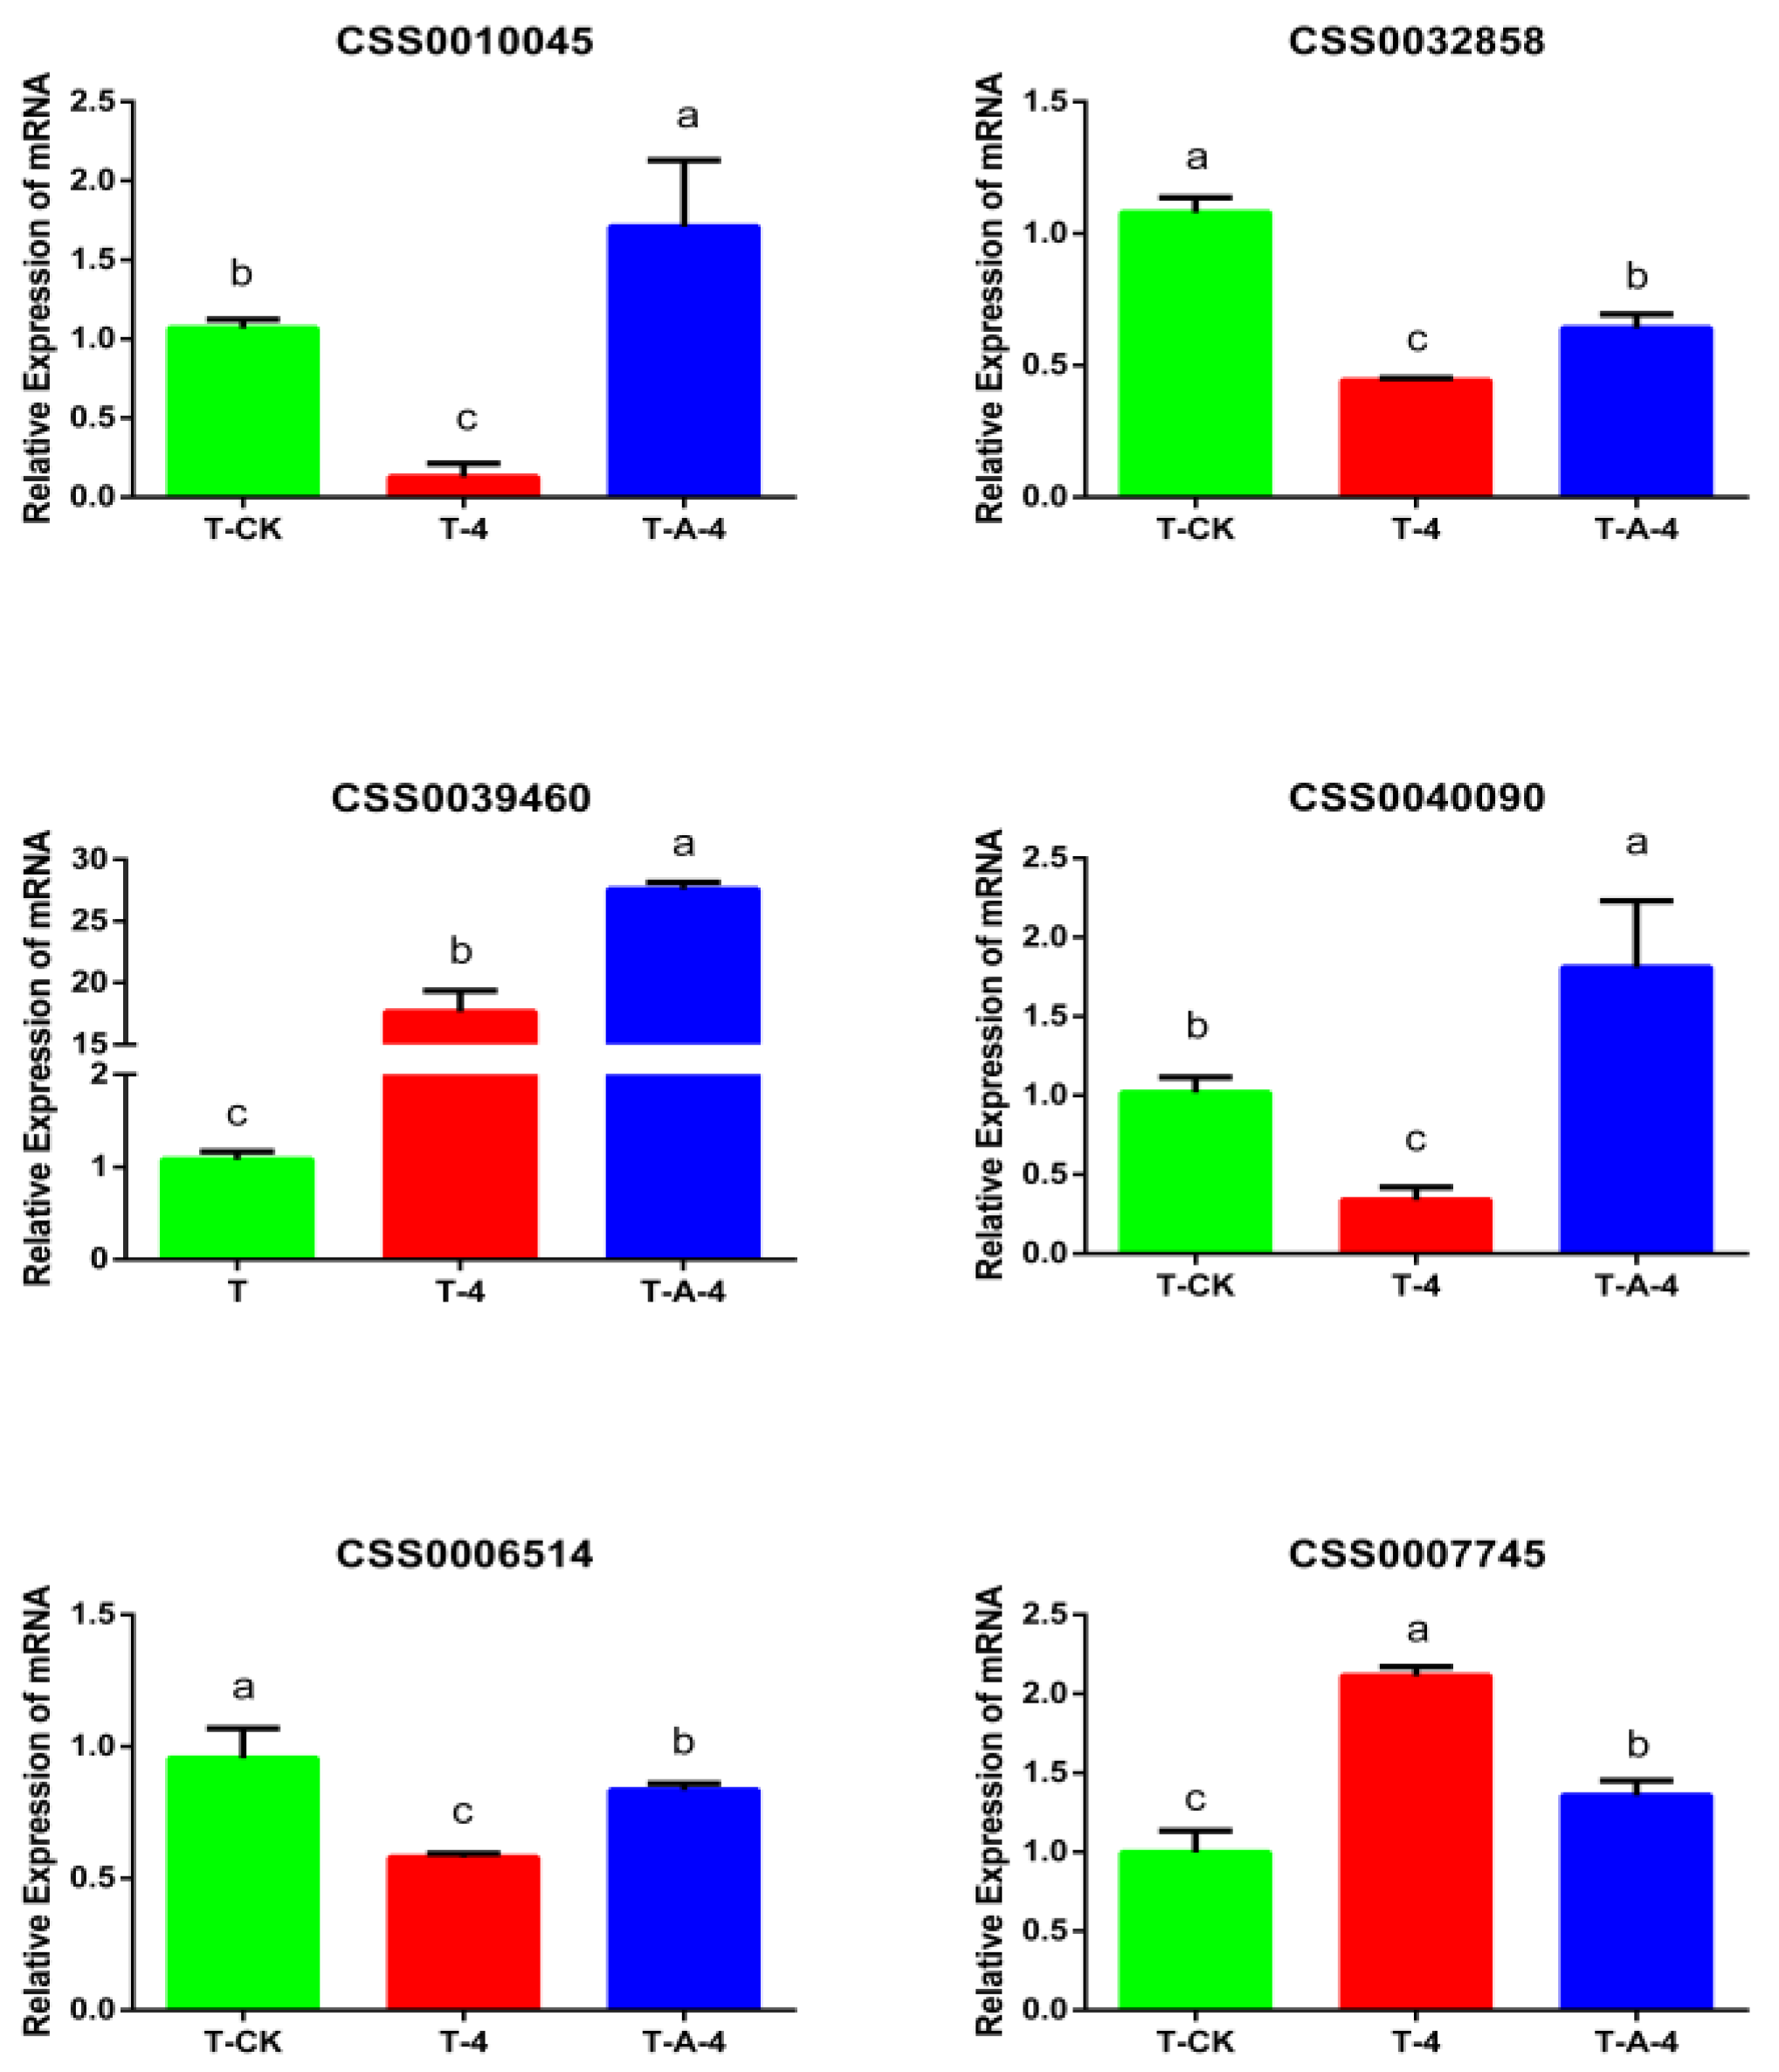
2.6. RT-PCR Analysis

Total RNA was extracted from leaves using TRIzol Reagent (Invitrogen) according to the manufacturer’s recommended protocols. The concentration of RNA was measured by a DS-11 Spectrophotometer (DeNovix, DE, USA). One microgram of total RNA was reverse transcribed into first-strand cDNA with oligo dT primers using the EasyScript All-in-One First-Strand cDNA Synthesis SuperMix for RT-qPCR (TransGen Biotech, Beijing, China) following the manufacturer’s instructions, and cDNA templates were stored at −20 °C until use. RT qPCR was performed using the same protocols as previously described [24] (qPCR Primers sequences in Table S1). The RT-qPCR protocol consisted of an initial heat activation step of 95 °C for 10 min, followed by 40 cycles of 95 °C for 15 s and 60 °C for 40 s. Three biological replicates were performed for each treatment, and each biological replicate consisted of three technical replicates.

2.7. Statistical Analyses

All the data were analyzed using SPSS Statistics 20.0 software (SPSS Inc., Chicago, IL, USA). Normality of distribution and homogeneity of variances were tested by Shapiro–Wilk’s test and Levene’s test respectively, and the differences among groups were examined through one-way analysis of variance (Duncan). P-values less than 0.05 were considered statistically significant. All the data were analyzed using SPSS Statistics 20.0 software (SPSS Inc., Chicago, IL, USA).

3. Results

3.1. Biochemical Attributes Respond Differently under T-A-4 Treatment and T-4 Treatment

The findings of the present study showed that different biochemical attributes, such as soluble sugar, catechin and photosynthetic gas exchange parameters of tea leaves, were different under ALA pretreatment with cold stress and cold stress (Table 1 and Table 2). Results show that exogenous ALA pretreatment with low temperature increases the content of soluble sugar and soluble protein, which improves the role of plant osmotic regulation and maintains both the intracellular osmotic potential and cell stability. Moreover, the catechin content, the most important secondary metabolites in the tea plant, was increased; catechin plays a crucial role in defense against biotic and abiotic stress in tea plant.
Exogenous ALA with cold stress treatment improved net photosynthetic rate (Pn), stomatic conductance (Gs), intercellular CO2 concentration (Ci) and transpiration rate (Tr) of tea leaves as compared with to the leaves under cold stress. It can be seen that exogenous ALA maintains photosynthetic capacity and improve cold tolerance of tea plant.

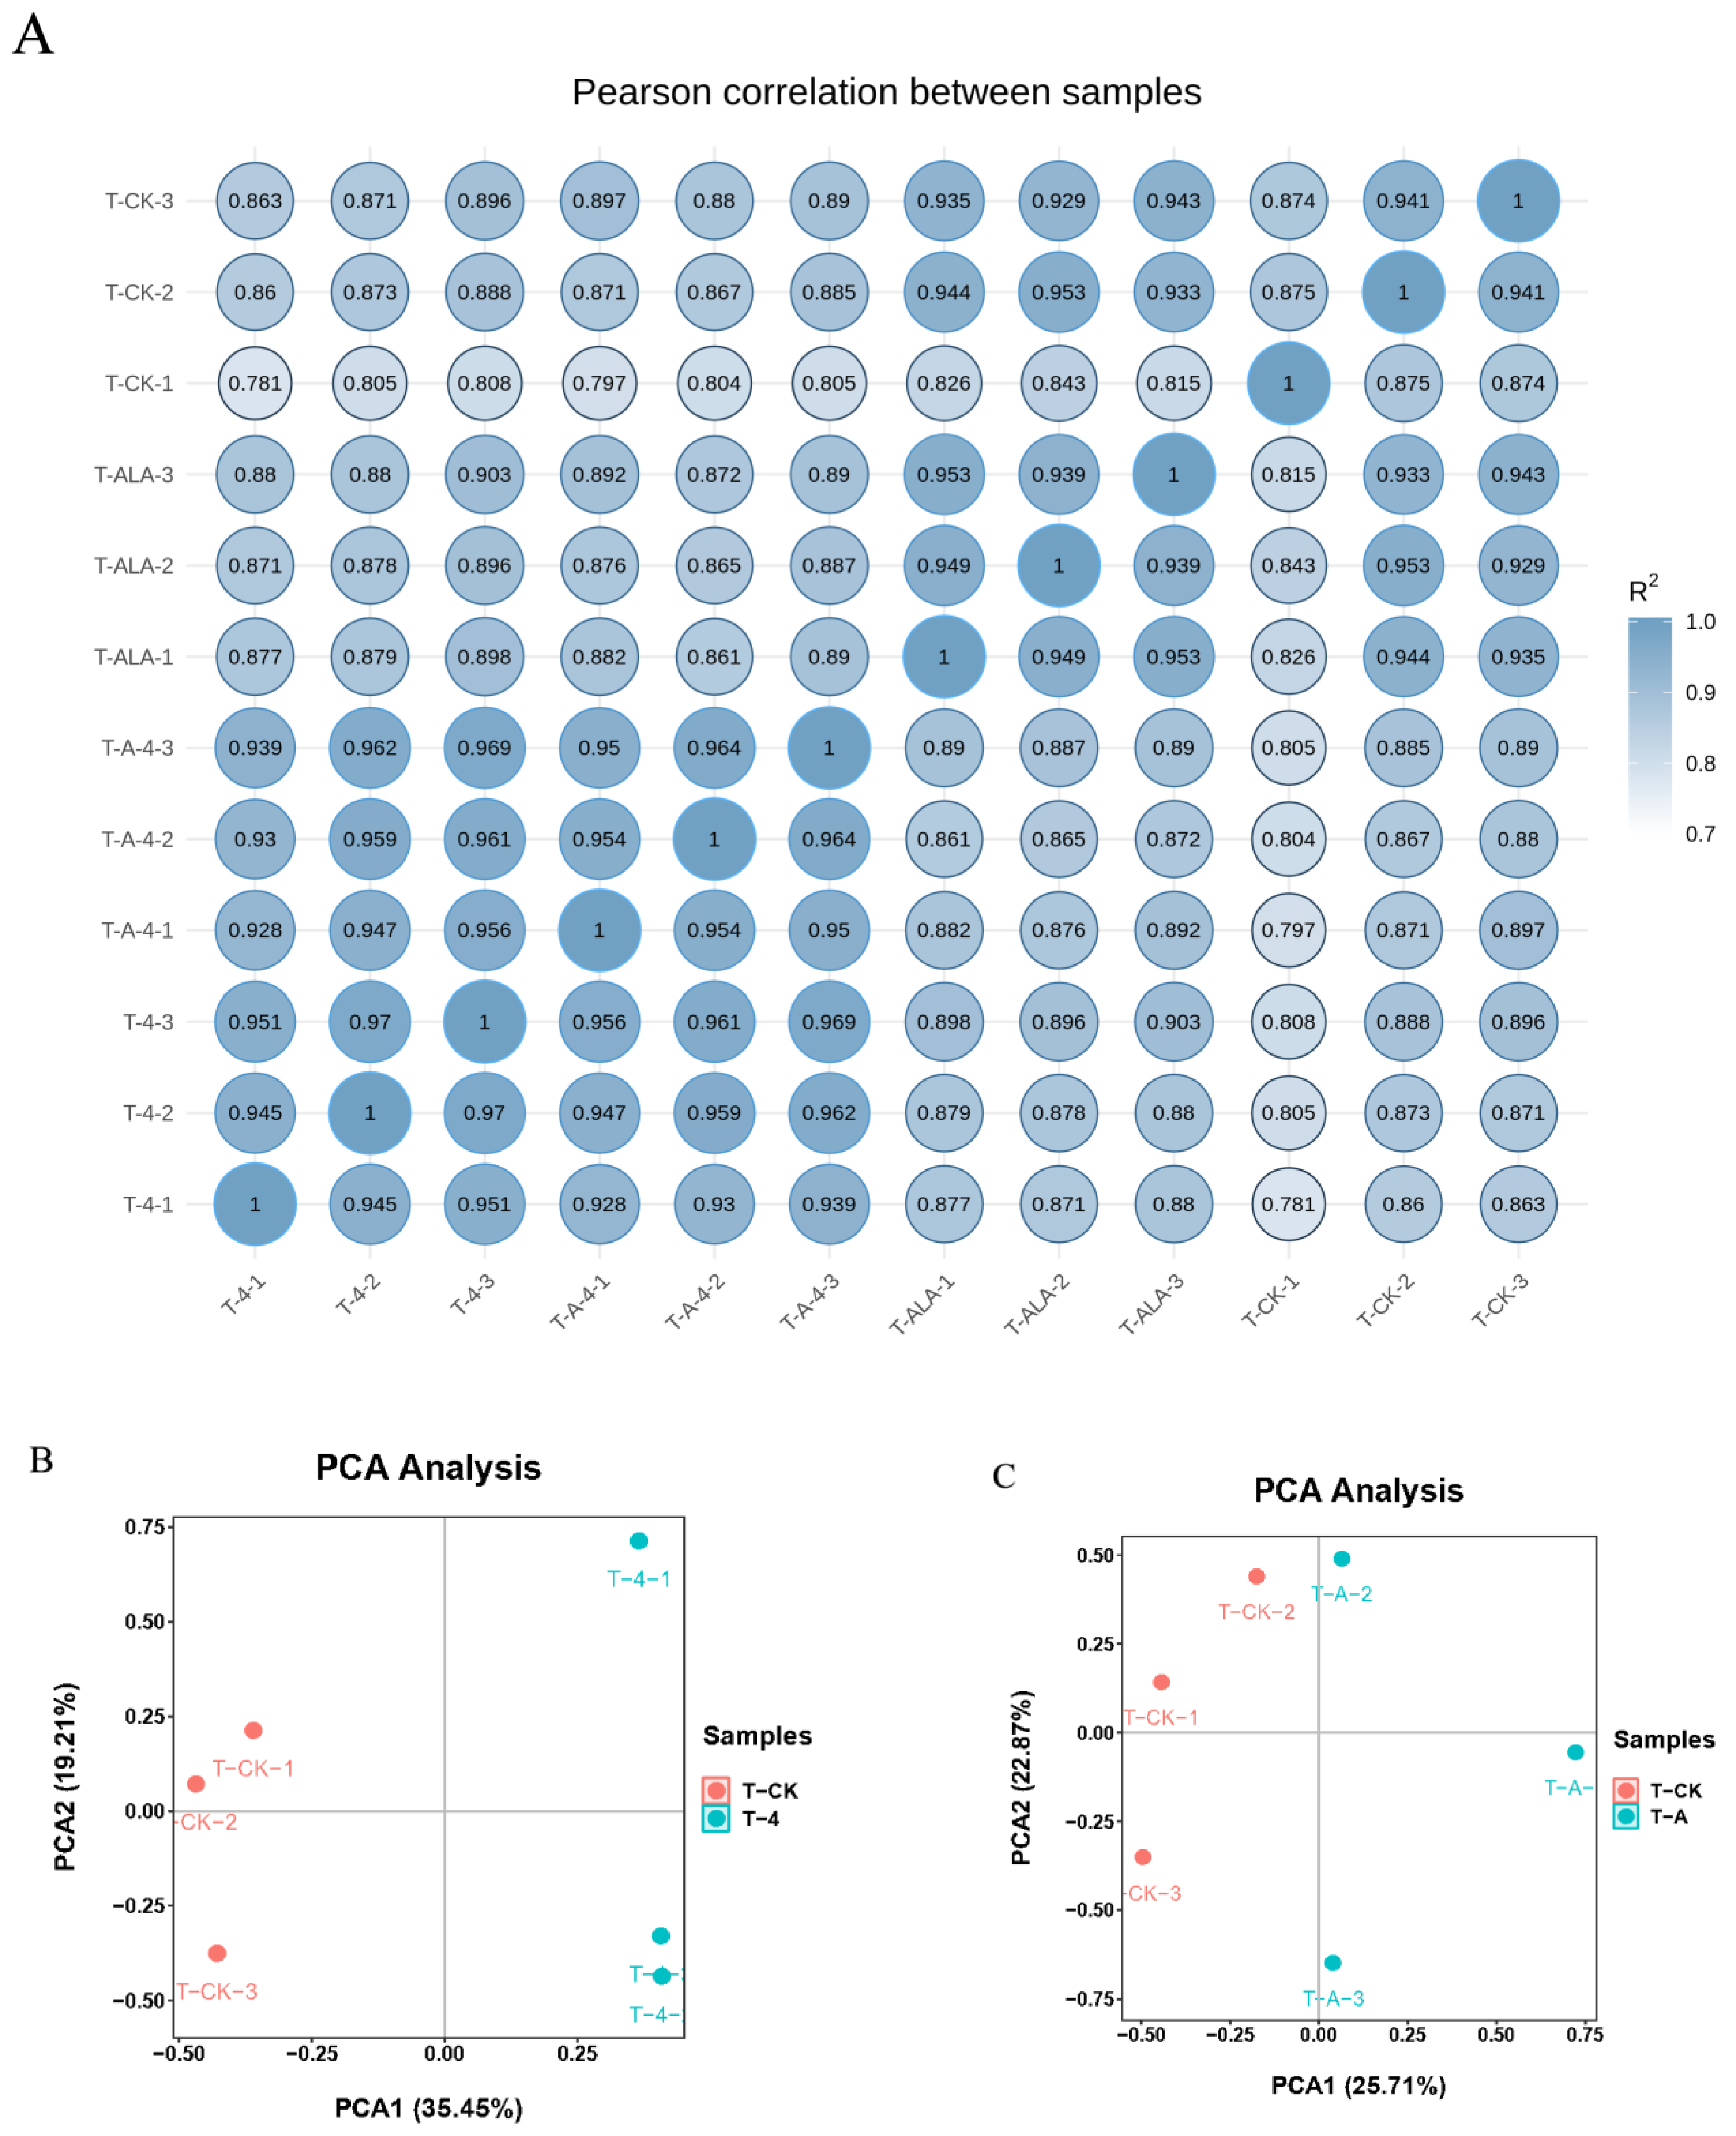
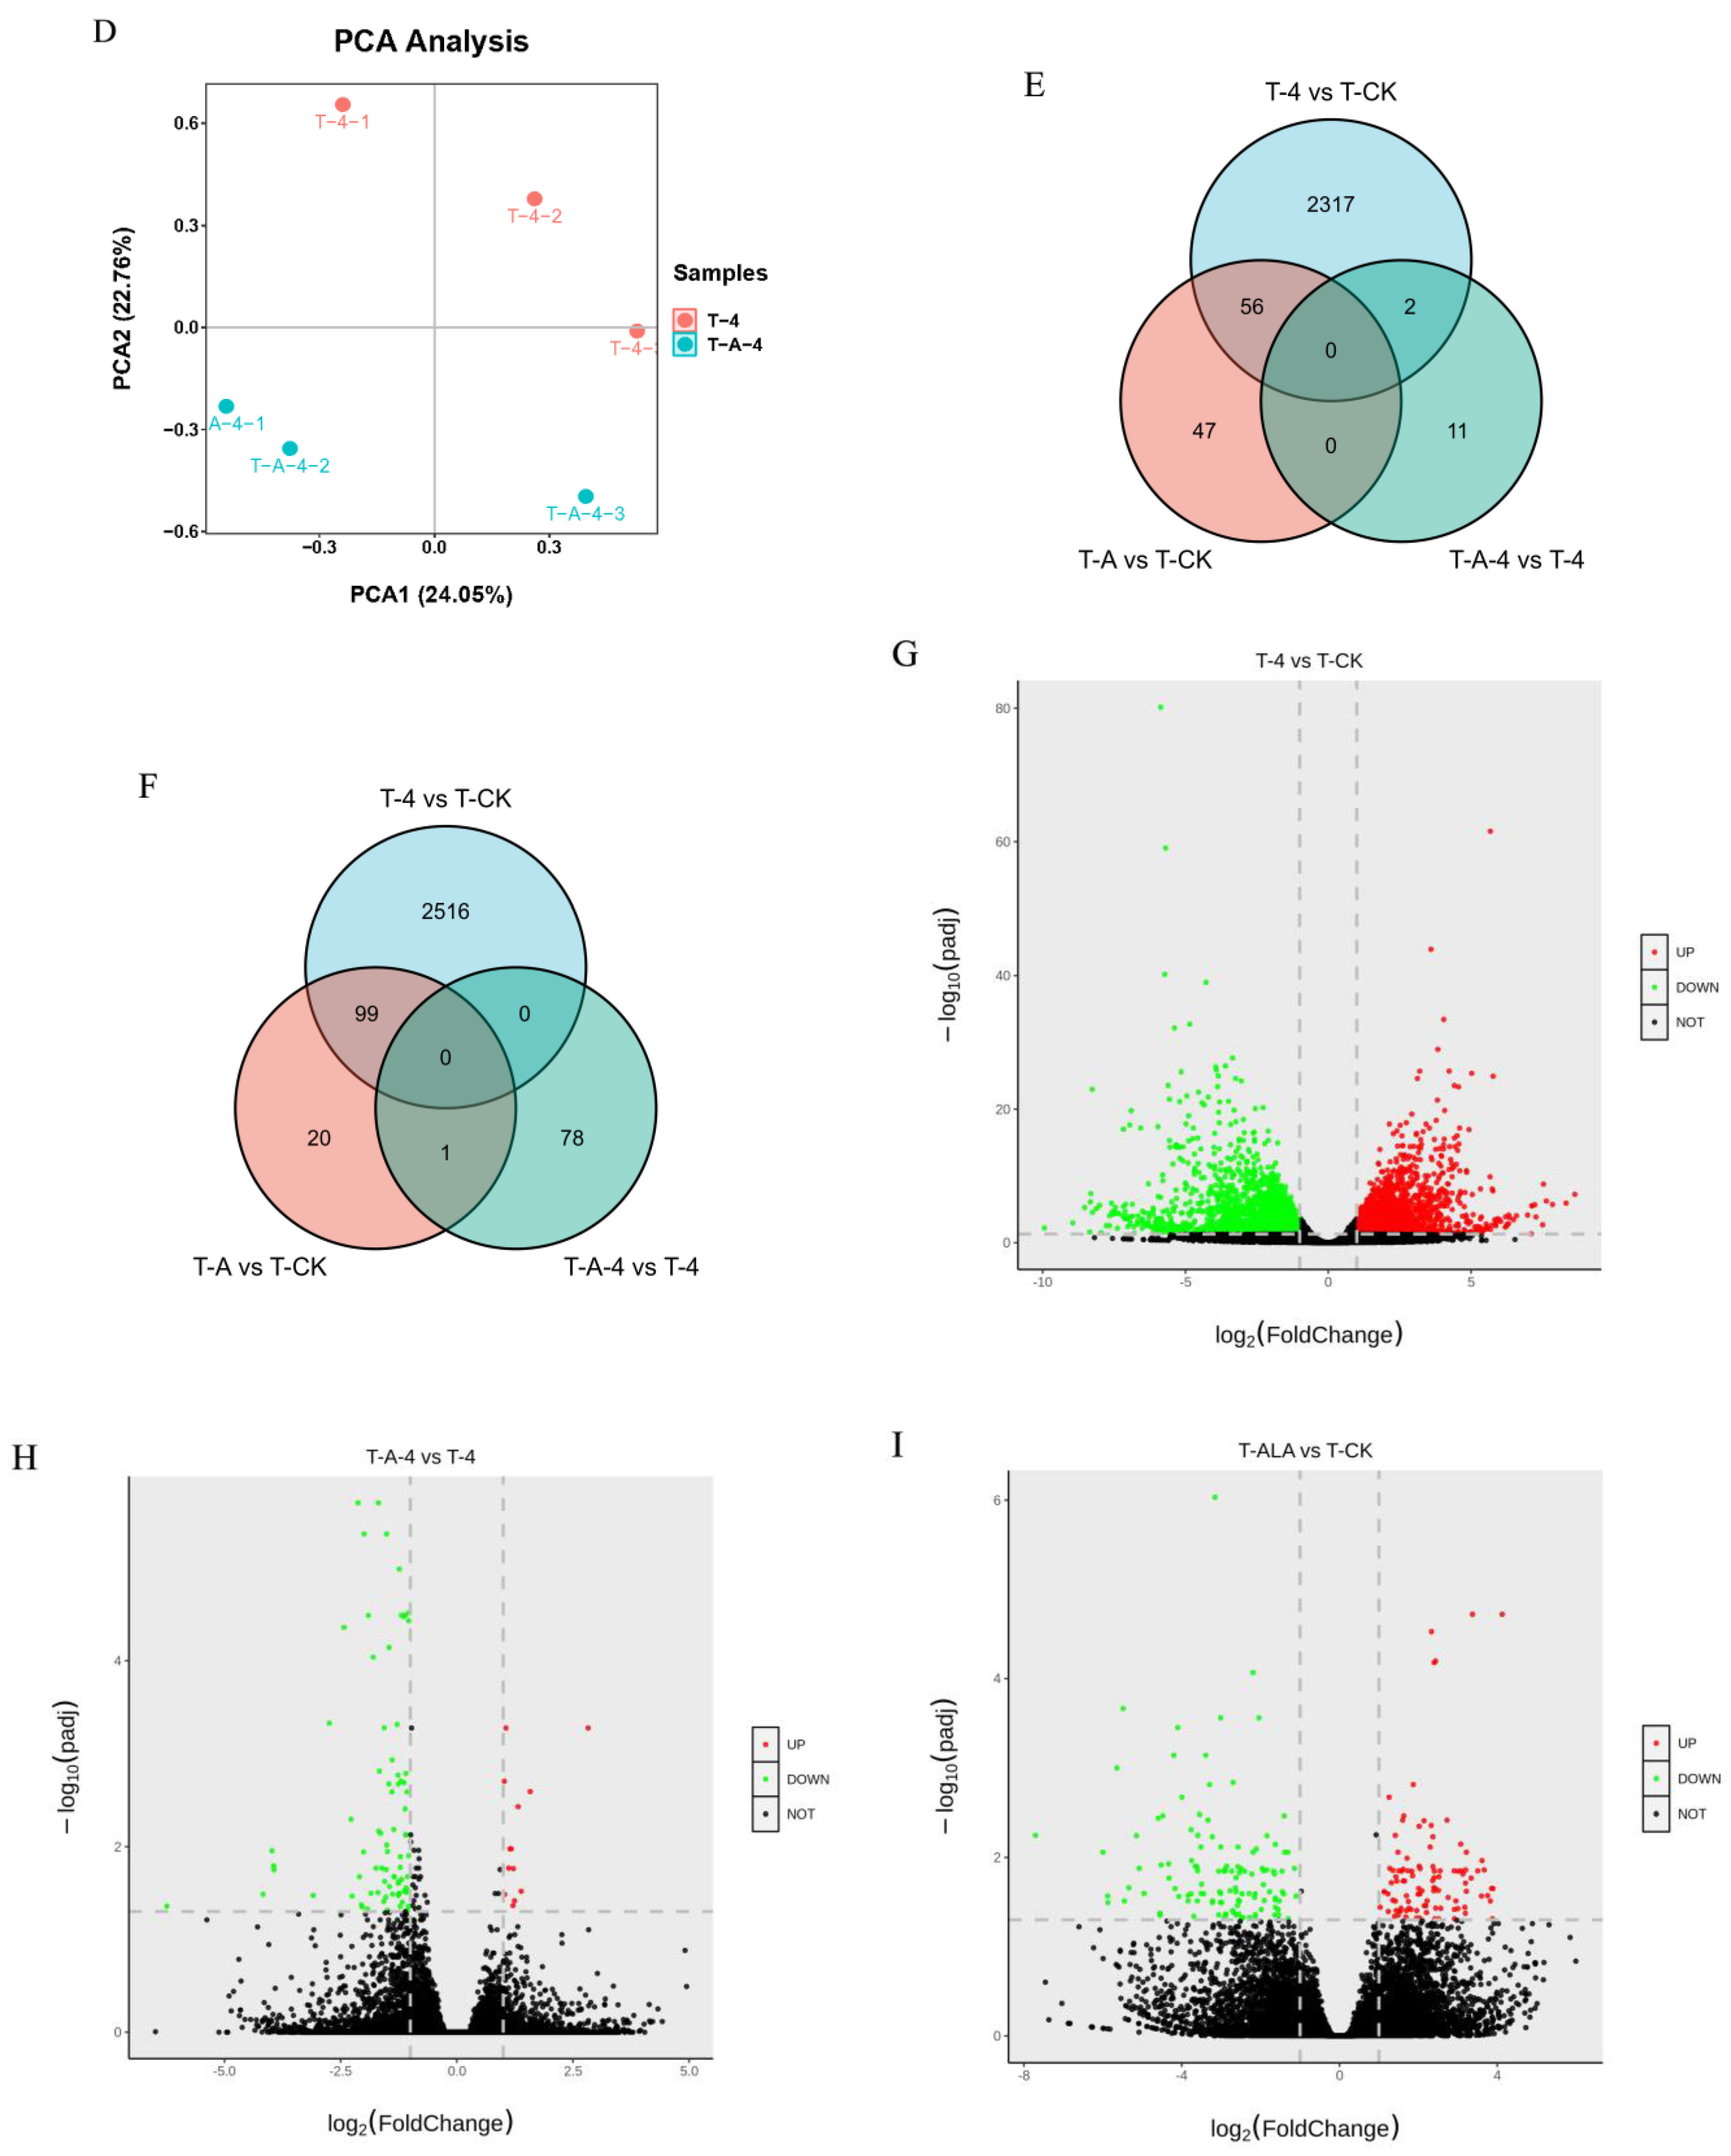
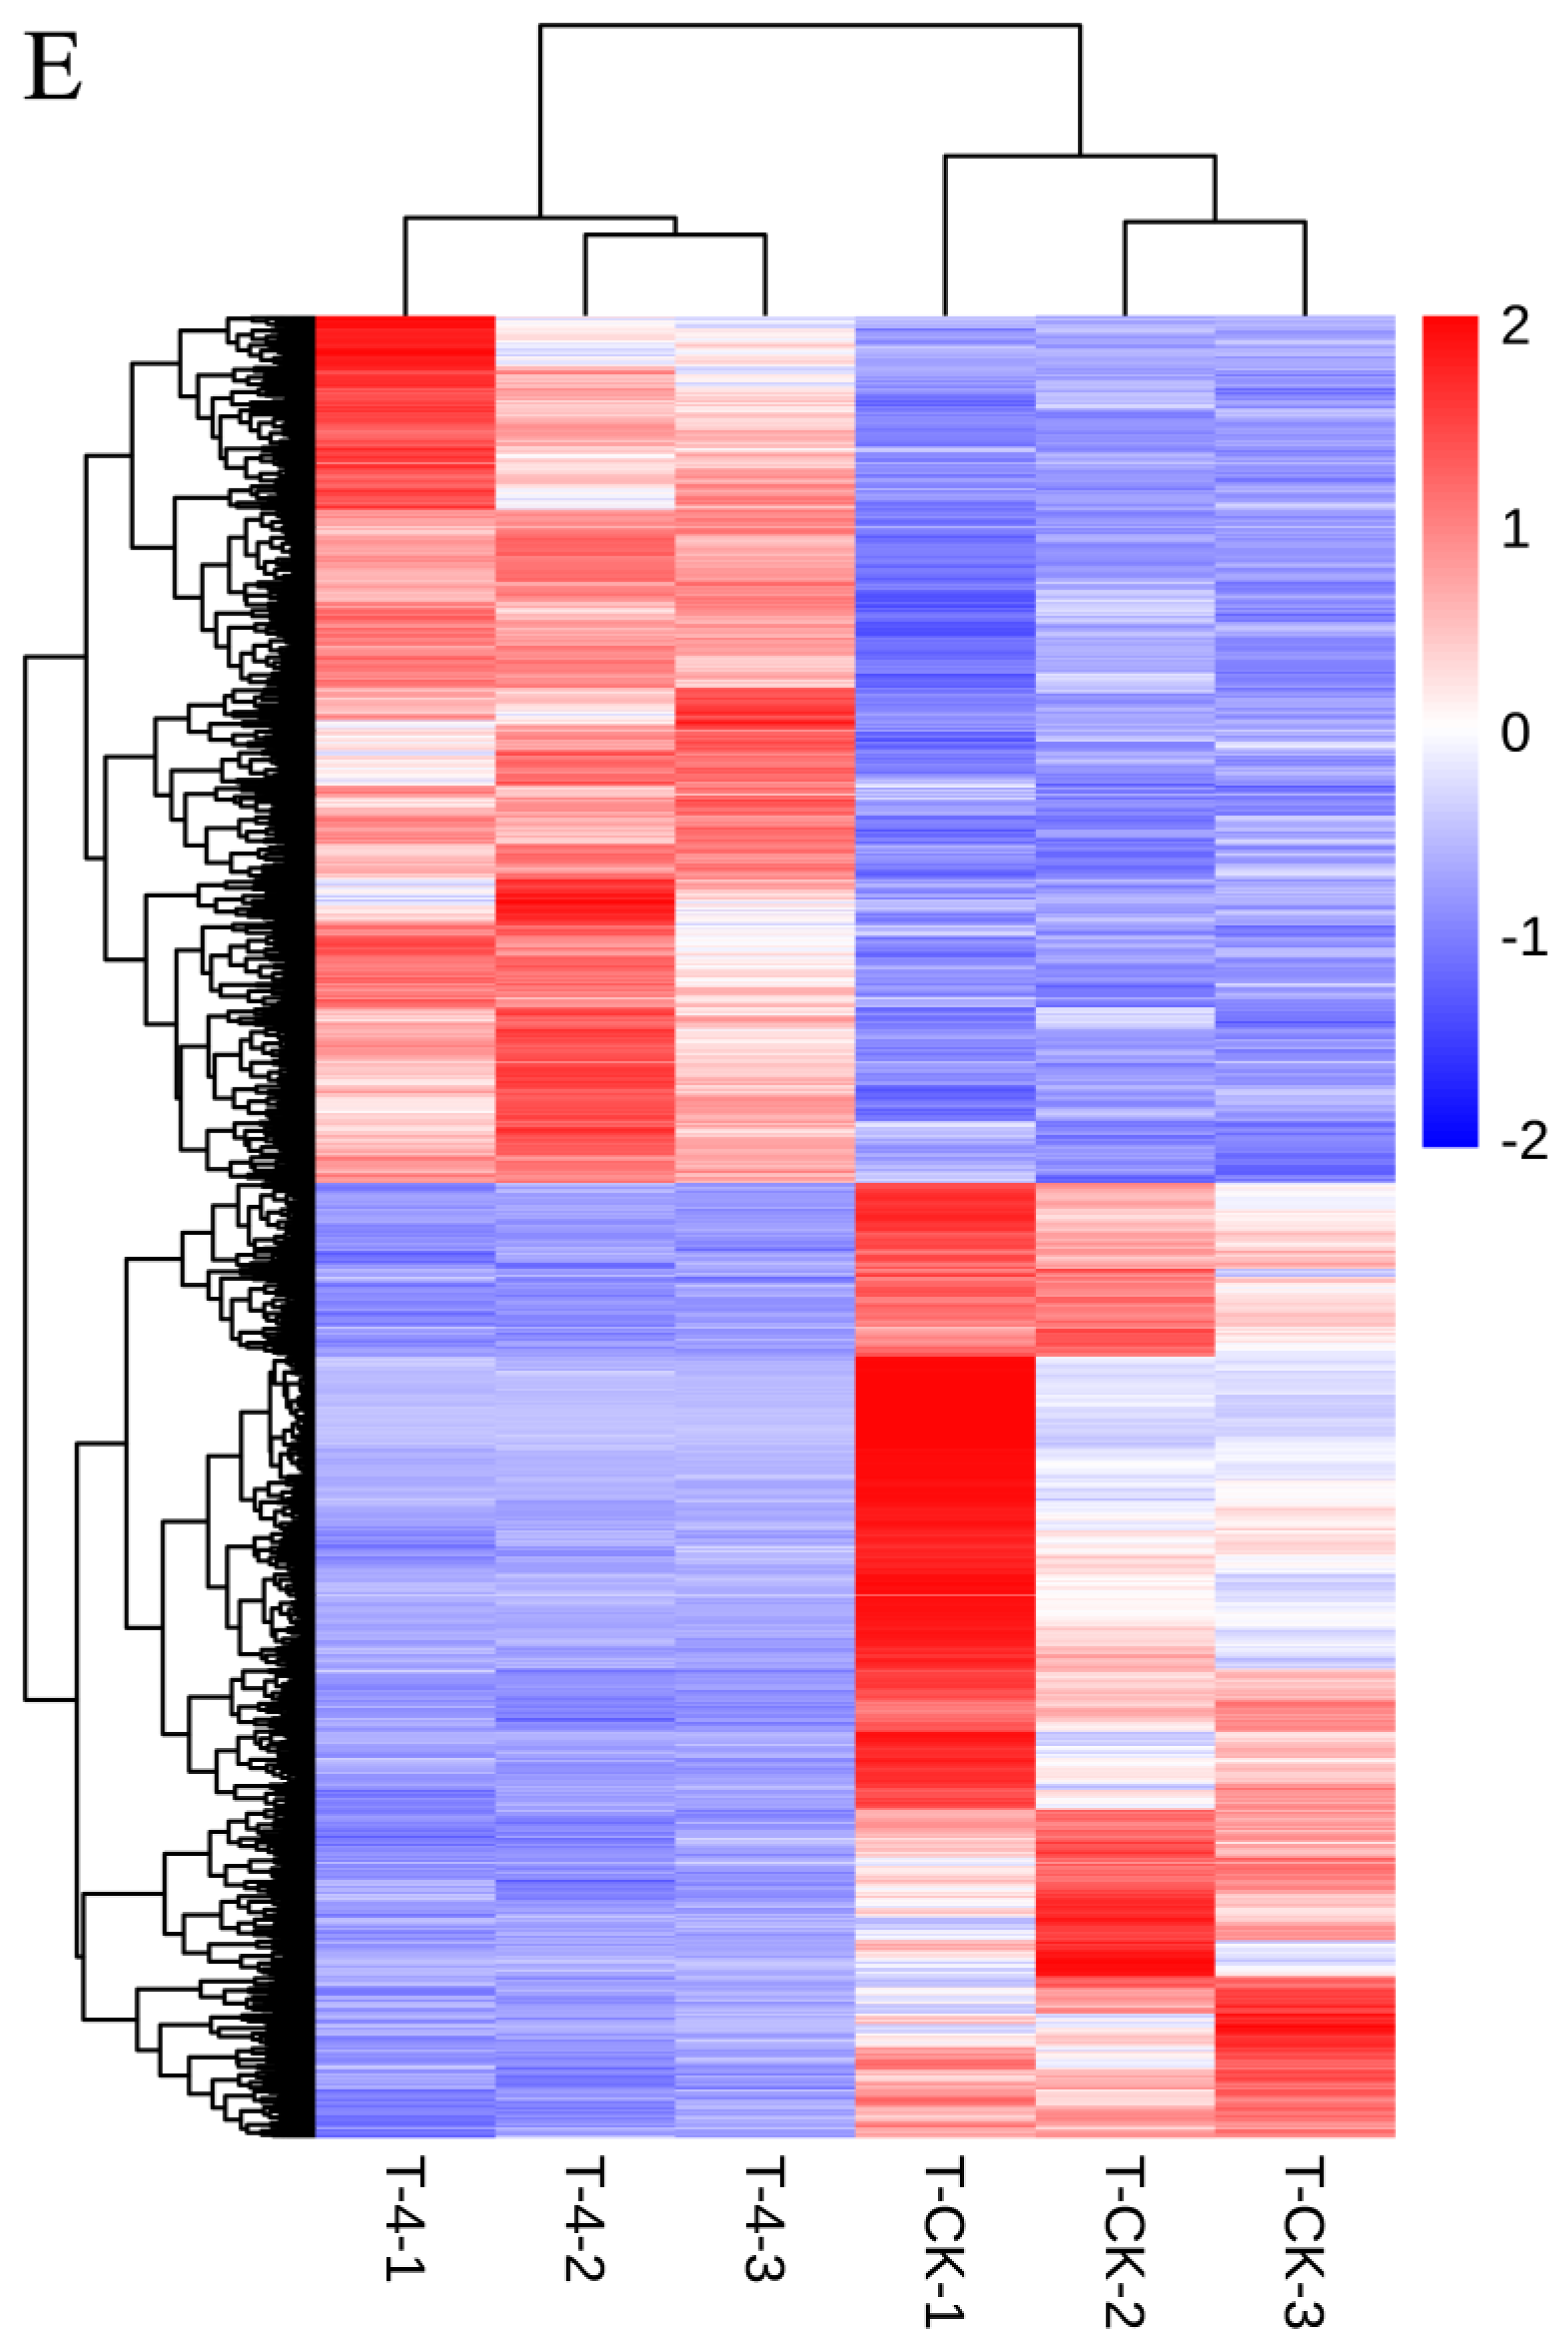
3.2. T-4 and T-A Treatment Induced Dramatical Variation in the Transcriptomic Patterns of Tea Leaves

A total of 614,518,594 raw reads were obtained from tea leaves under −4 °C-treated (T-4), ALA-treated (T-A), ALA-treated after −4 °C treatment (T-A-4) and control (T-CK). After filtering low-quality data and nonpurpose data, the number of clean reads for each library ranged from 41.2 to 65.2 million and the rate of clean reads/raw reads ranged from 95.12 to 96.71% (Table 3). The Q30 values and GC content for all libraries were above 92.52% and 45.60%, respectively. All reads were mapped to the gene models of tea plant, and 84.96% of clean reads were aligned to the model genome of Camellia sinensis in average (Table 3). These results reveal that the data we obtained are reliable and qualified for the following analysis. Finally, 15,112 genes were obtained for further function analysis to elucidate the effect of −4 °C-treated (T-4), ALA-treated (T-A) and ALA-treated after −4 °C (T-A-4) treatments on the transcriptomic pattern of tea plants.
Subsequently, to investigate the global effect of low temperature and ALA spraying treatments on the transcriptomic patterns of tea plants, two algorithms including correlation analysis and principal component analysis (PCA) were further implemented based on the transcriptomic profiles of three experimental treatments (T-4, T-A and T-A-4) (Figure 1). The correlation analysis results displayed obvious distinctions among the comparisons of T-CK vs. T-4, T-CK vs. T-A and T-4 vs. T-A-4, respectively, by means of Pearson algorithm (Figure 1A). It suggested that low-temperature treatment including T-4 and T-A-4 treatments caused more significant variations in transcriptomic patterns of tea plants than that of T-A and T-CK treatment. Further PCA analysis reached a consensus with the correlation analysis that all transcripts exhibited conspicuous distinction with the variance of 35.45% in PC1, 25.71% in PC1 and 22.76% in PC2 under T-CK vs. T-4, T-CK vs. T-A and T-A-4 vs. T-4 comparisons (Figure 1B–D). This PCA analysis supported the result that low-temperature treatments caused more transcriptomic variations of tea plants than the T-A treatment did.
Here, we set the threshold value of FDR <0.05 and |Log2Foldchange| > 1.0 to identify the differentially expression gens (DEGs) in four pairwise comparisons. A total of 10,419 DEGs were identified in our pairwise comparisons. Briefly, 4990 (2375 up- and 2615 down-regulated), 223 (103 up- and 120 down-regulated) and 92 (13 up- and 79 down-regulated) DEGs were identified at three pairwise comparisons (Table 4). Furthermore, in the up-regulated DEGs, 231, 747 and 11 genes were identified to be independently changed in the three group comparisons among T-4 vs. T-CK, T-A vs. T-CK and T-A-4 vs. T-4. In contrast, 251, 620 and 78 genes were identified in the down-regulated DEGs (Figure 1E,F). The distribution of up- and down-regulated genes was calculated for pairwise comparison and are presented in a volcano diagram (Figure 1G,H). Thus, these DEGs were utilized for further function analysis on elucidating the effects of low-temperature and exogenous ALA treatment for tea plants.

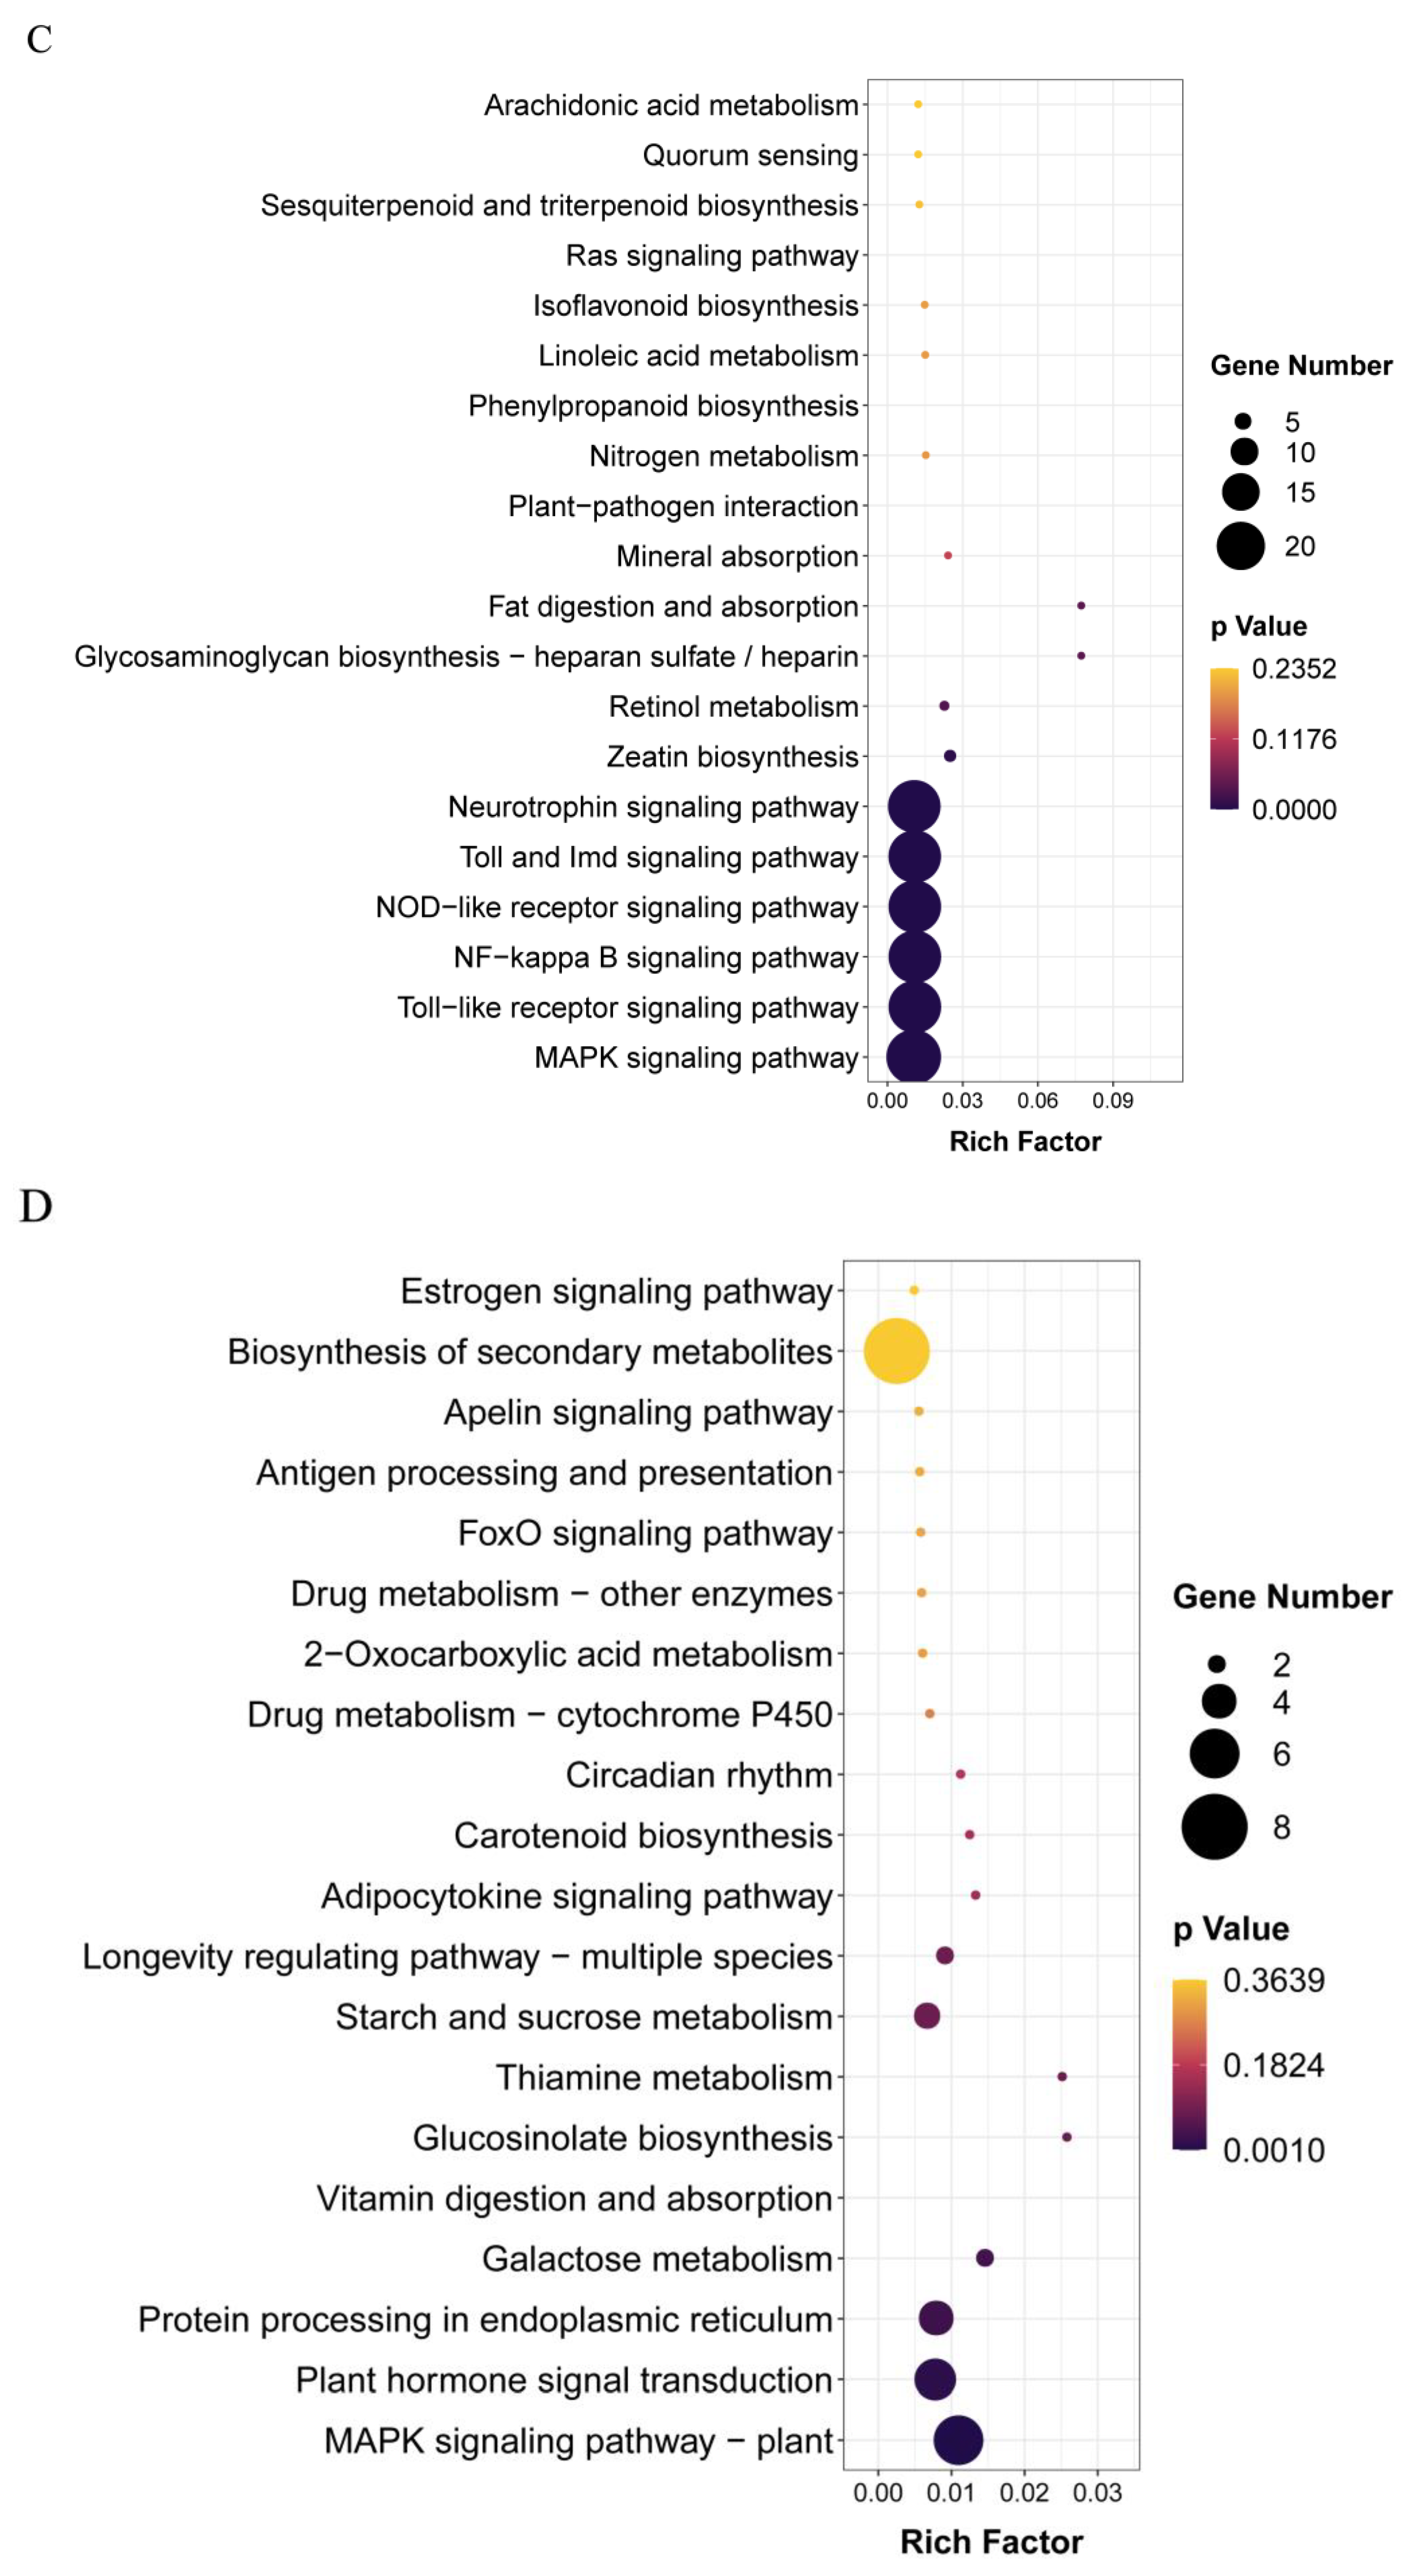
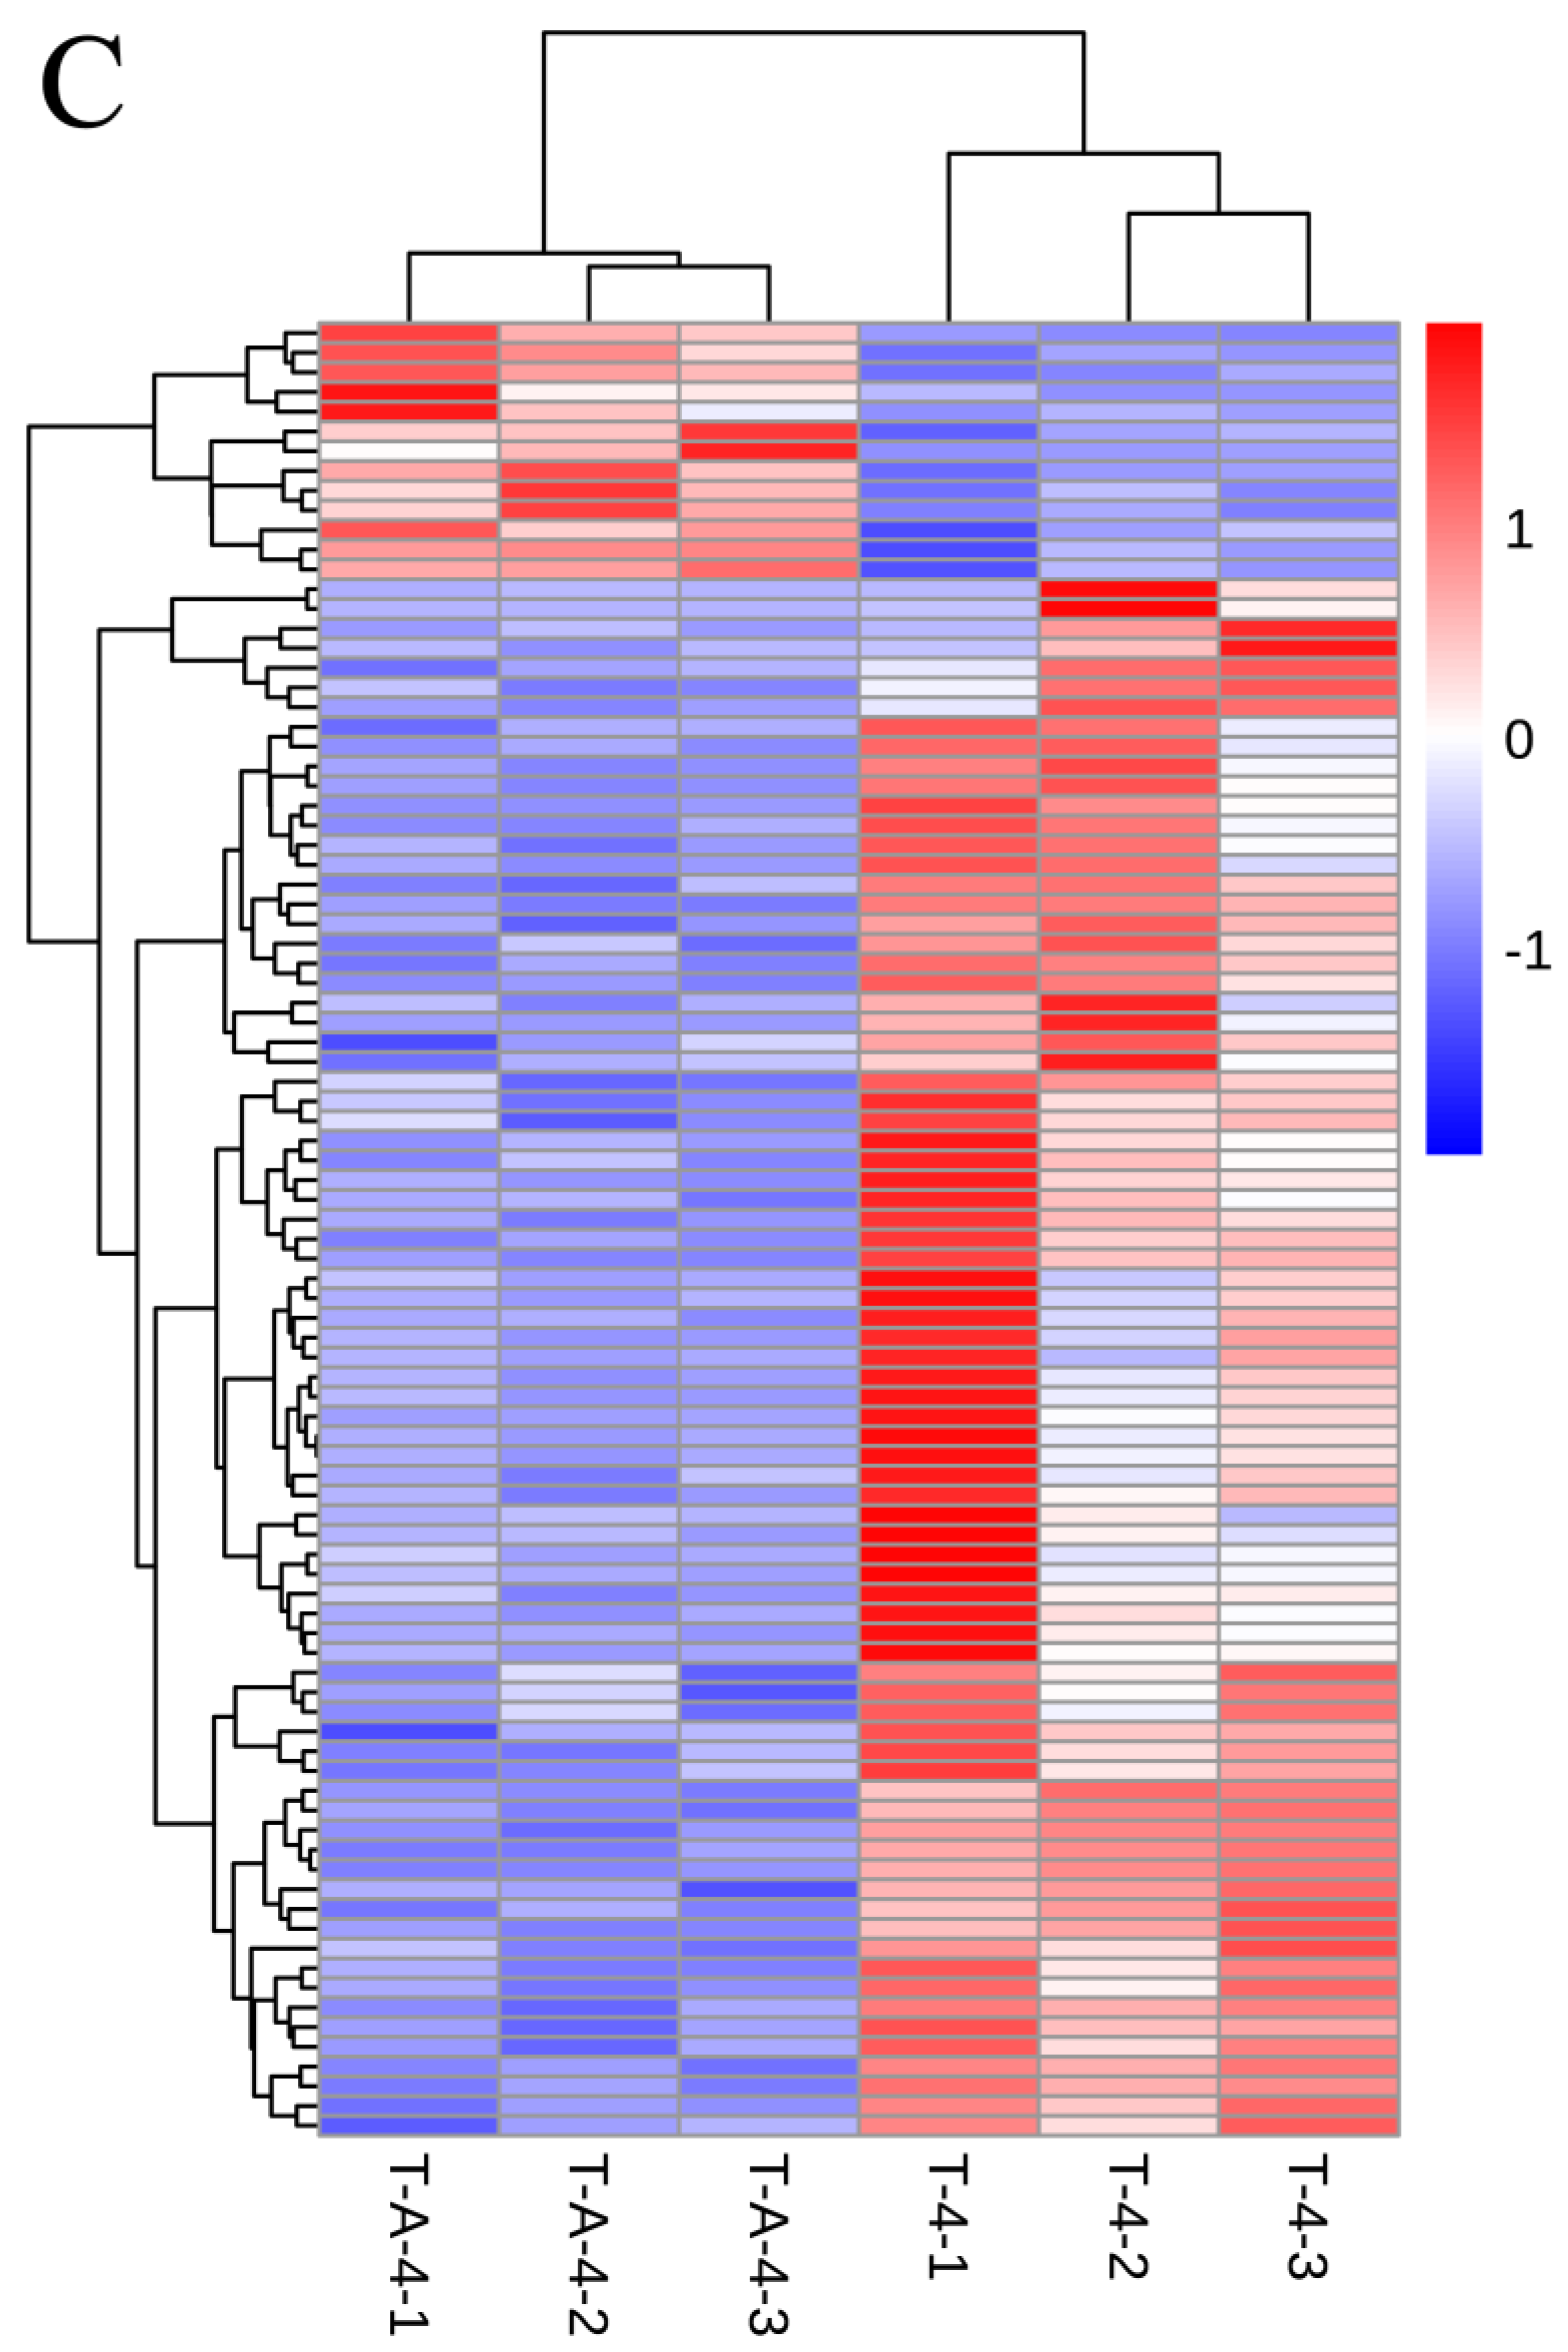
3.3. T-4 Treatment Mainly Altered Transcription Patterns of Genes Relevant to Membrane Signaling Pathway and Secondary Metabolites

To investigate the function of genes associated with T-4 treatments, whole transcriptome gene expression fluctuation was presented as a heatmap which suggested that a large-scale transcriptome reprogramming occurred when tea plants were subject to low-temperature stress (Figure 2E). Then, gene ontology (GO) enrichment on the 2113 up-regulated DEGs were analyzed. These DEGs (FDR < 0.05) were distributed in 907 GO categories, and 7 significant GO terms were enriched in three main groups, including biological process (BP), molecular function (MF) and cellular component (CC) (p < 0.05). Three significantly enriched terms were involved in phenylpropanoid biosynthetic process (12 genes), secondary metabolite biosynthetic process (12 genes) and plasma membrane (53 genes) (Figure 2A). We noticed that up-regulated DEGs mainly affected the biological process when tea plants were exposed to low temperature (T-4), including phenylpropanoid biosynthetic process and secondary metabolite biosynthetic process, which have been well documented as part of plant cell differentiation, resistance to pathogenic bacteria and formation of pigmentation [25]. In the cellular component category, 53 genes were relevant to the plasma membrane, and when combined with KEGG analysis, 6 signaling pathways were significantly activated upon T-4 treatment, such as nod-like receptor, neurotrophin, toll-like receptor, toll and imd, NF-kappa B and MAPK signaling pathways (Figure 2C). Thus, when tea plants confronted low temperature (T-4), various signaling pathways in the cell membrane system, which were confirmed in previous reports, were activated to withstand the adverse situation.
Subsequently, functional enrichment results showed that 2296 down-regulated DEGs were involved in 955 GO categories, with 4 significant GO terms (FDR < 0.05), including oxidoreductase activity (147 genes), oxidation-reduction process (77 genes), carbohydrate metabolic process (67 genes) and drug catabolic process (13 genes) (Figure 2B). Genes involved in including oxidoreductase activity in the MF category were mainly enriched, and further KEGG analysis also suggested that down-regulated DEGs had a large proportion of metabolic pathways and biosynthesis of secondary metabolites (Figure 2D). Thus, T-4 treatment mainly affected transcription patterns of metabolic process.

3.4. Exogenous ALA Spraying Triggered Abundant Transcription Fluctuation Related to MAPK Signaling Pathway and Membrane Transport

To investigate the function of genes associated with T-A treatments, whole transcriptome gene expression fluctuation was presented at a heatmap which suggested that a large-scale transcriptome reprogramming was happened when tea plants were applied to exogenous ALA treatment (Figure 3E). A total of 168 up-regulated DEGs were identified, and they were designed for Gene Ontology (GO) enrichment analysis. The results showed that these DEGs (FDR < 0.05) were gathered in different categories involved in cell recognition. Additionally, KEGG analysis showed that greater percentages of up-regulated DEGs were enriched in the nod-like receptor, toll-like receptor, toll and imd, NF-kappa B and MAPK signaling pathways, in parallel with the distribution in T-4 vs. T-CK, except for gene expression level (Figure 3A).
Subsequently, 294 down-regulated DEGs were involved in 35 GO categories with 4 significant GO terms (FDR < 0.05), including fluid transport (3 genes), water transmembrane transporter activity (3 genes), beta-amylase activity (2 genes) and amylase activity (2 genes) (Figure 3B). Genes involved in fluid transport and water transmembrane transporter activity in BP and MF category, respectively, were mainly enriched. Further KEGG analysis also suggested that down-regulated DEGs had a large proportion in the MAPK signaling pathway and biosynthesis of secondary metabolites (Figure 3D). Thus, T-A treatment mainly affected the transcription patterns of transport process, including fluid transport and water transmembrane, allowing for the promotion of efficient transport of cytoplasmic inclusions.

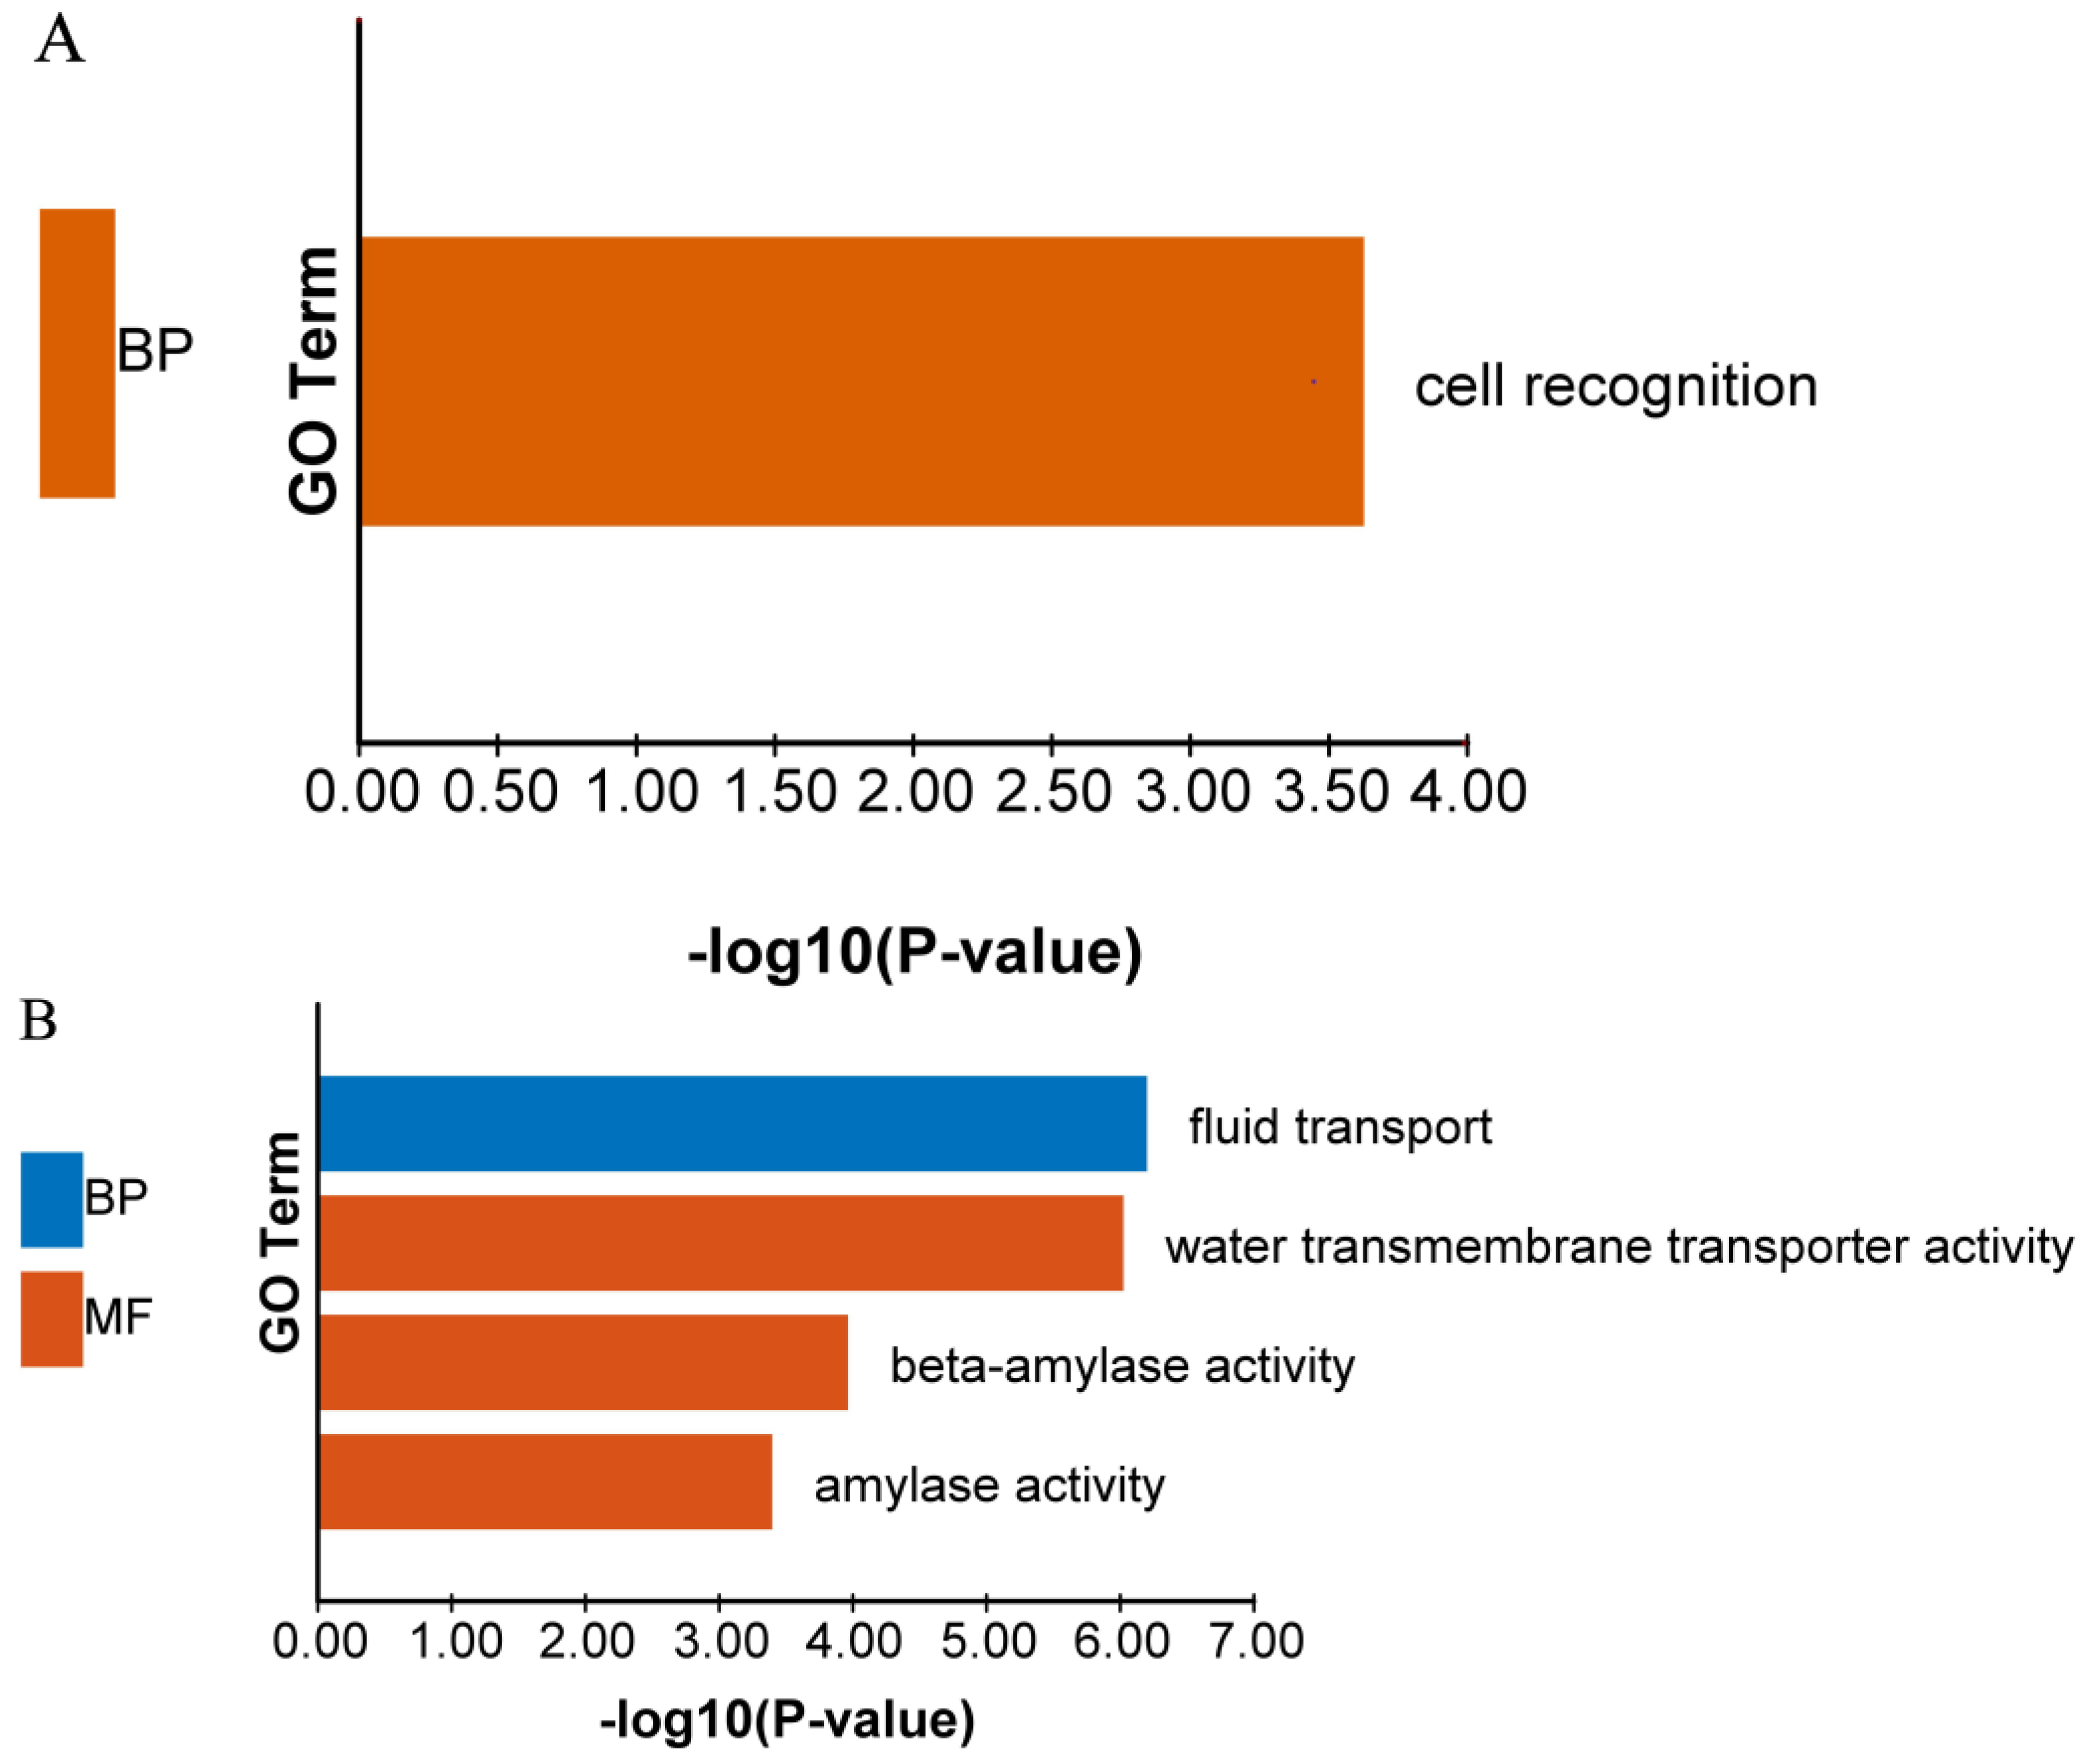
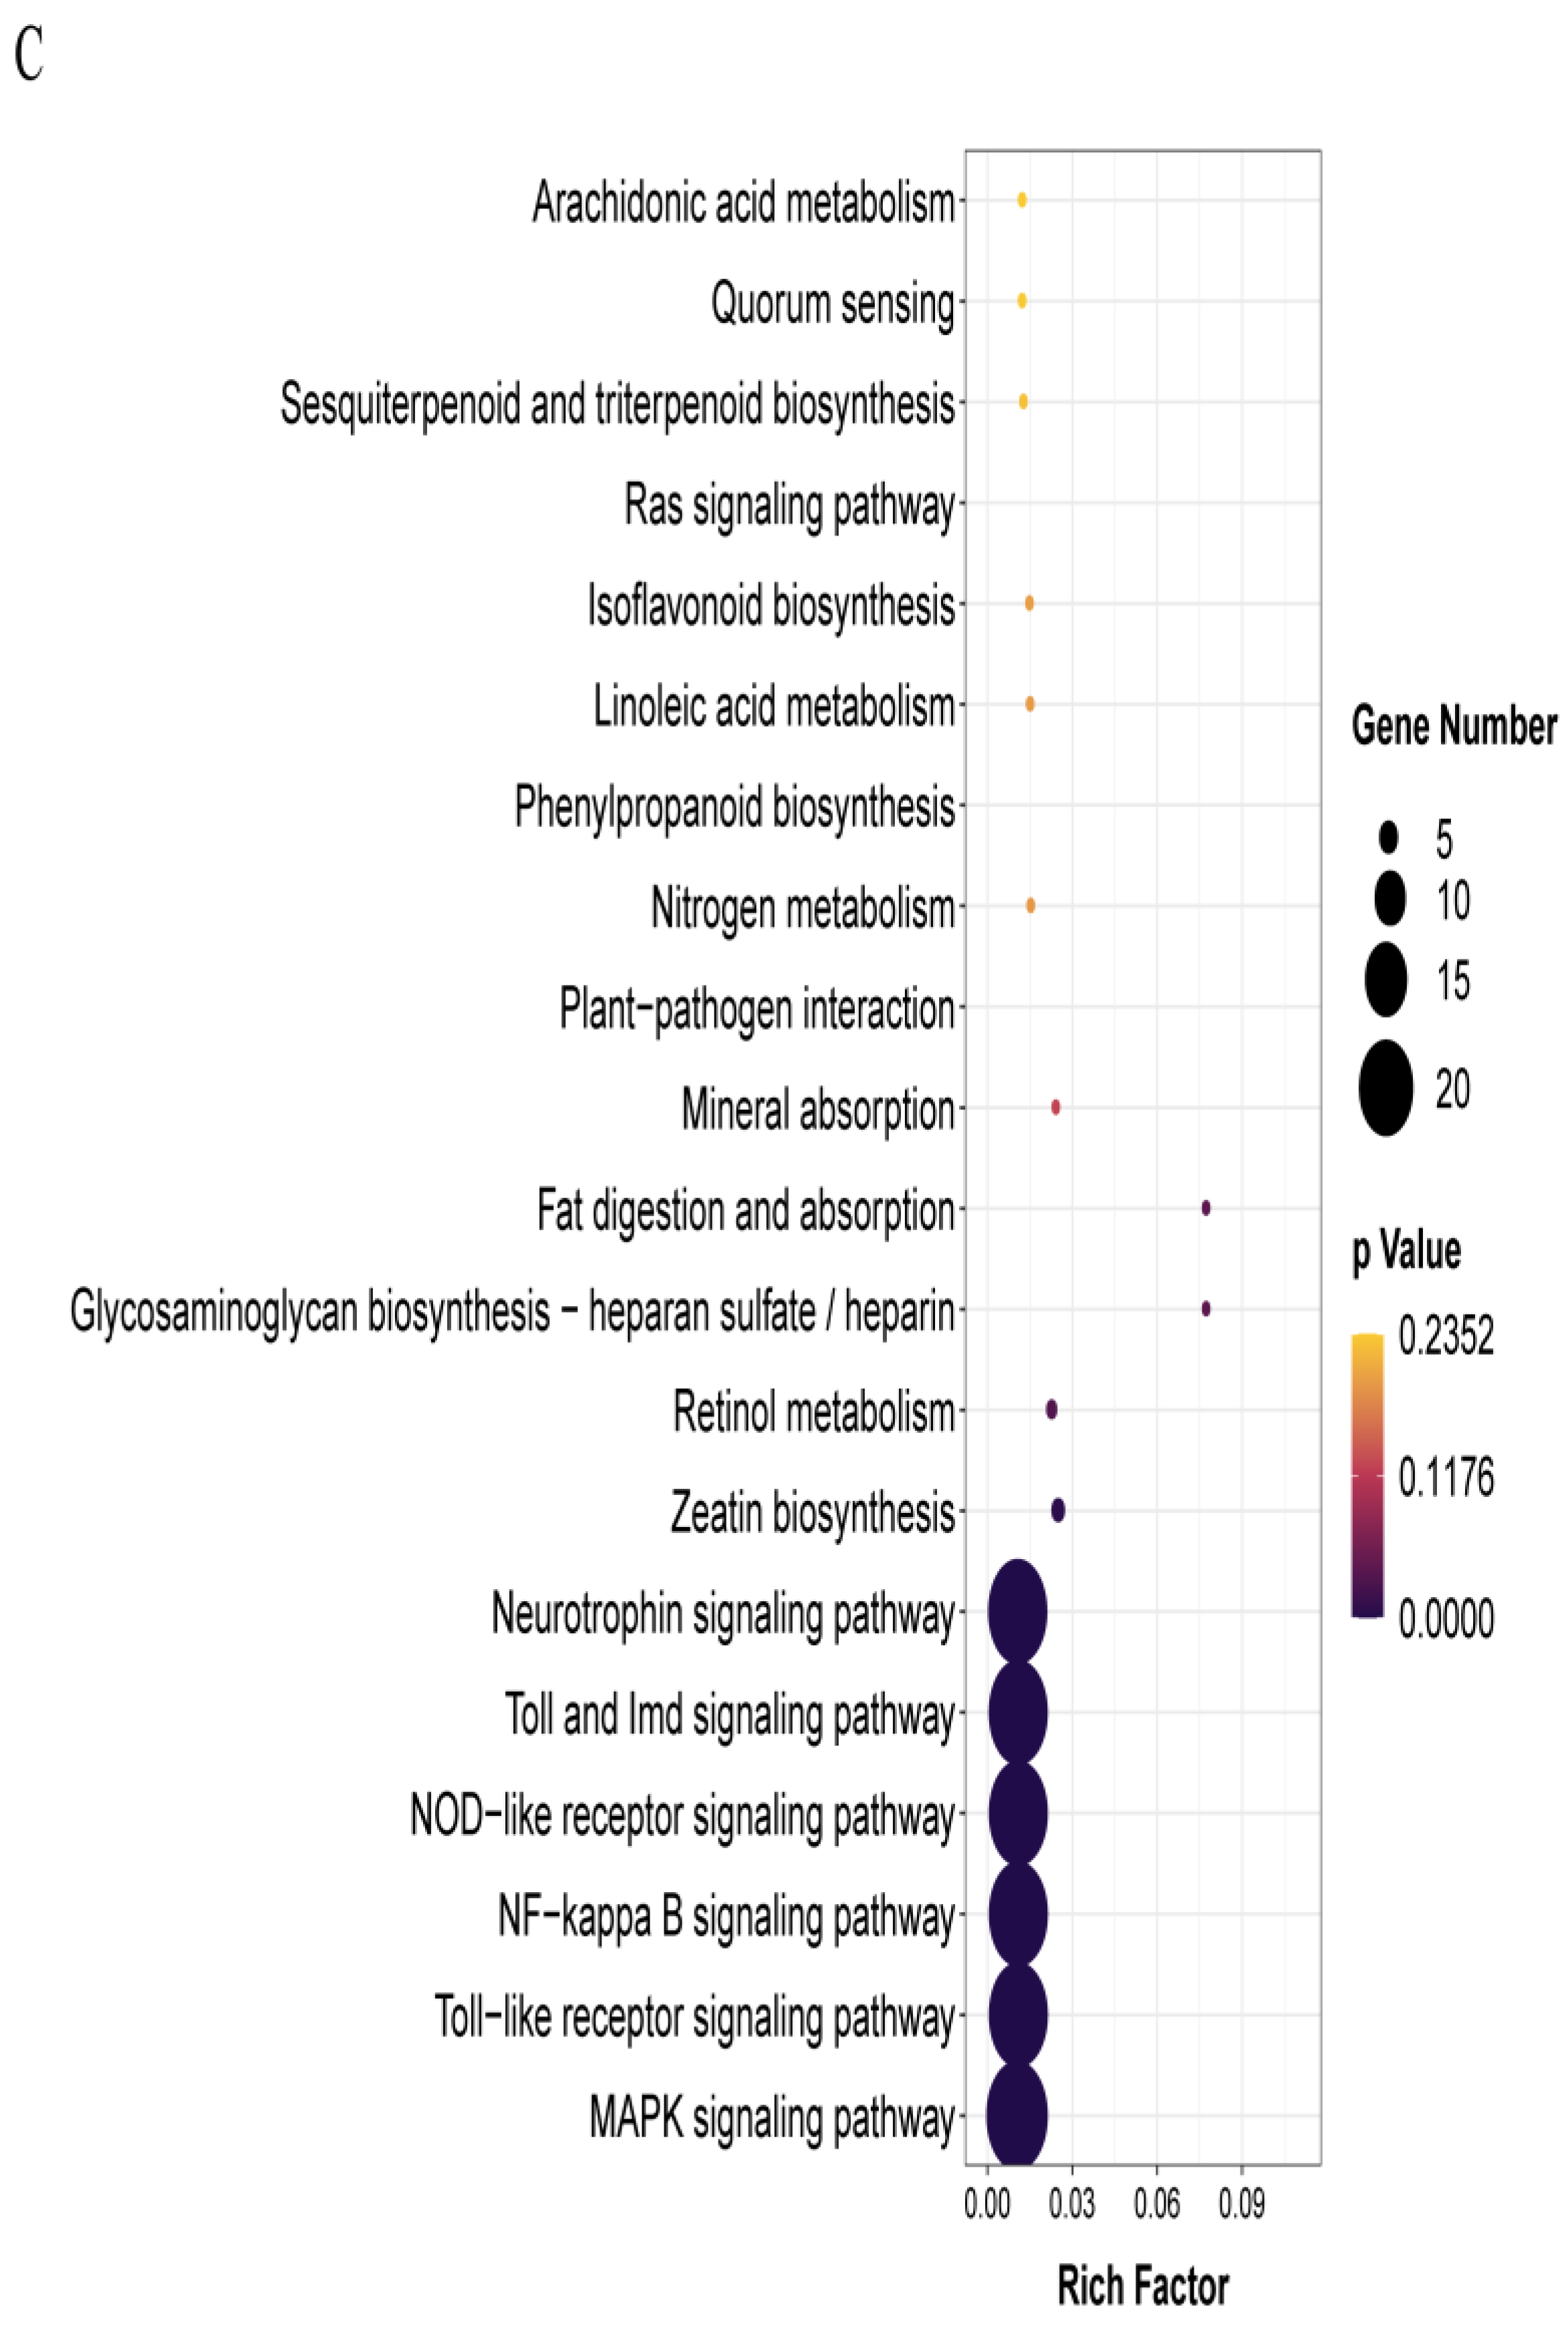
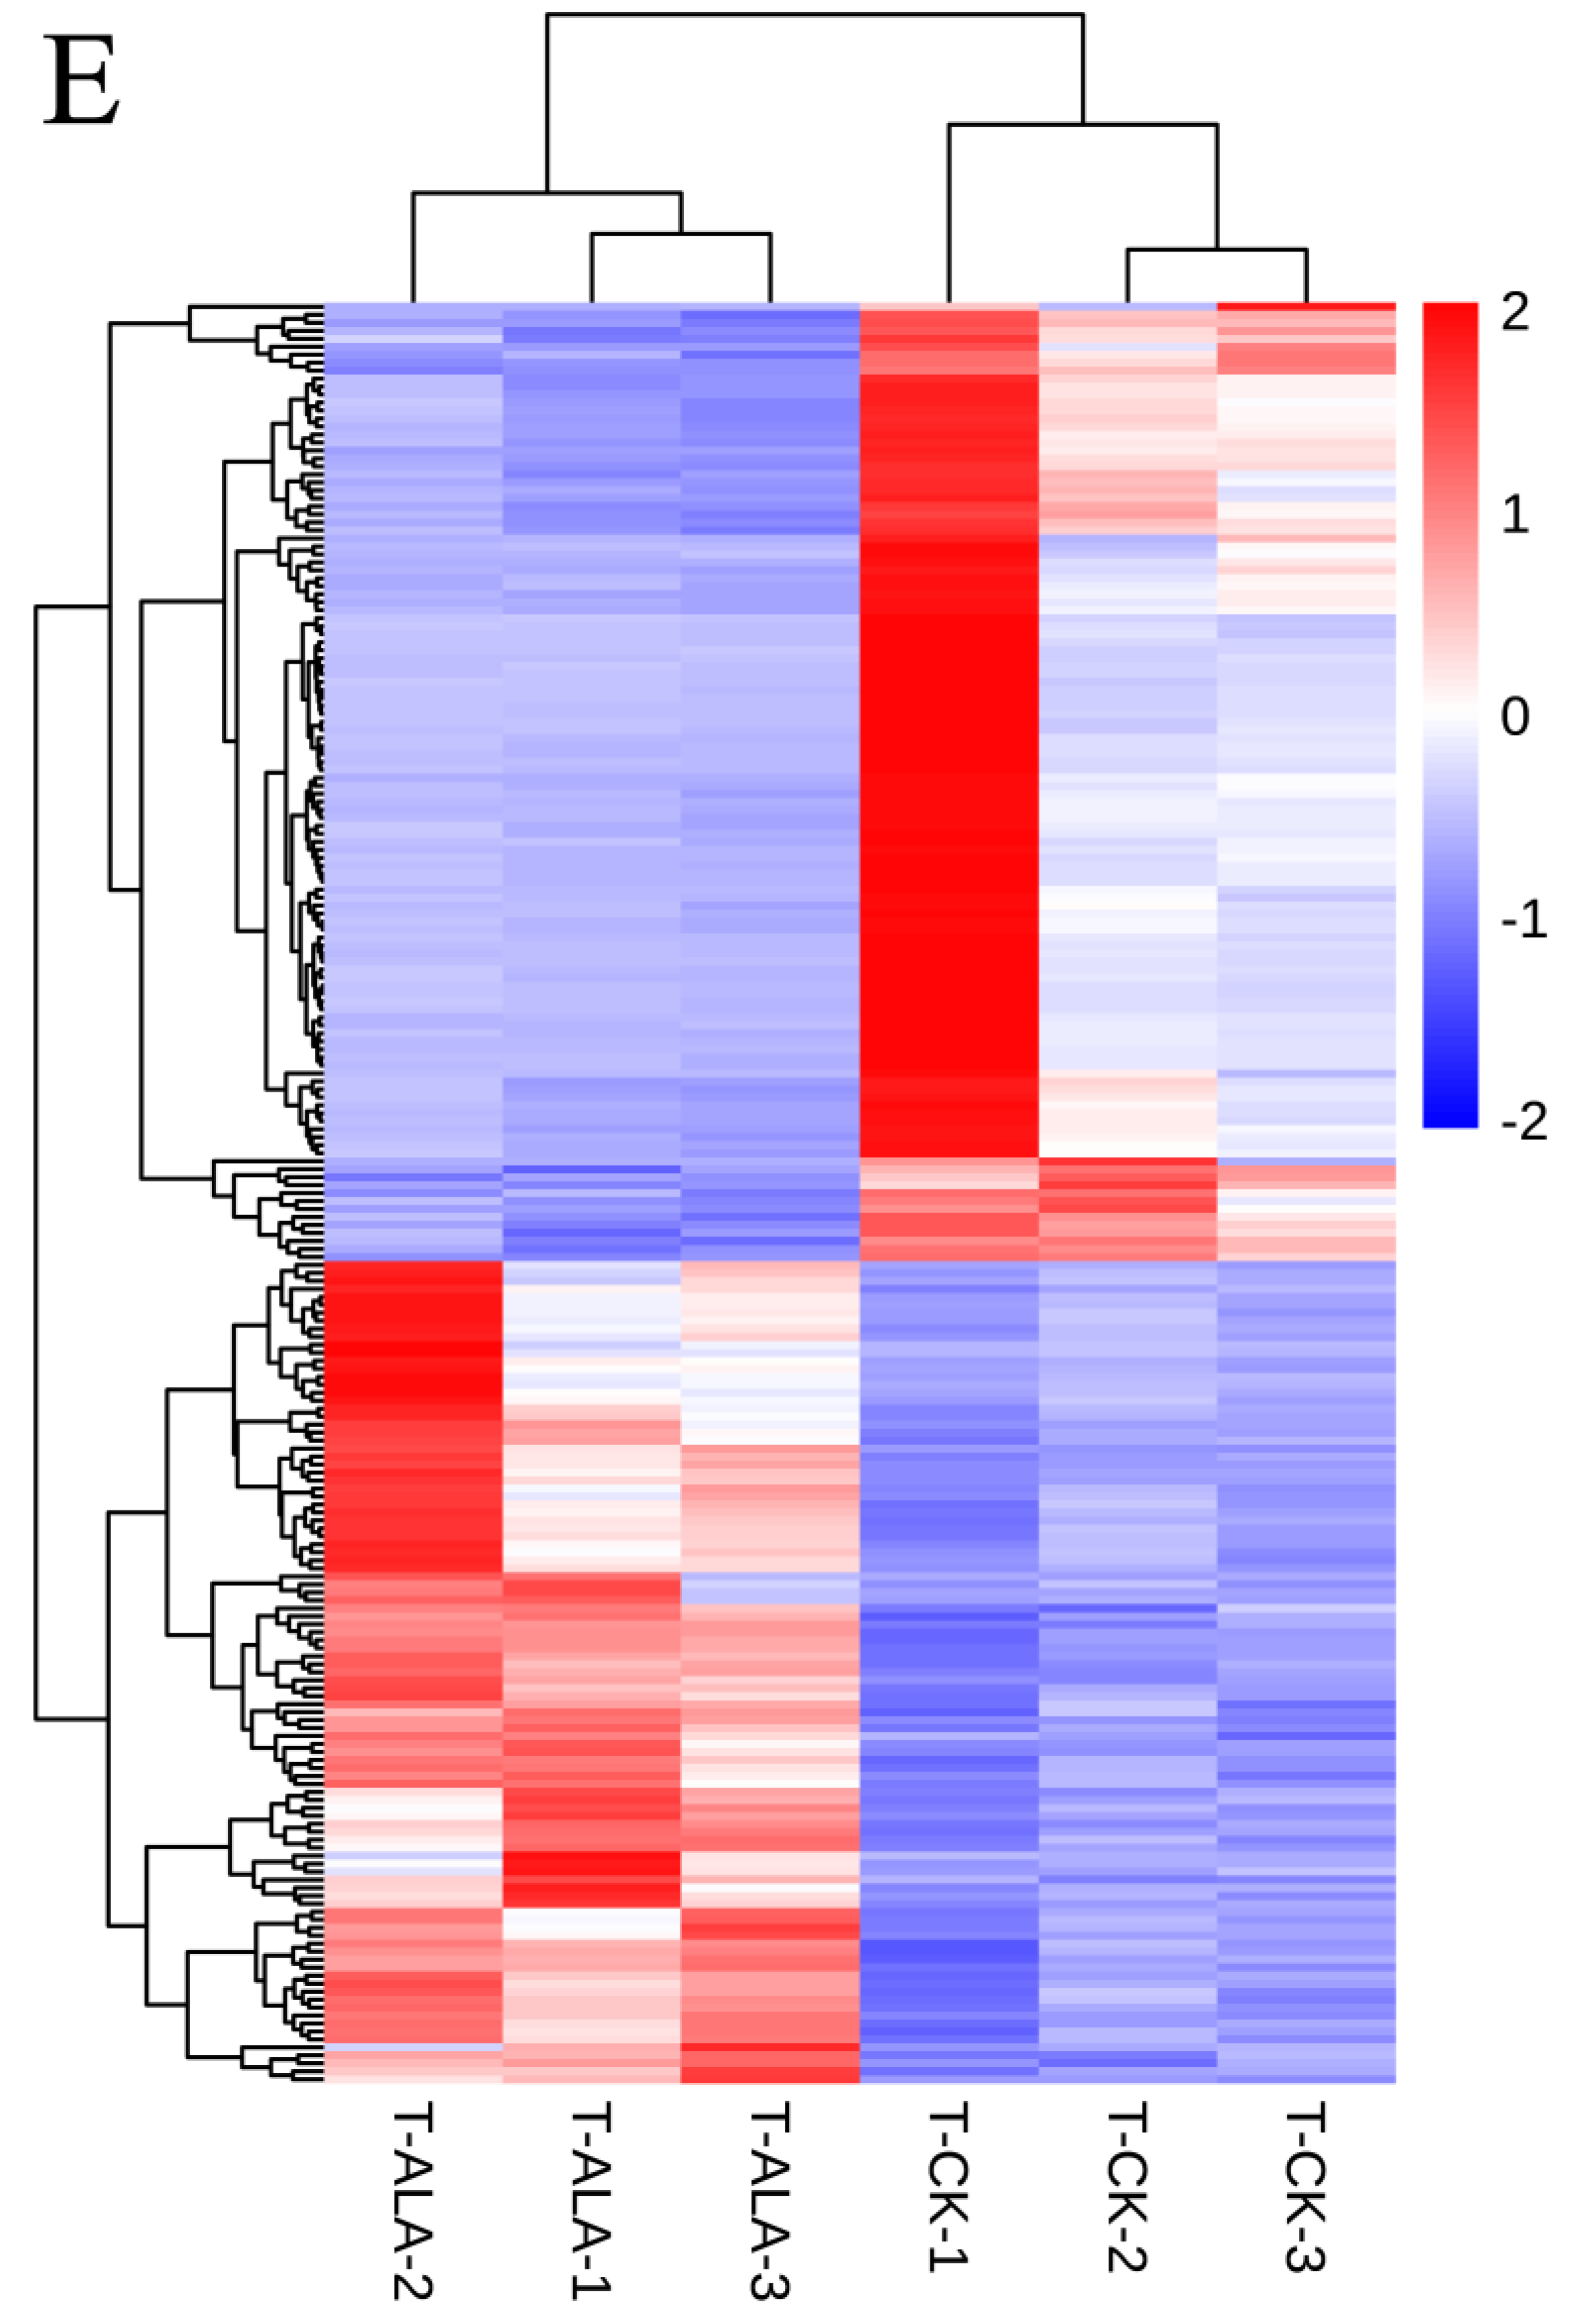
3.5. ALA Pretreatment Can Induce Up-Regulated Expression Genes of Diterpenoid Biosynthesis and Down-Regulated Expression Genes of Glutathione Metabolism

In the comparison of T-A-4 with T-4, we found that a small proportion of gene expression in the transcriptome was up-regulated with a presentation of heatmap (Figure 4C). In addition, all up-regulated DEGs were mainly enriched in diterpenoid biosynthesis, metabolic pathway and ribosome (Figure 4A). Terpenoids are the most abundant and diverse secondary metabolites reported at present. They play an important role in plant development and stress resistance. Plant alcohols, vitamin A and gibberellin are important representatives of diterpenoids in plants. They are essential for plants to resist various biotic and abiotic stresses. Furthermore, many down-regulated DEGs relevant to pathways in drug metabolism-cytochrome P450, other enzymes and the metabolism of xenobiotics by cytochrome P450 and glutathione metabolism were enriched (Figure 4B).

3.6. Comparisons of Gene Expression Patterns of Tea Leaves in T-CK, T-4 and T-A-4 Treatment

To verify the authentic transcripts levels of associated genes, 6 genes with differentially expressed transcriptomic profiles were chosen to perform qRT-PCR assays (Figure 5). The qRT-PCR result of 6 DEGs was basically in agreement with the RNA-seq results; CSS0010045 (XP_028088706.1), CSS0039460 (AUD40403.1) and CSS0040090 (XP_028085703.1) were up-regulated under T-A-4 treatment compared to under T-4 treatment. We found the expression of CSS0010045 and CSS0040090 were down-regulated in T-4 treatment and up-regulated in T-A-4 treatment. These genes were closely implicated with flavonol glycoside biosynthesis and oxidation-reduction process that were annotated as UGT and GST, respectively. GST was the master gene of the regulation of redox. Increasing evidence supports that GSTs not only can resist oxidation and relieve heavy metal toxicity, but it can also bind intracellular secondary metabolites, such as anthocyanins and plant hormones, and transport them to their corresponding positions so they can fulfil their roles. CSS0039460 and CSS0077455 (ASU87437.1) were up-regulated in T-4 treatment and T-A-4 treatment. Interestingly, we also noticed that CSS0039460 involved in inactivation activity of GAs was increased with a 28-fold upregulation in T-A-4 treatment, higher than that in T-4 treatment. In contrast, CSS007745 involved in flavonol synthesis was increased with a 2.2-fold up-regulation in T-4 treatment, higher than that in T-A-4 treatment. CSS03285 (XP_028108389.1) and CSS006514 (XP_028059482.1) were relatively up-regulated in T-A-4 treatment compared with T-4 treatment. They, respectively, were closely associated with photosynthesis and proline accumulation in tea plants, which suggested that exogenous application of 5-ALA made an important difference for the resilience of tea plants subjected to low temperature.

4. Discussion

The tea plant is one of the most important economic crops in China, and its leaves are made into tea drinks, which are deeply popular around the world [26]. Hanzhong is the northern-most tea producing area in China, with excellent tea quality. It suffers from low temperature and freezing damage every spring, which leads to a decrease in tea yield and quality. By means of transcriptome analysis of T-4 vs. T-CK, this study on tea plants exposed to low temperature preliminarily showed that genes related to plasma membrane and oxidoreductase activity were dramatically induced and caused the activity decline of metabolic pathway, which was in parallel with previous reports [12].
At present, the utilization of plant growth regulator has been deemed to be an efficient approach to alleviate the effects of chilling injury to plants. ALA is a biological source of porphyrins as well as the key precursor of chlorophyll and heme and plays a pivotal role in enhancing plant stress resistance, relieving stress damage, and improving the plant physiological characteristics [14,27]. It has been reported that ALA may improve the yield and quality of tea by increasing the photosynthetic capacity and antioxidant capacity of leaves [28]. We also observed the promoting effect of ALA in our study, as shown in Figure 2, with the comparison of T-A and T-CK. Additionally, we found that, after ALA treatment, the synthesis of flavonoids in genes related to tea plant organization and pathways of gene expression increase to a certain degree. Studies have shown that an increase in the flavonoid content of flavonoids can improve the tea flavor and taste, and some flavor substances, such as such as catechins, theanine, tea polyphenols and tea polysaccharide need flavonoids as the substrate [29].
Chilling causes enzyme inactivation, lipid peroxidation, cell membrane damage and photosynthesis inhibition in plant leaves, thus disturbing the internal environment of the plant and reducing its vigor and growth [30,31]. ALA is a key precursor for biosynthesis of porphyrin compounds, such as chlorophyll and heme. The promotion effect of ALA on freezing tolerance in plant leaves by increasing the photosynthetic capacity has been reported in other plants, such as pepper, Cinnamomum camphora and watermelon [27,32,33], which is consistent with our results. When plants are at normal temperature, exogenous application with ALA can be regarded as a porphyrinogen supplementary to positively promote chlorophyll synthesis, improve the photo contract efficiency of plants and promote plant growth and economic quality [34]. However, when plants are exposed to low temperatures, appropriate exogenous ALA treatment can supplement the loss of endogenous ALA in plants, maintain the content of porphyrin precursors required by plants and prevent further damage to the cell membrane system under low temperature.
In our study, although we have achieved consistency with the previous statement, follow up work with more rigorous experiments have shown that exogenous pretreatment with ALA before exposure to low temperature can alleviate chilling injury by means of enhancing the gene expression relevant to primary and secondary metabolic processes. Up-regulated genes involved in diterpenoid biosynthesis may also promote plant growth and development as well as tea flavor quality, to some extent (Figure 4). Of note, some studies mentioned that the waxy content in the tea plant epidermis would accumulate in response to low temperature, which was closely associated with the plants’ cold tolerance [35]. Biosynthesis of wax is one of the crucial secondary metabolic processes, and similarly, our data showed that pretreated ALA could promote expression of the genes relevant to the biosynthesis of secondary metabolites. We therefore speculated that pretreating with ALA before exposure to low temperature may promote the biosynthesis of wax, thereby alleviate the damages caused by low temperature, which deserve to be further explored in the future.
MPK signaling pathway functions have pivotal roles in the regulation of cold resistance in plants [36]. It is well-known that MPKs are indispensable hub modules that regulate the resistance and adaptation responds to low temperature, such as MPK3-ICE1, MPK6-MYB15 and MPK8-DREB1, etc. Liu et al. found that many MPKs could respond to the induction of low temperatures in tea plants [37]. Intriguingly, our study noticed that the MPK signaling pathways were markedly active after ALA treatment. These results encourage us to explore the functional characterization of MPK genes responding to ALA induction to confront low temperature in further studies. Overall, through analyzing the transcriptome data of tea plants under T-4, T-A and T-A-4 compared with T-CK treatments, we found that exogenous ALA treatment could not only promote the accumulation of flavor substances of tea plants and improve the quality of tea leaves, but also enhance the low temperature resistance of tea plants under low temperature conditions, which has far-reaching application value.

5. Conclusions

Cold treatment mainly altered transcription patterns of genes relevant to the membrane signaling pathway and secondary metabolites in tea leaves. Exogenous ALA pretreatment enhances cold resistance of tea leaves by facilitating the biochemical attributes and inducing up-regulated expression genes involved in biosynthesis of secondary metabolites and diterpenoid biosynthesis as well as the regulation of MPK signaling pathway. It provides a basis for exogenous usage of ALA to protect tea plants from cold stress.

Supplementary Materials

The following supporting information can be downloaded at: https://www.mdpi.com/article/10.3390/f14020198/s1, Table S1: List of primers for quantitative real-time PCR. Table S2: Differential expressed genes analysis in T-4 vs. T-CK comparison. Table S3: Differential expressed genes analysis in T-A vs. T-CK comparison. Table S4: Differential expressed genes analysis in T-A-4 vs. T-4 comparison.

Author Contributions

Conceptualization, F.Y. and X.L.; methodology, D.Q. and H.Z.; formal analysis, F.Y. and J.Y.; data curation, F.Y., X.C. and J.Y.; writing—original draft preparation, F.Y. and D.Q.; writing—review and editing, F.Y. and D.Q.; supervision, X.L.; funding acquisition, F.Y. and X.C. All authors have read and agreed to the published version of the manuscript.

Funding

This research was funded by the Project of Shaanxi Provincial Department of Science and Technology, grant number 2021NY-044, QBXT-Z (Z)-15-2 and 2020ZDLNY05-10 and The APC was funded by 2021NY-044.

Data Availability Statement

The data presented in this study are available on NCBI website. Accession number: SRA: SRP410544, Bioproject: PRJNA906020.

Acknowledgments

We thank Jinglong Jiang for providing the chilling artificial climate box and Jinchao Zhou (Bio-tree Biotech Co., Ltd., Shanghai, China) for his valuable suggestions. We are grateful for the Shanghai Applied Protein Technology Co., Ltd. for RNA sequencing.

Conflicts of Interest

The authors declare no conflict of interest.

References

  1. Kanwar, J.; Taskeen, M.; Mohammad, I.; Huo, C.; Chan, T.H.; Dou, Q.P. Recent advances on tea polyphenols. Front. Biosci. (Elite Ed.) 2012, 4, 111–131. [Google Scholar] [CrossRef] [PubMed]
  2. Xia, E.H.; Tong, W.; Wu, Q.; Wei, S.; Zhao, J.; Zhang, Z.Z.; Wei, C.L.; Wan, X.C. Tea plant genomics: Achievements, challenges and perspectives. Hortic. Res. 2020, 7, 7. [Google Scholar] [CrossRef] [PubMed] [Green Version]
  3. Saeed, M.; Naveed, M.; Arif, M.; Akar, M.U.; Manzoor, R.; Abd El-Hack, M.E.; Alagawany, M.; Tiwari, R.; Khandia, R.; Munjal, A.; et al. Green tea (Camellia sinensis) and l-theanine: Medicinal values and beneficial applications in humans—A comprehensive review. Biomed. Pharmacother. 2017, 95, 1260–1275. [Google Scholar] [CrossRef] [PubMed]
  4. Khan, N.; Mukhtar, H. Tea Polyphenols in Promotion of Human Health. Nutrients 2018, 11, 39. [Google Scholar] [CrossRef] [PubMed] [Green Version]
  5. Mancini, E.; Beglinger, C.; Drewe, J.; Zanchi, D.; Lang, U.E.; Borgwardt, S. Green tea effects on cognition, mood and human brain function: A systematic review. Phytomedicine 2017, 34, 26–37. [Google Scholar] [CrossRef] [Green Version]
  6. Kochman, J.; Jakubczyk, K.; Antoniewicz, J.; Mruk, H.; Janda, K. Health Benefits and Chemical Composition of Matcha Green Tea: A Review. Molecules 2020, 26, 85. [Google Scholar] [CrossRef]
  7. Hayat, K.; Iqbal, H.; Malik, U.; Bilal, U.; Mushtaq, S. Tea and its consumption: Benefits and risks. Crit. Rev. Food Sci. Nutr. 2015, 55, 939–954. [Google Scholar] [CrossRef]
  8. Pan, Y.; Zhang, H.; Zhang, D.; Li, J.; Xiong, H.; Yu, J.; Li, J.; Rashid, M.A.; Li, G.; Ma, X.; et al. Genetic analysis of cold tolerance at the germination and booting stages in rice by association mapping. PLoS ONE 2015, 10, e0120590. [Google Scholar] [CrossRef] [Green Version]
  9. Sato, Y.; Masuta, Y.; Saito, K.; Murayama, S.; Ozawa, K. Enhanced chilling tolerance at the booting stage in rice by transgenic overexpression of the ascorbate peroxidase gene, OsAPXa. Plant Cell Rep. 2011, 30, 399–406. [Google Scholar] [CrossRef]
  10. Venema, J.H.; Linger, P.; van Heusden, A.W.; van Hasselt, P.R.; Brüggemann, W. The inheritance of chilling tolerance in tomato (Lycopersicon spp.). Plant Biol. (Stuttg.) 2005, 7, 118–130. [Google Scholar] [CrossRef]
  11. Zhu, J.K. Abiotic Stress Signaling and Responses in Plants. Cell 2016, 167, 313–324. [Google Scholar] [CrossRef] [Green Version]
  12. Pareek, A.; Khurana, A.; Sharma, A.K.; Kumar, R. An overview of signaling regulons during cold stress tolerance in plants. Curr. Genomics. 2017, 18, 498–511. [Google Scholar] [CrossRef]
  13. Fotinos, N.; Campo, M.A.; Popowycz, F.; Gurny, R.; Lange, N. 5-Aminolevulinic acid derivatives in photomedicine: Characteristics, application and perspectives. Photochem. Photobiol. 2006, 82, 994–1015. [Google Scholar] [CrossRef] [PubMed]
  14. Wu, Y.; Liu, N.; Hu, L.; Liao, W.; Tang, Z.; Xiao, X.; Lyu, J.; Xie, J.; Calderón-Urrea, A.; Yu, J. 5-Aminolevulinic acid improves morphogenesis and Na+ subcellular distribution in the apical cells of Cucumis sativus L. under salinity stress. Front. Plant Sci. 2021, 12, 636121. [Google Scholar] [CrossRef] [PubMed]
  15. Akram, N.A.; Iqbal, M.; Muhammad, A.; Ashraf, M.; Al-Qurainy, F.; Shafiq, S. Aminolevulinic acid and nitric oxide regulate oxidative defense and secondary metabolisms in canola (Brassica napus L.) under drought stress. Protoplasma 2018, 255, 163–174. [Google Scholar] [CrossRef] [PubMed]
  16. Wang, L.J.; Jiang, W.B.; Huang, B.J. Promotion of 5-aminolevulinic acid on photosynthesis of melon (Cucumis melo) seedlings under low light and chilling stress conditions. Physiol. Plant. 2004, 121, 258–264. [Google Scholar] [CrossRef]
  17. Farid, M.; Ali, S.; Saeed, R.; Rizwan, M.; Bukhari, S.A.H.; Abbasi, G.H.; Hussain, A.; Ali, B.; Zamir, M.S.I.; Ahmad, I. Combined application of citric acid and 5-aminolevulinic acid improved biomass, photosynthesis and gas exchange attributes of sunflower (Helianthus annuus L.) grown on chromium contaminated soil. Int. J. Phytoremediation 2019, 21, 760–767. [Google Scholar] [CrossRef]
  18. Cai, C.; He, S.; An, Y.; Wang, L. Exogenous 5-aminolevulinic acid improves strawberry tolerance to osmotic stress and its possible mechanisms. Physiol. Plant. 2020, 168, 948–962. [Google Scholar] [CrossRef] [Green Version]
  19. Ali, B.; Tao, Q.; Zhou, Y.; Gill, R.A.; Ali, S.; Rafiq, M.T.; Xu, L.; Zhou, W. 5-Aminolevolinic acid mitigates the cadmium-induced changes in Brassica napus as revealed by the biochemical and ultra-structural evaluation of roots. Ecotoxicol. Environ. Saf. 2013, 92, 271–280. [Google Scholar] [CrossRef]
  20. Luksiene, Z.; Danilcenko, H.; Taraseviciene, Z.; Anusevicius, Z.; Maroziene, A.; Nivinskas, H. New approach to the fungal decontamination of wheat used for wheat sprouts: Effects of aminolevulinic acid. Int. J. Food Microbiol. 2007, 116, 153–158. [Google Scholar] [CrossRef]
  21. Niu, K.; Ma, X.; Liang, G.; Ma, H.; Jia, Z.; Liu, W.; Yu, Q. 5-Aminolevulinic acid modulates antioxidant defense systems and mitigates drought-induced damage in Kentucky bluegrass seedlings. Protoplasma 2017, 254, 2083–2094. [Google Scholar] [CrossRef]
  22. Rhaman, M.S.; Imran, S.; Karim, M.M.; Chakrobortty, J.; Mahamud, M.A.; Sarker, P.; Tahjib-Ul-Arif, M.; Robin, A.H.K.; Ye, W.; Murata, Y.; et al. 5-aminolevulinic acid-mediated plant adaptive responses to abiotic stress. Plant Cell Rep. 2021, 40, 1451–1469. [Google Scholar] [CrossRef] [PubMed]
  23. Gao, J.F. Experimental Guidance for Plant Physiology; Higher Education Press of China: Beijing, China, 2006; pp. 140–144. [Google Scholar]
  24. Livak, K.J.; Schmittgen, T.D. Analysis of Relative Gene Expression Data Using Real-Time Quantitative PCR and the 2−ΔΔCT Method. Methods 2001, 25, 402–408. [Google Scholar] [CrossRef] [PubMed]
  25. Dong, N.Q.; Lin, H.X. Contribution of phenylpropanoid metabolism to plant development and plant-environment interactions. J. Integr. Plant Biol. 2021, 63, 180–209. [Google Scholar] [CrossRef] [PubMed]
  26. Xia, E.H.; Zhang, H.B.; Sheng, J.; Li, K.; Zhang, Q.J.; Kim, C.; Zhang, Y.; Liu, Y.; Zhu, T.; Li, W.; et al. The Tea Tree Genome Provides Insights into Tea Flavor and Independent Evolution of Caffeine Biosynthesis. Mol. Plant 2017, 10, 866–877. [Google Scholar] [CrossRef] [Green Version]
  27. Wang, H.; Liu, Z.; Luo, S.; Li, J.; Zhang, J.; Li, L.; Xie, J. 5-Aminolevulinic acid and hydrogen sulphide alleviate chilling stress in pepper (Capsicum annuum L.) seedlings by enhancing chlorophyll synthesis pathway. Plant Physiol. Biochem. 2021, 167, 567–576. [Google Scholar] [CrossRef]
  28. An, Y.Y.; Feng, X.X.; Ding, H.Y.; Liu, L.B.; Wang, L.J. Effects of 5-aminolevulinic acid (5-ALA) on growth and quality components of spring tea. Jiangsu Agric. Sci. 2016, 44, 224–228. [Google Scholar]
  29. Musial, C.; Kuban-Jankowska, A.; Gorska-Ponikowska, M. Beneficial properties of green tea catechins. Int. J. Mol. Sci. 2020, 4, 1744. [Google Scholar] [CrossRef] [Green Version]
  30. Barton, D.A.; Cantrill, L.C.; Law, A.M.; Phillips, C.G.; Sutton, B.G.; Overall, R.L. Chilling to zero degrees disrupts pollen formation but not meiotic microtubule arrays in Triticum aestivum L. Plant Cell Environ. 2014, 37, 2781–2794. [Google Scholar] [CrossRef]
  31. Kaniuga, Z. Chilling response of plants: Importance of galactolipase, free fatty acids and free radicals. Plant Biol. (Stuttg.) 2008, 10, 171–184. [Google Scholar] [CrossRef]
  32. Sun, Y.P.; Zhang, Z.P.; Xu, C.X.; Shen, C.M.; Gao, C.; Wang, L.J. Effect of ALA on Fast Chlorophyll Fluorescence Induction Dynamics of Watermelon Leaves under Chilling Stress. Acta Hortic. Sin. 2009, 5, 671–678. [Google Scholar]
  33. Chen, H.; Xu, L.; Li, X.; Wang, D.Y.; An, Y.Y.; Wang, L.J. Promotive effect of 5-aminolevulinic acid improved cold tolerance of Rhododendron simissi and Cinnamomum camphora leaves. Plant Physiol. J. 2017, 53, 2103–2113. [Google Scholar]
  34. Wu, Y.; Liao, W.B.; Dawuda, M.M.; Hu, L.L.; Yu, J.H. 5-Aminolevulinic acid (ALA) biosynthetic and metabolic pathways and its role in higher plants: A review. Plant Growth Regul. 2019, 87, 357–374. [Google Scholar] [CrossRef]
  35. Zhu, J.; Huang, K.; Cheng, D.; Zhang, C.; Li, R.; Liu, F.; Wen, H.; Tao, L.; Zhang, Y.; Li, C.; et al. Characterization of Cuticular Wax in Tea Plant and Its Modification in Response to Low Temperature. J. Agric. Food Chem. 2022, 2, 13849–13861. [Google Scholar] [CrossRef] [PubMed]
  36. Saucedo-García, M.; González-Córdova, C.D.; Ponce-Pineda, I.G.; Cano-Ramírez, D.; Romero-Colín, F.M.; Arroyo-Pérez, E.E.; King-Díaz, B.; Zavafer, A.; Gavilanes-Ruíz, M. Effects of MPK3 and MPK6 kinases on the chloroplast architecture and function induced by cold acclimation in Arabidopsis. Photosynth. Res. 2021, 149, 201–212. [Google Scholar] [CrossRef] [PubMed]
  37. Liu, X.; Zhao, M.; Gu, C.; Jiang, H.; Sun, J.; Li, J. Genome-wide identification of MAPK family genes and their response to abiot-ic stresses in tea plant (Camellia sinensis). Open Life Sci. 2022, 8, 1064–1074. [Google Scholar] [CrossRef]
Figure 1. Landscape of the transcriptomic patterns of tea leaves after T-4, T-A and T-A-4 treatments. (A): Correlation analysis on all samples depicting two distinct clades: samples of T-CK with T-A and T-4 with T-A-4. (BD) Principle component analysis (PCA) on the transcriptomic profiles of tea leaves after T-4, T-A, T-A-4 treatments compared with untreated control. Four regions within 95% confidence intervals were formed in the PCA plots. (E,F) Venn diagram of up-regulated and down-regulated genes in T-A vs. T-CK, T-4 vs. T-CK and T-A-4 vs. T-4 pairwise comparisons. (GI) Volcano plots illustrated the differentially expression genes in T-4 vs. T-CK, T-A-4 vs. T-4 and T-ALA vs. T-CK pairwise comparisons. The up-regulated and down-regulated genes were exhibited in red and green, respectively, whereas black dots showed no significant genes in each comparison.
Forests 14 00198 g001aForests 14 00198 g001b
Figure 2. GO and KEGG enrichment analysis on the significant differential genes in T-4 vs. T-CK comparison. (A,C) Gene ontology enrichment analysis on up-regulated and down-regulated differential genes respectively in T-4 vs. T-CK comparison. DEGs were divided into biological process, cellular component and molecular function distinguished with the different adjusted P-value of each GO terms shown in vertical coordinate represented. (B,D) KEGG pathway enrichment analysis on up-regulated and down-regulated genes respectively upon T-4 treatment. (E) The expression profiles of all DEGs involved in the comparison of T-4 vs. T-CK. The red color displays up-regulated DEGs and blue color displays down-regulated DEGs in heatmap.
Forests 14 00198 g002aForests 14 00198 g002bForests 14 00198 g002c
Figure 3. The expression patterns and functional clustering of all DEGs involved in the T-A vs. T-CK comparison. (A,C) Gene ontology enrichment analysis illustrated the distribution of gene function on up-regulated and down-regulated DEGs in T-A vs. T-CK comparison. (B,D) KEGG pathway enrichment analysis on up-regulated and down-regulated DEGs in T-A compared to T-CK. (E) The heatmap showed the expression of all DEGs in the comparison of T-A vs. T-CK.
Forests 14 00198 g003aForests 14 00198 g003bForests 14 00198 g003cForests 14 00198 g003d
Figure 4. KEGG enrichment analysis of DEGs and their expression involved in the comparison of T-A-4 vs. T-4. (A,B) KEGG pathway enrichment analysis on up-regulated and down-regulated DEGs showed the distribution of metabolic pathways in pairwise comparison of T-A-4 vs. T-4 treatment. (C) The expression profiles of DEGs related to pairwise comparison of T-A-4 vs. T-4 treatment. The up-regulated DEGs were marked in red color, and down-regulated DEGs were marked in blue color in heatmap.
Forests 14 00198 g004aForests 14 00198 g004b
Figure 5. Verification of expression patterns of selected genes. Different lowercase letters of the same period indicate that there are significant differences be-tween different treatments.
Forests 14 00198 g005
Table 1. Effect of exogenous ALA on the soluble sugar, soluble protein and catechin of tea leaves under cold stress.
TreatmentSoluble Sugar/mg·g−1 FWSoluble Protein/mg·g−1 FWCatechin/%
T-42.00 ± 0.28 b6.5 ± 0.03 b21.2953 ± 0.18 b
T-A-42.51 ± 0.37 a12.5 ± 0.01 a25.1329 ± 0.78 a
Note: Different lowercase letters of the same period indicate that there are significant differences between different treatments (p < 0.05).
Table 2. Effect of exogenous application of ALA on photosynthetic gas exchange parameters of tea leaves under cold stress.
TreatmentPn/μmol·m−2·s−1Gs/mmol·m−2·s−1Ci/μmol·m−2·s−1Tr/mmol·m−2·s−1
T-47.84 ± 1.27 b0.15 ± 0.02 b333.93 ± 7.18 b2.32 ± 0.28 b
T-A-49.71 ± 0.95 a0.18 ± 0.03 a344.83 ± 6.82 a2.75 ± 0.37 a
Note: Different lowercase letters of the same period indicate that there are significant differences between different treatments (p < 0.05).
Table 3. Characteristics of transcriptome assembly under T-4, T-A and T-A-4 with T-CK treatments in tea leaves.
SampleRaw_
Reads
Clean_
Reads
Clean_
Bases
Total MappedQ30
(%)
GC
(%)
T-4-146,131,83443,884,1326.06 G36,372,232 (82.88%)92.6645.6
T-4-253,488,41051,423,3747 G43,689,622 (84.96%)93.0146.92
T-4-367,969,46865,244,8048.9 G56,146,303 (86.05%)92.9846.79
T-A-4-148,710,74846,941,1446.28 G40,265,286 (85.78%)93.3846.71
T-A-4-248,831,25447,023,4266.32 G40,779,946 (86.72%)93.2346.96
T-A-4-366,347,65064,169,1308.29 G56,095,572 (87.42%)93.346.67
T-A-145,848,70644,118,7405.85 G38,279,165 (86.76%)92.5246.67
T-A-245,982,25444,344,8845.86 G37,938,206 (85.55%)93.1746.64
T-A-349,396,79447,419,0106.45 G38,364,744 (80.91%)93.0246.66
T-CK-149,388,82247,395,5166.47 G40,176,843 (84.77%)93.0247.95
T-CK-249,277,52447,575,9566.25 G39,837,399 (83.73%)93.2446.95
T-CK-343,145,13041,371,4925.62 G34,751,359 (84.00%)93.0446.91
Table 4. Overview of DEGs in three pairwise comparisons.
DEGs SetUp-RegulatedDown-RegulatedTotal DEGs
T-CK vs. T-4237526154900
T-CK vs. T-A103120223
T-4 vs. T-A-4137992
Disclaimer/Publisher’s Note: The statements, opinions and data contained in all publications are solely those of the individual author(s) and contributor(s) and not of MDPI and/or the editor(s). MDPI and/or the editor(s) disclaim responsibility for any injury to people or property resulting from any ideas, methods, instructions or products referred to in the content.

