Article

Analysis of the Cell Structural Characters of Moso Bamboo  (Phyllostachys edulis (Carriere) J. Houzeau) and Its Varieties

1
International Center for Bamboo and Rattan, Beijing 100102, China
2
Key Laboratory of National Forestry and Grassland Administration/Beijing for Bamboo & Rattan Science and Technology, Beijing 100102, China
3
Pingxiang Bamboo Forest Ecosystem Research Station, Pingxiang 532600, China
*
Author to whom correspondence should be addressed.
Forests 2023, 14(2), 235; https://doi.org/10.3390/f14020235
Submission received: 24 December 2022 / Revised: 23 January 2023 / Accepted: 24 January 2023 / Published: 27 January 2023
(This article belongs to the Special Issue Protection and Modification of Wood and Bamboo Materials)

Abstract

:
In recent years, bamboo has been well exploited in the pulp and paper industry. Moso bamboo (Phyllostachys edulis (Carriere) J. Houzeau; hereafter M), originated from China with a long history of cultivation as the most abundant resource with the widest distribution area among bamboo plants in China. In this study, Moso bamboo (M) and nine bamboo varieties were selected in the bamboo germplasm resources storage bank of the Anhui Taiping Experimental Station of ICBR. The characteristics of their cell structures were compared, and the differences were analyzed from a genetic perspective. The results showed that M had the highest fiber cell length, fiber cell width, length, and parenchyma width, while GJ showed the lowest of these measurements [P. edulis ’Kikko-chiku’,G.H.Lai]. The fiber wall thickness of Q [P. edulis f. obliquinoda (Z.P.Wang et N.X.Ma) Ohrnberger] was the smallest, while its fiber lumen diameter was the highest in the group. The parenchyma wall thickness and parenchyma lumen diameter of Q were the smallest in the group. The fiber cells of M and Q had better flexibility, which is conducive to improving the tensile strength, break resistance, and folding resistance of paper made from these materials. SY and GJ may be more suitable for ornamental items because of their special appearances. The purpose of this study was to explore the genetic variation patterns of various cell structure indicators among Moso bamboo and its varieties, as well as to develop a strategy of bamboo growing and lumbering based on the local conditions, providing reference data for the utilization of non-woody forest resources.

1. Introduction

In recent years, bamboo has been well-exploited in the pulp and paper industry [1]. Due to its smooth surface and high ink-holding capacity [2,3], bamboo paper is often utilized as high-end calligraphy paper [4,5,6]. Bamboo fiber cells finish growing with regard to length during the fast-growing period [5,7], while the fiber cell walls are thickened during culm maturation [8]; that is, additional thin layer structures are gradually layered on the cell walls, so that the cell walls are thickened bit by bit. This process can last for several growing seasons. As the bamboo matures, these structural changes can affect the properties and applications of bamboo [5]. Previous studies have shown that the anatomical properties of bamboo are related to its toughness, processing properties, and strength [9,10,11,12]. The radial/tangential ratio of the vascular bundle is significantly correlated with the density and drying shrinkage of bamboo [13,14,15]. The fiber cell length and fiber cell wall thickness influence the compressive strength and the modulus of elasticity of bamboo [16,17], and fiber cell length is also an important indicator for assessing its papermaking property [18,19]. During the production of bamboo, if all kinds of tissue are not separated in advance, the parenchyma cells either exist in the product in a form that is not conducive to quality, or are discharged as waste, causing a low utilization rate and a waste of resources [20].
Moso bamboo (Phyllostachys edulis (Carrière) J. Houzeau; hereafter M), originated from China and is an evergreen arbor-like bamboo plant belonging to the Bambusoideae subfamily of Poaceae [21]. With a long history of cultivation, it is a bamboo species that embraces the most abundant resources and the widest distribution area among bamboo plants in China [22,23]. Characterized by strong adaptability, broad usage, and extremely high economic value, Moso bamboo is regarded as one of the most versatile tree species among forest woody bamboo and occupies a significant position in bamboo resources in China and around world [22,24,25]. Nearly 30 varieties of Moso bamboo have been formed due to differences in cultivation history and environmental conditions [26,27,28,29]. To make full and reasonable use of the resources of M and its varieties in China, understanding the variation rules and the patterns of its cell structures is the goal in conducting genetic improvements on M and its varieties. At present, although there are a great number of studies on the anatomical properties of bamboo [30,31,32,33,34,35,36], the cell structures of M and its varieties have not yet been reported from the perspective of forest genetic breeding.
In this study, R language-based statistical analyses were employed to investigate M and its nine varieties, HC [P. edulis f.luteosulcata (Wen) Chao et Renv.], LC [P. edulis f.bicolor (Nakai) G.H.Lai], JS [P. edulis f.gracilis (Hsiung) Chao et Renv.],HPH [P. edulis f.huamozhu (Wen) Chao et Renv.], LPH [P. edulis f.nabeshimana (Muroi) Chao et Renv.], Q [P. edulis f.obliquinoda (Z.P.Wang et N.X.Ma) Ohrnberger.],HB [P. edulis f.pachyloen (G.Y.Yang et al.) Y.L.Ding ex G.H.Lai.], SY [P. edulis f.tubaeformis (S.Y.Wang) Ohrnberger], and GJ [P. edulis ’Kikko-chiku’,G.H.Lai]. The characteristics of their cell structures were compared, and the differences were analyzed from a genetic perspective. The purpose of this study was to explore the genetic variation patterns of various cell structure indicators among M and its varieties, as well as to develop a strategy of bamboo growing and lumbering based on the local conditions, providing reference data for the utilization of non-woody forest resources.

2. Materials and Methods

2.1. Plant Materials

In mid-August 2019, Moso bamboo (M) and nine bamboo varieties were selected to lay out in sampling plots in the bamboo germplasm resources storage bank of Anhui Taiping Experimental Station of ICBR (118°02’ E, 30°20’ N) (Table 1). The area of each sample plot was 10 meters by 10 meters. The bamboo samples were chosen from areas with similar site conditions, such as slope position and slope direction. Three healthy bamboo plants were selected with the same size, growth, and crown width in each variety. The intact bamboo tube at 1.3 m DBH was selected as the experimental material [37,38,39].

2.2. Detection of Cell Structure Properties

2.2.1. Determination of Vascular Bundle Sizes

Sample size was 10 mm × 10 mm × t mm (bamboo wall thickness). The samples in the middle of the internodes were harvested as the test materials. After the samples were boiled and softened for 2–3 h, they were cut into 30–40 μm-thick slices by sliding microtome, which was followed by air-drying into permanent slices. Then the slices were imaged under a stereoscopic microscope (Stemi 305, Zeiss, Germany). Image analysis software (Zen lite 2.3, Zeiss, Germany) was used to radially divide the bamboo walls into three equal parts along the bamboo wall, which were respectively recorded as Bamboo Yellow, Bamboo Middle, and Bamboo Green. The vascular bundle outside bamboo culm is small, densely distributed, and is called Bamboo Green. Close to the inside part of bamboo culm, the vascular bundle is large with sparse distribution, which is known as Bamboo Yellow. The transitional part between the two is called Bamboo Middle. The radial/tangential ratios of vascular bundles were determined by measuring the length of vascular bundles in the radial and tangential circumference directions [39,40].

2.2.2. Determination of the Length and Width of Fiber Cells and Parenchyma Cells

The matchstick-like sample of Bamboo Middle, about 2 cm long, was put into a test tube. Via the segregation process [39,41], the samples were immersed in segregation solution (Jeffrey, 10% chromic acid: 10% nitric acid = 1:1). Then the samples were put in a water bath and isolated for 1–2 h at a constant temperature of 55 °C. After the sample was completely segregated, the segregation solution was poured out, and the sample was washed with distilled water and prepared into a temporary slice. The length and width of 30 fiber cells and 30 parenchyma cells randomly selected from each part were measured using a digital display measuring projector (50×) [39,41,42].

2.2.3. Determination of Wall Thickness and Lumen Diameters of Fiber Cells and Parenchyma Cells

In this study, a permanent slice of a cross section of bamboo was made, and the wall thickness of fiber cells and parenchyma cells referred to the single wall thickness of cells. Using the microscopic imaging system (400×), the wall thickness and lumen diameters of fiber cells and parenchyma cells in the prepared permanent slices were measured with the software (Zen lite 2.3, Zeiss, Germany). Measurements were conducted on 30 fiber cells and 30 parenchyma cells randomly selected from each part [39,43].

2.3. Data Processing and Analysis

Ten anatomical traits were measured in the stems of Moso bamboo, including the tangential length of vascular bundle, radial length of vascular bundle, radial/tangential ratio of vascular bundle, fiber length, fiber width, fiber cell wall thickness, fiber lumen diameter, parenchyma length, parenchyma width, and parenchyma wall thickness. The data were processed and analyzed using R statistical software (version 3.6.3) [44]. The normality test was conducted using the shapiro.test function in the stats package, and normal distribution fitting diagrams were drawn. The bartlett.test function was used to detect the homogeneity of variance. The lm function in the stats package was used for regression equation fitting. The aov function was adopted for conducting a one-way analysis of variance (ANOVA). The glht function in the multicomp package was used for multiple comparison analyses. The prcomp function in the stats package was used for principal component analyses (PCAs). The analyses could obtain the eigenvalue and contribution rate. The scree plots of PCAs were drawn by the fa.parallel function in the psych package [44,45].

3. Results

3.1. Genetic Variation of The Vascular Bundle-Related Indexes

Vascular Bundle Size

In this study, the vascular bundle size was determined by measuring the tangential length, radial length, and radial/tangential ratio of vascular bundles. According to the results (Table 2 and Table 3), there were extremely significant differences (p = 1.66 × 10−55) in the tangential length of vascular bundles among M and its nine varieties, with a change range of 279.23–627.11 μm. In detail, the tangential length of the vascular bundle of M was 377.50 μm, shorter than that of the nine varieties, but it had no significant difference from that of GJ and LC. JS presented the longest tangential length of vascular bundles (526.04 μm), showing an extremely significant difference from M and other varieties.
The radial length of vascular bundles of M and its nine varieties demonstrated an extremely significant difference (p = 6.04 × 10−77), with a change range of 317.58–659.67 μm. GJ had the shortest radial length of vascular bundles (399.31 μm), and it presented extremely significant differences from other varieties, except for LC and M. LPH showed the longest radial length of vascular bundles (526.04 μm).
The radial/tangential ratios of vascular bundles of M and its nine varieties showed extremely significant differences (p = 4.82 × 10⁻²⁴), with a change range of 0.79–1.87. The radial/tangential ratio of vascular bundles of SYZ was the lowest (1.00), presenting extremely significant differences from that of M, LPH, HC, HPH, Q, and HB. HB possessed the highest radial/tangential ratio of vascular bundles (1.33), demonstrating extremely significant differences from that of M and other varieties.
The coefficients of variation for the tangential and radial length of vascular bundles of M were the highest (11.70% and 12.87%, respectively). The coefficients of variation for the tangential and radial length of vascular bundles of the nine varieties were apparently lower (5.22%–10.03% and 5.12%–11.54%, respectively) than those of M. The coefficient of variation for the radial/tangential ratio of vascular bundles of M was 15.34%, second only to that of HP, while it ranged from 7.82% to 13.38% among the other eight varieties. The results showed that the variations in tangential length, radial length, and radial/tangential ratio of vascular bundles were relatively low among M and its nine varieties.

3.2. Genetic Variation of Fiber Cell Morphology

3.2.1. Fiber Cell Length and Width

Based on genetic variation analysis of the fiber cell length and width of M and its nine varieties (Table 4 and Table 5), it was found that fiber cell length ranged from 1008.68 μm to 3482.49 μm, showing extremely significant differences (p = 8.70 × 10⁻³²). Among them, the fiber cell length of SY was the shortest (1282.30 μm), presenting extremely significant differences from that of M and other varieties. The fiber cell length of M was the longest (2411.27 μm), showing extremely significant differences from that of the other seven varieties (except HC and HPH).
Fiber cell width appeared to display a similar trend to fiber cell length. Specifically, the fiber cell width of SY was the shortest (13.21 μm), while the fiber cell width of M was the longest (23.10 μm), demonstrating extremely significant differences from that of the nine varieties. The change range of fiber cell width was 7.15–27.75 μm, displaying extremely significant differences among M and its nine varieties (p = 4.82 × 10−46).
The coefficients of variation for the fiber cell length and width of M were the lowest (5.97% and 8.63%, respectively). The coefficients of variation for the fiber cell length and width of the nine varieties were considerably higher (11.19%–25.45% and 14.67%–24.94%, respectively) than those of M. The coefficient of variation for the fiber cell length of Q was 25.41%, which was second only to that of JS (25.45%). The above results showed that little variation was present in the fiber cell length and width of M in the internodes, while strong variation was observed in the fiber cell length and width among the nine varieties of M.

3.2.2. Fiber Cell Wall Thickness and Lumen Diameter

Genetic variation analysis of the fiber cell wall thickness and lumen diameter of M and its nine varieties (Table 4 and Table 5) showed that the fiber cell wall thickness of M and its nine varieties varied between 1.67 μm and 14.45 μm, demonstrating extremely significant differences (p = 3.91 × 10⁻²⁶). Among them, the fiber cell wall thickness of SY was the largest (9.74 μm), followed by that of M (7.26 μm), and the fiber cell wall thickness of Q was the smallest (2.96 μm), presenting extremely significant differences from that of M and other varieties.
The fiber lumen diameters of M and its nine varieties ranged from 1.07 to 6.96 μm, and there were extremely significant differences among them (p = 1.45 × 10⁻¹⁹). Unlike with fiber cell wall thickness, the fiber lumen diameter of Q was the longest (4.79 μm), followed by that of M (3.36 μm), showing extremely significant differences from that of M and other varieties. HPH had the shortest fiber lumen diameter (2.17 μm), only presenting extremely significant differences from that of M and Q.
M possessed the lowest coefficients of variation for both fiber cell wall thickness and lumen diameter (9.64% and 10.15%, respectively). The coefficients of variation for fiber cell wall thickness of the nine varieties were obviously higher than that of M, especially that of Q (62.61%), and the coefficients of variation for the remaining eight varieties of M ranged from 19.54% to 32.73%. The coefficients of variation for the lumen diameters of the nine varieties were apparently higher (17.14%–33.45%) than that of M, and Q had the maximum value of 33.45%. The results showed that the genetic variation of fiber cell wall thickness and lumen diameter for M was strong, and its nine varieties showed relatively strong variation, with Q’s variation being the strongest.

3.3. Genetic Variation of Parenchyma Cell Morphology

3.3.1. Parenchyma Cell Length and Width

Through genetic variation analysis of the parenchyma cell length and width of M and its nine varieties (Table 6 and Table 7), it was found that the parenchyma cell length of M was the largest (135.45 μm), showing extremely significant differences from that of the nine varieties. The parenchyma cell length of GJ was the smallest (65.48 μm), merely presenting extremely significant differences from that of LC, HC, HPH, and M. Parenchyma cell lengths ranged from 33.45 to 170.87 μm, generally showing extremely significant differences (p = 2.09 × 10−47).
The parenchyma cell width of M and its nine varieties varied from 19.13 μm to 75.05 μm, showing extremely significant differences (p = 1.45 × 10⁻³⁵). Similar to the parenchyma cell length, the parenchyma cell width of GJ was the smallest (30.70 μm), presenting extremely significant differences from that of M and its varieties, except for HP and SY. The parenchyma cell width of HPH was the largest (54.05 μm), followed by that of M (51.63 μm). There was no significant difference between HPH and M, but they were extremely and significantly different from that of the other eight varieties, suggesting that parenchyma cell length and width follow a similar variation trend.
M had the lowest coefficients of variation for parenchyma cell length and width (7.70% and 8.47%, respectively), while the nine varieties possessed much higher coefficients of variation for both (19.94%–33.67% and 17.46%–28.38%, respectively) than M. The results showed different degrees of genetic variation in the parenchyma cell length and width among M and its nine varieties; genetic variation of the parenchyma cell length and width of M was relatively low, while the coefficients of variation for those of the nine varieties were high, with JS’s variation being the greatest.

3.3.2. Parenchyma Cell Wall Thickness and Lumen Diameter

Genetic variation analysis of the parenchyma cell wall thickness and lumen diameter of M and its nine varieties (Table 6 and Table 7) revealed that the parenchyma cell wall thickness of Q was the smallest (2.69 μm), demonstrating extremely significant differences from that of M and the other eight varieties. The parenchyma cell wall thickness of JS was the largest (5.73 μm), followed by that of M (5.64 μm), with no significant difference between the two. Parenchyma cell wall thicknesses ranged from 1.00 to 9.15 μm, generally displaying significant differences (p = 3.91 × 10⁻²⁶).
The parenchyma lumen diameters of M and its nine varieties ranged from 3.07 to 57.64 μm, with extremely significant differences (p = 1.45 × 10⁻¹⁹). Similar to the parenchyma cell wall thickness, the parenchyma lumen diameter of Q was the smallest (10.73 μm), showing extremely significant differences from that of M and its other eight varieties. The parenchyma lumen diameter of HC was the largest (33.98 μm), showing an extremely significant difference from that of M (25.39 μm).
M had the lowest coefficients of variation for parenchyma cell wall thickness and lumen diameter (16.88% and 12.69%, respectively). The coefficients of variation for the nine varieties were higher than those of M. The coefficients of variation for the parenchyma cell wall thickness and lumen diameter of Q reached 67.05% and 94.30%, respectively. Meanwhile, the coefficients of variation for the parenchyma cell wall thickness and lumen diameter of the other eight varieties of M ranged from 17.88% to 26.57% and from 28.16% to 43.74%, respectively. The above results revealed that there was great variation in parenchyma cell wall thickness and lumen diameter among M and its nine varieties, and the variation of Q was particularly high.

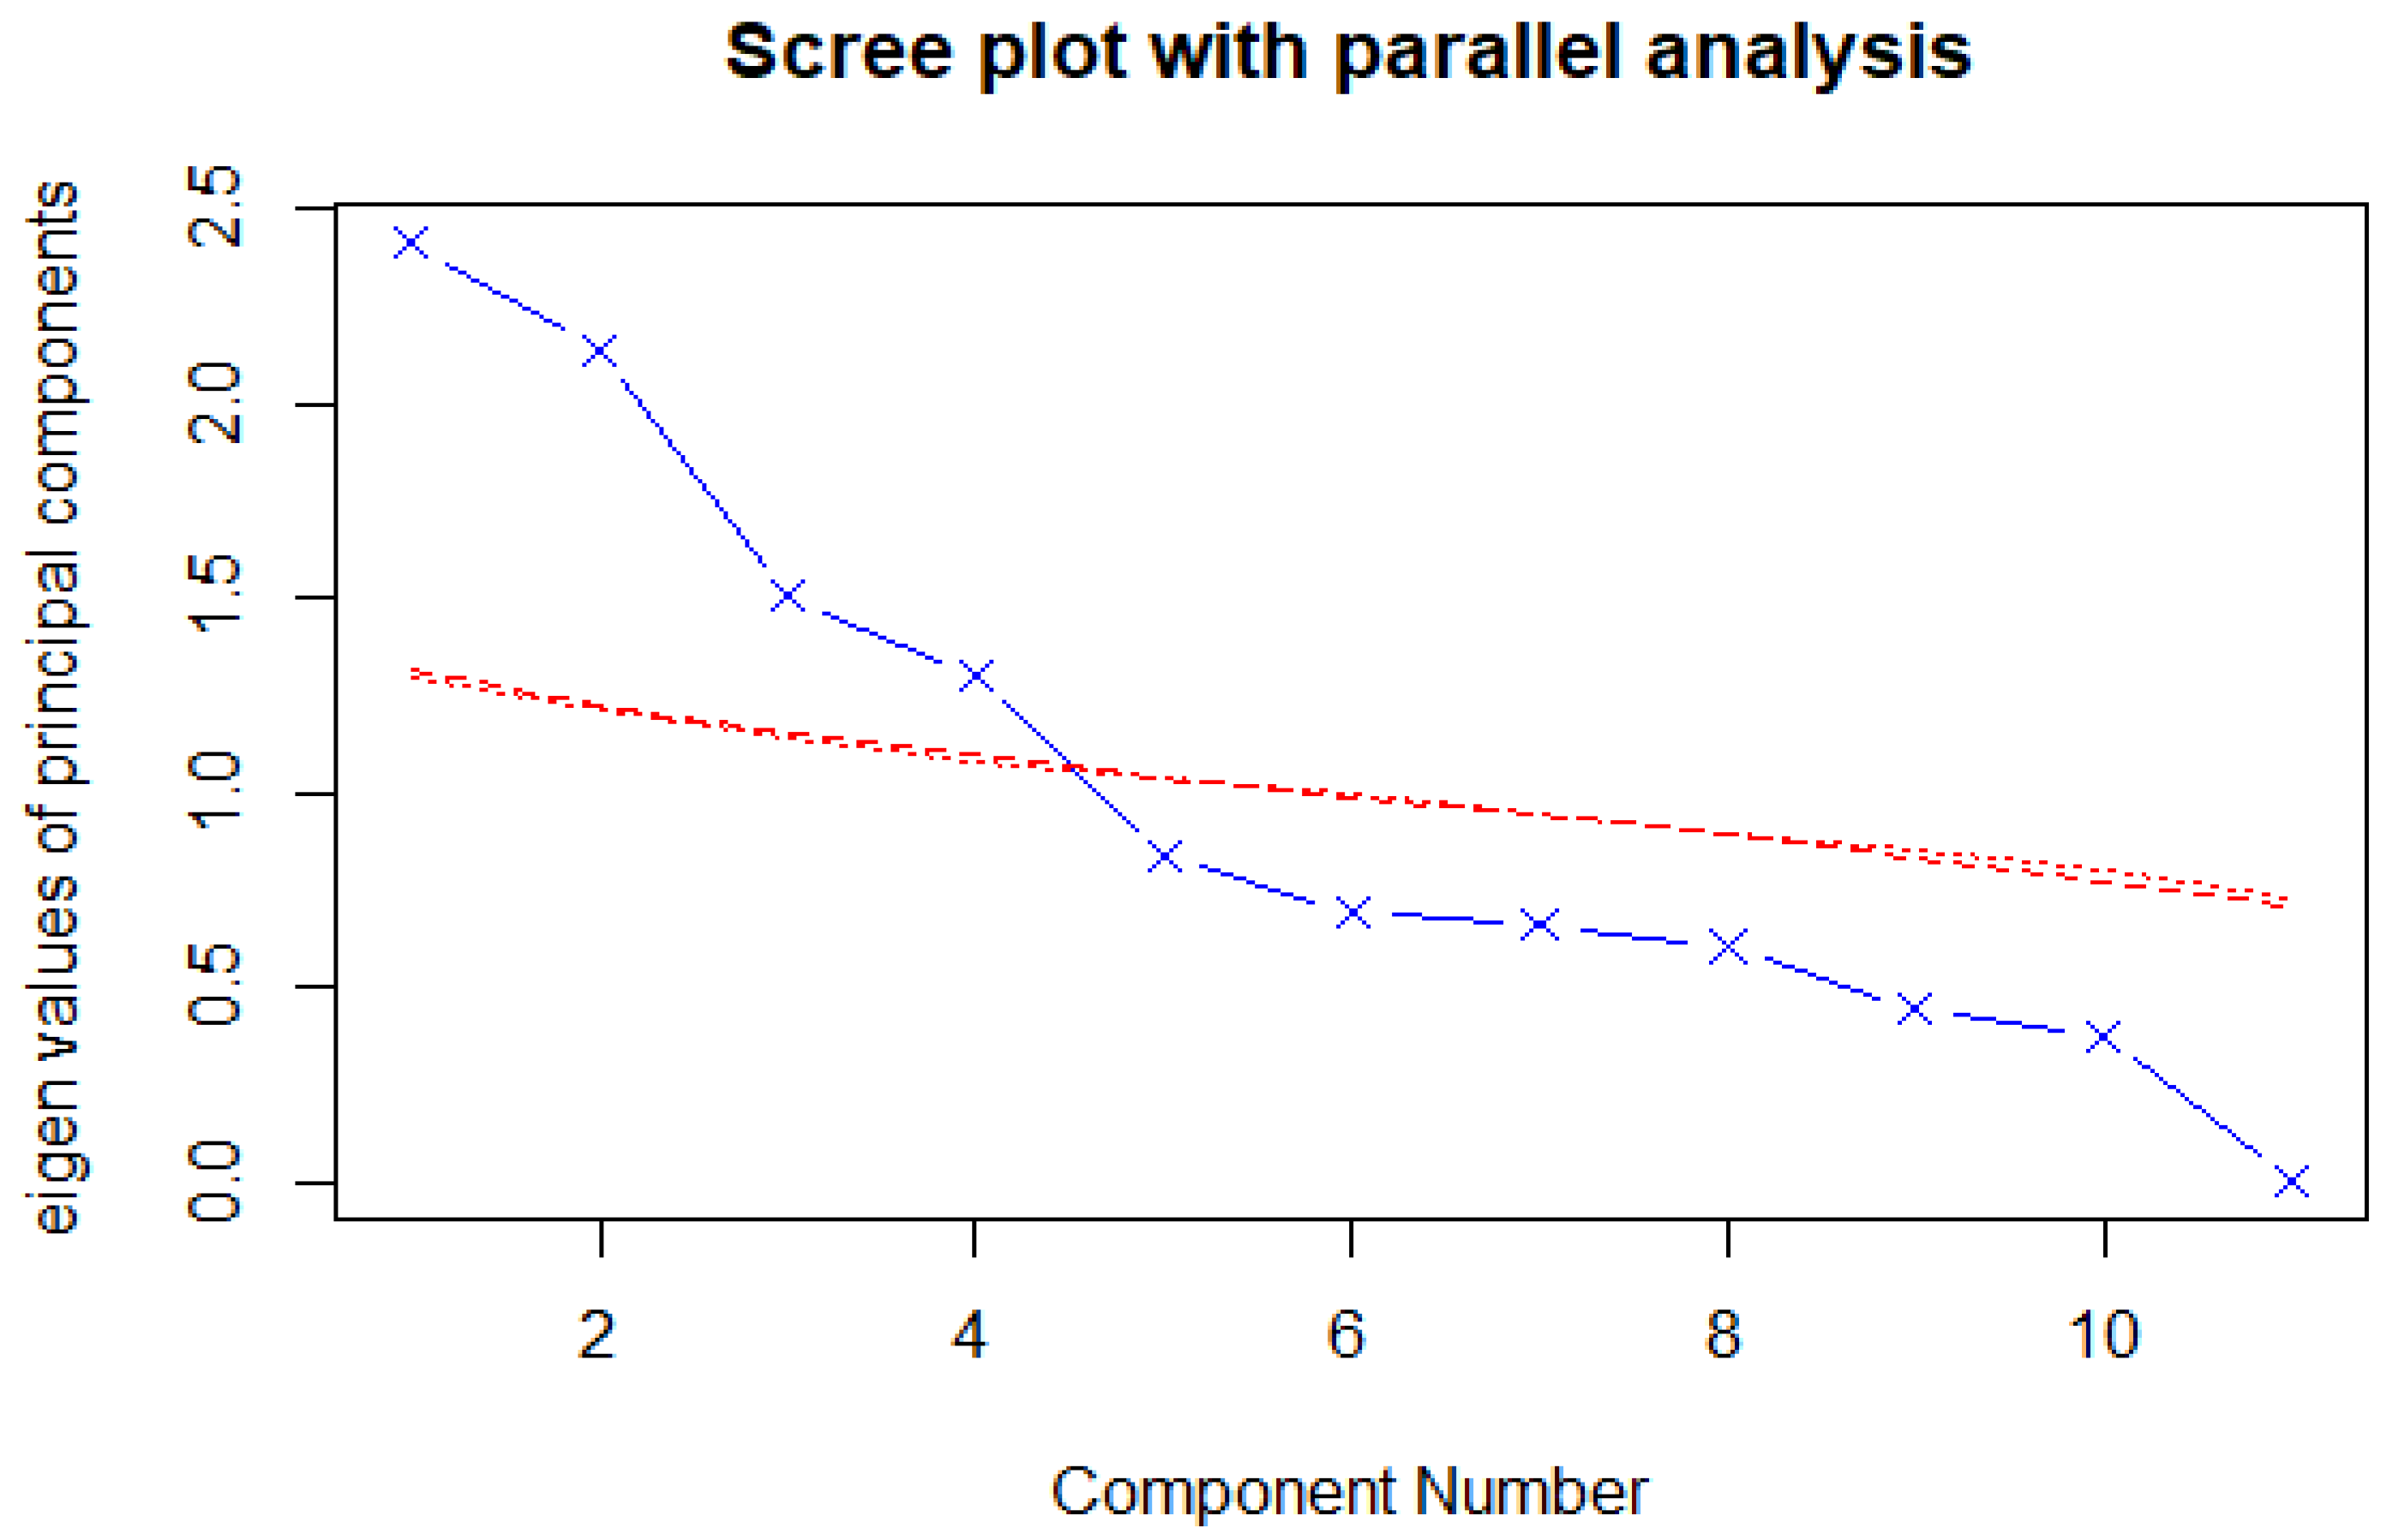
3.4. Principal Component Analysis (PCA)

PCA was performed on 11 cell structural traits of Moso bamboo and its nine varieties. Figure 1 shows the lithoclast test based on observed eigenvalues. The horizontal line shows the eigenvalues of the principal components of 11 traits. The dashed line is the mean parallel analysis of 100 simulations. When the principal components of the traits both satisfy that the eigenvalue was greater than one and above the dotted line, they could be preserved. In this study, four principal components could preserve most of the information in the dataset. Meanwhile, according to the proportion of variance, cumulative proportions, and standard deviations of the PCA of cell structure (Table 8), PC1 explained 22.18% of the variance of cell structure traits on Moso bamboo and its nine varieties. while PC2, PC3, and PC4 explained 19.45%, 13.68%, and 11.85% variance, respectively, and a total of 67.16% of the variance was explained. Further observation on the proportion of variance showed that the difference in the contribution rates of each adjacent principal component was not high, which may be due to the relatively balanced contribution of these 11 traits to the overall cell structure information. After comprehensive consideration, although the cumulative proportions of PC1–PC4 were less 80%, their eigenvalues were all greater than one. Therefore, it was determined that these four principal components could basically represent the variation of 11 cell structural traits on Moso bamboo and its nine varieties.
According to the proportion of variance of the PCA of each cell structure trait (Table 9), the first principal component was negatively correlated with tangential vascular bundle length, fiber lumen diameter, and parenchyma cell wall thickness and positively correlated with the other eight traits, among which fiber cell width contributed the most. In the second, third, and fourth principal components, the greatest contributions were made by radial vascular bundle length, tangential vascular bundle length, and radial/tangential vascular bundle ratio, which explained that they were closely related to the traits of the vascular bundle. Combined with the proportion of variance of each principal component and the proportion of variance of 11 cell structural traits from each principal component, fiber cells and vascular bundles represented the main cell structural traits in the investigated traits to varying degrees.

4. Discussion

In this study, the genetic variation in the cell structure traits of M and its nine varieties was analyzed. The results showed that 11 cell structure traits had significant differences among populations. M had the highest length and width of fiber cells and parenchyma cells, and GJ had the lowest. Q had the smallest wall thickness and the biggest lumen diameter of the fiber cell, and the smallest wall thickness and lumen diameter of the parenchyma cell.
The genetic variation in the cell structure traits of M and its nine varieties was analyzed. The results showed that there were significant differences in 11 cell structure traits of M and its nine varieties among populations. Among the morphological traits of fiber cells, the lengths and widths of fiber cells were the highest (2411.27 μm and 23.10 μm) in M, and the lowest in SY and GJ. This may be directly related to their appearance, and the shorter longest internode lengths of SY and GJ might lead to shorter fiber lengths and widths [46,47]. With regard to fiber cell wall thickness and lumen diameter, Q and M, with the smallest fiber cell wall thicknesses (2.96 μm and 7.26 μm, respectively), had the largest fiber cell lumen diameters (4.79 μm and 3.36 μm, respectively). The larger lumen diameter and thinner fiber cell wall thickness of M and Q indicated that their fiber cells have better flexibility. This is conducive to improving the tensile strength, break resistance, and folding resistance of paper. SY and GJ may be more suitable for ornamental items because of their special appearances. HPH had the shortest fiber lumen diameter (2.17 μm), only presenting extremely significant differences from that of M and Q, which suggested an opposite variation trend between the fiber cell wall thickness and the fiber lumen diameter of Q, which is similar to Abd’s conclusion that fiber cell wall thickness is positively correlated with the compressive strength [16]. However, fiber lumen diameter is negatively correlated with compressive strength.
Among the morphological traits of parenchyma cells, parenchyma length was also the highest (135.45 μm) in M, although the thickness of its parenchyma cells was the second highest (51.63 μm), but there was no significant difference from the highest value (54.05 μm) in M. The lengths and widths of parenchyma cells were the smallest (65.48 μm and 30.70 μm) in GJ [46,48]. Parenchyma wall thickness and lumen diameter were the smallest in Q: 2.69 μm and 10.73 μm, respectively. Above all, the parenchyma cells of GJ were shorter and narrower, and those of Q was thinner and had small lumen diameters. Therefore, the sections of the bearing elements were relatively small. This may not provide good tensile and interlaminar shear properties. There were no significant correlation traits for M [46,48]. There was no obvious rule regarding the traits of the vascular bundle. The tangential length of vascular bundle of M was the smallest (377.50 μm), which was smaller than that of the other nine varieties.
From the results of the coefficients of variation, the degree of variation for tangential length and radial length of the vascular bundle were small: all less than 15%. However, the radial/tangential ratio of the vascular bundle was relatively small: only the coefficient of variation for M and HB were 15.34% and 17.74%, and the others were less than 15%. Among the four traits of the fiber cell, the coefficient of variation for M was the smallest, and almost all of them were less than 10%, indicating that the degree of variation for fiber cell morphology was the smallest among populations. Among the four traits of parenchyma, the coefficient of variation for M was also the smallest. Except for the coefficient of variation for parenchyma wall thickness, which was 16.88%, the other three traits were all less than 15%, indicating that the degree of variation for parenchyma traits among populations was relatively small [46,48,49]. The overall variations for traits of the fiber cell and parenchyma cell were relatively large. This indicated that they may be easily affected by environmental and genetic factors; thus, it is appropriate to study environmental factors and genotypes. The coefficient of variation for vascular bundle traits was smaller, indicating that these traits were relatively stable and may not be easily affected by other factors.
Genetic variation in plants is the basis of genetic improvement: the greater the variation, the better the improvement effect. In this study, a large sample size was used to analyze the cell structure of M and its varieties, which was the result of long-term natural and artificial selection [50,51,52]. However, due to the changes in terrain, climate, soil, and other conditions, through long-term natural selection and artificial selection, M has produced intraspecific variation [53,54], which is the result of the joint action of genetic factors and environmental factors. Therefore, the variation in cell structure must contain genetic variation. Through conventional and new technological breeding methods, it is possible to develop new strains desired by different breeding objectives.

5. Conclusions

In this study, the genetic variation of the cell structure traits of M and its nine varieties was analyzed. The results showed that 11 cell structure traits had significant differences among populations. M had the longest length and width of fiber cells and parenchyma cells, and GJ had the lowest. Q had the smallest wall thickness and the biggest lumen diameter of fiber cells, and the smallest wall thickness and lumen diameter of parenchyma cells. The fiber cells of M and Q had better flexibility, which is conducive to improving the tensile strength, break resistance, and folding resistance of paper. SY and GJ may be more suitable for ornamental items because of their special appearances. The overall variation in the traits of fiber cells and parenchyma cells was relatively large, which indicated that they may be easily affected by environmental and genetic factors; therefore, it is appropriate to study environmental factors and genotypes.

Author Contributions

W.Z. and T.H. conceived of the project. W.Z. and T.H. planned the analytical approach. W.Z., Z.J. and B.F. wrote the original paper. W.Z. and Y.C. conducted the field survey. W.Z. and Y.C. analyzed the data. W.Z., Y.M. and Y.D. visualized the tables and figures. X.Z. contributed to data interpretation and edited the paper. All authors have read and agreed to the published version of the manuscript.

Funding

This research was supported by ICBR Fundamental Research Funds Grant (NO.1632020028), Young Elite Scientists Sponsorship Program by CAST (NO. 2018QNRC001), and National Key R&D Program of China (2021YFD2200504).

Acknowledgments

The study thanks the pre-emptive support of the National Key Technology R&D Program of China (2015BAD04B03).

Conflicts of Interest

The authors declare no conflict of interest.

References

  1. Fei, B.; Gao, Z.; Wang, J.; Liu, Z. Chapter 14—Biological, Anatomical, and Chemical Characteristics of Bamboo. In Secondary Xylem Biology; Kim, Y.S., Funada, R., Singh, A.P., Eds.; Academic Press: Boston, MA, USA, 2016; pp. 283–306. [Google Scholar]
  2. Wu, C.J.; Zhang, J.C.; Yu, D.M.; Li, R.G. Dissolving pulp from bamboo-willow. Cellulose 2018, 25, 777–785. [Google Scholar] [CrossRef]
  3. Yu, Y.; Wang, H.K.; Lu, F.; Tian, G.L.; Lin, J.G. Bamboo fibers for composite applications: A mechanical and morphological investigation. J. Mater. Sci. 2014, 49, 2559–2566. [Google Scholar] [CrossRef]
  4. Cao, X.; Li, F.; Zheng, T.; Li, G.; Wang, W.; Li, Y.; Chen, S.; Li, X.; Lu, Y. Cellulose-Based functional hydrogels derived from bamboo for product design. Front Plant Sci 2022, 13, 958066. [Google Scholar] [CrossRef] [PubMed]
  5. Van Dam, J.E.G.; Elbersen, H.W.; Daza Montaño, C.M. 6—Bamboo Production for Industrial Utilization. In Perennial Grasses for Bioenergy and Bioproducts; Alexopoulou, E., Ed.; Academic Press: Boston, MA, USA, 2018; pp. 175–216. [Google Scholar]
  6. Sugesty, S.; Kardiansyah, T.; Hardiani, H. Bamboo as Raw Materials for Dissolving Pulp with Environmental Friendly Technology for Rayon Fiber. Procedia Chem. 2015, 17, 194–199. [Google Scholar] [CrossRef] [Green Version]
  7. Gratani, L.; Crescente, M.F.; Varone, L.; Fabrini, G.; Digiulio, E. Growth pattern and photosynthetic activity of different bamboo species growing in the Botanical Garden of Rome. Flora—Morphol. Distrib. Funct. Ecol. Plants 2008, 203, 77–84. [Google Scholar] [CrossRef]
  8. Huang, Y.; Fei, B.; Wei, P.; Zhao, C. Mechanical properties of bamboo fiber cell walls during the culm development by nanoindentation. Ind. Crops Prod. 2016, 92, 102–108. [Google Scholar] [CrossRef]
  9. Wahab, R.; Mohamed, A.; Mustafa, M.T.; Hassan, A. Physical Characteristics and Anatomical Properties of Cultivated Bamboo (Bambusa vulgaris Schrad.) Culms. J. Biol. Sci. 2009, 9, 753–759. [Google Scholar] [CrossRef]
  10. Parameswaran, N.; Liese, W. On the fine structure of bamboo fibres. Wood Sci. Technol. 1976, 10, 231–246. [Google Scholar] [CrossRef]
  11. Liese, W. Anatomy and Properties of Bamboo; Bamboos; Geselschaft fiir Technische Zusanimenarbeit: Deutsche, Germany, 1985. [Google Scholar]
  12. Akinlabi, E.T.; Anane-Fenin, K.; Akwada, D.R. Properties of Bamboo. In Bamboo: The Multipurpose Plant; Springer International Publishing: Cham, Switzerland, 2017; pp. 87–147. [Google Scholar]
  13. Wen, Y.; Xu, K.K.; Tang, J.; Li, Y.S. Research Status and Development Trend of Steel-Bamboo Composite Structure. Adv. Mater. Res. 2014, 893, 716–719. [Google Scholar]
  14. Xie, J.; Qi, J.; Hu, T.; Xiao, H.; Chen, Y.; De Hoop, C.F.; Huang, X. Anatomical characteristics and physical–mechanical properties of Neosinocalamus affinis from Southwest China. Eur. J. Wood Wood Prod. 2017, 75, 659–662. [Google Scholar] [CrossRef]
  15. Kanzawa, E.; Aoyagi, S.; Nakano, T. Vascular bundle shape in cross-section and relaxation properties of Moso bamboo (Phyllostachys pubescens). Mater. Sci. Eng. C 2011, 31, 1050–1054. [Google Scholar] [CrossRef]
  16. Mohmod, A.L.; Tarmeze, W.; Ahmad, F. Anatomical features and mechanical properties of three Malaysian bamboos. J. Trop. For. Sci. 1990, 2, 227–234. [Google Scholar]
  17. Chen, Y.; Das, R.; Battley, M. Effects of cell size and cell wall thickness variations on the strength of closed-cell foams. Int. J. Eng. Sci. 2017, 120, 220–240. [Google Scholar] [CrossRef]
  18. Zhang, D.; He, M.; Qin, S.; Yu, J. Effect of fiber length and dispersion on properties of long glass fiber reinforced thermoplastic composites based on poly(butylene terephthalate). RSC Adv. 2017, 7, 15439–15454. [Google Scholar] [CrossRef] [Green Version]
  19. Wangaard, F.G.; Woodson, G.E. Fiber length strength interrelationship for slash pine and its effect on pulp-sheet properties. Wood Sci. 1973, 5, 235–240. [Google Scholar]
  20. Donaldson, L.A.; Nanayakkara, B.; Radotić, K.; Djikanovic-Golubović, D.; Mitrović, A.; Bogdanović Pristov, J.; Simonović Radosavljević, J.; Kalauzi, A. Xylem parenchyma cell walls lack a gravitropic response in conifer compression wood. Planta 2015, 242, 1413–1424. [Google Scholar] [CrossRef]
  21. Zheng, H.; Cai, M.; Bai, Y.; Xu, J.; Xie, Y.; Song, H.; Li, J.; Gao, J. The Effect of Guttation on the Growth of Bamboo Shoots. Forests 2021, 13, 31. [Google Scholar] [CrossRef]
  22. Vorontsova, M.S.; Clark, L.G.; Dransfield, J.; Govaerts, R.; Baker, W. World Checklist of Bamboos and Rattans; International Network of Bamboo and Rattan; Kew: London, UK, 2016. [Google Scholar]
  23. Scurlock, J.M.O.; Dayton, D.C.; Hames, B. Bamboo: An overlooked biomass resource? Biomass Bioenergy 2000, 19, 229–244. [Google Scholar] [CrossRef] [Green Version]
  24. Peng, Z.; Lu, Y.; Li, L.; Zhao, Q.; Feng, Q.; Gao, Z.; Lu, H.; Hu, T.; Yao, N.; Liu, K.; et al. The draft genome of the fast-growing non-timber forest species moso bamboo (Phyllostachys heterocycla). Nat. Genet. 2013, 45, 456–461. [Google Scholar] [CrossRef] [PubMed] [Green Version]
  25. Peng, Z.; Zhang, C.; Zhang, Y.; Hu, T.; Mu, S.; Li, X.; Gao, J. Transcriptome sequencing and analysis of the fast growing shoots of moso bamboo (Phyllostachys edulis). PLoS ONE 2013, 8, e78944. [Google Scholar] [CrossRef] [PubMed]
  26. Yeasmin, L.; Ali, M.N.; Gantait, S.; Chakraborty, S. Bamboo: An overview on its genetic diversity and characterization. 3 Biotech 2015, 5, 1–11. [Google Scholar] [CrossRef] [Green Version]
  27. Choi, M.H.; Jo, H.G.; Yang, J.H.; Ki, S.H.; Shin, H.J. Antioxidative and Anti-Melanogenic Activities of Bamboo Stems (Phyllostachys nigra variety henosis) via PKA/CREB-Mediated MITF Downregulation in B16F10 Melanoma Cells. Int. J. Mol. Sci. 2018, 19, 409. [Google Scholar] [CrossRef] [Green Version]
  28. Nirmala, C.; Bisht, M.S.; Bajwa, H.K.; Santosh, O. Bamboo: A rich source of natural antioxidants and its applications in the food and pharmaceutical industry. Trends Food Sci. Technol. 2018, 77, 91–99. [Google Scholar] [CrossRef]
  29. Yang, J.H.; Choi, M.H.; Na, C.S.; Cho, S.S.; Kim, J.H.; Ku, S.K.; Cho, I.J.; Shin, H.J.; Ki, S.H. Bamboo Stems (Phyllostachys nigra variety henosis) Containing Polyphenol Mixtures Activate Nrf2 and Attenuate Phenylhydrazine-Induced Oxidative Stress and Liver Injury. Nutrients 2019, 11, 114. [Google Scholar] [CrossRef] [Green Version]
  30. Hartono, R.; Iswanto, A.H.; Priadi, T.; Herawati, E.; Farizky, F.; Sutiawan, J.; Sumardi, I. Physical, Chemical, and Mechanical Properties of Six Bamboo from Sumatera Island Indonesia and Its Potential Applications for Composite Materials. Polymers 2022, 14, 4868. [Google Scholar] [CrossRef]
  31. Hemingway, H.W.; Burrows, A.M.; Omstead, K.M.; Zohdy, S.; Pastor, J.F.; Muchlinski, M.N. Vertical Clinging and Leaping Ahead: How Bamboo Has Shaped the Anatomy and Physiology of Hapalemur. Anat. Rec. 2020, 303, 295–307. [Google Scholar] [CrossRef]
  32. Luo, J.; Lian, C.; Liu, R.; Zhang, S.; Yang, F.; Fei, B. Comparison of metaxylem vessels and pits in four sympodial bamboo species. Sci. Rep. 2019, 9, 10876. [Google Scholar] [CrossRef] [Green Version]
  33. Shah, D.U.; Konnerth, J.; Ramage, M.H.; Gusenbauer, C. Mapping thermal conductivity across bamboo cell walls with scanning thermal microscopy. Sci. Rep. 2019, 9, 16667. [Google Scholar] [CrossRef]
  34. Shao, Z.; Wang, F. Mechanical Characteristics of Bamboo Structure and Its Components. In The Fracture Mechanics of Plant Materials: Wood and Bamboo; Springer: Singapore, 2018; pp. 125–146. [Google Scholar]
  35. Wang, S.; Zhan, H.; Li, P.; Chu, C.; Li, J.; Wang, C. Physiological Mechanism of Internode Bending Growth After the Excision of Shoot Sheath in Fargesia yunnanensis and Its Implications for Understanding the Rapid Growth of Bamboos. Front. Plant Sci. 2020, 11, 418. [Google Scholar] [CrossRef] [Green Version]
  36. Wang, Y.; Qiao, G.; Xu, J.; Jin, K.; Fan, M.; Ding, Y.; Wei, Q.; Zhuo, R. Anatomical Characteristics and Variation Mechanisms on the Thick-Walled and Dwarfed Culm of Shidu Bamboo (Phyllostachys nidularia f. farcta). Front. Plant Sci. 2022, 13, 876658. [Google Scholar] [CrossRef]
  37. Zhang, W.; Tian, G.; Polle, A.; Janz, D.; Euring, D.; Yue, X.; Zhao, H.; Fei, B.; Jiang, Z. Comparative characterization of ethanol organosolv lignin polymer from bamboo green, timber and yellow. Wood Sci. Technol. 2018, 52, 1331–1341. [Google Scholar] [CrossRef]
  38. Zhang, W.; Fei, B.; Polle, A.; Euring, D.; Tian, G.; Yue, X.; Chang, Y.; Jiang, Z.; Hu, T. Crystal and thermal response of cellulose isolation from bamboo by Two different chemical treatments. Bioresour. Technol. 2019, 14, 3471–3480. [Google Scholar]
  39. Zhang, W.B.; Fei, B.H.; Hu, T.; Ma, Y.J.; Chang, Y.T.; Xia, M.S.; Fan, K.K.; Jiang, Z.H. Comparative Study on Cell Structure Traits of Moso Bamboo (Phyllostachys edulis) in Different Areas. J. Mater. Sci. Eng. 2020, 38, 431–438. [Google Scholar]
  40. Xie, J.; Qi, J.; Hu, T.; De Hoop, C.F.; Hse, C.Y.; Shupe, T.F. Effect of fabricated density and bamboo species on physical–mechanical properties of bamboo fiber bundle reinforced composites. J. Mater. Sci. 2016, 51, 7480–7490. [Google Scholar] [CrossRef]
  41. Zou, L.; Jin, H.; Lu, W.-Y.; Li, X. Nanoscale structural and mechanical characterization of the cell wall of bamboo fibers. Mater. Sci. Eng. C 2009, 29, 1375–1379. [Google Scholar] [CrossRef]
  42. Costa, M.M.E.; Melo, S.L.S.; Santos, J.V.M.; Araújo, E.A.; Cunha, G.P.; Deus, E.P.; Schmitt, N. Influence of physical and chemical treatments on the mechanical properties of bamboo fibers. Procedia Eng. 2017, 200, 457–464. [Google Scholar] [CrossRef]
  43. Song, J.F.; Xu, S.C.; Wang, H.X.; Wu, X.Q.; Zou, M. Bionic design and multi-objective optimization for variable wall thickness tube inspired bamboo structures. Thin-Walled Struct. 2018, 125, 76–88. [Google Scholar] [CrossRef]
  44. Zhang, W.; Hu, T.; Chang, Y.; Fei, B.; Ma, Y.; Deng, Y.; Xia, M.; Fan, K.; Zhang, X.; Jiang, Z. Correlation between Genetic Characteristics, Cell Structure and Material Properties of Moso Bamboo (Phyllostachys edulis (Carriere) J. Houzeau) in Different Areas of China. Forests 2022, 13, 107. [Google Scholar] [CrossRef]
  45. Lever, J.; Krzywinski, M.; Altman, N. Principal component analysis. Nat. Methods 2017, 14, 641–642. [Google Scholar] [CrossRef] [Green Version]
  46. Zhao, H.; Shancen, Z.; Fei, B.; Liu, H.; Yang, H.; Dai, H.; Wang, D.; Jin, W.; Tang, F.; Gao, Q.; et al. Announcing the Genome Atlas of Bamboo and Rattan (GABR) project: Promoting research in evolution and in economically and ecologically beneficial plants. GigaScience 2017, 6, gix046. [Google Scholar] [CrossRef] [Green Version]
  47. Wang, T.; Liu, L.; Wang, X.; Liang, L.; Yue, J.; Li, L. Comparative Analyses of Anatomical Structure, Phytohormone Levels, and Gene Expression Profiles Reveal Potential Dwarfing Mechanisms in Shengyin Bamboo (Phyllostachys edulis f. tubaeformis). Int. J. Mol. Sci. 2018, 19, 1697. [Google Scholar] [CrossRef] [Green Version]
  48. Hou, D. Moso Bamboo Transposon. In The Moso Bamboo Genome; Gao, J., Ed.; Springer International Publishing: Cham, Switzerland, 2021; pp. 57–68. [Google Scholar]
  49. Isagi, Y.; Oda, T.; Fukushima, K.; Lian, C.; Yokogawa, M.; Kaneko, S. Predominance of a single clone of the most widely distributed bamboo species Phyllostachys edulis in East Asia. J. Plant Res. 2016, 129, 21–27. [Google Scholar] [CrossRef]
  50. Gottlieb, L.D. Genetics and Morphological Evolution in Plants. Am. Nat. 1984, 123, 681–709. [Google Scholar] [CrossRef]
  51. Henderson, I.R.; Salt, D.E. Natural genetic variation and hybridization in plants. J. Exp. Bot. 2017, 68, 5415–5417. [Google Scholar] [CrossRef] [Green Version]
  52. Schiessl, S.-V.; Katche, E.; Ihien, E.; Chawla, H.S.; Mason, A.S. The role of genomic structural variation in the genetic improvement of polyploid crops. Crop J. 2019, 7, 127–140. [Google Scholar] [CrossRef]
  53. Robertson, A. (Ed.) Natural Selection and Continuous Variation1980; Springer: Berlin/Heidelberg, Germany, 1980. [Google Scholar]
  54. Lu, L.; Shao, D.; Qiu, X.; Sun, L.; Yan, W.; Zhou, X.; Yang, L.; He, Y.; Yu, S.; Xing, Y. Natural variation and artificial selection in four genes determine grain shape in rice. New Phytol. 2013, 200, 1269–1280. [Google Scholar] [CrossRef]
Figure 1. Scree plot of the PCA of cell structure. Red dotted line indicates the simulation line of eigen value, and blue intersections represent eight different principal components.
Forests 14 00235 g001
Table 1. The varieties of Moso bamboo.
AbbreviationSpecies and Variety
MPhyllostachys edulis (Carr.) H.de Lehaie
HCPhyllostachys edulis (Carr.) H.de Lehaie f. luteosulcata (Wen) Chao et Renv.
LCPhyllostachys edulis (Carr.) H.de Lehaie f. bicolor (Nakai) G.H.Lai
JSPhyllostachys edulis (Carr.) H.de Lehaie f. gracilis (Hsiung) Chao et Renv.
HPHPhyllostachys edulis (Carr.) H.de Lehaie f. huamozhu (Wen) Chao et Renv.
LPHPhyllostachys edulis (Carr.) H.de Lehaie f. nabeshimana (Muroi) Chao et Renv.
QPhyllostachys edulis (Carr.) H.de Lehaie f. obliquinoda (Z.P.Wang et N.X.Ma) Ohrnberger
HBPhyllostachys edulis (Carr.) H.de Lehaie f. pachyloen (G.Y.Yang et al.) Y.L.Ding ex G.H.Lai
SYPhyllostachys edulis (Carr.) H.de Lehaie f. tubaeformis (S.Y.Wang) Ohrnberger
GJPhyllostachys edulis (Carr.) H.de Lehaie ’Kikko-chiku’,G.H.Lai
Table 2. Variation in vascular bundle traits among Moso bamboo (Phyllostachys edulis) and nine varieties.
TraitsSiteMeanStd DeV.CV /%MaxMinRange
Tangential length of vascular bundle/μm M377.50a44.16 11.70 476.95 279.23 197.72
HC458.45d33.91 7.40 540.35 408.36 131.99
LC393.18a30.14 7.67 448.66 331.53 117.13
JS526.04f47.13 8.96 627.11 426.97 200.14
HPH432.00bc37.69 8.73 500.35 356.79 143.56
LPH495.87e25.91 5.22 533.27 442.86 90.41
Q463.77d42.82 9.23 581.61 400.28 181.33
HB419.72b41.78 9.95 535.91 340.63 195.28
SY444.78cd29.23 6.57 489.90 383.12 106.78
GJ379.98a38.12 10.03 495.63 324.07 171.56
Radial length of vascular bundle/μmM421.6ab54.25 12.87 519.98 317.58 202.40
HC532.99c31.22 5.86 619.27 480.33 138.94
LC406.54a46.92 11.54 601.77 360.97 240.80
JS527.05c44.88 8.51 621.33 448.53 172.80
HPH526.59c26.95 5.12 578.63 478.93 99.70
LPH576.67e39.54 6.86 659.67 476.89 182.78
Q567.38de42.86 7.55 653.55 482.44 171.11
HB550.22cd57.93 10.53 650.07 422.25 227.82
SY442.46b24.63 5.57 500.50 406.92 93.58
GJ399.31a28.76 7.20 473.21 345.62 127.59
Radial/tangential ratio of vascular bundle/%M1.13bc0.17 15.34 1.56 0.88 0.68
HC1.17cd0.12 10.22 1.43 1.00 0.42
LC1.04a0.12 11.92 1.44 0.87 0.57
JS1.01a0.14 13.38 1.20 0.79 0.41
HPH1.23d0.11 9.22 1.47 0.99 0.48
LPH1.17cd0.09 7.82 1.35 1.04 0.32
Q1.24d0.16 13.12 1.53 0.93 0.60
HB1.33e0.24 17.74 1.87 0.86 1.01
SY1.00a0.09 9.11 1.18 0.86 0.32
GJ1.06ab0.09 8.68 1.23 0.86 0.36
Note: Simple is the total number of the individuals in a group. Mean values with the same letter are not significantly different. The probability level was 0.05. CV /% is the coefficient of variation.
Table 3. Square variance analysis for vascular bundle traits of Moso bamboo (Phyllostachys edulis) and nine varieties.
TableSourcedfMSF Valuep-Value
Tangential length of vascular bundle/μm Between Groups973,776.55051.6221.66 × 10−55 ****
Within Groups2951429.164
Total304
Radial length of vascular bundle/μm 9147,911.80585.6356.04 × 10−77 ****
2951727.239
304
Radial/tangential ratio of vascular bundle/%Between Groups90.36518.2234.82 × 10−24 ****
Within Groups2950.020
Total304
Notes: df is the degrees of freedom. MS is the mean square. **** stands for 0.01% level prominent.
Table 4. Variation in fiber cell trait among Moso bamboo (Phyllostachys edulis) and nine varieties.
TraitsSpeciesMeanStd DeV.CV /%MaxMinRange
Fiber length/μmM2411.27e143.985.972662.022166.81495.21
HC2241.66de346.71 15.47 2750.63 1722.90 1027.73
LC1962.37bc341.48 17.40 2463.80 1360.91 1102.89
JS1940.25bc493.87 25.45 3079.47 1279.60 1799.87
HPH2305.85de561.78 24.36 3482.49 1147.26 2335.23
LPH2133.10cd277.72 13.02 2991.63 1668.24 1323.39
Q2089.40cd530.89 25.41 3325.26 1156.91 2168.35
HB1923.98bc412.73 21.45 2520.58 1168.42 1352.16
SY1282.30a143.46 11.19 1531.01 1008.68 522.33
GJ1766.72b275.79 15.61 2332.18 1221.45 1110.73
Fiber width/μmM23.10d1.998.6327.0319.487.55
HC20.16c3.17 15.74 27.75 13.71 14.04
LC14.57a2.93 20.13 24.53 8.29 16.24
JS14.74a2.72 18.45 22.29 10.11 12.18
HPH17.81b3.56 19.97 25.66 11.55 14.11
LPH18.20b4.54 24.94 27.40 10.13 17.27
Q15.06a3.04 20.17 20.38 8.46 11.92
HB14.23a2.42 16.99 21.32 8.70 12.62
SY13.21a1.94 14.67 16.71 7.64 9.07
GJ14.12a3.06 21.67 18.94 7.15 11.79
Fiber cell wall thickness /μmM7.26b0.709.648.665.842.82
HC8.67bcd2.03 23.47 12.49 3.26 9.24
LC8.36bc1.85 22.15 11.77 5.21 6.56
JS7.80bc2.06 26.40 12.64 4.16 8.48
HPH8.96cd2.24 25.03 13.72 5.06 8.66
LPH8.32bc1.75 21.07 11.77 5.47 6.30
Q2.96a1.86 62.61 12.54 1.67 10.87
HB8.26bc2.70 32.73 14.24 3.14 11.10
SY9.74d2.26 23.19 14.45 5.93 8.52
GJ8.01bc1.57 19.54 12.98 5.26 7.72
Fiber lumen diameter /μmM3.36b0.3410.154.302.571.73
HC2.44a0.42 17.14 3.51 1.67 1.84
LC2.35a0.44 18.84 3.28 1.12 2.16
JS2.30a0.57 24.72 3.07 1.16 1.91
HPH2.17a0.57 26.21 3.50 1.12 2.39
LPH2.51a0.49 19.65 3.35 1.07 2.28
Q4.79c1.60 33.45 6.96 1.23 5.73
HB2.64a0.63 23.68 3.72 1.53 2.19
SY2.40a0.64 26.65 3.42 1.10 2.32
GJ2.32a0.68 29.18 5.01 1.14 3.87
Note: Simple is the total number of the individuals in a group. Mean values with the same letter are not significantly different. The probability level was 0.05. CV /% is the coefficient of variation.
Table 5. Square variance analysis for fiber cell trait of Moso bamboo (Phyllostachys edulis) and nine varieties.
TraitsSourcedfMSF Valuep-Value
Fiber length/μmBetween Groups93,501,009.57124.2628.70 × 10−32 ****
Within Groups330144,300.619
Total339
Fiber width /μmBetween Groups9348.20838.0584.82 × 10−46 ****
Within Groups3309.149
Total339
Fiber cell wall thickness/μmBetween Groups9101.43226.5202.46 × 10−33 ****
Within Groups2943.825
Total303
Fiber lumen diameter/μmBetween Groups919.16437.2101.12 × 10−43 ****
Within Groups2940.515
Total303
Notes: df is the degrees of freedom. MS is the mean square. **** stands for 0.01% level prominent.
Table 6. Variation in parenchyma trait among Moso bamboo (Phyllostachys edulis) and nine varieties.
TraitsSiteMeanStd DeV.CV /%MaxMinRange
Parenchyma length/μmM135.45e10.437.70154.05113.7940.26
HC91.06c18.16 19.94 146.58 61.60 84.98
LC85.00bc23.41 27.54 126.96 44.05 82.91
JS76.56ab21.75 28.41 129.72 42.52 87.20
HPH104.67d26.49 25.31 170.87 64.34 106.53
LPH69.56a20.58 29.58 128.86 40.10 88.76
Q67.97a16.18 23.80 103.06 42.19 60.87
HB72.27a18.47 25.55 116.72 44.78 71.94
SY69.53a23.41 33.67 116.86 35.02 81.84
GJ65.48a20.21 30.87 106.71 33.45 73.26
Parenchyma width /μmM51.63cd4.378.4758.9943.7715.22
HC48.21c8.42 17.46 70.26 32.57 37.69
LC42.34b7.45 17.59 59.38 24.44 34.94
JS38.73b10.99 28.38 69.55 22.11 47.44
HPH54.05d11.92 22.05 75.05 31.67 43.38
LPH39.16b8.06 20.59 61.52 23.87 37.65
Q39.58b7.40 18.69 53.60 21.03 32.57
HB32.86a7.37 22.42 43.97 20.73 23.24
SY33.20a7.53 22.69 53.19 19.13 34.06
GJ30.70a5.95 19.37 44.65 21.31 23.34
Parenchyma wall thickness /μmM5.64de0.9516.888.223.424.80
HC5.14cde1.36 26.57 8.05 2.63 5.42
LC4.57bc0.89 19.50 6.81 3.16 3.66
JS5.73e1.03 17.88 7.80 3.50 4.29
HPH4.39bc0.80 18.16 5.76 2.94 2.82
LPH5.01cd0.93 18.58 8.33 3.16 5.18
Q2.69a1.80 67.05 9.15 1.00 8.15
HB4.18b0.75 17.98 6.32 2.77 3.55
SY4.48bc0.95 21.25 6.58 2.80 3.78
GJ4.08b1.04 25.58 6.84 2.36 4.48
Parenchyma lumen diameter/μmM25.39b3.2212.6934.0420.0813.96
HC33.98c9.57 28.16 53.52 16.83 36.69
LC26.35bc11.53 43.74 46.07 0.00 46.07
JS25.77b10.93 42.41 45.60 10.23 35.37
HPH28.67bc9.31 32.47 48.37 11.05 37.32
LPH33.69c10.33 30.64 49.70 14.59 35.11
Q10.73a10.12 94.30 41.19 3.07 38.12
HB27.23bc9.60 35.27 49.99 10.08 39.90
SY33.17c12.54 37.79 57.64 13.68 43.95
GJ23.33b9.16 39.25 46.15 10.55 35.60
Note: Simple is the total number of the individuals in a group. Mean values with the same letter are not significantly different. The probability level was 0.05. CV /% is the coefficient of variation.
Table 7. Square variance analysis for parenchyma trait of Moso bamboo (Phyllostachys edulis) and nine varieties.
TraitsSourcedfMSF Valuep-Value
Parenchyma length/μmBetween Groups916,378.34639.5232.09 × 10−47 ****
Within Groups330414.403
Total339
Parenchyma width/μmBetween Groups92081.20727.6651.45 × 10 35 ****
Within Groups33075.228
Total339
Parenchyma wall thickness/μmBetween Groups923.75620.0033.91 × 10−26 ****
Within Groups2941.188
Total303
Parenchyma lumen diameter/μmBetween Groups91390.23514.6341.45 × 10−19 ****
Within Groups29395.001
Total302
Notes: df is the degrees of freedom. MS is the mean square. **** stands for 0.01% level prominent.
Table 8. PCA of cell structure properties of Moso bamboo (Phyllostachys edulis) and nine varieties.
Principal Component
PC1PC2PC3PC4PC5PC6PC7PC8PC9PC10PC11
Proportion of Variance22.1819.4513.6811.857.656.136.005.464.0813.460.06
Cumulative Proportion22.1841.6255.3067.1674.8080.9486.9492.4096.4899.94100
Standard Deviations1.56181.46261.22681.14180.91720.82150.81250.77510.67000.61670.0835
Table 9. Proportion of variance of cell structure traits of Moso bamboo (Phyllostachys edulis) and nine varieties.
TraitPC1PC2PC3PC4
Tangential length of vascular bundle/μm−0.1133 0.0744 −0.6133 −0.5205
Radial length of vascular bundle/μm0.0862 0.4308 −0.5861 0.1771
Radial/tangential ratio of vascular bundle/%0.1874 0.3864 −0.0786 0.6528
Fiber length/μm0.4545 0.0634 −0.0905 −0.1345
Fiber width/μm0.5062 −0.1030 −0.0360 −0.0815
Fiber cell wall thickness/μm0.1025 0.4203 0.1862 −0.1649
Fiber lumen diameter/μm−0.0739 −0.4157 −0.1681 0.2871
Parenchyma length/μm0.4685 −0.1713 0.1728 −0.0172
Parenchyma width/μm0.4751 −0.0595 −0.0617 −0.0653
Parenchyma wall thickness/μm−0.0271 −0.3520 −0.3177 0.3605
Parenchyma lumen diameter/μm0.1413 −0.3724 −0.2591 −0.0511
Disclaimer/Publisher’s Note: The statements, opinions and data contained in all publications are solely those of the individual author(s) and contributor(s) and not of MDPI and/or the editor(s). MDPI and/or the editor(s) disclaim responsibility for any injury to people or property resulting from any ideas, methods, instructions or products referred to in the content.

