Plant Community Composition and Carbon Stocks of a Community Reserve Forest in North-East India


Abstract
:1. Introduction
2. Materials and Methods
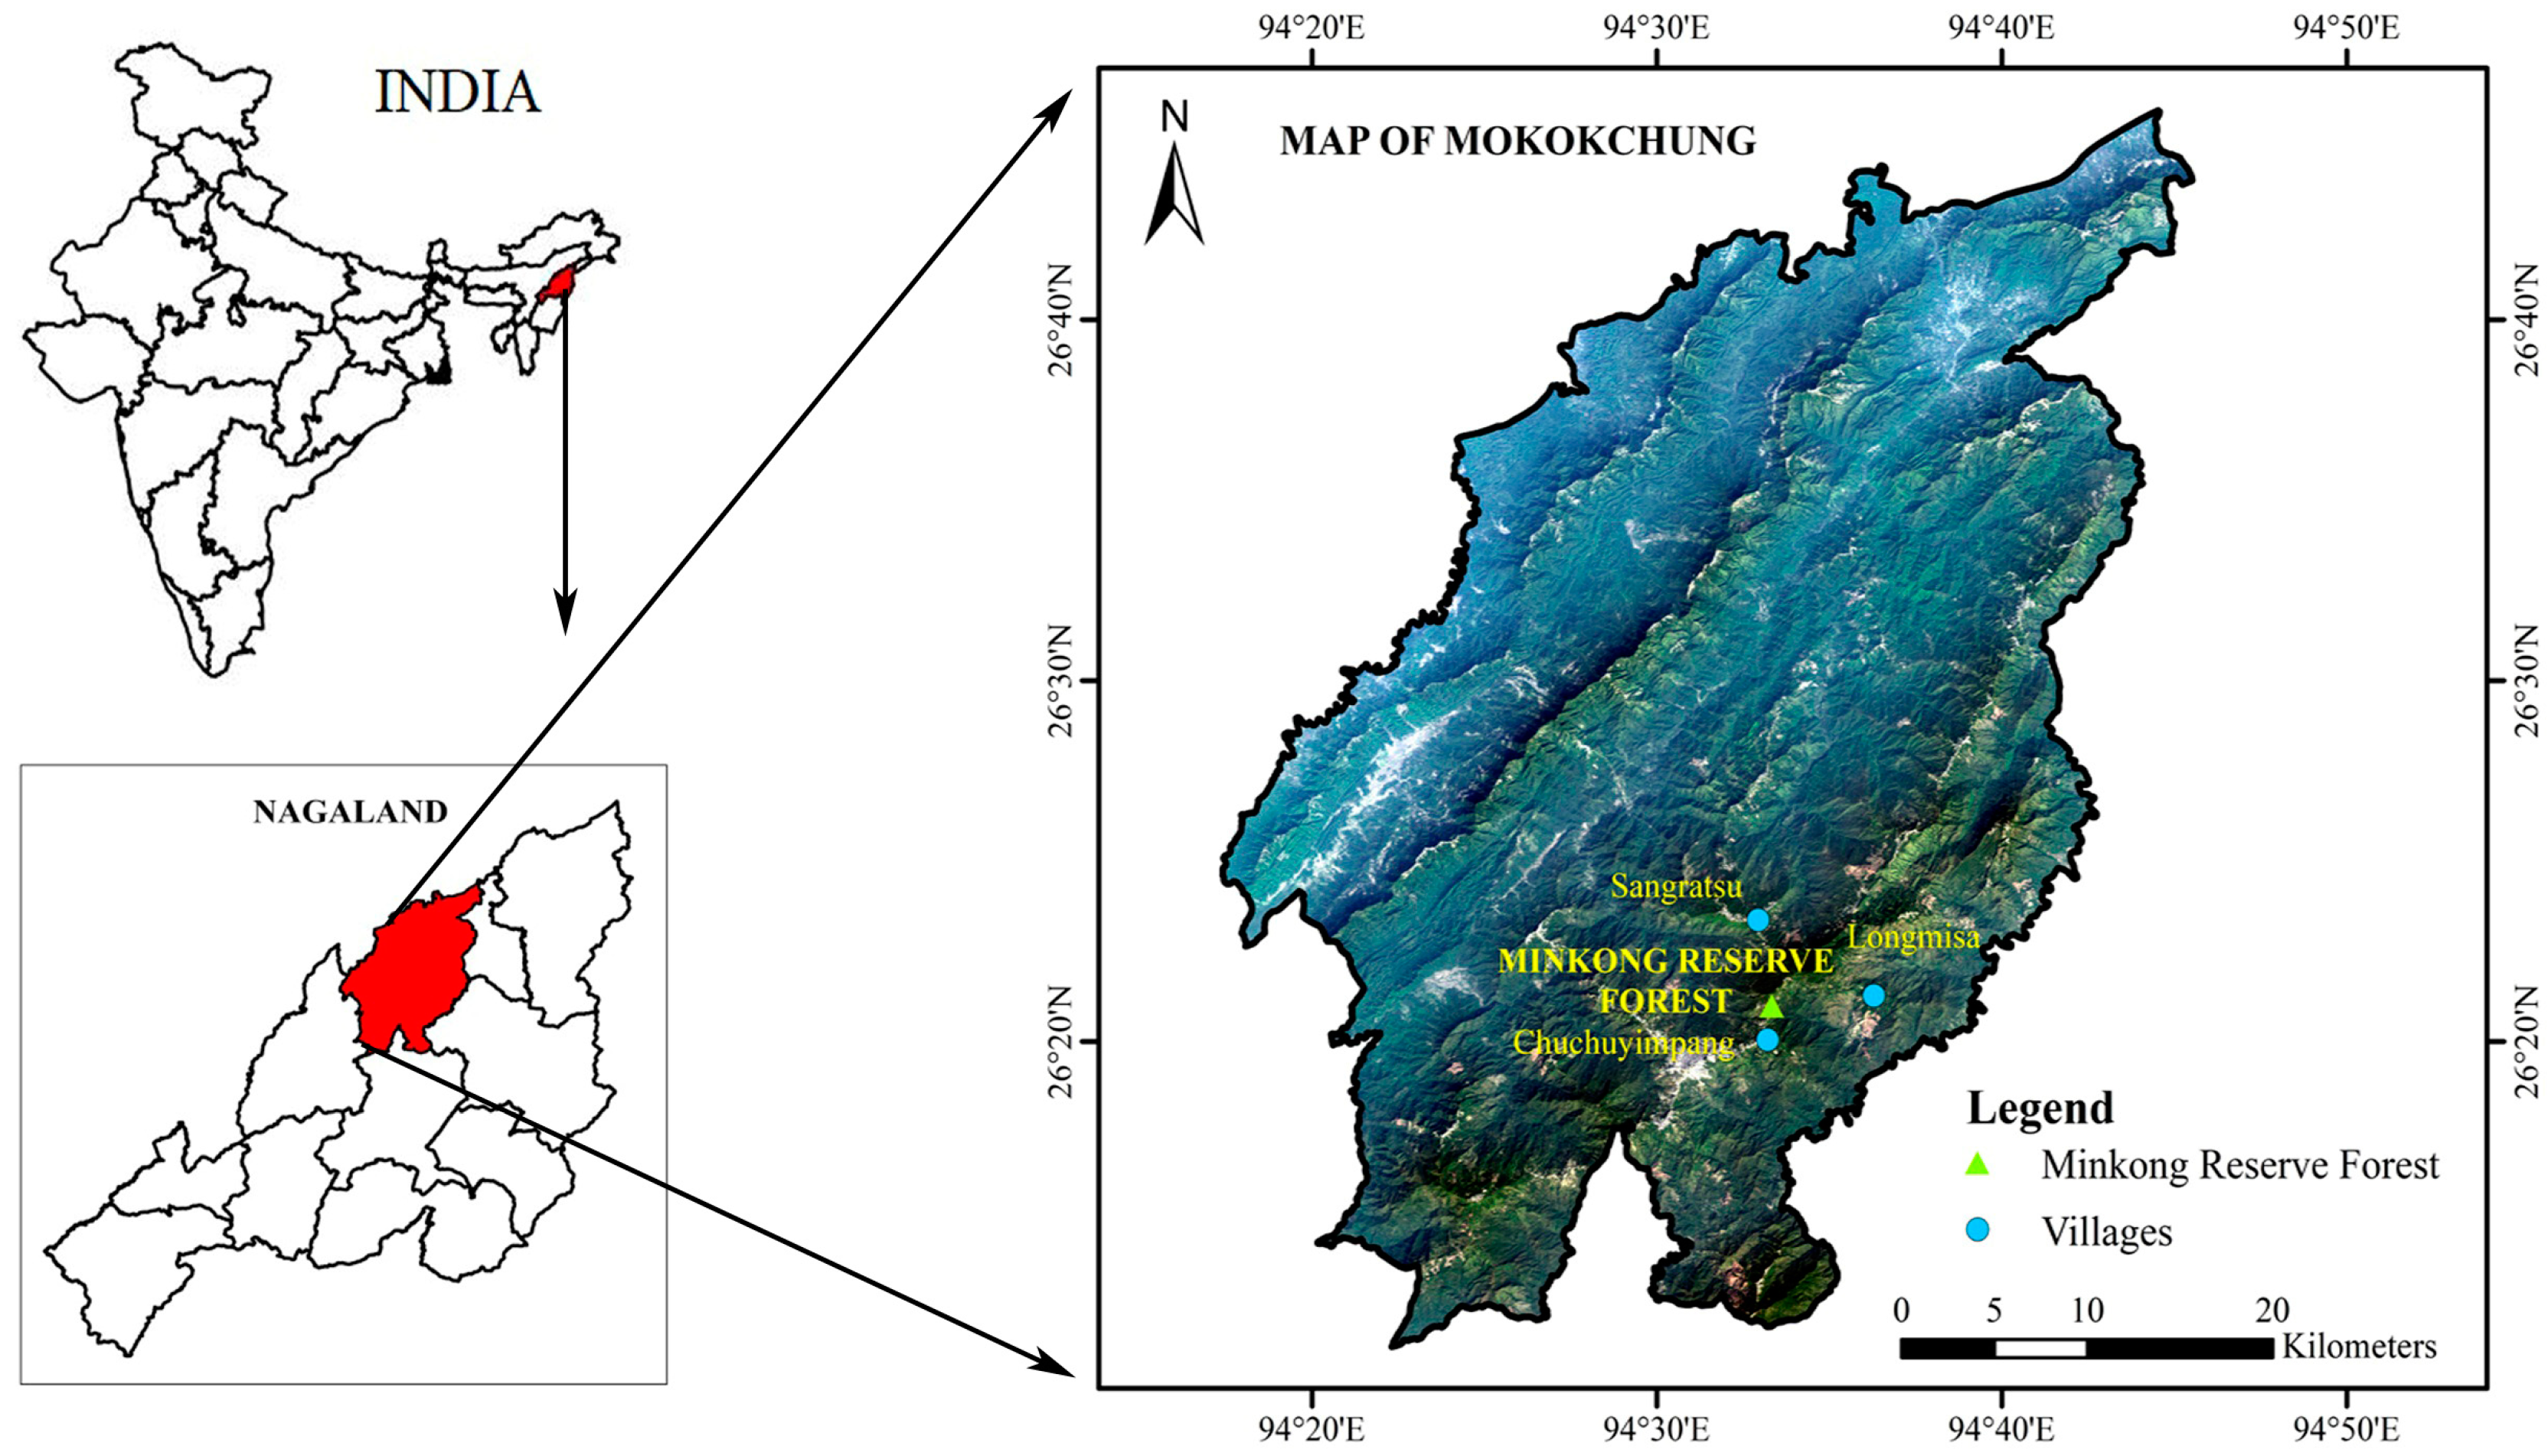
2.1. Study Area
2.2. Vegetation Sampling
2.3. Soil Sampling and Analysis
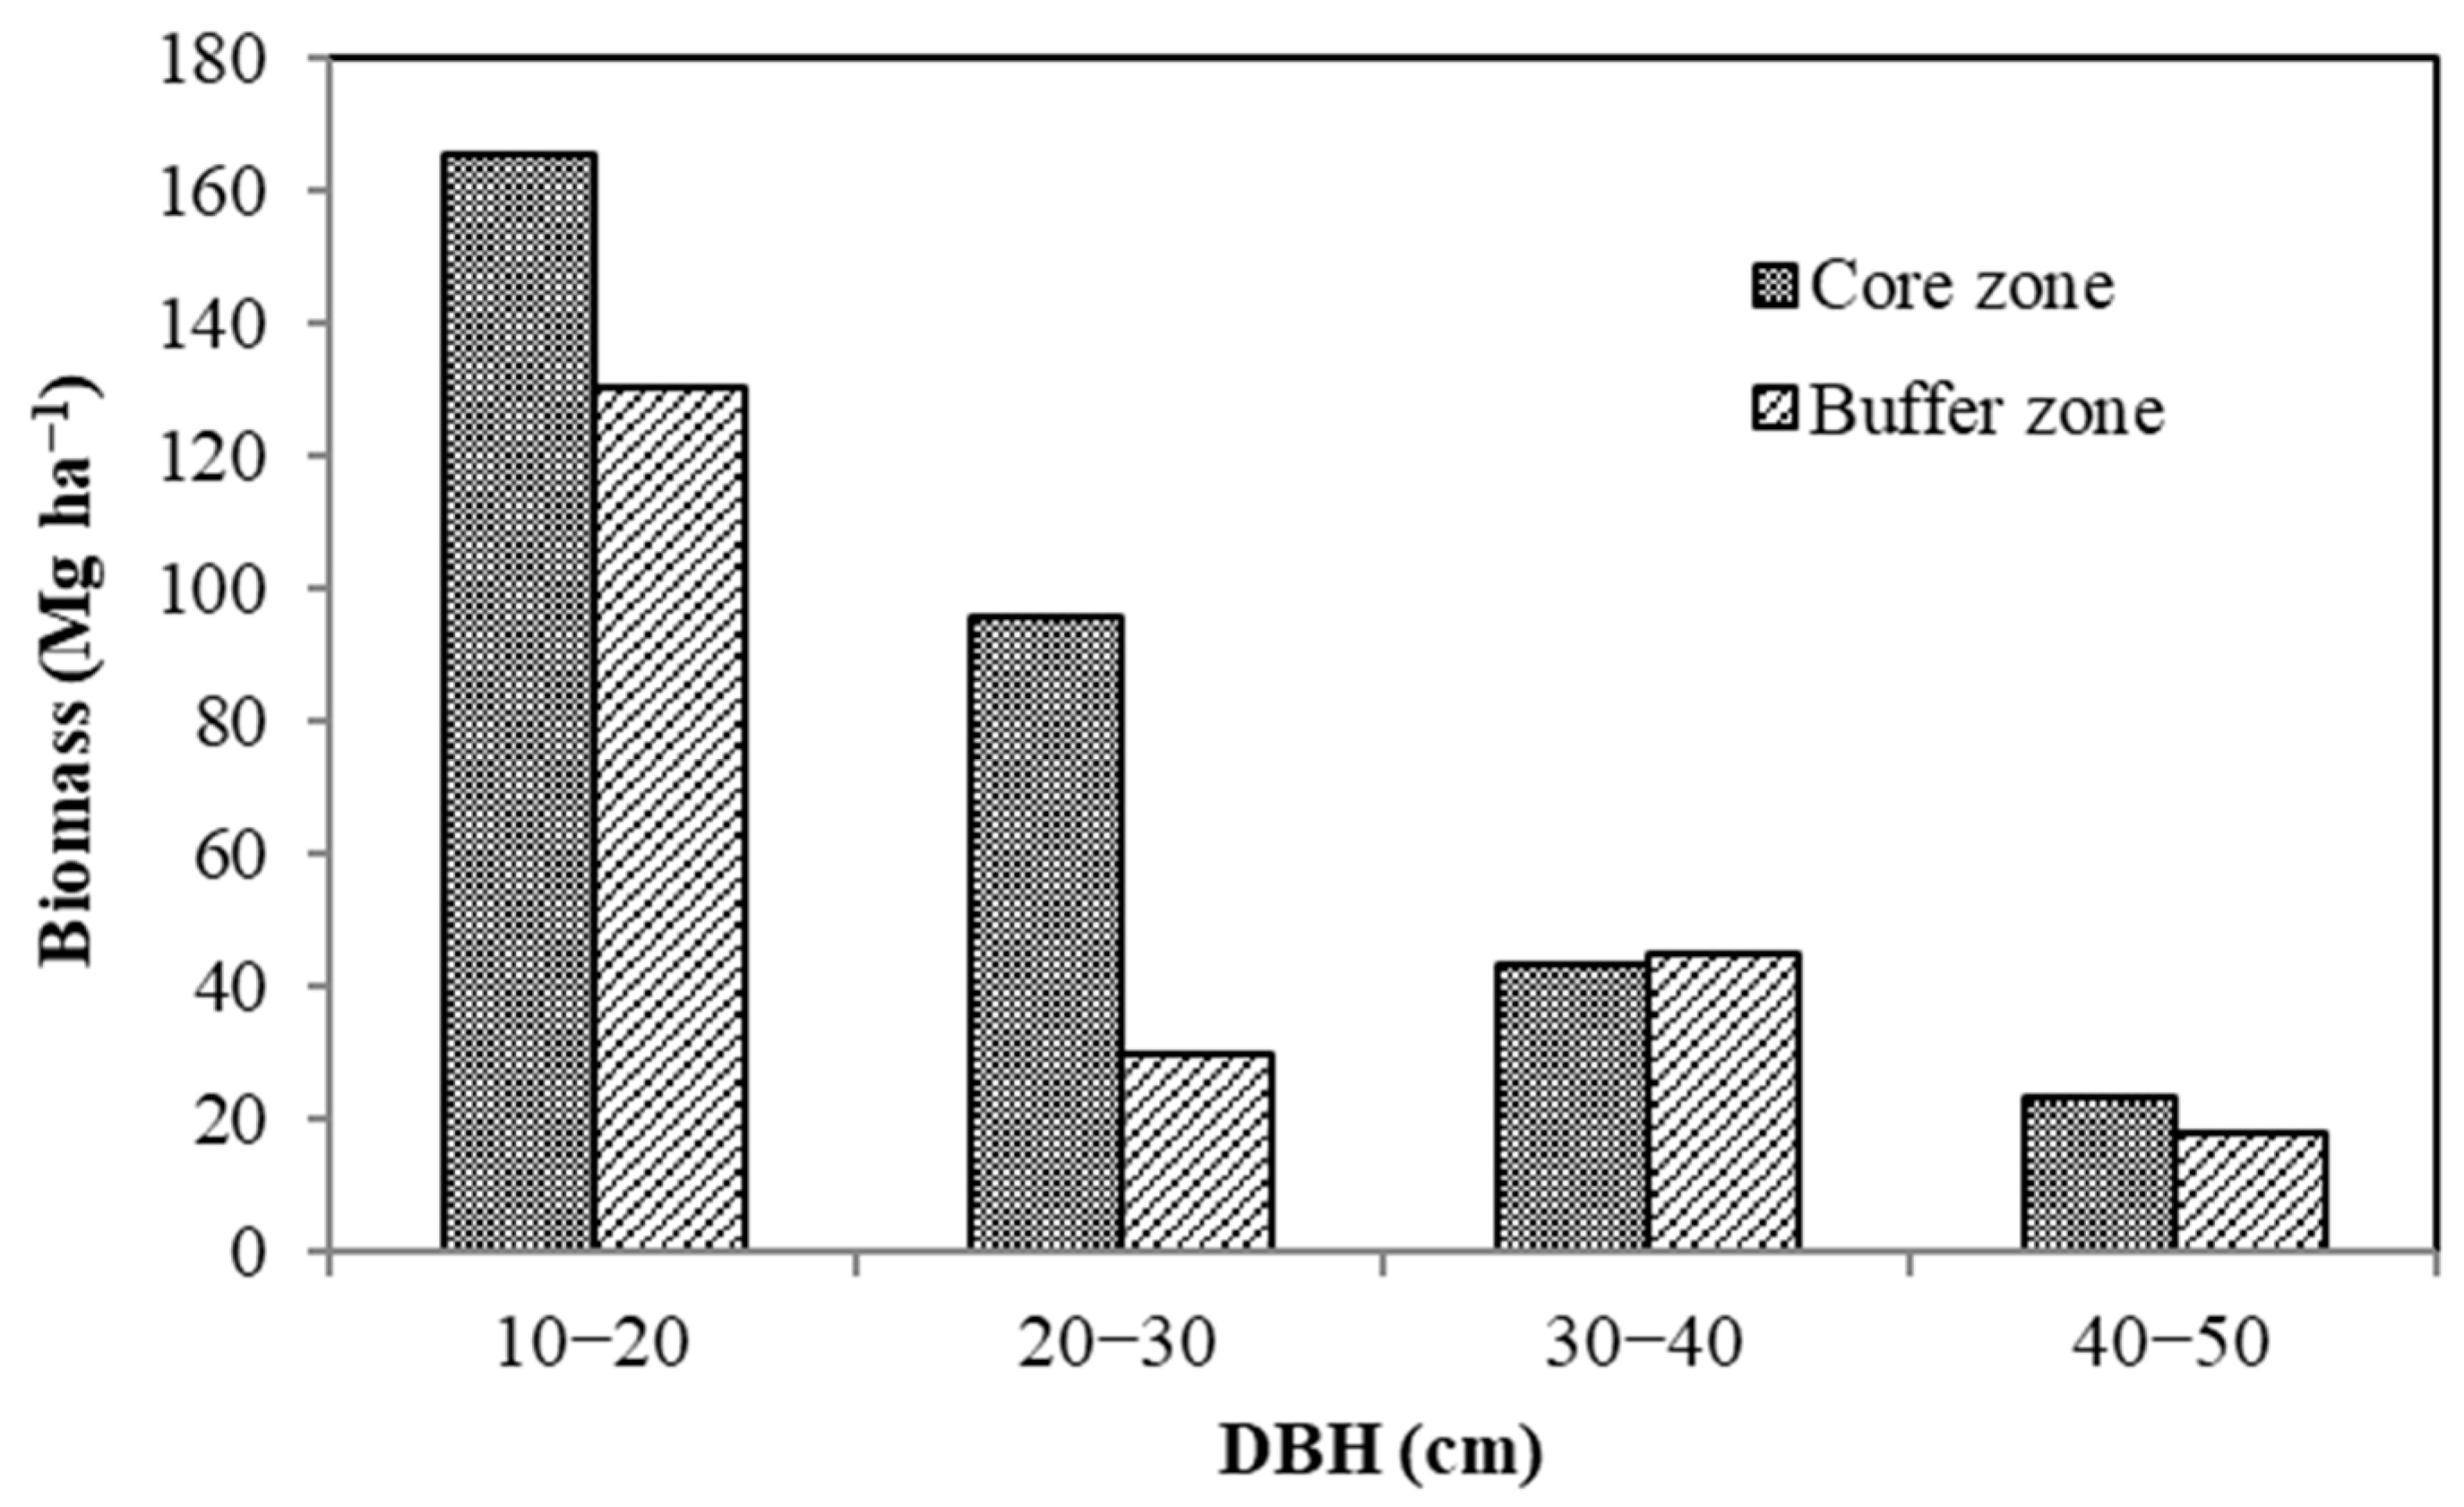
2.4. Estimation of Plant Biomass and Carbon Stock
3. Results
4. Discussion
5. Conclusions
Author Contributions
Funding
Institutional Review Board Statement
Informed Consent Statement
Data Availability Statement
Acknowledgments
Conflicts of Interest
References
- Pan, Y.; Birdsey, R.A.; Phillips, O.L.; Jackson, R.B. The structure, distribution, and biomass of the world’s forests. Annu. Rev. Ecol. Evol. Syst. 2013, 44, 593–622. [Google Scholar] [CrossRef] [Green Version]
- Chazdon, R.L. Second Growth: The Promise of Tropical Forest Regeneration in an Age of Deforestation; University of Chicago Press: Chicago, IL, USA, 2014. [Google Scholar]
- FAO; UNEP. The State of the World’s Forests 2020: Forests, Biodiversity and People; FAO: Rome, Italy, 2020. [Google Scholar] [CrossRef]
- Lewis, S.L.; Edwards, D.P.; Galbraith, D. Increasing human dominance of tropical forests. Science 2015, 349, 827–832. [Google Scholar] [CrossRef] [PubMed]
- Tripathi, S.K. The need for establishing long-term ecological research stations network in India. Curr. Sci. 2010, 98, 21–22. [Google Scholar]
- Slik, J.W.F.; Paoli, G.; McGuire, K.; Amaral, I.; Barroso, J.; Bastian, M.; Blanc, L.; Bongers, F.; Boundja, P.; Clark, C. Large trees drive forest aboveground biomass variation in moist lowland forests across the tropics. Glob. Ecol. Biogeogr. 2013, 22, 1261–1271. [Google Scholar] [CrossRef]
- Laurance, W.F.; Peres, C.A. Emerging Threats to Tropical Forests; The University of Chicago Press: Chicago, IL, USA, 2006. [Google Scholar]
- Taubert, F.; Fischer, R.; Groeneveld, J.; Lehmann, S.; Müller, M.S.; Rödig, E.; Wiegand, T.; Huth, A. Global patterns of tropical forest fragmentation. Nature 2018, 554, 519–522. [Google Scholar] [CrossRef]
- Haddad, N.M.; Brudvig, L.A.; Clobert, J.; Davies, K.F.; Gonzalez, A.; Holt, R.D.; Lovejoy, T.E.; Sexton, J.O.; Austin, M.P.; Collins, C.D.; et al. Habitat fragmentation and its lasting impact on Earth’s ecosystems. Sci. Adv. 2015, 1, e1500052. [Google Scholar] [CrossRef] [Green Version]
- Harper, K.A.; McDonald, S.E.; Burton, P.J.; Chen, J.; Brosofske, K.D.; Saunders, S.C.; Euskirchen, E.S.; Roberts, D.; Jaiteh, M.S.; Esseen, P.-A. Edge influence on forest structure and composition in fragmented landscapes. Conserv. Biol. 2005, 19, 768–782. [Google Scholar] [CrossRef]
- Laurance, W.F.; Lovejoy, T.E.; Vasconcelos, H.L.; Bruna, E.M.; Didham, R.K.; Stouffer, P.C.; Gascon, C.; Bierregaard, R.O.; Laurance, S.G.; Sampaio, E. Ecosystem decay of Amazonian forest fragments: A 22-year investigation. Conserv. Biol. 2002, 16, 605–618. [Google Scholar] [CrossRef] [Green Version]
- Nascimento, H.E.; Laurance, W.F. Biomass dynamics in Amazonian forest fragments. Ecol. Appl. 2004, 14, 127–138. [Google Scholar] [CrossRef] [Green Version]
- Qie, L.; Lewis, S.L.; Sullivan, M.J.; Lopez-Gonzalez, G.; Pickavance, G.C.; Sunderland, T.; Ashton, P.S.; Hubau, W.; Abu Salim, K.; Aiba, S.-I.; et al. Long-term carbon sink in Borneo’s forests halted by drought and vulnerable to edge effects. Nat. Commun. 2017, 8, 1966. [Google Scholar] [CrossRef]
- Hajjar, R.; Oldekop, J.A.; Cronkleton, P.; Newton, P.; Russell, A.J.M.; Zhou, W. A global analysis of the social and environmental outcomes of community forests. Nat. Sustain. 2021, 4, 216–224. [Google Scholar] [CrossRef]
- Sze, J.S.; Carrasco, L.R.; Childs, D.; Edwards, D.P. Reduced deforestation and degradation in Indigenous Lands pan-tropically. Nat. Sustain. 2022, 5, 123–130. [Google Scholar] [CrossRef]
- Dhanapal, G. Revisiting participatory forest management in India. Curr. Sci. 2019, 117, 1161–1166. [Google Scholar] [CrossRef]
- Edake, S.; Sethi, P.; Lele, Y. Mainstreaming Community-Conserved Areas (CCAs) for Biodiversity Conservation in SEPLS—A Case Study from Nagaland, India. Satoyama Initiat. Themat. Rev. 2019, 5, 139–149. [Google Scholar]
- Champion, H.G.; Seth, S.K. A Revised Survey of the Forest Types of India; Government of India Publications: New Delhi, India, 1968. [Google Scholar]
- Mishra, G.; Das, P.K.; Borajh, R.; Dutta, A. Investigation of phytosociological parameters and physicochemical properties of soil in tropical semi-evergreen forests of Eastern Himalaya. J. For. Res. 2015, 28, 513–520. [Google Scholar] [CrossRef]
- Bandyopadhyay, S.; Barauh, U.; Das, T.H.; Dutta, D.; Reza, S.K.; Padua, S.; Sarkar, D.; Sah, K.D.; Singh, S.K. Assessment and Mapping of Some Important Soil Parameters Including Macro and Micronutrients for the State of Nagaland Towards Optimum Utilization of Land Resources for Integrated and Sustainable Development; NBSS Publication 1080, Indian Council of Agricultural Research, National Bureau of Soil Survey and Land Use Planning: Nagpur, India, 2014. [Google Scholar]
- Jain, S.K.; Rao, R.R. A Handbook of Field and Herbarium Methods; Today and Tomorrow Printers and Publishers: New Delhi, India, 1977. [Google Scholar]
- Shannon, C.E.; Wiener, W. The Mathematical Theory of Communication; University of Illinois Press: Urbana, IL, USA, 1963. [Google Scholar]
- Sørenson, T. A method of establishing group of equal amplitude in plant sociology based on similarity of the species content. K. Dan. Vidensk. Selsk. Skrifter. Cph. 1948, 5, 1–34. [Google Scholar]
- ter Braak, C.J.F.; Šmilauer, P. Canoco Reference Manual and User’s Guide, Version 5.10; Software for Ordination; Microcomputer Power: Ithaca, NY, USA, 2018. [Google Scholar]
- Walkley, A.; Black, I.A. An examination of the Degtjareff method for determining soil organic matter, and a proposed modification of the chromic acid titration method. Soil Sci. 1934, 37, 29–38. [Google Scholar] [CrossRef]
- Nath, A.J.; Tiwari, B.K.; Sileshi, G.W.; Sahoo, U.K.; Brahma, B.; Deb, S.; Devi, N.B.; Das, A.K.; Reang, D.; Chaturvedi, S.S.; et al. Allometric models for estimation of forest biomass in Northeast India. Forests 2019, 10, 103. [Google Scholar] [CrossRef] [Green Version]
- ICRAF. Functional Attributes and Ecological Database. Available online: http://db.worldagroforestry.org/wd (accessed on 17 July 2022).
- Cairns, M.A.; Brown, S.; Helmer, E.H.; Baumgardner, G.A. Root biomass allocation in the world’s upland forests. Oecologia 1997, 111, 1–11. [Google Scholar] [CrossRef]
- Martin, A.R.; Doraisami, M.; Thomas, S.C. Global patterns in wood carbon concentration across the world’s trees and forests. Nat. Geosci. 2018, 11, 915–920. [Google Scholar] [CrossRef]
- Ali, A.; Xu, M.S.; Zhao, Y.T.; Zhang, Q.Q.; Zhou, L.L.; Yang, X.D.; Yan, E.R. Allometric biomass equations for shrub and small tree species in subtropical China. Silva Fenn. 2015, 49, 1275. [Google Scholar] [CrossRef] [Green Version]
- Hajjar, R.; Oldekop, J.A. Research frontiers in community forest management. Curr. Opin. Environ. Sustain. 2018, 32, 119–125. [Google Scholar] [CrossRef]
- Pagdee, A.; Kim, Y.-S.; Daugherty, P.J. What makes community forest management successful: A meta-study from community forests throughout the world. Soc. Nat. Resour. 2006, 19, 33–52. [Google Scholar] [CrossRef]
- Malhotra, K.C.; Gokhale, Y.; Chatterjee, S.; Srivastava, S. Cultural and Ecological Dimensions of Sacred Groves in India; Indian National Science Academy and Indira Gandhi Rashtriya Manav Sangrahalaya: New Delhi/Bhopal, India, 2001. [Google Scholar]
- Spies, T.A. Ecological concepts and diversity of old-growth forests. J. For. 2004, 102, 14–20. [Google Scholar]
- Tabarelli, M.; Lopes, A.V.; Peres, C.A. Edge-effects drive tropical forest fragments towards an early-successional system. Biotropica 2008, 40, 657–661. [Google Scholar] [CrossRef]
- Valladares, F.; Laanisto, L.; Niinemets, Ü.; Zavala, M.A. Shedding light on shade: Ecological perspectives of understorey plant life. Plant Ecol. Divers. 2016, 9, 237–251. [Google Scholar] [CrossRef] [Green Version]
- Baboo, B.; Sagar, R.; Bargali, S.S.; Verma, H. Tree species composition, regeneration and diversity of an Indian dry tropical forest protected area. Trop. Ecol. 2017, 58, 409–423. [Google Scholar]
- Mishra, B.P.; Sangma, T.M. Effect of disturbance on diversity and distribution of herbaceous vegetation in Nokrek-Biosphere Reserve, Meghalaya, Northeast India. Environ. Ecol. 2019, 37, 1186–1196. [Google Scholar]
- Naidu, M.T.; Kumar, O.A. Tree diversity, stand structure and community composition of tropical forest in Eastern Ghats of Andhra Pradesh, India. J. Asia-Pac. Biodivers. 2016, 9, 328–334. [Google Scholar] [CrossRef] [Green Version]
- Suchiang, B.R.; Nonghuloo, I.M.; Kharbhih, S.; Singh, P.P.; Tiwary, R.; Adhikari, D.; Upadhaya, K.; Ramanujam, P.; Barik, S.K. Tree diversity and community composition in sacred forests are superior than the other community forests in a human-dominated landscape of Meghalaya. Trop. Ecol. 2020, 61, 84–105. [Google Scholar] [CrossRef]
- Diserud, O.H.; Odegaard, F. A multiple-site similarity measure. Biol. Lett. 2007, 3, 20–22. [Google Scholar] [CrossRef] [PubMed] [Green Version]
- Davidar, P.; Arjunan, M.; Mammen, P.C.; Garrigues, J.P.; Puyravaud, J.P.; Roessingh, K. Forest degradation in the Western Ghats biodiversity hotspot: Resource collection, livelihood concerns and sustainability. Curr. Sci. 2007, 93, 1573–1578. [Google Scholar]
- Wu, J.; Liu, Z.; Qian, J. Non-linear effect of habitat fragmentation on plant diversity: Evidence from a sand dune field in desertified grassland in northeastern China. Ecol. Eng. 2013, 54, 90–96. [Google Scholar] [CrossRef]
- Mylliemngap, W.; Nath, D.; Barik, S.K. Changes in vegetation and nitrogen mineralization during recovery of a montane subtropical broadleaved forest in Northeastern India following anthropogenic disturbance. Ecol. Res. 2016, 31, 21–38. [Google Scholar] [CrossRef]
- Singh, S.B.; Mishra, B.P.; Tripathi, S.K. Recovery of plant diversity and soil nutrients during stand development in subtropical forests of Mizoram, Northeast India. Biodiversitas 2015, 16, 205–212. [Google Scholar] [CrossRef]
- Sellan, G.; Simini, F.; Maritan, A.; Banavar, J.R.; de Haulleville, T.; Bauters, M.; Doucet, J.L.; Beeckman, H.; Anfodillo, T. Testing a general approach to assess the degree of disturbance in tropical forests. J. Veg. Sci. 2017, 28, 659–668. [Google Scholar] [CrossRef]
- Rath, S.; Bannerjee, S.; John, R. Greater tree community structure complexity in sacred forest compared to reserve forest land tenure systems in eastern India. Environ. Conserv. 2020, 47, 52–59. [Google Scholar] [CrossRef]
- Deb, D.; Deb, S.; Debbarma, P.; Banik, B. Impact of disturbance on vegetation, biomass and carbon stock in tropical forests of Tripura, Northeast India. Vegetos 2020, 33, 187–193. [Google Scholar] [CrossRef]
- Borah, N.; Nath, A.J.; Das, A.K. Aboveground biomass and carbon stocks of tree species in tropical forests of Cachar District, Assam, Northeast India. Int. J. Ecol. Environ. Sci. 2013, 39, 97–106. [Google Scholar]
- Borah, M.; Das, D.; Kalita, J. Tree species composition, biomass and carbon stocks in two tropical forest of Assam. Biomass Bioenergy 2015, 78, 25–35. [Google Scholar] [CrossRef]
- Hrahsel, L.; Sahoo, S.S.; Singh, S.L.; Sahoo, U.K. Assessment of plant diversity and carbon stock of a sub-tropical forest stand of Mizoram, India. Environ. Ecol. 2017, 37, 229–237. [Google Scholar]
- Niirou, N.; Gupta, A. Phytosociological analysis and carbon stocks for trees in different land uses in Senapati district of Manipur, India. Pleione 2017, 11, 64–70. [Google Scholar]
- Sahoo, U.K.; Tripathi, O.P.; Nath, A.J.; Deb, S.; Das, D.J.; Gupta, A.; Devi, N.B.; Charturvedi, S.S.; Singh, S.L.; Kumar, A.; et al. Quantifying tree diversity, carbon stocks, and sequestration potential for diverse land uses in Northeast India. Front. Environ. Sci. 2021, 9, 724950. [Google Scholar] [CrossRef]
- Thokchom, A.; Yadava, P.S. Biomass and carbon stock along an altitudinal gradient in the forest of Manipur, Northeast India. Trop. Ecol. 2017, 58, 389–396. [Google Scholar]
- Waikhom, A.C.; Nath, A.J.; Yadava, P.S. Aboveground biomass and carbon stock in the largest sacred grove of Manipur, Northeast India. J. For. Res. 2018, 29, 425–428. [Google Scholar] [CrossRef]
- Chaplin-Kramer, R.; Ramler, I.; Sharp, R.; Haddad, N.M.; Gerber, J.S.; West, P.; Mandle, L.; Engstrom, P.; Baccini, A.; Sim, S.; et al. Degradation in carbon stocks near tropical forest edges. Nat. Commun. 2015, 6, 10158. [Google Scholar] [CrossRef] [Green Version]
- Brahma, B.; Nath, A.J.; Sileshi, G.W.; Das, A.K. Estimating biomass stocks and potential loss of biomass carbon through clear-felling of rubber plantations. Biomass Bioenergy 2018, 115, 88–96. [Google Scholar] [CrossRef]
- Solomon, N.; Birhane, E.; Tadesse, T.; Treydte, A.C.; Meles, K. Carbon stocks and sequestration potential of dry forests under community management in Tigray, Ethiopia. Ecol. Process. 2017, 6, 20. [Google Scholar] [CrossRef] [Green Version]
- Lalnunzira, C.; Tripathi, S.K. Leaf and root production, decomposition and fluxes of carbon and nitrogen during stand development in tropical moist forests of northeast India. Soil Res. 2018, 56, 306–317. [Google Scholar] [CrossRef]
- Singha, D.; Brearley, F.Q.; Tripathi, S.K. Fine root and soil nitrogen dynamics during stand development following shifting agriculture in northeast India. Forests 2020, 11, 1236. [Google Scholar] [CrossRef]
- Brearley, F.Q.; Thomas, A.D. Land-Use Change Impacts on Soil Processes: Tropical and Savannah Environments; CABI: Wallingford, UK, 2015. [Google Scholar]
- Sahoo, U.K.; Singh, S.L.; Gogoi, A.; Kenye, A.; Sahoo, S.S. Active and passive soil organic carbon pools as affected by different land use types in Mizoram, Northeast India. PLoS ONE 2019, 14, e0219969. [Google Scholar] [CrossRef] [PubMed]


| Parameter | Core Zone | Buffer Zone | p-Value | |
|---|---|---|---|---|
| No. of species | Trees | 9.47 ± 0.98 | 6.33 ± 0.55 | 0.01 |
| Shrubs | 7.60 ± 0.60 | 12.1 ± 0.70 | <0.001 | |
| Herbs | 6.60 ± 0.43 | 10.5 ± 0.85 | 0.001 | |
| Density (ind. ha−1) | Trees | 303 ± 2.20 | 197 ± 1.10 | 0.01 |
| Shrubs | 2530 ± 21.5 | 4470 ± 14.8 | <0.001 | |
| Herbs | 35,500 ± 132 | 50,200 ± 267 | 0.004 | |
| Basal area (m2 ha−1) | Trees | 32.6 ± 5.71 | 22.2 ± 4.30 | 0.09 |
| Shannon–Wiener diversity index (H’) | Trees | 2.11 ± 0.10 | 0.72 ± 0.10 | 0.01 |
| Shrubs | 1.85 ± 0.10 | 2.39 ± 0.05 | <0.001 | |
| Herbs | 1.73 ± 0.06 | 2.19 ± 0.07 | <0.001 |
| Species | Family | Core Zone | Buffer Zone | ||||
|---|---|---|---|---|---|---|---|
| Density | Basal Area | IVI | Density | Basal Area | IVI | ||
| Trees | |||||||
| Acer thomsonii Miq. | Sapindaceae | 13.3 | 1.16 | 13.6 | |||
| Actinodaphne obovata (Nees) Blume | Lauraceae | 6.67 | 0.52 | 8.94 | |||
| Aglaia spectabilis (Miq.) S.S.Jain & S.Bennet | Meliaceae | 8.33 | 0.81 | 8.05 | |||
| Alnus nepalensis D.Don | Betulaceae | 10.0 | 1.86 | 12.5 | |||
| Bauhinia purpurea L. | Fabaceae | 8.33 | 0.66 | 11.5 | |||
| Beilschmiedia roxburghiana Nees | Lauraceae | 8.33 | 0.55 | 9.92 | |||
| Betula alnoides Buch.-Ham. ex. D.Don | Betulaceae | 10.0 | 2.54 | 15.4 | |||
| Bischofia javanica Blume | Phyllanthaceae | 11.7 | 1.44 | 11.8 | 8.33 | 0.81 | 13.2 |
| Brassaiopsis hainla (Buch.-Ham.) Seem. | Araliaceae | 3.33 | 0.36 | 3.61 | |||
| Callicarpa arborea Roxb. | Lamiaceae | 8.33 | 0.69 | 7.71 | |||
| Castanopsis indica (Roxb. ex Lindl.) A.DC. | Fagaceae | 15.0 | 1.05 | 12.4 | 10.0 | 2.72 | 20.5 |
| Castanopsis tribuloides (Sm.) A.DC. | Fagaceae | 8.33 | 0.49 | 9.64 | |||
| Cephalotaxus griffithii Hook.f. | Taxaceae | 11.7 | 1.29 | 9.21 | |||
| Choerospondias axillaris (Roxb.) B.L.Burtt & A.W.Hill | Anacardiaceae | 15.0 | 1.30 | 15.3 | |||
| Cinnamomum sulphuratum Nees | Lauraceae | 10.0 | 0.44 | 8.20 | |||
| Cinnamomum verum J.Presl. | Lauraceae | 15.0 | 0.74 | 10.8 | 6.67 | 0.32 | 6.95 |
| Dalrympelea pomifera Roxb. | Staphyleaceae | 10.0 | 0.74 | 12.7 | |||
| Elaeocarpus tectorius (Lour.) Poir. | Elaeocarpaceae | 11.7 | 1.31 | 11.4 | |||
| Engelhardia spicata Lechen ex Blume | Juglandaceae | 8.33 | 0.70 | 12.7 | |||
| Eurya cerasifolia (D.Don) Kobuski | Pentaphylacaceae | 8.33 | 0.48 | 10.7 | |||
| Ficus hispida L.f. | Moraceae | 5.00 | 0.37 | 4.90 | 8.33 | 0.20 | 9.41 |
| Ficus neriifolia Sm. | Moraceae | 5.00 | 0.25 | 6.85 | |||
| Ficus semicordata Buch.-Ham. ex Sm. | Moraceae | 16.7 | 0.87 | 13.8 | 3.33 | 0.20 | 4.71 |
| Garcinia pedunculata Roxb. ex Buch.-Ham. | Clusiaceae | 16.7 | 1.58 | 15.3 | |||
| Grewia serrulata DC. | Malvaceae | 3.33 | 0.31 | 3.48 | |||
| Hovenia dulcis Thunb. | Rhamnaceae | 8.33 | 1.03 | 8.73 | |||
| Ilex sp. | Aquifoliaceae | 3.33 | 0.10 | 2.83 | |||
| Ilex dipyrena Wall. | Aquifoliaceae | 10.0 | 1.13 | 15.5 | |||
| Juglans regia L. | Juglandaceae | 11.7 | 1.49 | 12.7 | |||
| Lithocarpus elegans (Blume) Hatus. ex Soepadmo | Fagaceae | 10.0 | 1.90 | 12.0 | 16.7 | 3.01 | 31.6 |
| Lithocarpus pachyphyllus (Kurz) Rehder | Fagaceae | 16.7 | 1.02 | 15.0 | |||
| Macaranga denticulata (Blume) Müll.Arg. | Euphorbiaceae | 11.7 | 0.75 | 15.7 | |||
| Macropanax dispermus (Blume) Kuntze | Araliaceae | 10.0 | 0.96 | 8.38 | |||
| Mallotus nepalensis Müll.Arg. | Euphorbiaceae | 8.33 | 0.45 | 6.24 | |||
| Morus macroura var. macroura Miq. | Moraceae | 13.3 | 2.28 | 22.4 | |||
| Myrica esculenta Buch.-Ham. ex D.Don | Myricaceae | 6.67 | 0.44 | 6.37 | |||
| Oreocnide integrifolia (Gaudich.) Miq. | Urticaceae | 3.33 | 0.20 | 3.13 | |||
| Prunus napaulensis (Ser.) Steud. | Rosaceae | 5.00 | 2.04 | 14.9 | |||
| Quercus lamellosa Sm. | Fagaceae | 5.00 | 2.52 | 11.5 | |||
| Quercus serrata Murray | Fagaceae | 13.3 | 1.11 | 11.3 | 8.33 | 0.83 | 12.2 |
| Sloanea dasycarpa (Benth.) Hemsl. | Elaeocarpaceae | 11.7 | 0.62 | 16.2 | |||
| Sterculia lanceolata var. coccinea (Jack) Phengklai | Sterculiaceae | 11.7 | 0.71 | 15.5 | |||
| Terminalia myriocarpa Van Heurck & Müll.Arg. | Combretaceae | 10.0 | 1.33 | 10.2 | |||
| Toona ciliata M.Roem. | Meliaceae | 5.00 | 1.66 | 8.16 | |||
| Trema cannabina Lour. | Cannabaceae | 6.67 | 0.30 | 5.94 | |||
| Xerospermum noronhianum (Blume) Blume | Sapindaceae | 8.33 | 2.21 | 18.5 | |||
| Shrubs | |||||||
| Abutilon indicum (L.) Sweet | Malvaceae | 120 | 3.78 | ||||
| Agapetes macrantha (Hook.) Benth. & Hook.f. | Ericaceae | 160 | 6.86 | ||||
| Amomum dealbatum Roxb. | Zingiberaceae | 147 | 8.20 | ||||
| Boehmeria japonica (L.f.) Miq. | Urticaceae | 213 | 15.5 | 200 | 10.5 | ||
| Breynia retusa (Dennst.) Alston | Phyllanthaceae | 173 | 6.61 | ||||
| Calamus rotang L. | Arecaceae | 93.3 | 7.22 | ||||
| Camellia oleifera C.Abel | Theaceae | 173 | 7.16 | ||||
| Chromolaena odorata (L.) R.M.King & H.Rob. | Asteraceae | 160 | 9.85 | 240 | 9.20 | ||
| Clerodendrum glandulosum Lindl. | Lamiaceae | 280 | 21.7 | 107 | 4.57 | ||
| Crotalaria juncea L. | Fabaceae | 120 | 8.28 | ||||
| Croton caudatus Geiseler | Euphorbiaceae | 147 | 12.0 | ||||
| Debregeasia longifolia (Burm.f.) Wedd. | Urticaceae | 173 | 7.71 | ||||
| Dendrocnide sinuata (Blume) Chew. | Urticaceae | 133 | 10.6 | 227 | 11.6 | ||
| Deutzia compacta Craib | Hydrangeaceae | 80.0 | 7.58 | ||||
| Eriosolena involucrata (Wall.) Tiegh. | Thymelaeaceae | 160 | 16.9 | ||||
| Grona heterocarpos (L.) H.Ohashi & K.Ohashi | Fabaceae | 213 | 9.69 | ||||
| Hibiscus sabdariffa L. | Malvaceae | 93.3 | 4.28 | ||||
| Leucosceptrum canum Sm. | Lamiaceae | 187 | 11.8 | 200 | 8.30 | ||
| Maesa indica (Roxb.) Sweet | Primulaceae | 147 | 9.33 | ||||
| Melastoma malabathricum L. | Melastomataceae | 120 | 11.8 | 240 | 9.75 | ||
| Millettia pachycarpa Benth. | Fabaceae | 173 | 15.7 | ||||
| Mussaenda roxburghii Hook.f. | Rubiaceae | 93.3 | 8.99 | 227 | 9.45 | ||
| Neillia thyrsiflora D.Don | Rosaceae | 133 | 7.36 | ||||
| Osbeckia nepalensis Hook. | Melastomataceae | 293 | 13.7 | ||||
| Oxalis acetosella L. | Oxalidaceae | 133 | 5.72 | ||||
| Oxyspora paniculata (D.Don) DC. | Melastomataceae | 200 | 8.30 | ||||
| Rhaphiolepis bengalensis (Roxb.) B.B.Liu & J.Wen | Rosaceae | 93.3 | 8.11 | 173 | 7.71 | ||
| Rubus ellipticus Sm. | Rosaceae | 213 | 9.69 | ||||
| Rubus efferatus Craib | Rosaceae | 40.0 | 4.23 | 133 | 5.72 | ||
| Rubus lucens Focke | Rosaceae | 187 | 11.3 | ||||
| Securinega sp. | Phyllanthaceae | 240 | 9.75 | ||||
| Senegalia pennata (L.) Maslin | Fabaceae | 120 | 10.1 | 66.7 | 3.13 | ||
| Uraria oblonga (Wall. ex Benth.) H.Ohashi & K.Ohashi | Fabaceae | 173 | 10.4 | ||||
| Herbs | |||||||
| Arisaema concinnum Schott | Araceae | 667 | 3.80 | 2170 | 10.7 | ||
| Bidens pilosa L. | Asteraceae | 1330 | 7.60 | 1670 | 6.49 | ||
| Commelina benghalensis L. | Commelinaceae | 4000 | 16.1 | 3170 | 12.6 | ||
| Curculigo orchioides Gaertn. | Hypoxidaceae | 2500 | 12.6 | ||||
| Cymbidium aloifolium (L.) Sw. | Orchidaceae | 1830 | 9.97 | 2170 | 8.75 | ||
| Dendrobium lituiflorum Lindl. | Orchidaceae | 2330 | 11.0 | ||||
| Dioscorea glabra Roxb. | Dioscoreaceae | 100 | 4.74 | 2500 | 10.1 | ||
| Drymaria cordata (L.) Willd. ex Schult. | Caryophyllaceae | 1670 | 7.58 | ||||
| Elatostema sessile J.R.Forst. & G.Forst. | Urticaceae | 2330 | 12.3 | 1170 | 4.86 | ||
| Entada rheedei Spreng. | Fabaceae | 1170 | 5.21 | 1000 | 5.16 | ||
| Erythropalum scandens Blume | Olacaceae | 833 | 3.31 | ||||
| Fagopyrum cymosum (Trevir.) Meisn. | Polygonaceae | 2670 | 9.11 | ||||
| Fragaria nilgerrensis Schltdl. ex J.Gay | Rosaceae | 1670 | 7.58 | 2330 | 8.45 | ||
| Girardinia diversifolia (Link) Friis | Urticaceae | 4170 | 22.3 | 2170 | 6.85 | ||
| Gnetum latifolium Blume | Gnetaceae | 1500 | 9.99 | 1830 | 6.19 | ||
| Gomphostemma strobilinum Wall. ex Benth. | Lamiaceae | 1670 | 9.50 | 3830 | 12.1 | ||
| Hedychium coronarium J.Koenig | Zingiberaceae | 1330 | 6.45 | ||||
| Hellenia speciosa (J.Koenig) S.R.Dutta | Costaceae | 1500 | 12.9 | 3670 | 12.4 | ||
| Mucuna macrocarpa Wall. | Fabaceae | 1330 | 8.56 | 2330 | 10.4 | ||
| Oxalis corniculata L. | Oxalidaceae | 833 | 5.23 | ||||
| Papilionanthe teres (Roxb.) Schltr. | Orchidaceae | 1500 | 13.8 | ||||
| Phanera vahlii (Wight & Arn.) Benth. | Fabaceae | 2000 | 12.4 | 1330 | 4.56 | ||
| Poranopsis paniculata (Roxb.) Roberty | Convolvulaceae | 2330 | 9.46 | 2830 | 10.1 | ||
| Saccharum longesetosum (Andersson) V.Naray. ex Bor | Poaceae | 1000 | 3.89 | ||||
| Smilax aspera L. | Smilacaceae | 2170 | 17.6 | 1170 | 5.49 | ||
| Spatholobus parviflorus (Roxb. ex G.Don) Kuntze | Fabaceae | 2330 | 11.6 | ||||
| Tetrastigma eucostaphylum (Dennst.) Alston | Vitaceae | 667 | 2.59 | ||||
| Tinospora sinensis (Lour.) Merr. | Menispermaceae | 2000 | 7.78 | ||||
| Ecosystem Component | Core Zone | Buffer Zone |
|---|---|---|
| Above-ground tree biomass | 263 ± 8.4 | 177 ± 11 |
| Below-ground tree biomass | 58.7 ± 3.4 | 40.7 ± 4.1 |
| Shrub biomass | 1.20 ± 1.2 | 2.01 ± 0.3 |
| Herb biomass | 0.70 ± 0.6 | 0.93 ± 0.4 |
| Floor mass | 3.3 ± 0.8 | 3.4 ± 0.5 |
| Total stand biomass | 327 ± 13.3 | 224 ± 18.7 |
| Ecosystem Compartment | Core Zone | Buffer Zone |
|---|---|---|
| Above-ground tree biomass | 120 ± 0.31 | 80.7 ± 0.43 |
| Below-ground tree biomass | 26.8 ± 1.45 | 18.6 ± 2.10 |
| Shrub biomass | 0.54 ± 1.16 | 0.92 ± 0.52 |
| Herb biomass | 0.31 ± 1.20 | 0.42 ± 0.45 |
| Floor mass | 1.50 ± 0.12 | 1.55 ± 0.15 |
| Total biomass carbon | 149 ± 3.40 | 102 ± 1.21 |
| Soil organic carbon | 75 ± 4.51 | 71 ± 3.45 |
Disclaimer/Publisher’s Note: The statements, opinions and data contained in all publications are solely those of the individual author(s) and contributor(s) and not of MDPI and/or the editor(s). MDPI and/or the editor(s) disclaim responsibility for any injury to people or property resulting from any ideas, methods, instructions or products referred to in the content. |
© 2023 by the authors. Licensee MDPI, Basel, Switzerland. This article is an open access article distributed under the terms and conditions of the Creative Commons Attribution (CC BY) license (https://creativecommons.org/licenses/by/4.0/).
Share and Cite
Ao, A.; Changkija, S.; Brearley, F.Q.; Tripathi, S.K. Plant Community Composition and Carbon Stocks of a Community Reserve Forest in North-East India. Forests 2023, 14, 245. https://doi.org/10.3390/f14020245
Ao A, Changkija S, Brearley FQ, Tripathi SK. Plant Community Composition and Carbon Stocks of a Community Reserve Forest in North-East India. Forests. 2023; 14(2):245. https://doi.org/10.3390/f14020245
Chicago/Turabian StyleAo, Aosanen, Sapu Changkija, Francis Q. Brearley, and Shri Kant Tripathi. 2023. "Plant Community Composition and Carbon Stocks of a Community Reserve Forest in North-East India" Forests 14, no. 2: 245. https://doi.org/10.3390/f14020245
APA StyleAo, A., Changkija, S., Brearley, F. Q., & Tripathi, S. K. (2023). Plant Community Composition and Carbon Stocks of a Community Reserve Forest in North-East India. Forests, 14(2), 245. https://doi.org/10.3390/f14020245