1. Introduction
The efficient and accurate monitoring of the forest volume and its dynamic change is a popular topic of research in the field of natural resource investigation and monitoring [
1,
2,
3], which also constitutes a technical challenge [
4]. It is important to achieve the estimates at the minimum cost with no more uncertainty than that which is appropriate for the objectives of the inventory. Information required for decision making is acquired by using inventories to estimate the means and total measures of the forest characteristics, including the volume of the growing stock, which is the principal commercial product of forests, within a defined area. Due to the cost limitation of the field survey, it is impossible to measure every tree in order to investigate the forest volume because of the large areas involved. Therefore, the acquisition of information is typically based on sampling. Simple random sampling is the easiest technique through which a sample can be selected, but it is certainly not the only one. Significantly, there are other sampling techniques that have the great advantage of potentially leading to a reduction in the size of the confidence limit of the given parameter that is being estimated for a population. Analyses of the existing forest survey data can improve the sampling efficiency and estimation accuracy [
5,
6,
7]. Research on sampling techniques focused on the acquisition of auxiliary data by remote sensing, applied using various approaches. Due to the requirements of accuracy and reliability, reducing the sampling units by improving the sampling methods and applying historical data is a key scientific problem [
8]. With the implementation of a series of forestry policies to promote the construction of an ecological civilization and to address global climate change, the need for annual indicators of forest volumes is particularly urgent [
9].
There are several feasible approaches to the production of annual estimates of forest volumes using CFI data [
10]. The most straightforward approach simply uses the panel data to obtain estimates for the current year to reflect the current conditions. A drawback to this approach is that its inferential precision may be unacceptable. The second approach is joint estimation following the uniform grouping of the plots [
2,
11]. The precision of this approach is increased because the data for all the sample plots are used for the estimation. A third approach is to update the initial estimates obtained from an estimator, which can be design- or model-based, for the current year [
1]. The optimization of the sampling system, which aims to improve the efficiency in order to reduce the workload that is currently in effect in forest resource investigation and monitoring, is necessary [
2,
3]. Sampling methods and techniques are key to obtaining forest resource information. Researchers widely used equiprobability sampling, which is the classic method [
12,
13]. Unequal probability sampling, spatial sampling, and adaptive sampling are more targeted toward forest volume inventories when the forest is not randomly distributed [
14]. The merging and optimization of various sampling methods and techniques to improve the inventory efficiency based on the general applications and targeted supplements in the field of forest ecosystem dynamic monitoring became a developing trend [
15,
16]. The sampling methods used in national-scale forest resource surveys and monitoring in the United States, Canada, Germany, and Switzerland include stratified sampling, three-stage sampling, and stratified double sampling, which have their own advantages and disadvantages [
17,
18]. Research investigating sampling techniques focused on producing unbiased annual estimates for the forest inventory and data analysis, applying various approaches [
19].
Spatial sampling is based on geostatistics known as geological statistics [
20,
21,
22], which are also widely used in ecological research [
23]. In forestry, geostatistics improve the precision and reliability of the estimation because they enable the segregation of different forest sites and ensure the representativeness of the estimations while improving the precision of the estimates and enabling a decreased sampling intensity [
24,
25]. An ecosystem is a dynamic equilibrium system with high spatial and temporal heterogeneity that is composed of a biotic community and its living environment. The difference between the spatial sampling technique and classical sampling technique lies in the consideration of the spatial autocorrelation of the research objects, possessing a wide range of applications in the field of natural resource surveying and monitoring [
26]. Geostatistical interpolation proved to be a useful tool for studying spatial variation in forest carbon density [
27]. We used geostatistics to guide the development of a sampling strategy that can reduce the number of plots to be measured while maintaining a high degree of accuracy and precision.
Angle count sampling was introduced in 1957 as an improvement on the ocular estimation technique, and stratified sampling was first attempted in 1963 in China. Since then, the forest inventory technique progressively transitioned from ocular estimation to statistical sampling. Meanwhile, research and experimentation focused on inventory methods that are suitable for different areas, conditions, and management levels, such as two-stage and multistage sampling inventories, double sampling with regression, and regression-based surveys combined with visual estimation and field mensuration, etc. Most of these methods were already put into practice [
9]. In 2021, The National Forestry and Grassland Administration organized the comprehensive ecological monitoring of forests and grasslands on the national scale. Based on this continuous forest inventory sampling, one-fifth of the plots are investigated every year, and four-fifths of the samples are updated by remote sensing interpretation and modeling. Then, the forest volume is estimated in all the provinces of China according to the “1/5 + 4/5” joint estimation approach [
2]. This comprehensive national ecological monitoring of forests and grassland optimized the survey organization process. The sampling method still employs an equal probability sampling technique. The number of sample units to be investigated by equiprobability sampling still accounts for approximately 20% of all the plots according to the specified accuracy and reliability. The systematic sampling method can reduce the sampling efficiency when there is substantial spatial autocorrelation in the distribution of the forest resources [
28,
29,
30]. Systematic sampling reduces the correlation between plots. When the forest resources are distributed in clusters, the estimation accuracy may not meet the requirements, which increases the uncertainty regarding the sources of error [
31,
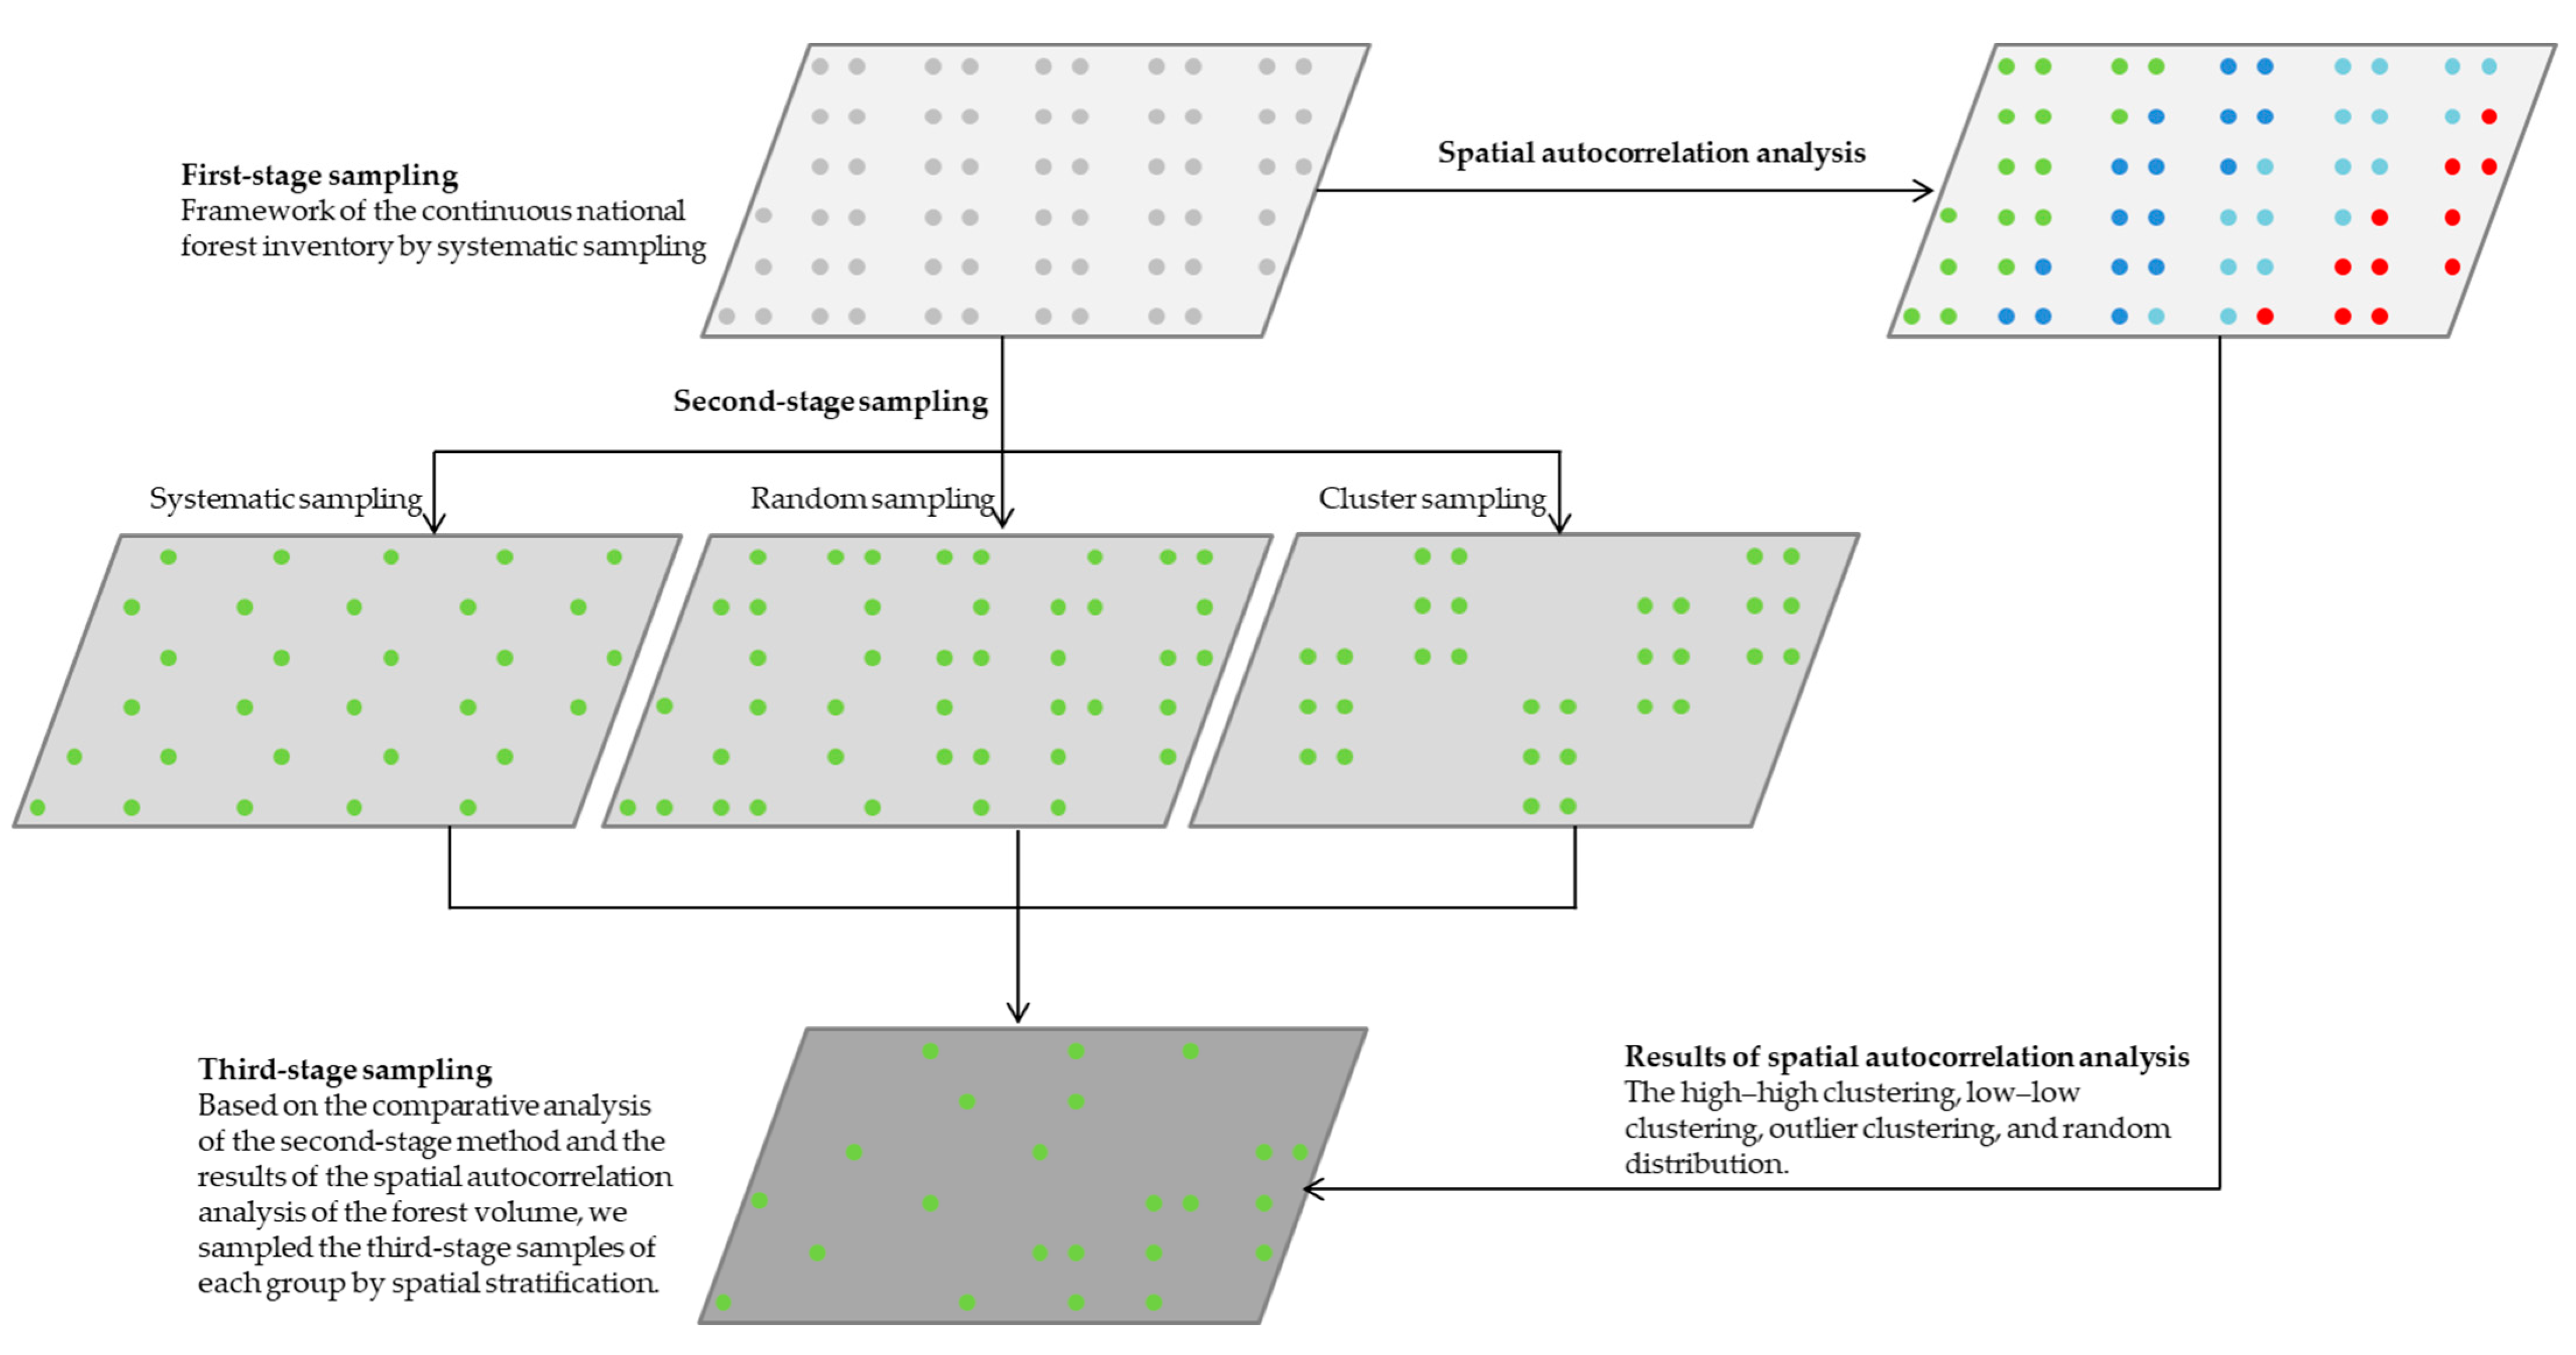
32]. Optimizing the sampling design and estimation methods to reduce the survey samples is a key problem in the monitoring of forest resources. In this study, we analyzed the characteristics of the timeseries and spatial distribution patterns of the forest volume by spatial autocorrelation. We optimized the multistage unequal probability sampling design for the annual monitoring of the forest volume based on the results of the timeseries and spatial distribution analyses. We updated the data according to the established growth model. Here, we demonstrate that a set of spatial unequal probability sampling techniques and methods should be formed in line with the annual monitoring of the forest volume to improve the inventory efficiency and, thus, to ensure the timely, accurate, and rapid acquisition of the forest volume information.
5. Discussions
Spatial sampling theory is the foundation of sample surveys of spatial-related resources [
36]. Recognizing the presence of spatial autocorrelation and spatial heterogeneity in the attribute has implications for the efficiency with which sampling is carried out, that is, the estimator error variance in relation to the sample design and sample size. The benefits of stratification, which serves to improve the error variance in the estimators of the mean when spatial autocorrelation is present, are well established. On a large regional scale, the soil, elevation, light, water, and other habitat factors are rarely uniform [
36]. The spatial heterogeneity of the habitat factors creates a situation in which the spatial distribution of the forest volume has certain regional and structural characteristics [
30]. For example, in this study, the high values of the forest volume were mainly concentrated in the Aba Prefecture, Garze Prefecture, and Liangshan Prefecture, while the low values were mainly concentrated in the Sichuan Basin. The transitional zone between the three prefectures and basin region presented a phenomenon of random distribution. We found that the forest volume is a random function that is related to the random variable and location. Therefore, the sampling method of the forest volume inventory should take into account the spatial location and distribution of stands.
The continuous forest inventory system based on equal probability sampling is currently the most complete and authoritative method [
37]. The premise of the sampling technique and estimation method of the continuous forest inventory system is that the sampling units are independent of one another [
38]. However, through the in-depth study of the spatial autocorrelation of, and spatial variability in, environments in a given geographical space, researchers found that the heterogeneity of the habitat factors creates a situation in which the forest resources generally present non-random spatial distribution states [
29,
30], which results in limitations to the traditional method of equal probability sampling and estimation methods used in practical applications. According to Trangmar’s research [
22], based on the same sampling accuracy requirements, the spatial sampling method, which considers the spatial variability of the sampling units, requires a substantially smaller sample size than the traditional sampling method. In this study, we found that the clustering distribution pattern of the forest volume based on the spatial autocorrelation analysis can effectively reduce the variance within the stratifications, and it can be used as prior information for the spatially stratified sampling stage [
39,
40].
The phases can consist of data from satellite images (first stage), aerial photographs (second stage), and field measurements (third stage) [
41]. The Alaska Integrated Resource Inventory System even tested a four-stage inventory design involving satellite imagery as the first phase, high-altitude aerial photography as the second phase, low-altitude color photography as the third phase, and field sampling as the fourth phase. It was shown that the use of more than one auxiliary data source, together with field data, improves the estimation accuracy [
42]. The unequal probability multistage sampling design based on the temporal and spatial evolution analyses of forest resources is an alternative method for forest surveys that can increase the efficiency of the forest inventory analysis in cases where the situation demands it, such as a global pandemic that leads to restrictions on transportation and lodging or situations where financial and personnel resources are limited.
6. Conclusions
We observed a substantial positive spatial autocorrelation in the forest volume. At the significance level of α = 0.01, the high-volume stands were mainly concentrated in the Aba Prefecture, Garze Prefecture, and Liangshan Prefecture, while the low-volume stands were mainly concentrated in the Sichuan Basin region. The clustering distribution patterns that we obtained by spatial autocorrelation analysis can effectively reduce the variance within the stratifications, and can be used as prior information for the spatial stratified sampling. The sampling of the plots by spatial stratified sampling was mainly concentrated in the areas affected by significant human disturbances (that is, large coefficients of variation). The average estimation accuracy of the systematic sampling, random sampling, and cluster sampling in the second stage was 94.09%, with 95% reliability. The mean correlation coefficients (R) between the estimated value of the forest volume and observations of the systematic sampling, random sampling, and cluster sampling in the second stage were 0.95, 0.98, and 0.96, respectively. The relative differences (RD%) were −0.52, −0.39, and −0.36, respectively. The spatial stratified sampling in the third stage, for which we used spatial distribution pattern information, significantly reduced the sampling ratio to 1.68 per 10,000. With 95% reliability, the mean accuracy of the spatial stratified sampling in the third stage was 93.05%, the R was 0.94, and the RD% was −0.09. The number of samples in the stratified sampling was 95.46% less than that in the sampling survey of the continuous forest inventory system, which greatly reduced the workload of the plot survey. In conclusion, spatial stratified sampling is more in line with the actual work conducted in annual surveys, and it can better meet the requirements of the annual output.


