Article

Allocation Patterns and Temporal Dynamics of Chinese Fir Biomass in Hunan Province, China

1
College of Forestry and Landscape Architecture, South China Agricultural University, Guangzhou 510642, China
2
Ministry of Education Key Laboratory of Silviculture and Conservation, Beijing Forestry University, Beijing 100083, China
3
Hunan Academy of Forestry, Changsha 410018, China
4
Hunan Prospecting Designing and Research General Institute for Agriculture Forestry and Industry, Changsha 410007, China
*
Author to whom correspondence should be addressed.
These authors contributed equally to this work.
Forests 2023, 14(2), 286; https://doi.org/10.3390/f14020286
Submission received: 8 November 2022 / Revised: 28 January 2023 / Accepted: 31 January 2023 / Published: 2 February 2023
(This article belongs to the Section Forest Ecology and Management)

Abstract

:
How trees allocate their biomass among different components has important implications for their survival and growth and ecosystem carbon cycling. Data on the distribution pattern and dynamics of tree biomass are essential for fully exploiting forest carbon sequestration potential and achieving the goal of carbon neutralization. However, there has not been enough research to-date on tree biomass spatial allocation and temporal dynamics in different site qualities at specific tree species scales. This study aimed to evaluate the biomass allocation patterns within tree components of Chinese fir and to examine how they are affected by tree age and site quality. A total of 87 trees were destructively sampled and measured for stem, branch, leaf, bark and root biomass. The biomass proportion difference of tree components in different age stages (8-40 years) was analysed, and the influence process of tree age and site quality on biomass allocation was examined. Our results indicate that the biomass allocation varied with tree age and was also affected by site quality. Stem biomass accounted for the largest proportion of total tree biomass, followed by leaf, root, branch and bark biomass in young forests, and it was followed by root, bark, branch and leaf biomass in other age groups. The biomass proportion of each component all nonlinearly changed with tree age. The proportion of stem biomass increased with increasing tree age, and the biomass proportion of branches and leaves decreased with increasing tree age. The proportion of root biomass first increased and then decreased with tree age, while the bark biomass proportion first decreased and then increased with increasing tree age. Site quality had a positive effect on the biomass proportion of stems but a negative effect on the biomass proportion of branches and bark. The interaction of tree age and site quality also had a significant effect on the proportion of stem biomass as well as root biomass. Therefore, to obtain accurate estimates of Chinese fir forest biomass and carbon stocks, age-specific changes and the influence of site conditions on it need to be considered.

1. Introduction

As a crucial indicator of forest growth and quality, estimating biomass plays a key role in monitoring the global carbon cycle and forest health assessments, and it is an important task in ensuring the long-term viability and sustainability of forest resources on regional to national and international scales, particularly in regard to carbon accounting [1]. The monitoring and estimation of forest biomass can also help to understand the implications of policy actions and how climate change may affect sustainability [2]. It is an important part of modern forest ecosystem research, an important basis for revealing the law of mutual restriction and interaction between forest and environmental components, and is of great significance for studying the fixation, consumption, distribution, accumulation and transformation of material and energy in the ecosystem [3]. Additionally, measuring the status of and change in forest biomass is also critical for formulating national forest resource management policies [4].
Currently, there are three main inventory data types for estimating forest biomass: ground-based measurement methods, remote-sensing-based estimates, and a combination of both methods [5]. When the sample sizes are sufficiently large, field-based measurement methods are generally considered to be more accurate than remote-sensing-based estimates, but the latter can be more cost-effective, especially for large scales and inaccessible terrain [6]. Generally, there are three major methods for estimating tree biomass: direct estimation of biomass from predictor variables; indirect estimation of biomass from tree volume; or simultaneous estimation of both biomass and volume [7]. The direct prediction method is probably the most accurate but involves the costly process of felling and weighing sample trees to acquire the data. In addition, it assumes that the various properties of the sample trees selected are representative of the larger predicted stand or forest [6]. The indirect method is translating stem volume to biomass through some form of biomass expansion factor, assuming a constant or variable density within trees and between species [8], and the biomass of other organs (branch, leaf, bark, root) is calculated according to the stem biomass and the corresponding proportion coefficients. The indirect method is cost-effective but may lead to errors if the conversion coefficients are inaccurate. The third method attempts to avoid these errors by accounting for the difference in both wood density and tree volume in prediction models [7].
Regardless of the data types and methods, accurate individual tree or stand-level biomass estimation models are necessary to translate field measurements or remotely sensed data into estimates of forest biomass. These models commonly rely on traditional forest inventory factors such as tree diameter and total height as independent variables in equations that estimate tree biomass [6]. Tree-based estimates are then summed on sample plots and applied to larger forest areas using probability or area-based expansion factors. Improving the estimation accuracy of forest biomass is essential for determining the change in global carbon balance [9], predicting forest growth [10], modelling the carbon budget [11], and developing sustainable forestry strategies [12]. Much effort has been invested in improving the accuracy of existing forest biomass estimation models, such as by further adding tree height [13], wood density [14] and crown structure factors [15] into existing estimation models, by acquiring more accurate stem form and developing stem taper models [16], or by amending the structures and forms of the allometric models [17].
There is an obvious vertical distribution of tree biomass on various organs [18]. Trees allocate biomass among different organs in response to resource limitation, and this physiological activity is considered to be evolutionary strategies to help them better adapt to different habitats [19,20]. Because of this, biomass allocation has a significant impact on plant productivity, thus affecting the spatial distribution of overall biomass and carbon storage of the forest communities and forest ecosystem [21]. Therefore, comprehensively understanding the spatial allocation pattern and change in forest biomass in different organs is essential for establishing accurate estimation models of forest biomass [22]. At present, many studies on the spatial distribution of forest biomass at local [23], national [24], regional [25], international [26] and global [27] scales have been carried out. Additionally, more detailed information on the spatial allocation patterns of biomass in different organs has been continuously provided [28]. Previous studies have shown that the allocation pattern of forest biomass in different organs is affected by tree species [18], stand age [29,30], stand density [31], light environments [32], precipitation [33] and site conditions [34]. However, different researchers have obtained varied conclusions, which may be related to specific tree species and site conditions, but the specific tree traits that drive this variation remain poorly understood [35].
It is a costly process to collect tree biomass data because it requires felling trees and must collect, weigh and analyse sample tissues of stems, branches, leaves, bark, roots and other organs [6]. Therefore, more than 75% of the biomass research sample trees were less than 50, and only approximately 8% provided the prediction of the root biomass [36], which also hindered the accurate and comprehensive understanding of the distribution pattern of tree biomass on various organs. With the proposal of the goal of carbon peak and carbon neutrality in the world, it is necessary and urgent to more accurately master the spatial allocation pattern and change dynamics of biomass of various organs on the specific tree species scale to establish a more accurate forest biomass estimation model.
Chinese fir (Cunninghamia lanceolata (Lamb.) Hook.) is a fast-growing planted coniferous tree species, with height up to 30 m and diameter at breast height up to 2.5 m. As a high-quality timber (i.e., excellent material, straight and full stem forms) species, Chinese fir has been widely planted in 18 provinces and regions in southern China for more than one thousand years. In recent decades, the annual timber production of Chinese fir has accounted for 20%–25% of the national commercial timber output, which has provided considerable economic benefits to local farmers. Simultaneously, Chinese fir forests provide considerable ecological benefits to the region and nation through their ecosystem services, such as carbon sequestration, increasing groundwater resources and conserving soil erosion [37]. In recent years, with the construction of ecological environment in China, more attention has been given to the ecological services of forests. After the goal of carbon neutrality is proposed, the carbon fixation function of forest ecological services will be further emphasized [38]. The area and volume of Chinese fir plantations have reached 9.90 million hectares and 755 million cubic metres, and they account for 27.23% and 32.57% of the main dominant tree species of planted forest in China, respectively [39]. It is of great significance to study the temporal and spatial allocation pattern and change in Chinese fir biomass to give full play to its carbon sequestration potential and achieve the goal of carbon neutralization
This study focused on the spatial allocation patterns of biomass in various organs and its change dynamics with the stand age of Chinese fir plantations. In addition, we also examined the influence of site quality on the allocation pattern and change in biomass of Chinese fir. We expect the results to provide in-depth insights for a better understanding of the formation and change mechanism of forest biomass, therefore providing a basis and support for more accurate biomass estimation model establishment and carbon stock determination.

2. Materials and Methods

2.1. Study Area

The study was carried out in Chinese fir plantations of Hunan Province, China. Hunan is the main production area of Chinese fir; it is located in the central and southern parts of China (24°38′~30°08′ N, 108°47′~114°15′ E), belongs to the subtropical zone and has a continental monsoon humid climate. Its mean annual rainfall is 1200–1800 mm, relative humidity is 79%, annual sunshine hours are 1300–1800 h, and annual average temperature is 16.0–18.5 °C. The landform type is mainly mountainous and hilly with an elevation of 100–800 m above sea level. The soils are mainly red soil, yellow soil, purple soil, and paddy soil developed from slate and shale with a clay–loam texture, stoniness in the range of 4%–15%, medium fertility, and a mean depth of 80 cm.
The native vegetation in Hunan Province is dominated by evergreen broad-leaved forest, mixed evergreen and deciduous broad-leaved forest, deciduous broad-leaved forest and mountain top moss copse. However, due to the great disturbance by human activities, native vegetation has been seriously damaged. After several decades of vegetation restoration and artificial afforestation, the current vegetation is mainly composed of Chinese fir (Cunninghamia lanceolata) plantations, Masson pine (Pinus massoniana) plantations, swamp pine (Pinus elliottii) plantations, poplar (Populus) plantations, bamboo groves (Phyllostachys heterocycla) and so on. According to the results of the Ninth National Forest Resources Continuous Inventory, the forest area and stand volume of Hunan Province are 10.53 × 10⁴ km2 and 4.07 × 10⁸ m3, respectively, of which the area and volume of Chinese fir plantation accounted for 38.54% and 41.25%, respectively.

2.2. Sample Plot Setting and Investigation

According to the distribution of Chinese fir plantations in Hunan Province, temporary observation sample plots were installed for sample tree mensuration and biomass sample collection in five state-owned forest farms in Hunan, namely, the Jindong forest farm, Paiyashan forest farm, Huangfengqiao forest farm, Shichangxi forest farm, and Xishan forest farm (Figure 1). The stands selected for sample plots installation are all plantations with the same or similar initial planting density, and the same management measures were adopted during the whole rotation period, such as weeding in the first three years after planting and thinning with roughly the same intensity at the age of eight years. Therefore, these stands should have roughly the same density at the same age in the growth process if their site condition is roughly the same. Each sample plot had an area of 400 m2 (20 m × 20 m), totaling 29 plots established in stands of different ages and at least 3 plots for each age group of young forest, middle age forest, near mature forest, mature forest and over mature forest. At the same time, the sample plots within the same age group were set up in stands with different site conditions as much as possible.
All trees with a diameter at breast height greater than 5 cm in the sample plots were numbered. The total height, diameter at breast height and crown width of these trees, as well as the site environment and growth status of stands, were inventoried in August 2021, prior to sample collection. Then, the mean diameter at breast height, average total tree height, stand density and other factors were calculated according to the measurement results. The stand characteristics for each temporary plot are shown in Table 1.

2.3. Sample Tree Selection and Sample Collection

In each observation sample plot, three mean trees were selected as sample trees according to the mean diameter at breast height, average total tree height and average stem form, then they were felled for biomass sample collection; altogether, 87 sample trees were harvested. The breast height position and the north-south direction of these sample trees were marked before they were cut down. After the sampled trees were cut down, the height of the first living branch and the first dead branch were measured, and then all branches were cut off and counted. The total height of the stem and the diameter of the bark and peeling at one quarter, one half and three-quarters of the tree height were measured. The stem was divided into upper, middle and lower segments of equal length and then cut into several sections at heights of 1 m intervals (stem length ≤ 10 m) or 2 m intervals (stem length > 10 m) up to the treetop. The fresh weight of each section was weighed, and then the fresh weight of the upper, middle and lower parts and the total weight of the stem were calculated. At the ground level, breast height, and middle position of each section, one cross-sectional stem disc (approximately 5 cm thick) was cut for stem analysis, as well as one disc at the middle position of the upper, middle and lower segments as biomass samples. If there was a branch at the height of the disc, a replacement disc was collected 5 cm above or below. The north direction, section height, plot and tree number and other information were recorded on each disc, and the fresh weight (with and without bark) of stem and bark sample discs were weighed. All the roots with a diameter greater than 0.2 cm of the sample tree were dug out and weighed, and then 500 g of root samples were collected. All branches and leaves were also weighed separately, and then samples of 500 g each were collected. All samples were taken back to the laboratory for measurement and analysis of the biomass. The information of the felled sample trees is presented in Table 2.

2.4. Data Statistics and Analysis

The proportion (Pj) of the biomass of various organs (the upper, middle and lower segments of the stem and total stem, branch, leaf, bark, and root) to the total biomass of the sample tree was calculated.
P j = W j W T × 100 %
where Wj and WT represent the biomasses of the jth organ and the total sample tree, respectively.
Two-way analysis of variance (ANOVA) and Tukey’s multiple comparisons were used to separate the significance differences (p < 0.05) among tree age and site index after the homogeneity of variance and normal distribution tests were passed (if the test of homogeneity of variance and normal distribution were not passed, the data were treated with inverse sine transformation, logarithmic transformation, etc.).
The influence process of tree age and site quality on biomass allocation was analysed using a generalized additive mixed model (GAMM) from the “gamm4” package in R software [40]. From the perspective of forest growth and yield, the site index, which is the mean height of dominant and codominant or top height trees at a given base age, is often used to quantify site quality [41]. The measurement of the site index was represented by the stand dominant height in this study. The GAMM is a semiparametric model with a linear predictor involving a sum of smooth functions of covariates, which allows flexible functional dependence of an outcome variable on covariates via nonparametric regression while accounting for correlation among observations using random effects [42]. GAMM is increasingly applied in ecological and environmental research [43] as follows:
E i j k = K 0 + f i j k ( A i ) + f i j k ( S i ) + R i j + ε i j k
where Eijk is the dependent variable (proportion of the kth organ biomass to the total biomass of the sample tree I in plot j), K0 is the overall intercept, fijk (Ai) is a smooth function of tree age (A) corresponding to the kth organ, fijk (Si) is a smooth function of site index (S) corresponding to the kth organ of sample tree i in plot j, Rij is the random effect of the sample tree i in plot j which is assumed to be distributed as N(0, σ2) with a variance component σ2, and εij is an error vector.

3. Results

3.1. Allocation Pattern of Biomass in Different Organs

As shown in Table 3, in general, among the various organs of Chinese fir, the biomass of stems accounted for the largest proportion, ranging from 43.61% to 59.94% in different age groups, with an average of 54.61%, followed by roots, bark and branches, ranging from 15.12% to 20.46%, 9.21% to 10.87%, and 6.06% to 11.95% in different age groups, with averages of 19.45%, 10.20% and 8.34%, respectively. The biomass of leaves accounted for the smallest proportion, ranging from 3.88% to 18.45% in the different age groups, with an average of 7.41%. The proportion of biomass of each organ to the total biomass of trees in Chinese fir varies in different age groups. In other age groups, except for young-stage forests, the proportion of biomass of various organs followed was stem, root, bark, branch and leaf, while in young-stage forests, the permutation order followed was stem, leaf, root, branch and bark.
For tree stems, the biomass of the lower part accounts for the largest proportion, ranging from 57.45% to 65.96% in different age groups, with an average of 59.60%, followed by the middle part, ranging from 27.26% to 33.78% in different age groups, with an average of 32.15%. The biomass of the upper part accounts for the smallest proportion, ranging from 6.78% to 8.77% in different age groups, with an average of 8.25% (Figure 2).

3.2. Dynamic Changes in Biomass Allocation Patterns

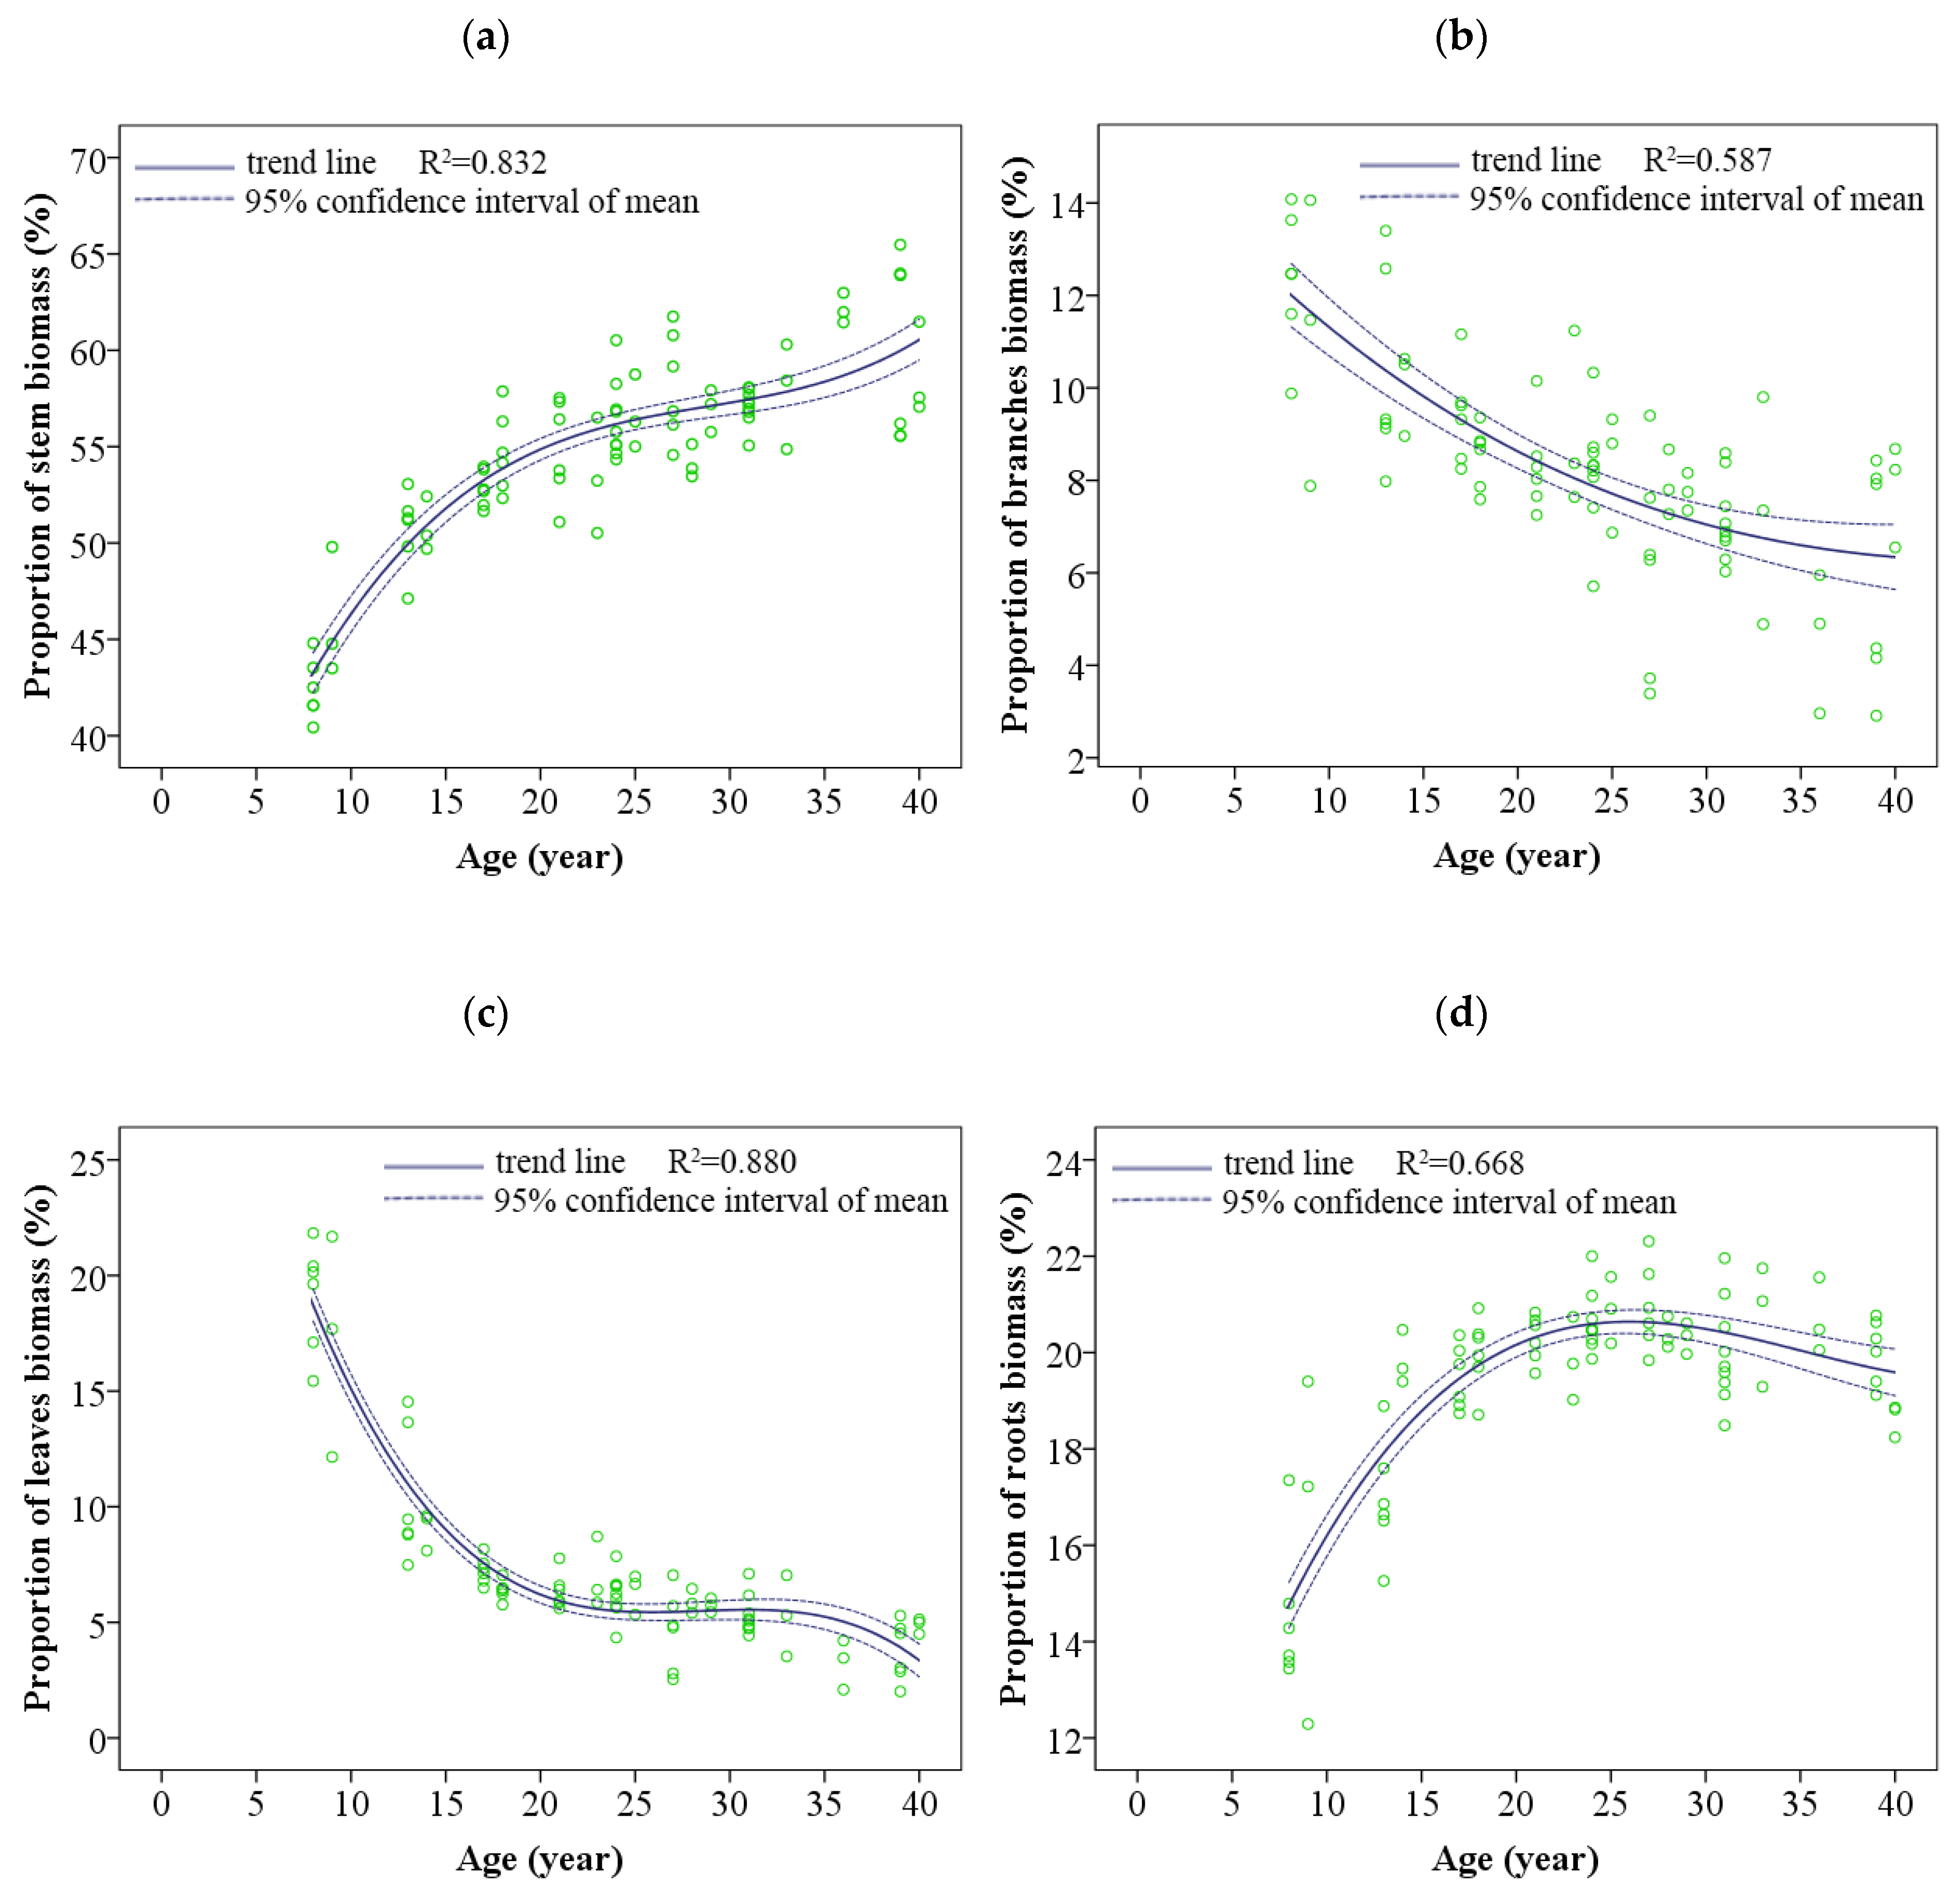
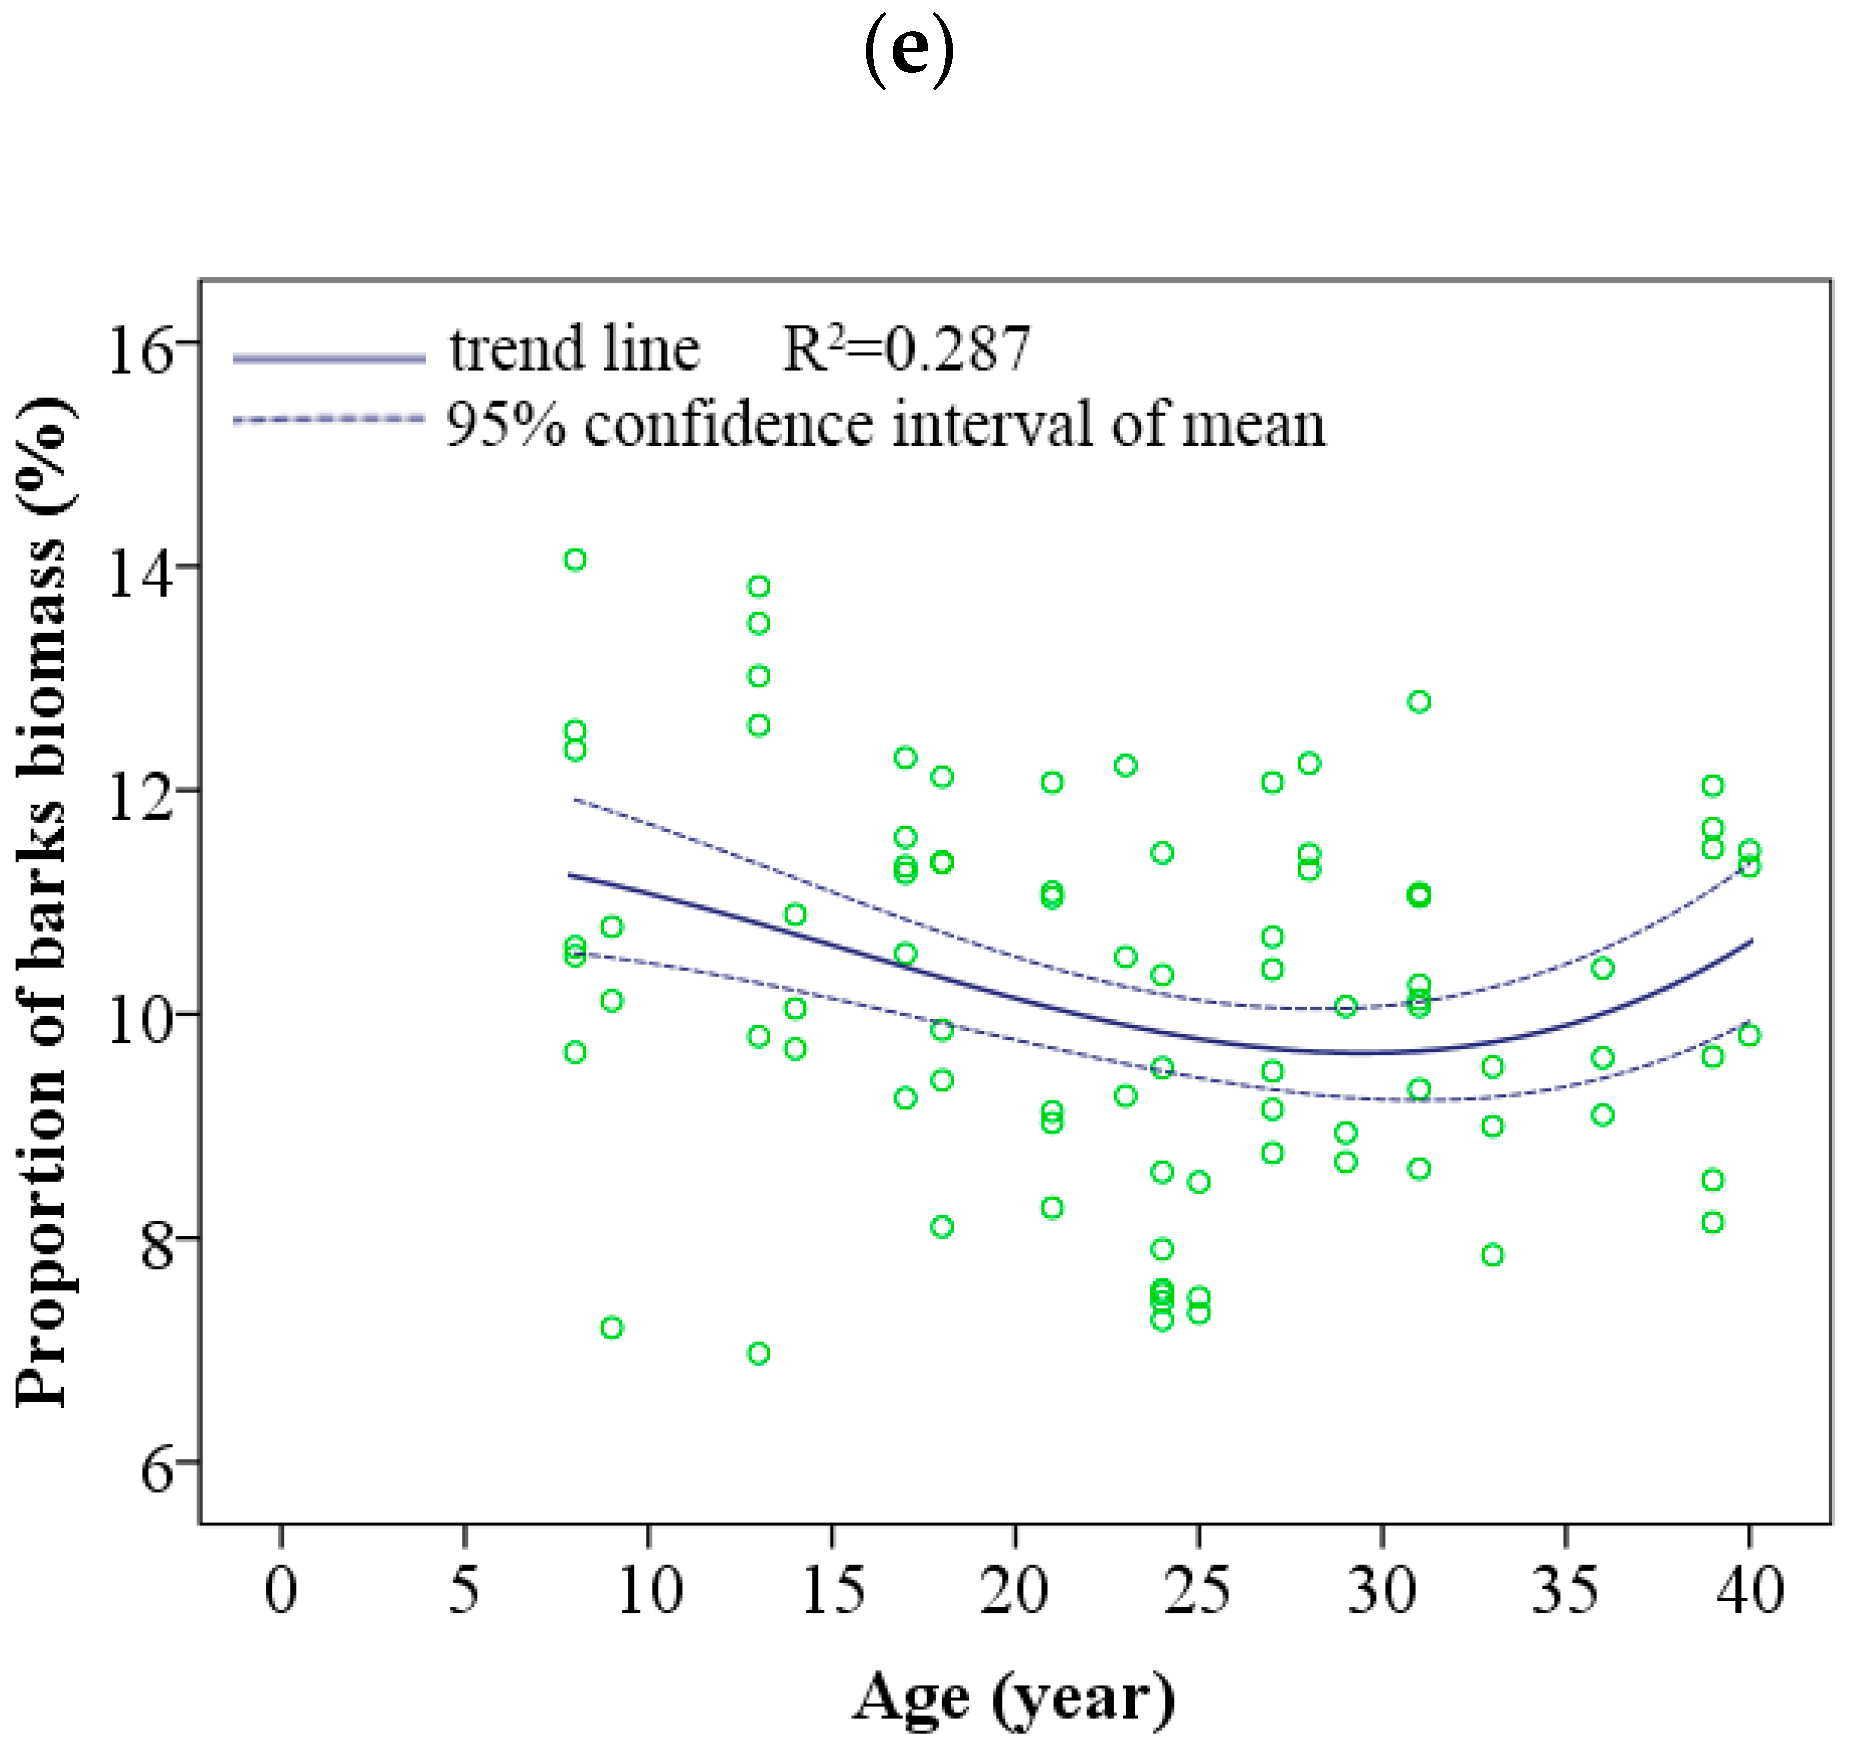
The biomass of each organ and total tree all increased with time and gradually reached a stable level after maturity, but the proportion of biomass of different organs changed differently with time. The results of variance analysis showed that tree age had a significant effect on the proportion of biomass of tree stems (p < 0.001). The proportion of stem biomass nonlinearly increased with increasing tree age, showing an “S-shaped” curve similar to the growth process of tree diameter (Figure 3a). In addition, for tree stems, the proportion of biomass in the lower part decreased gradually with increasing tree age, while the proportion of biomass in the middle and upper parts increased gradually with increasing tree age. Tree age also had a significant effect on the proportion of branch, leaf and root biomass (p < 0.001). The proportion of biomass of branches and leaves decreased with increasing tree age, but their change process was different (Figure 3b,c). For roots, the proportion of biomass first increased as the tree age increased before the trees matured and then decreased with the increase in tree age after the trees reached maturity (Figure 3d). For bark, the biomass proportion was also affected by tree age (p < 0.05), and it first decreased and then increased with increasing tree age, showing a slightly concave curve (Figure 3e).

3.3. Effects of Site Quality on Biomass Allocation Pattern

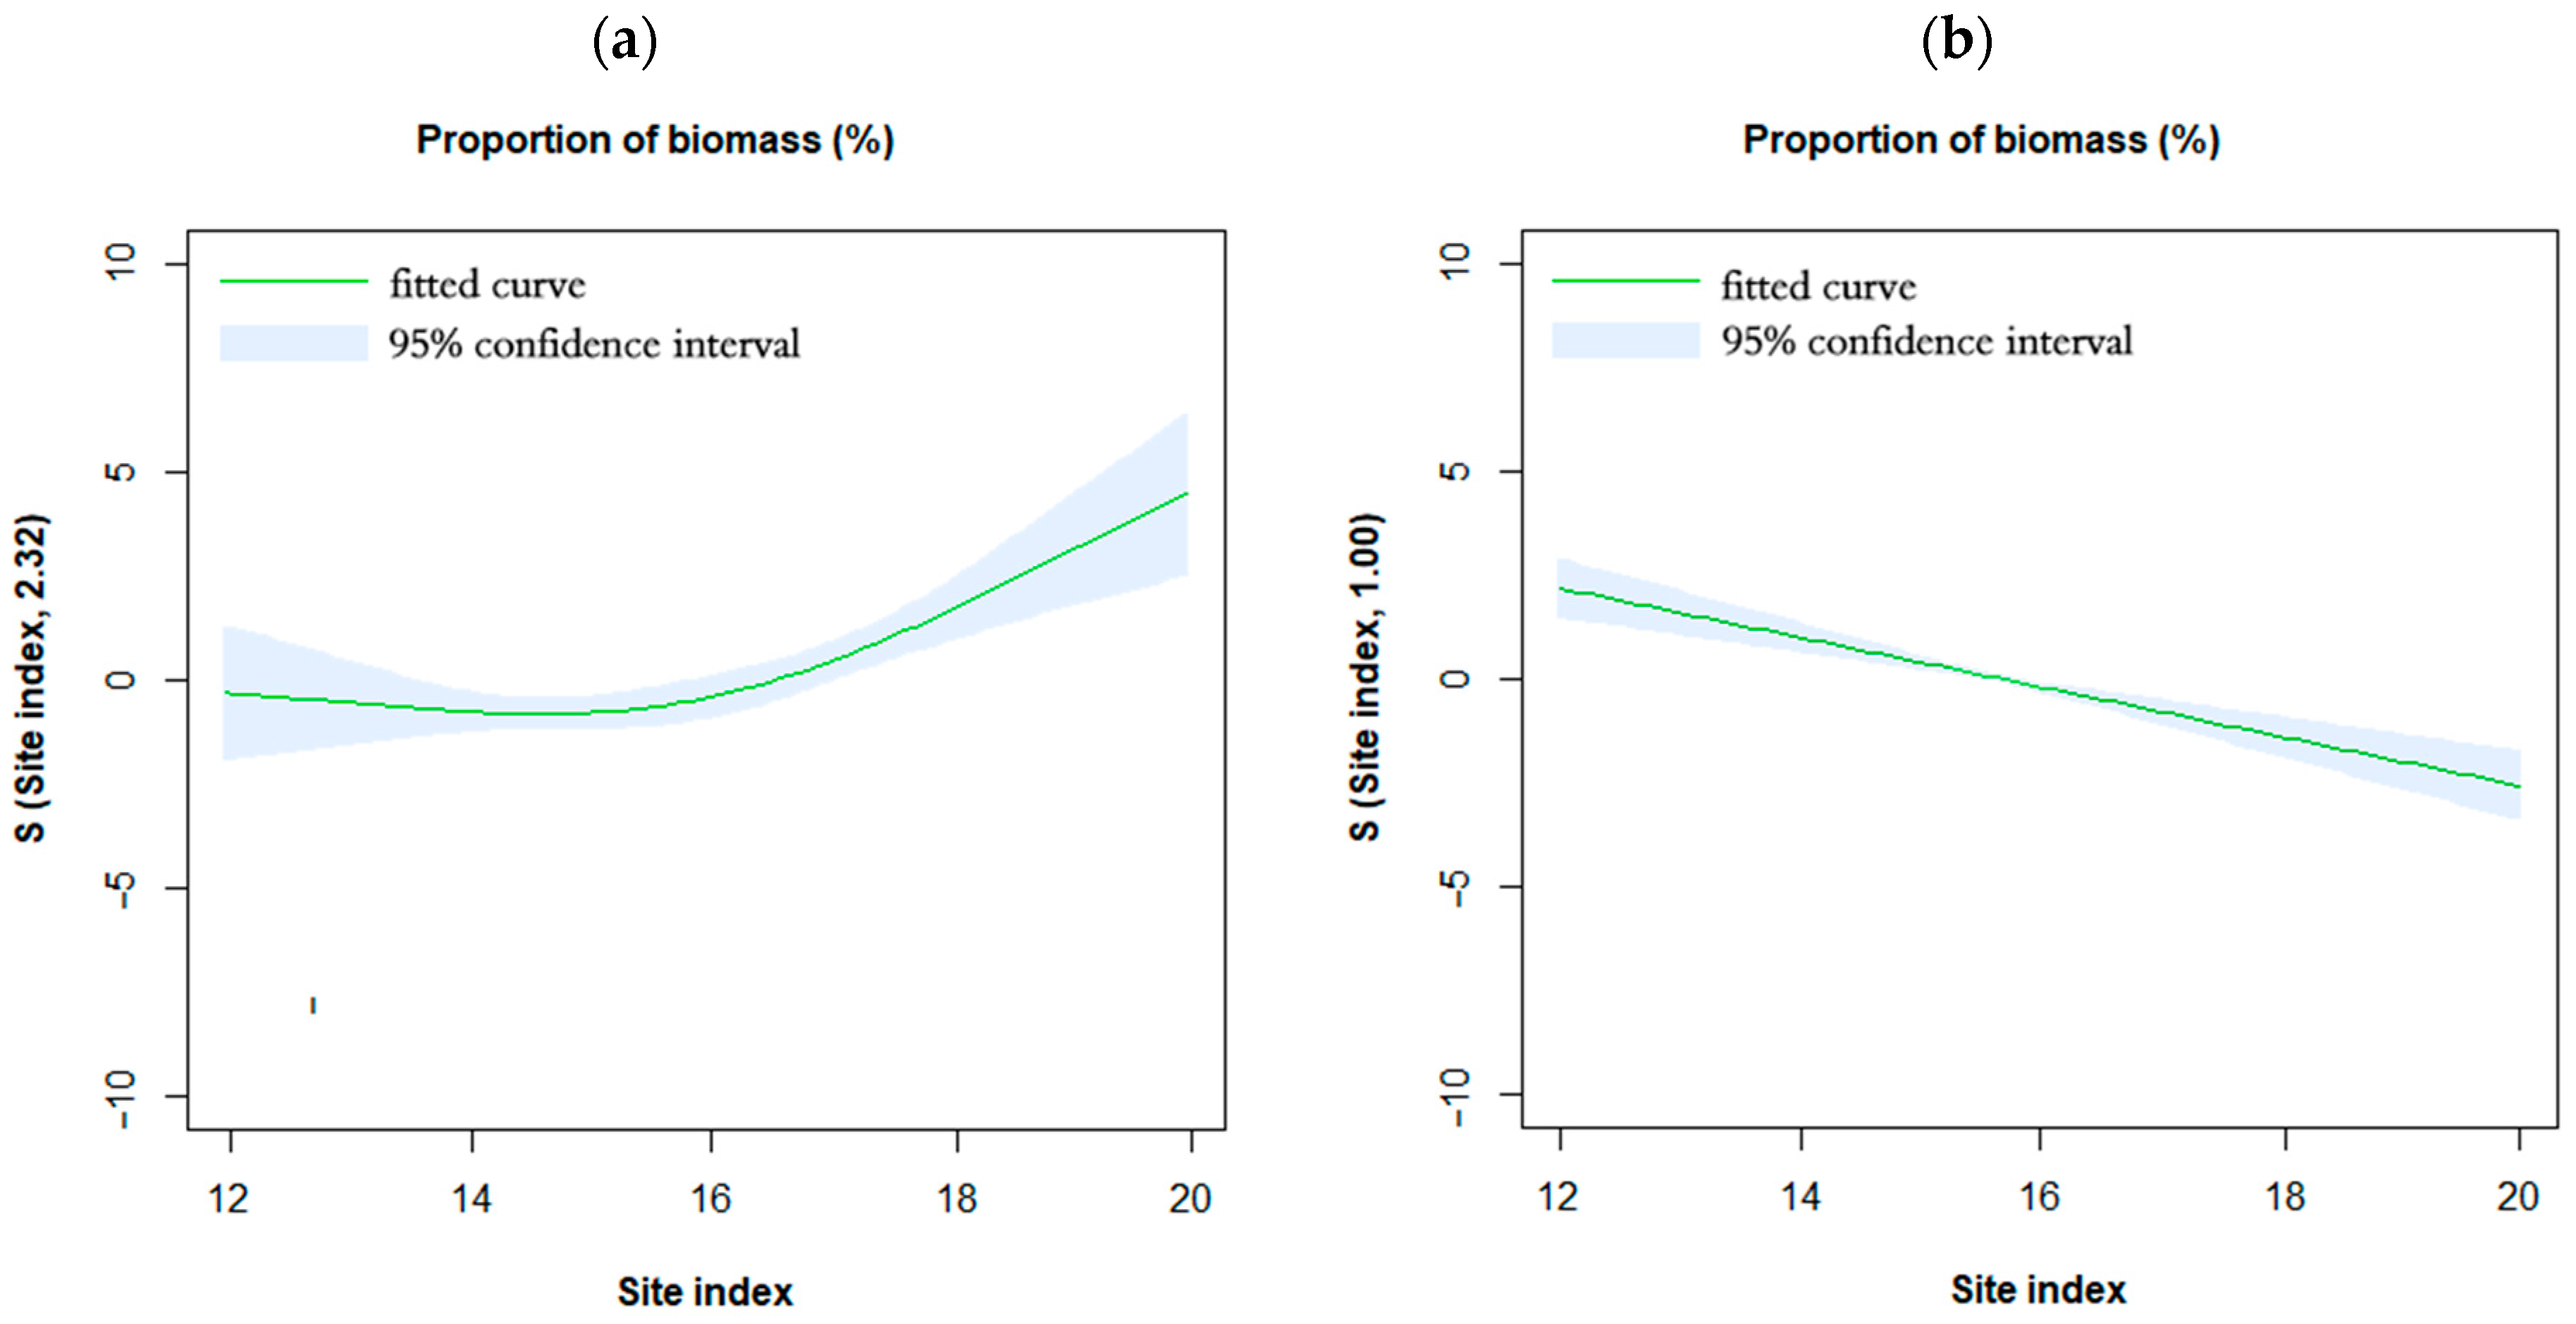
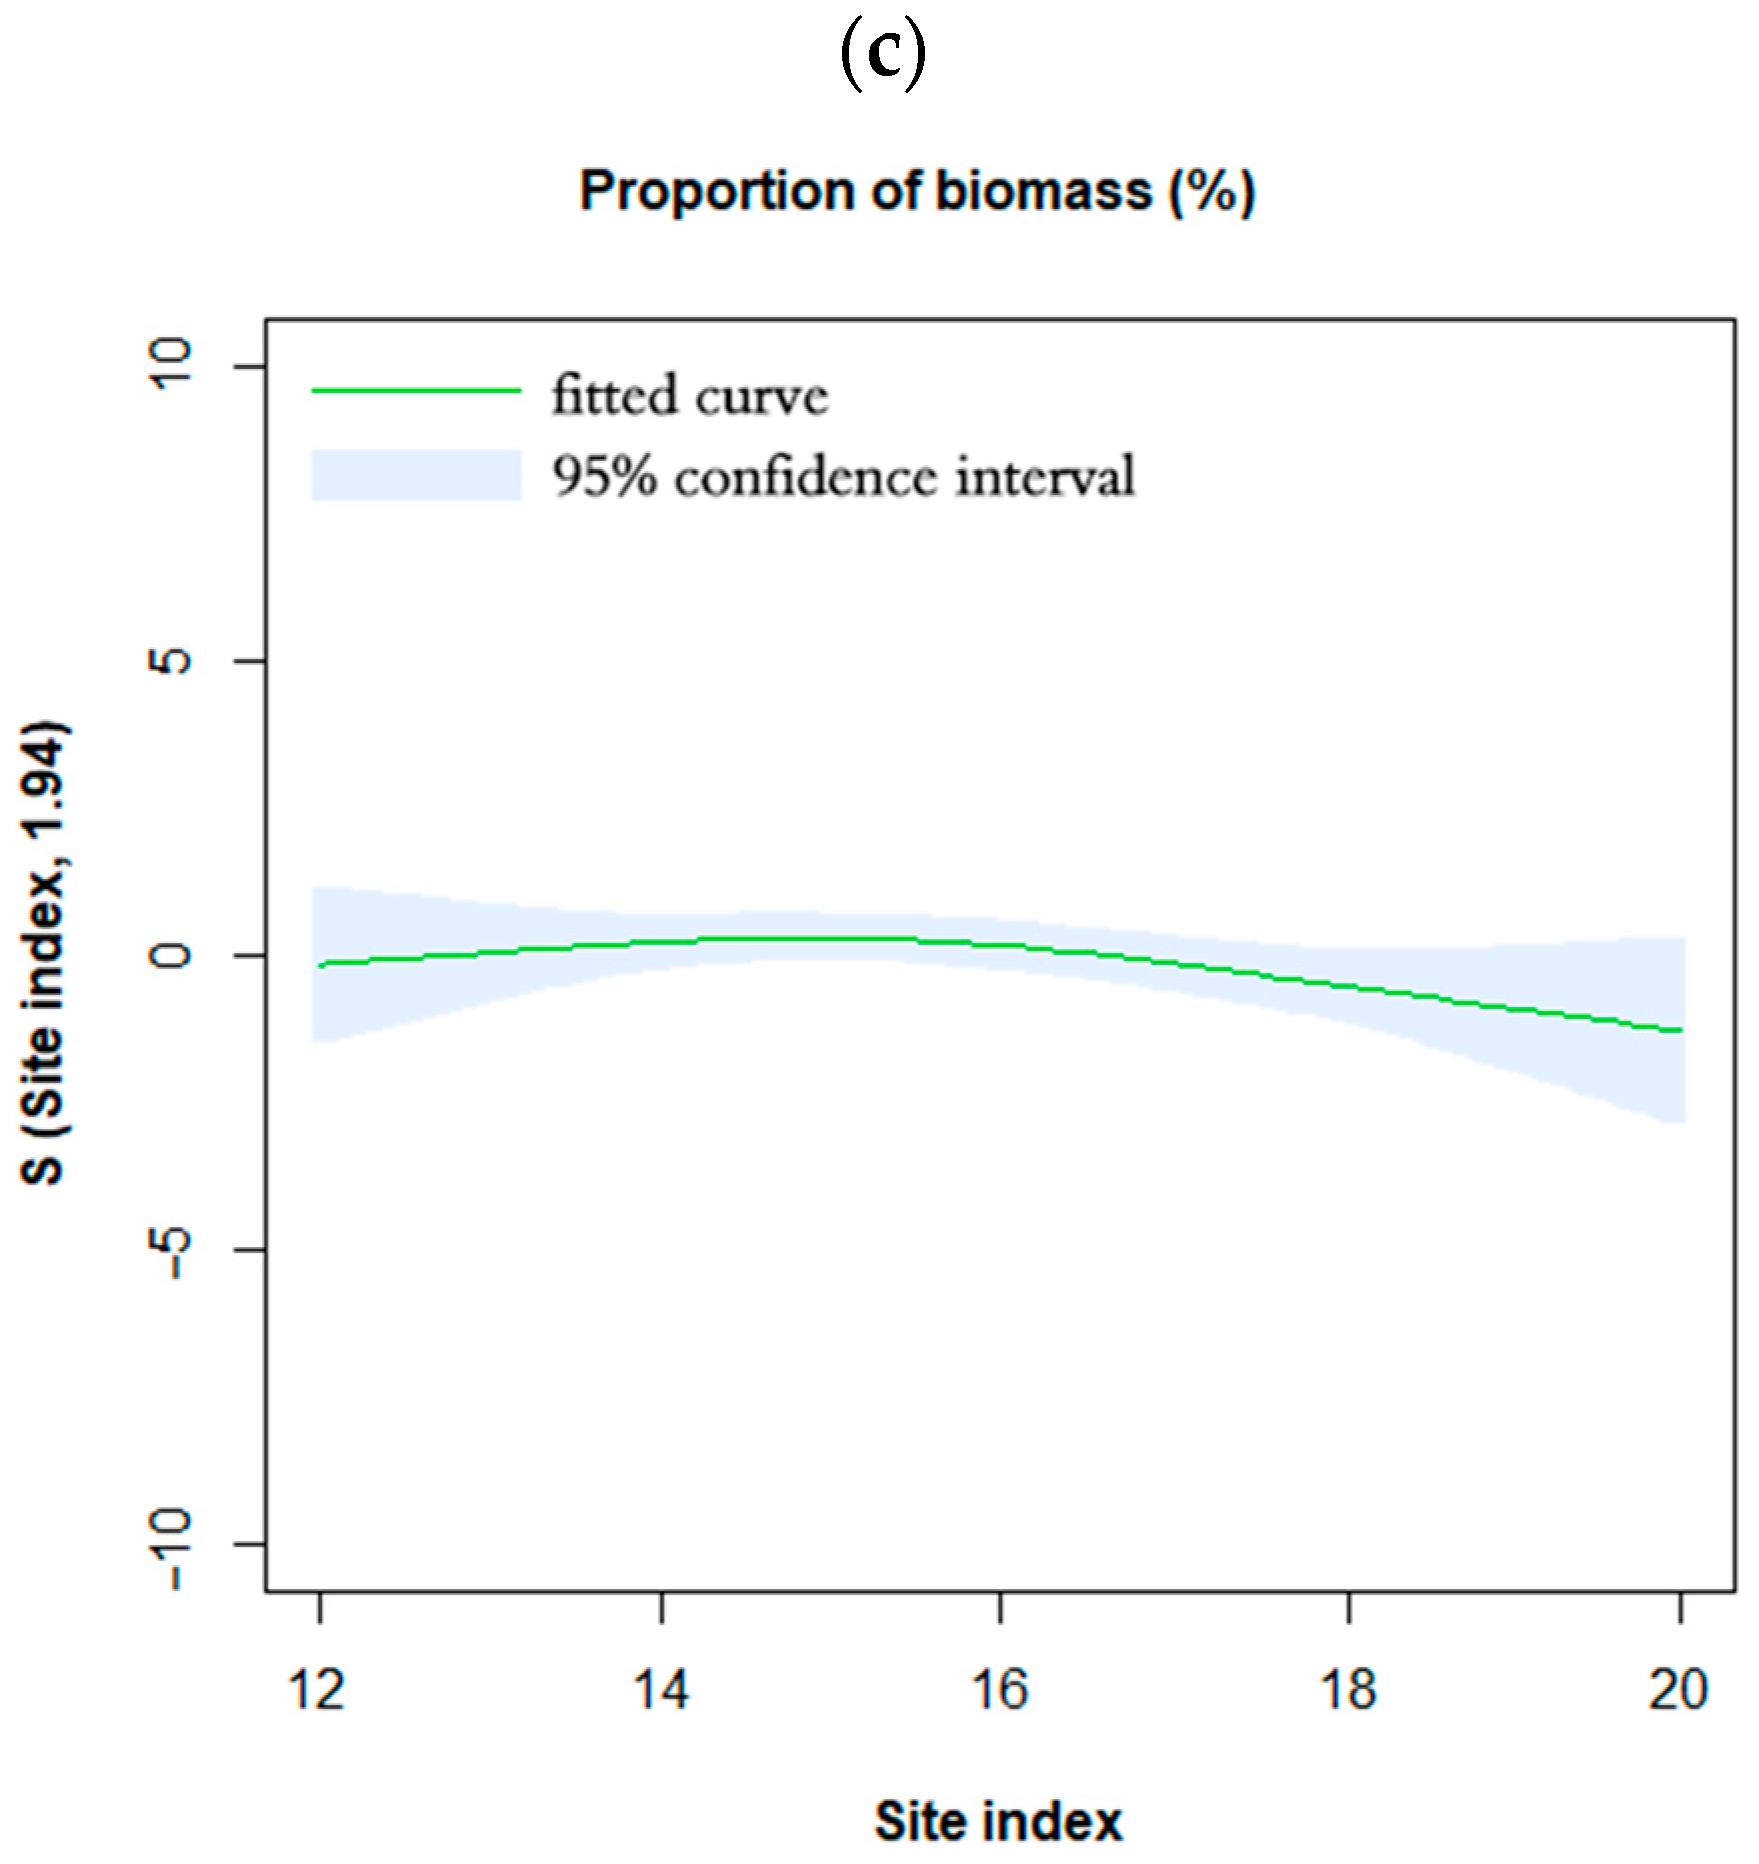
The proportion of stem biomass was influenced by site quality (p < 0.001). The fitting results of the generalized additive mixed models showed that the proportion of stem biomass was nonlinearly correlated with site quality and, to be more precise, the proportion of stem biomass decreased slightly with the increase in the site index when the site index was less than 16 and increased with the increase in site index when the site index was greater than 16 (Figure 4a). Site quality also had a significant effect on the proportion of bark biomass (p < 0.001) and branch biomass (p < 0.001). Significant linearities were observed among the proportion of bark biomass and site index (Figure 4b), and the proportion of bark biomass decreased with increasing site index. The proportion of branch biomass was nonlinearly correlated with the site index; it increased slightly with the increase in the site index when the site index was less than 16 and decreased with the increase in the site index when the site index was greater than 16 (Figure 4c).
Although the proportion of leaf biomass decreased gradually with increasing site index, there was no significant difference in the proportion of biomass of leaves between the different site indices (p > 0.1). In addition, although the proportion of root biomass increased gradually with increasing site index, there was also no significant difference in the proportion of biomass of roots between the different site indices (p > 0.1).

3.4. Interaction of Site Quality and Tree Age on Biomass Allocation

The results of variance analysis showed that the interaction of tree age and site quality had a significant effect on the proportion of stem biomass (p < 0.05) as well as on the proportion of root biomass (p < 0.05). As shown in Figure 5a, both tree age and site condition affected the proportion of stem biomass, but the influence of tree age was greater. The proportion of stem biomass increased with increasing tree age, and better site conditions could accelerate this trend. Although the proportion of root biomass was not significantly affected by site quality (p > 0.1), it was still affected by the interaction of site quality and tree age (Figure 5b). Before the trees mature, the influence of site quality and tree age on the proportion of root biomass was in the same direction; that is, better site conditions and greater age would increase the proportion of root biomass. After the trees mature, their influence on the proportion of root biomass was in the opposite direction; that is, better site conditions would increase the proportion of root biomass, while older age would reduce the proportion of root biomass.

4. Discussion

How trees allocate their biomass among stems, branches, leaves, barks and roots has important implications not only for their survival and growth but also for ecosystem carbon cycling [35]. Measuring the status of and change in forest biomass is critical to the establishment of forest management policies [4].
The share of biomass components varies across tree species [44]. The results of this study showed that stem biomass had the largest contribution to total tree biomass in all age groups of Chinese fir, which is consistent with some published studies related to Chinese fir [45,46] and other species [47,48]. The biomass proportion of other organs varied with forest age. In the young-stage forests, the permutation order of the biomass proportion of other organs was as follows: leaves, roots, branches and bark, whereas in the forests of other age groups, the sequence was as follows: roots, bark, branches and leaves. As far as the stem, its biomass was mainly concentrated in the lower part, accounting for approximately 60%, followed by the middle and upper parts, accounting for approximately 30% and 10%, respectively.
The biomass of total trees and each organ in Chinese fir all increased with forest growth and gradually reached a stable level after maturity, but the biomass proportion of different organs varied with time. Some existing studies indicated that stem biomass had constant relationships with total biomass [49]. However, this study showed that as the trees grew larger, the relative contribution of the stem to the total biomass increased, which agreed with many previous studies [29,45,47,48,50]. We found that the proportion of stem biomass increased nonlinearly with increasing tree age in an "S" curve similar to the growth process of tree diameter, which indicated that it was feasible to use diameter as an independent variable to predict stem biomass. When the stem was divided into upper, middle and lower parts, we found that the biomass proportion of the lower part decreased gradually, whereas the biomass proportion of the middle and upper parts increased gradually, which could be explained by the fact that the trees shifted their stem increment upwards and became more cylindrical and less tapered over time [51,52].
For other organs, the dynamics of their biomass proportions were relatively complex. For branches, it is generally believed that the biomass proportion decreases with stand age [29,47,48,53], but some researchers have shown the reverse conclusion [47,54]. Our study results support the former; additionally, we further revealed that the proportion of branch biomass decreases not linearly but nonlinearly with age. Stem biomass usually accumulates at the expense of leaf biomass [44,55], and most studies have indicated that leaf biomass proportion decreases with stand age or tree size [29,47,48,50,54,56]. We have observed the same conclusion. The leaf biomass proportion decreased with increasing tree age, which could be explained by the fact that leaves are grown on younger branches rather than on older branches, which implies that the leaf mass per unit branch mass decreases as trees grow larger [57]. However, some studies claimed that tree age and size had no significant effect on leaf biomass proportion [49,53]. For bark, some studies have shown that the biomass proportion decreases with increasing tree age [47], but others have observed that the proportion of its biomass decreases first, then increases, and then decreases with age [45]. In this study, the biomass proportion first decreased and then increased with increasing tree age, showing a slightly concave curve. These results indicate that the changes in the proportion of bark biomass are more complex, and the factors that cause these changes need to be further studied.
Belowground components are not often evaluated because it is very difficult, expensive and time-consuming to collect root biomass data, especially for large trees [36,58]. However, roots may account for a significant proportion of the whole tree biomass and carbon storage [59,60], which has essential effects on the biomass proportion of various organs of trees. Previous studies have shown that the biomass proportions of roots to total tree biomass decreased with stand age [34,48,53]. However, some studies have observed that its biomass proportion exhibited a slight increase with tree growth [50]. However, our research found that the proportion of root biomass increased with increasing age and then decreased gradually after the trees matured. Generally, the part below the ground from the cutting place is treated as roots, so the root usually contains part of the stem, and the root has more knots and higher density [61], which may be the reason why the proportion of root biomass increases with age.
In addition to tree age, the allocation pattern of forest biomass in different organs is also affected by the origin of forest [62], stand density [31,63], site conditions [34] and management activities [64]. Because the selected forests in this study were all plantations with the same or close initial planting density and the same management measures are used throughout the rotation period, this study only considered the influence of site quality on biomass distribution but did not consider the influence of stand density on biomass distribution. The results showed that site quality had significant effects on the biomass proportion of stems, branches and bark but had no significant effects on the biomass proportion of leaves and roots. According to the “optimal partitioning theory”, plants preferentially allocate biomass to organs that harvest the most limiting resource [65,66]. Some studies suggested that trees allocated more biomass to the stems and leaves in the fertile sites, while allocation to belowground components became more important in the barren site [58]. Our study showed that the proportion of stem biomass increased with an increasing site index when the site index was greater than 16, which is partly consistent with the optimal partitioning theory. However, the proportion of stem biomass decreased slightly with the increase in the site index when the site index was less than 16, which may be due to the fight result of light limiting and nutrients or water limiting [32,58]. The proportion of bark biomass linearly decreased with an increasing site index, which seems completely consistent with the optimal partitioning theory. This may indicate that water and nutrients are more abundant with the improvement of site quality, and trees can invest fewer resources for the carrier of water and nutrient transportation, namely barks. Contrary to the change in stem biomass proportion, the biomass proportion increased slightly with the increase in site index when the site index was less than 16 and decreased with the increase in site index when the site index was greater than 16.
Differences in biomass allocation may be explained by both the tree age and strategies of trees to maximize light, nutrient and water capture for survival in different site conditions [19,20,67]. Our results also showed that the interaction of tree age and site quality had a significant effect on the proportion of stem biomass as well as root biomass, which made the change dynamics of biomass allocation more complex. Site quality is defined by many factors, including altitude and temperature and the availability of water and nutrients [58], while biomass allocation involves the coordination among different organs, and their interrelationships and dynamics are complex. Therefore, more detailed research on the biomass allocation and temporal dynamics of specific tree species in different habitats is necessary.
Biomass is the basis of carbon storage. Since the collection of biomass data is time-consuming and laborious, the usual method is to estimate the biomass of the tree stem through some factors that are easily available such as diameter and tree height, and the biomass of other organs is calculated according to the stem biomass and the corresponding proportion coefficients [6]. For a given tree species, these proportional coefficients are often considered to be fixed [8]. However, our research showed that the ratio of the biomass of various organs to the total tree biomass was varied, and the ratio of the biomass of each organ to the biomass of the stem would also change accordingly, which was affected by tree age and site quality. Therefore, accurate estimation of forest biomass needs to consider the effect of forest age and site on the allocation patterns of tree biomass. In addition, the same coefficient is often used for the carbon content rate of various organs when estimating tree carbon storage by biomass, but in fact, the carbon content rates of different organs are different [68,69]. More accurate estimation of forest carbon storage should be the accumulation of carbon storage of each organ, which comes from the multiplication of their corresponding biomass and carbon content, and this study can provide a better insight into this method.

5. Conclusions

Comprehensively understanding the spatial allocation pattern and change dynamics of biomass in specific tree species is essential for establishing accurate estimation models of forest biomass and carbon storage, particularly against the vision of carbon peak and carbon neutralization. This study revealed the biomass allocation and its temporal dynamics of Chinese fir plantations, as well as the effect of site quality on them. The biomass proportion of various organs of Chinese fir varied nonlinearly with tree age. Therefore, the previous method of calculating the biomass of each organ through stem biomass and the constant conversion coefficient may increase the uncertainty and error for the estimation of forest biomass and carbon storage. Site quality also had a positive effect on the biomass proportion of stems, and a negative effect on the biomass proportion of branches and bark but had no significant effects on the biomass proportion of leaves and roots. Moreover, the interaction of tree age and site quality had a significant effect on the proportion of stem biomass as well as root biomass. Therefore, to obtain accurate estimates of Chinese fir forest biomass and carbon stocks, age-specific changes and the influence of site on it need to be considered. Our results are helpful to better understand the formation and change mechanism of forest biomass, therefore providing in-depth insights for more accurate biomass estimation model establishment and carbon stock determination.

Author Contributions

Conceptualization, C.D., Q.L. and F.M.; methodology, C.D. and Q.L.; software, C.D. and J.T.; validation, B.Z. and J.T.; formal analysis, X.X.and B.Z.; investigation, C.D., X.X. and B.Z.; resources, F.M. and J.T.; data curation, X.X.; writing—original draft preparation, C.D.; writing—review and editing, Q.L.; visualization, C.D. and X.X.; supervision, Q.L.; project administration, Q.L. and F.M.; funding acquisition, F.M. All authors have read and agreed to the published version of the manuscript.

Funding

This research was funded by the Comprehensive monitoring of forest and grass ecology-growth rate of main tree species (xczhz2022-09), the Forestry Science and Technology Innovation Fund Project of Hunan province (XLK202104-1), and the Hunan forestry engineering science and technology support project (ly2021-02).

Data Availability Statement

Not applicable.

Acknowledgments

We appreciate the staff of Five forest farm for their help during the field survey.

Conflicts of Interest

The authors declare that there are no conflict of interest.

References

  1. Miner, R.; Abt, R.; Bowyer, J.; Buford, M.; Malmsheimer, R.; O’Laughlin, J.; Oneil, E.; Sedjo, R.; Skog, K. Forest carbon accounting considerations in US bioenergy policy. J. For. 2014, 112, 591–606. [Google Scholar]
  2. Birdsey, R.; Pregitzer, K.; Lucier, A. Forest carbon management in the United States: 1600–2100. J. Environ. Qual. 2006, 35, 1461–1469. [Google Scholar] [CrossRef]
  3. Fang, J.; Chen, A.; Peng, C.; Zhao, S.; Ci, L. Changes in forest biomass carbon storage in China between 1949 and 1998. Science 2001, 292, 2320–2322. [Google Scholar] [CrossRef] [PubMed]
  4. McKinley, D.; Ryan, M.; Birdsey, R.; Giardina, C.; Harmon, M.; Heath, L.; Houghton, R.; Jackson, R.; Morrison, J.; Murray, B.; et al. A synthesis of current knowledge on forests and carbon storage in the United States. Ecol. Appl. 2011, 21, 1902–1924. [Google Scholar] [CrossRef] [PubMed]
  5. Lu, D. The potential and challenge of remote sensing-based biomass estimation. Int. J. Remote Sens. 2006, 27, 1297–1328. [Google Scholar] [CrossRef]
  6. Weiskittel, A.; MacFarlane, D.; Radtke, P.; Affleck, D.; Temesgen, H.; Woodall, C.; Westfall, J.; Coulston, J. A call to improve methods for estimating tree biomass for regional and national assessments. J. For. 2015, 113, 414–424. [Google Scholar] [CrossRef]
  7. Planck, N.; MacFarlane, D. A vertically integrated whole-tree biomass model. Trees-Struct. Funct. 2015, 29, 449–460. [Google Scholar] [CrossRef]
  8. Domke, G.; Woodall, C.; Smith, J.; Westfall, J.; McRoberts, R. Consequences of alternative tree-level biomass estimation procedures on U.S. forest carbon stock estimates. For. Ecol. Manag. 2012, 270, 108–116. [Google Scholar] [CrossRef]
  9. Le Toan, T.; Quegan, S.; Davidson, M.; Balzter, H.; Paillou, P.; Papathanassiou, K.; Plummer, S.; Rocca, F.; Saatchi, S.; Shugart, H.; et al. The biomass mission: Mapping global forest biomass to better understand the terrestrial carbon cycle. Remote Sens. Environ. 2011, 115, 2850–2860. [Google Scholar] [CrossRef]
  10. Fang, J.; Guo, Z.; Hu, H.; Kato, T.; Muraoka, H.; Son, Y. Forest biomass carbon sinks in East Asia, with special reference to the relative contributions of forest expansion and forest growth. Glob. Chang. Biol. 2014, 20, 2019–2030. [Google Scholar] [CrossRef]
  11. Kurz, W.A.; Beukema, S.J.; Apps, M.J. Estimation of root biomass and dynamics for the carbon budget model of the Canadian forest sector. Can. J. For. Res. 1996, 26, 1973–1979. [Google Scholar] [CrossRef]
  12. van Breugel, M.; Ransijn, J.; Craven, D.; Bongers, F.; Hall, J. Estimating carbon stock in secondary forests: Decisions and uncertainties associated with allometric biomass models. For. Ecol. Manag. 2011, 262, 1648–1657. [Google Scholar] [CrossRef]
  13. Rutishauser, E.; Noor’an, F.; Laumonier, Y.; Halperin, J.; Hergoualc’h, K.; Verchot, L. Generic allometric models including height best estimate forest biomass and carbon stocks in Indonesia. For. Ecol. Manag. 2013, 307, 219–225. [Google Scholar] [CrossRef]
  14. Ketterings, Q.M.; Coe, R.; van Noordwijk, M.; Ambagau’, Y.; Palm, C.A. Reducing uncertainty in the use of allometric biomass equations for predicting above-ground tree biomass in mixed secondary forests. For. Ecol. Manag. 2001, 146, 199–209. [Google Scholar] [CrossRef]
  15. Goodman, R.; Phillips, O.; Baker, T. The importance of crown dimensions to improve tropical tree biomass estimates. Ecol. Appl. 2014, 24, 680–698. [Google Scholar] [CrossRef] [PubMed]
  16. McTague, J.; Weiskittel, A. Evolution, history, and use of stem taper equations: A review of their development, application, and implementation. Can. J. For. Res. 2021, 51, 210–235. [Google Scholar] [CrossRef]
  17. Hame, T.; Salli, A.; Andersson, K.; Lohi, A. A new methodology for the estimation of biomass of coniferdominated boreal forest using NOAA AVHRR data. Int. J. Remote Sens. 1997, 18, 3211–3243. [Google Scholar] [CrossRef]
  18. Powell, S.; Cohen, W.; Kennedy, R.; Healey, S.; Huang, C. Observation of trends in biomass loss as a result of disturbance in the conterminous US: 1986–2004. Ecosystems 2014, 17, 142–157. [Google Scholar] [CrossRef]
  19. Liao, R.Y.; Wu, X.Q.; Jin, C.; Huang, L.; Qian, S.H.; Yang, Y.C. Effect of canopy condition on Machilus nanmu seedling configuration and biomass allocation. Chin. J. Appl. Ecol. 2021, 32, 2061–2069. (In Chinese) [Google Scholar]
  20. Potkay, A.; Trugman, A.; Wang, Y.; Venturas, M.; Anderegg, W.; Mattos, C.; Fan, Y. Coupled whole-tree optimality and xylem hydraulics explain dynamic biomass partitioning. New Phytol. 2021, 230, 2226–2245. [Google Scholar] [CrossRef]
  21. Agathokleous, E.; Belz, R.; Kitao, M.; Koike, T.; Calabrese, E. Does the root to shoot ratio show a hormetic response to stress? An ecological and environmental perspective. J. For. Res. 2019, 30, 1569–1580. [Google Scholar] [CrossRef]
  22. Poorter, H.; Niklas, K.; Reich, P.; Oleksyn, J.; Poot, P.; Mommer, L. Biomass allocation to leaves, stems and roots: Meta-analyses of interspecific variation and environmental control. New Phytol. 2012, 193, 30–50. [Google Scholar] [CrossRef] [PubMed]
  23. Brown, S.L.; Schroeder, P.; Kern, J.S. Spatial distribution of biomass in forests of the eastern USA. For. Ecol. Manag. 1999, 123, 81–90. [Google Scholar] [CrossRef]
  24. Rodriguez-Veiga, P.; Saatchi, S.; Tansey, K.; Balzter, H. Magnitude, spatial distribution and uncertainty of forest biomass stocks in Mexico. Remote Sens. Environ. 2016, 183, 265–281. [Google Scholar] [CrossRef]
  25. Mitchard, E.T.; Saatchi, S.S.; Baccini, A.; Asner, G.P.; Goetz, S.J.; Harris, N.L.; Brown, S. Uncertainty in the spatial distribution of tropical forest biomass: A comparison of pan-tropical maps. Carbon Balanc. Manag. 2013, 8, 10. [Google Scholar] [CrossRef]
  26. Verkerk, P.; Fitzgerald, J.; Datta, P.; Dees, M.; Hengeveld, G.; Lindner, M.; Zudin, S. Spatial distribution of the potential forest biomass availability in Europe. For. Ecosyst. 2019, 6, 5. [Google Scholar] [CrossRef]
  27. Pan, Y.; Birdsey, R.; Phillips, O.; Jackson, R. The structure, distribution, and biomass of the world’s forests. Annu. Rev. Ecol. Evol. Syst. 2013, 44, 593–622. [Google Scholar] [CrossRef]
  28. Poorter, H.; Jagodzinski, A.; Ruiz-Peinado, R.; Kuyah, S.; Luo, Y.; Oleksyn, J.; Usoltsev, V.; Buckley, T.; Reich, P.; Sack, L. How does biomass distribution change with size and differ among species? An analysis for 1200 plant species from five continents. New Phytol. 2015, 208, 736–749. [Google Scholar] [CrossRef]
  29. Hu, M.; Lehtonen, A.; Minunno, F.; Makela, A. Age effect on tree structure and biomass allocation in Scots pine (Pinus sylvestris L.) and Norway spruce (Picea abies [L.] Karst.). Ann. For. Sci. 2020, 77, 90. [Google Scholar] [CrossRef]
  30. Xiang, W.; Li, L.; Ouyang, S.; Xiao, W.; Zeng, L.; Chen, L.; Lei, P.; Deng, X.; Zeng, Y.; Fang, J.; et al. Effects of stand age on tree biomass partitioning and allometric equations in Chinese fir (Cunninghamia lanceolata) plantations. Eur. J. For. Res. 2021, 140, 317–332. [Google Scholar] [CrossRef]
  31. Wertz, B.; Bembenek, M.; Karaszewski, Z.; Ochal, W.; Skorupski, M.; Strzelinski, P.; Wegiel, A.; Mederski, P. Impact of stand density and tree social status on aboveground biomass allocation of Scots pine Pinus sylvestris L. Forests 2020, 11, 765. [Google Scholar] [CrossRef]
  32. Lu, D.; Wang, G.; Yan, Q.; Gao, T.; Zhu, J. Effects of gap size and within-gap position on seedling growth and biomass allocation: Is the gap partitioning hypothesis applicable to the temperate secondary forest ecosystems in Northeast China? For. Ecol. Manag. 2018, 429, 351–362. [Google Scholar] [CrossRef]
  33. Lie, Z.; Xue, L.; Jacobs, D. Allocation of forest biomass across broad precipitation gradients in China’s forests. Sci. Rep. 2018, 8, 10536. [Google Scholar] [CrossRef]
  34. Wang, X.; Huang, X.; Wang, Y.; Yu, P.; Guo, J. Impacts of site conditions and stand structure on the biomass allocation of single trees in Larch Plantations of Liupan Mountains of Northwest China. Forests 2022, 13, 177. [Google Scholar] [CrossRef]
  35. Jevon, F.; Lang, A. Tree biomass allocation differs by mycorrhizal association. Ecology 2022, 103, 6. [Google Scholar] [CrossRef] [PubMed]
  36. Zianis, D.; Muukkonen, P.; Mäkipää, R.; Mencuccini, M. Biomass and Stem Volume Equations for Tree Species in Europe; Tammer-Paino Oy: Tampere, Finland, 2005. [Google Scholar]
  37. Deng, C.; Zhang, S.; Lu, Y.; Li, Q. Determining the ecological compensation standard based on forest multifunction evaluation and financial net present value analysis: A case study in Southwestern Guangxi, China. J. Sustain. For. 2020, 39, 730–749. [Google Scholar] [CrossRef]
  38. Wang, Y.; Guo, C.; Chen, X.; Jia, L.; Guo, X.; Chen, R.; Zhang, M.; Chen, Z.; Wang, H. Carbon peak and carbon neutrality in China: Goals, implementation path and prospects. China Geol. 2021, 4, 720–746. [Google Scholar] [CrossRef]
  39. National Forestry and Grassland Administration. China Forest Resources Report; China Forestry Publishing House: Beijing, China, 2019. [Google Scholar]
  40. Wood, S.; Scheipl, F. gamm4: Generalized Additive Mixed Models Using “mgcv” and “lme4”. R Package Version 0.2-6. Available online: https://cran.r-project.org/web/packages/gamm4/index.html (accessed on 31 December 2022).
  41. Yang, Y.; Huang, S.; Vassov, R.; Pinno, B.; Chhin, S. Climate-sensitive height-age models for top height trees in natural and reclaimed oil sands stands in Alberta, Canada. Can. J. For. Res. 2020, 50, 297–307. [Google Scholar] [CrossRef]
  42. Lin, X.; Zhang, D. Inference in generalized additive mixed modelsby using smoothing splines. J. R. Stat. Soc. Ser. B-Stat. Methodol. 1999, 61, 381–400. [Google Scholar] [CrossRef]
  43. Groll, A.; Tutz, G. Regularization for generalized additive mixed models by likelihood-based boosting. Methods Inf. Med. 2012, 51, 168–177. [Google Scholar]
  44. Mensah, S.; Kakai, R.; Seifert, T. Patterns of biomass allocation between foliage and woody structure: The effects of tree size and specific functional traits. Ann. For. Res. 2016, 59, 49–60. [Google Scholar] [CrossRef]
  45. Tian, D.; Xiang, W.; Chen, X.; Yan, W.; Fang, X.; Kang, W.; Dan, X.; Peng, C.; Peng, Y. A long-term evaluation of biomass production in first and second rotations of Chinese fir plantations at the same site. Forests 2011, 84, 411–418. [Google Scholar] [CrossRef]
  46. Zhou, L.; Shalom, A.; Wu, P.; He, Z.; Liu, C.; Ma, X. Biomass production, nutrient cycling and distribution in age-sequence Chinese fir (Cunninghamia lanceolate) plantations in subtropical China. J. For. Res. 2016, 27, 357–368. [Google Scholar] [CrossRef]
  47. Meng, S.; Jia, Q.; Liu, Q.; Zhou, G.; Wang, H.; Yu, J. Aboveground biomass allocation and additive allometric models for natural Larix gmelinii in the western Daxing’anling Mountains, Northeastern China. Forests 2019, 10, 150. [Google Scholar] [CrossRef]
  48. Yang, B.; Xue, W.; Yu, S.; Zhou, J.; Zhang, W. Effects of stand age on biomass allocation and allometry of Quercus acutissima in the Central Loess Plateau of China. Forests 2019, 10, 41. [Google Scholar] [CrossRef]
  49. Peng, C.; Ai, W.; Qi, L.; Tu, J.; Meng, Y.; Yang, M.; Li, M. Cunninghamia lanceolata sprout population structure, dynamics and biomass allocation changes during Phyllostachys edulis expansion in middleo-southern China. Trees-Struct. Funct. 2022, 36, 1207–1218. [Google Scholar] [CrossRef]
  50. Xiang, W.; Liu, S.; Deng, X.; Shen, A.; Lei, X.; Tian, D.; Zhao, M.; Peng, C. General allometric equations and biomass allocation of Pinus massoniana trees on a regional scale in southern China. Ecol. Res. 2011, 26, 697–711. [Google Scholar] [CrossRef]
  51. Larson, P.R. Stem form development of forest trees. For. Sci. 1963, 9, 1–42. [Google Scholar] [CrossRef]
  52. Kohler, S.; Koehler, H.; Figueiredo, A.; Arce, J.; Machado, S. Evolution of tree stem taper in Pinus taeda stands. Cienc. Rural 2016, 46, 1185–1191. [Google Scholar] [CrossRef]
  53. Rather, S.A.; Qaisar, K.; Nabi, S.; Banyal, R.; Khan, P.; Islam, M. Biomass allocation and carbon stock in Elm (Ulmus Wallichiana Planch) plantation. Curr. World Environ. 2017, 12, 339–344. [Google Scholar] [CrossRef]
  54. Xu, Z.; Du, W.; Zhou, G.; Qin, L.; Meng, S.; Yu, J.; Sun, Z.; SiQing, B.; Liu, Q. Aboveground biomass allocation and additive allometric models of fifteen tree species in northeast China based on improved investigation methods. For. Ecol. Manag. 2022, 505, 119918. [Google Scholar] [CrossRef]
  55. Pajtik, J.; Konopka, B.; Lukac, M. Individual biomass factors for beech, oak and pine in Slovakia: A comparative study in young naturally regenerated stands. Trees-Struct. Funct. 2011, 25, 277–288. [Google Scholar] [CrossRef]
  56. Konopka, B.; Pajtik, J.; Seben, V.; Surovy, P.; Merganicova, K. Biomass allocation into woody parts and foliage in young common aspen (Populus tremula L.)-trees and a stand-level study in the Western Carpathians. Forests 2020, 11, 464. [Google Scholar] [CrossRef] [Green Version]
  57. Dimobe, K.; Mensah, S.; Goetze, D.; Ouedraogo, A.; Kuyahf, S.; Porembski, S.; Thiombiano, A. Aboveground biomass partitioning and additive models for Combretum glutinosum and Terminalia laxiflora in West Africa. Biomass Bioenerg. 2018, 115, 151–159. [Google Scholar] [CrossRef]
  58. Veronica, G.; Luis, P.; Gerardo, R. Allometric relations for biomass partitioning of Nothofagus antarctica trees of different crown classes over a site quality gradient. For. Ecol. Manag. 2010, 259, 1118–1126. [Google Scholar]
  59. Cairns, M.A.; Brown, S.; Helmer, E.H.; Baumgardner, G.A. Root biomass allocation in the world’s upland forests. Oecologia 1997, 111, 1–11. [Google Scholar] [CrossRef]
  60. Peichl, M.; Arain, M. Allometry and partitioning of above- and belowground tree biomass in an age-sequence of white pine forests. For. Ecol. Manag. 2007, 253, 68–80. [Google Scholar] [CrossRef]
  61. Billard, A.; Bauer, R.; Mothe, F.; Jonard, M.; Colin, F.; Longuetaud, F. Improving aboveground biomass estimates by taking into account density variations between tree components. Ann. For. Sci. 2020, 77, 103. [Google Scholar] [CrossRef]
  62. Baishya, R.; Barik, S.; Upadhaya, K. Distribution pattern of aboveground biomass in natural and plantation forests of humid tropics in northeast India. Trop. Ecol. 2009, 50, 295–304. [Google Scholar]
  63. Dicus, C.; Dean, T.J. Stand density effects on biomass allocation patterns and subsequent soil nitrogen demand. In Proceedings of the Ninth Biennial Southern Silvilcultural Research Conference, Clemson, SC, USA, 25–27 February 1997; p. 564. [Google Scholar]
  64. He, Y.; Xi, B.; Bloomberg, M.; Jia, L.; Zhao, D. Effects of drip irrigation and nitrogen fertigation on stand growth and biomass allocation in young triploid Populus tomentosa plantations. For. Ecol. Manag. 2020, 461, 1–8. [Google Scholar] [CrossRef]
  65. Thornley, J.H.M. A balanced quantitative model for root: Shoot ratios in vegetative plants. Ann. Bot. 1972, 36, 431–441. [Google Scholar] [CrossRef]
  66. Bloom, A.J.; Chapin, F.S.; Mooney, H.A. Resource limitation in plants—An economic analogy. Annu. Rev. Ecol. Syst. 1985, 16, 363–392. [Google Scholar] [CrossRef]
  67. Morote, F.; Serrano, F.; Andres, M.; Rubio, E.; Jimenez, J.; de las Heras, J. Allometries, biomass stocks and biomass allocation in the thermophilic Spanish juniper woodlands of Southern Spain. For. Ecol. Manag. 2012, 270, 85–93. [Google Scholar] [CrossRef]
  68. Thomas, S.C.; Martin, A.R. Carbon Content of Tree Tissues: A Synthesis. Forests 2012, 3, 332–352. [Google Scholar] [CrossRef]
  69. Ma, S.; He, F.; Tian, D.; Zou, D.; Yan, Z.; Yang, Y.; Zhou, T.; Huang, K.; Shen, H.; Fang, J. Variations and determinants of carbon content in plants: A global synthesis. Biogeosciences 2018, 15, 693–702. [Google Scholar] [CrossRef] [Green Version]
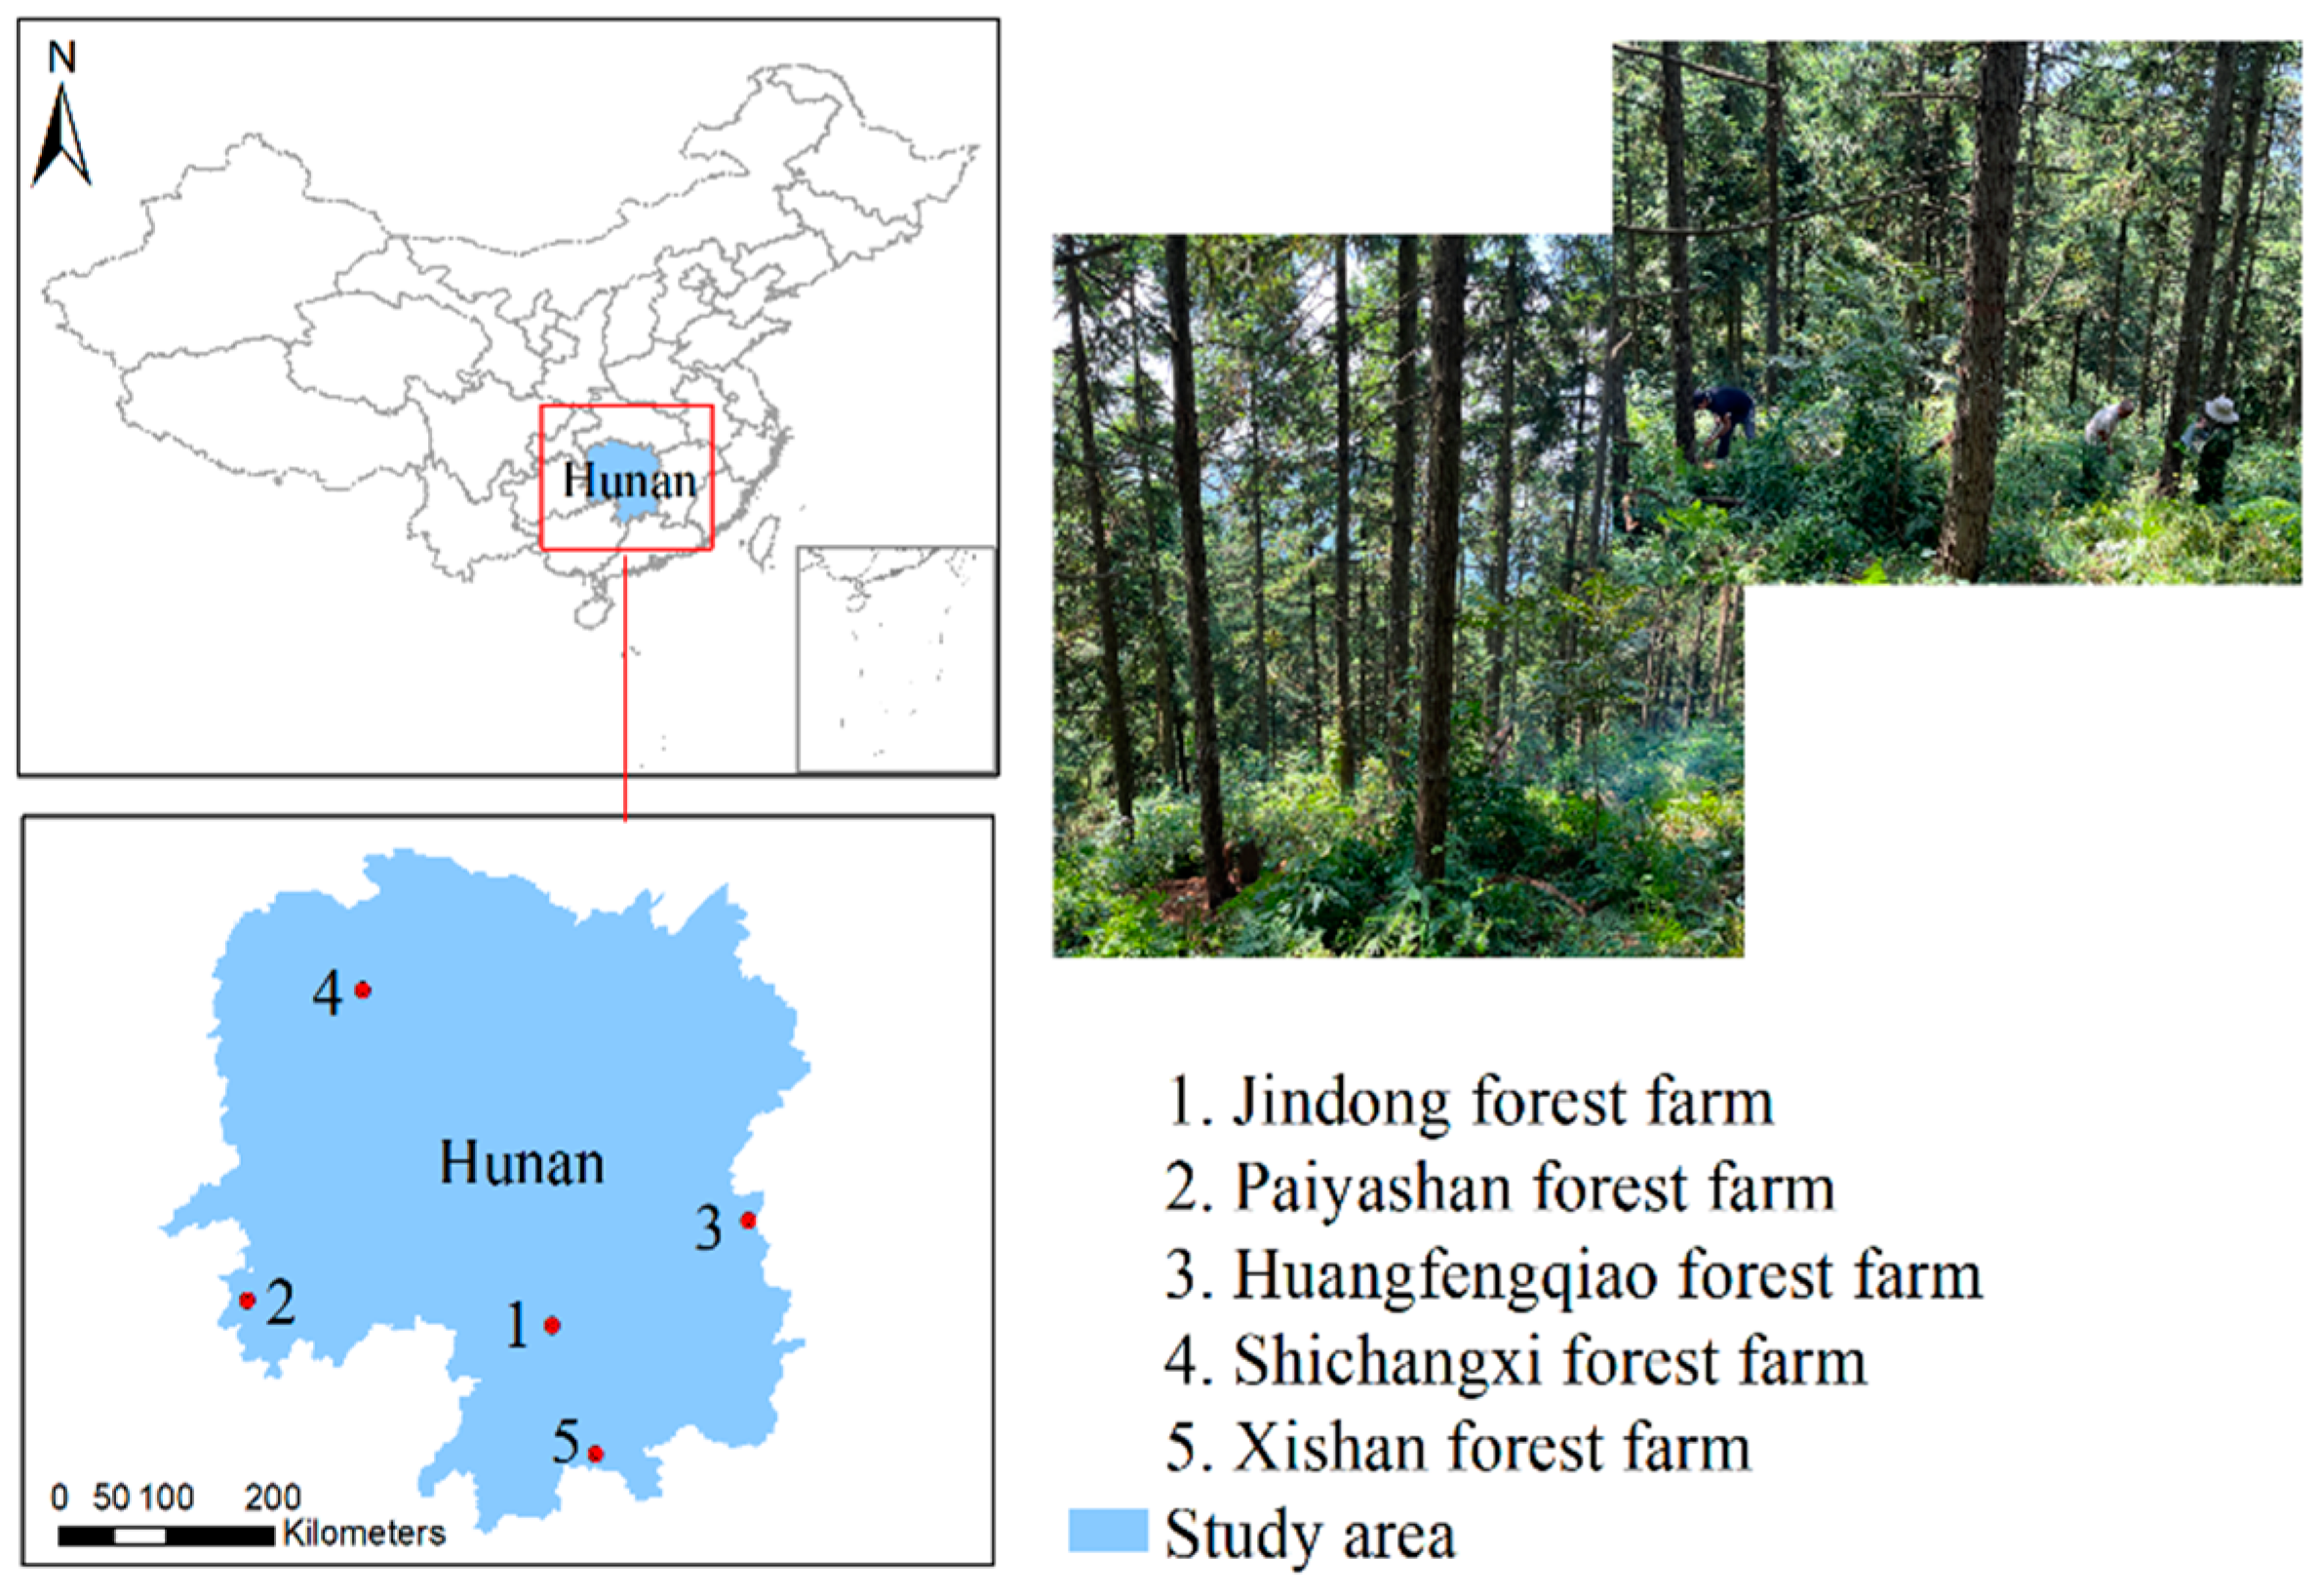
Figure 1. Locations of the temporary observation sample plots.
Forests 14 00286 g001
Figure 2. The proportion of biomass of different parts of stems in different age groups of Chinese fir.
Forests 14 00286 g002
Figure 3. The change trend of the proportion of biomass for various organs with tree age in Chinese fir. (a) Stem, (b) branches, (c) leaves, (d) roots, and (e) bark.
Forests 14 00286 g003aForests 14 00286 g003b
Figure 4. Observed effects of site quality on the proportion of biomass of different tree organs in GAMM. (a) Stem, (b) bark, and (c) branches. The S () of the vertical axis represents the smooth spline functions; The numbers in brackets represent the estimated degrees of freedom with smooth spline functions, 1 represents linearity, greater than 1 represents nonlinearity, and the larger the number, the stronger the nonlinearity.
Forests 14 00286 g004aForests 14 00286 g004b
Figure 5. Observed proportion of biomass of stems and roots with site index and time interactions by GAMM. (a) Represents stems, (b) represents roots.
Forests 14 00286 g005
Table 1. Stand characteristics from temporary plots established in 5 Chinese fir plantations in Hunan province.
Sampling Forest FarmPlot No.Stand Age (a)Age GroupSite IndexMean Diameter at Breast Height (cm)Average Total Tree Height (m)Stand Density (Stems/ha)
JingdongJD-18I148.36.43250
JD-217II1412.110.82550
JD-325III1619151200
JD-427IV1820.417.41175
JD-531IV1214.912.21675
JD-640V1419.916.5950
PaiyashanPYS-118II2018.417.21875
PYS-221III1211.99.92025
PYS-324III121711.81350
PYS-428IV1415.812.91475
PYS-529IV2027.720.4800
PYS-636V1624191150
PYS-739V2025.223975
HuangfengqiaoHFQ-114II1411.492650
HFQ-218II1616.212.52125
HFQ-324III1822.517.91200
HFQ-424III1822.2161325
HFQ-533IV1622.318.7900
ShichangxiSCX-18I127.96.13350
SCX-213II1614.810.32700
SCX-317II1617.211.82175
SCX-423III1619.813.31325
SCX-527IV182516.7925
SCX-631IV1827.217.91075
XishanXS-19I128.56.42850
XS-213II121182750
XS-321III182214.71150
XS-431IV1421.814.6950
XS-539V142214.7825
I represents young stage (≤10 years); II, middle stage (11–20 years); III, near mature (21–25 years); IV, mature (26–35 years); V, over mature (≥36 years). Site index was represented by stand dominant height at a given base age of 20 years.
Table 2. Sample tree characteristics of temporary plots of Chinese fir plantation.
Age GroupNumber
of Sample Trees
Diameter Classes Range (cm)Quadratic Mean Diameter (cm)Average Total Tree Height (m)Average Biomass (kg)
Total TreeStemBranchLeafBarkRoot
I98–128.16.111.885.101.462.291.271.77
II218–2014.411.655.4529.255.264.425.8110.71
III2112–2619.214.2107.2760.308.876.749.3821.97
IV2414–3221.916.8180.90103.3713.249.8017.6236.87
V1218–2622.717.6171.29104.119.886.4716.3734.46
Total876–3218.413.9114.0465.028.586.5310.9223.00
I represents young stage; II, middle stage; III, near mature; IV, mature; V, over mature.
Table 3. Proportion (%) of biomass of various organs in different age groups of Chinese fir.
Age GroupTotal TreeStemLower Part of StemMiddle Part of StemUpper Part of StemBranchLeafBarkRoot
I100.0043.6128.7711.882.9611.9518.4510.8715.12
II100.0052.4731.7716.474.249.508.1810.8918.96
III100.0055.5932.5918.334.678.376.379.2120.46
IV100.0057.0833.3718.934.777.095.2610.1720.41
V100.0059.9434.3020.245.406.063.8810.2619.85
Total100.0054.6132.4417.654.528.347.4110.2019.45
I represents young stage; II, middle stage; III, near mature; IV, mature; V, over mature.
Disclaimer/Publisher’s Note: The statements, opinions and data contained in all publications are solely those of the individual author(s) and contributor(s) and not of MDPI and/or the editor(s). MDPI and/or the editor(s) disclaim responsibility for any injury to people or property resulting from any ideas, methods, instructions or products referred to in the content.