Article

Spatial and Temporal Changes in Vegetation Cover in the Three North Protection Forest Project Area Supported by GEE Cloud Platform

1
National Key Laboratory of Remote Sensing Information and Imagery Analyzing Technology, Beijing Research Institute of Uranium Geology, Beijing 100029, China
2
Department of Geography, School of Arts and Sciences, National University of Mongolia, Ulaanbaatar 14200, Mongolia
3
Baotou Normal College, Inner Mongolia University of Science & Technology, Baotou 014030, China
4
Guangdong Provincial Key Laboratory of Water Quality Improvement and Ecological Restoration for Watersheds, Institute of Environmental and Ecological Engineering, Guangdong University of Technology, Guangzhou 510006, China
5
Aerospace Information Research Institute, Chinese Academy of Sciences, Beijing 100094, China
6
Precision Forestry Key Laboratory of Beijing, Beijing Forestry University, Beijing 100083, China
7
School of Geography and Tourism, Anhui Normal University, Wuhu 241000, China
8
School of Computer and Information Engineering, Chuzhou University, Chuzhou 239000, China
*
Author to whom correspondence should be addressed.
These authors contributed equally to this work.
Forests 2023, 14(2), 295; https://doi.org/10.3390/f14020295
Submission received: 27 December 2022 / Revised: 19 January 2023 / Accepted: 31 January 2023 / Published: 3 February 2023
(This article belongs to the Section Forest Inventory, Modeling and Remote Sensing)

Abstract

:
The alterations in vegetation cover in the Three North Protection Forest Project area influence its ecological and environmental management. It helps to study soil erosion, environmental change, and ecosystem protection to provide basic data support. Based on the Google Earth Engine cloud platform, this paper selects MODIS 3Q1 data from 2000–2020 and uses the image element dichotomous model to estimate the fractional vegetation cover (FVC) of the Three North Protection Forest Project area, evaluates the stability and temporal and spatial variation of FVC, investigates the coupling relationship between the FVC and temperature and rainfall through evaluation indexes such as the slope of inter-annual variation and partial correlation coefficient, and then analyzes the influence of land use changes on the FVC. The results show that the fractional vegetation cover of the Three North Protection Forest Project area as a whole has increased significantly over the past 20 years, the medium and high vegetation coverage areas have reached 36.4%, the high vegetation FVC has increased from 20.66% in 2000 to 21.59% in 2020, and the vegetation activity is increasing. The vegetation cover is significantly affected by the topographic effect, with the vegetation cover improving relatively well at slopes between 5–13° and elevations ranging from 2000–2500 m. The overall positive correlation between vegetation and temperature and vegetation and precipitation in the study area was 54.08% and 70.04%, respectively, and precipitation was the key factor influencing vegetation growth in the research region. Human activities have a stronger effect on vegetation construction than destruction, and this study contributes to the evaluation of the benefits of the Three North Protection Forest Project and the understanding of human influence on environmental change.

1. Introduction

Land degradation harms food security, biodiversity, environmental carrying capacity, and human survival and development, and has become one of the most serious environmental concerns on Earth [1,2,3]. China is one of the countries with the worst land degradation, and this is most evident in the three northern regions of China (Northwestern China, Northeastern China, and North China) [4]. In this context, the Three North Protection Forest System’s construction project was carried out by the Chinese government. It is also known as “the world’s most ecological project”, which has produced important social, economic, and ecological benefits. As the Great Green Wall in northern China, the vegetation is a monitor of human actions and climate change [5]. It is important to understand the spatial patterns and time series changes in vegetation in the Three North Protection Forest Project areas in time to grasp their engineering benefits and scientific management.
Vegetation cover is one of the significant monitoring indicators reflecting the strengths and weaknesses of regional ecosystems and the environment, and is of great significance in research fields such as ecological security and regional environmental change [6]. In the past, ground measurements were the most important method for monitoring vegetation cover [7] and were divided into sampling, instrumentation, and modeling methods [8]. This method is susceptible to the impact of human factors and instruments, and cannot meet the requirements of monitoring vegetation cover on a large scale [9].
Remote sensing, on the other hand, can be applied in large and multi-scale situations, and benefits from strong temporal and spatial continuity, which means it can estimate the surface vegetation cover over different time periods [10]. According to the principles and methods of remote sensing, the models for vegetation cover estimation are mainly divided into the image element decomposition model method, regression model method, and vegetation index method [11].
The regression model method is simple and easy to use but can only be used for specific vegetation types in specific areas, and the vegetation index method can be extended to a large area but has limitations in accuracy [12]. The most commonly used mixed image decomposition model is the image dichotomous model. Based on the NDVI data, the method of estimating vegetation cover using an image dichotomous model works well and there are many results [13,14]. Traditional methods of studying changing vegetation cover are mainly based on transfer matrices which do not provide a quantitative and systematic process of change, such as the meta-dichotomous method which has obvious advantages [15]. This is currently the most common method for estimating vegetation cover, and the meta-dichotomous method is mostly used to construct vegetation cover extraction models from satellite remote sensing imagery in combination with vegetation indices, without the need for real data. MODIS data, because of its high temporal resolution and easy accessibility, has become a major source of data for vegetation change studies and is increasingly used in vegetation cover extraction and vegetation monitoring [16,17,18]. In particular, MODIS data have very good advantages at large spatial scales and are used for vegetation monitoring at large regional and even national scales [17,19].
Cloud processing systems (for instance, Google Earth Engine (GEE)) which provide access to EO datasets worldwide free of charge [20], are an effective tool for monitoring vegetation dynamics [21]. The GEE has been used for measuring rapid changes in vegetation cover due to wildfires and for burn area mapping and the monitoring of vegetation recovery [22]. The GEE platform is the world’s most advanced PB-scale geographic information processing, analysis, and visualization platform, which can improve work efficiency efficiently with the help of cloud computing [23,24]. To this end, this paper focuses on the following three aspects of research based on the GEE platform:
(i) Vegetation cover inversion using the like-element dichotomous model method based on the GEE platform.
(ii) Studying the trend in vegetation cover change in the Three North Protection Forest Project area from 2000 to 2020 and the evolution pattern. The statistical analysis was also overlaid with each terrain factor to reveal the distribution characteristics of its vegetation cover changes on different terrain factors.
(iii) Analyzing the influencing factors on vegetation cover alteration in the Three North Protection Forest Project area as well as providing data support and decision reference for ecological environmental protection and vegetation restoration in the Three North Protection Forest Project area.

2. Materials and Methods
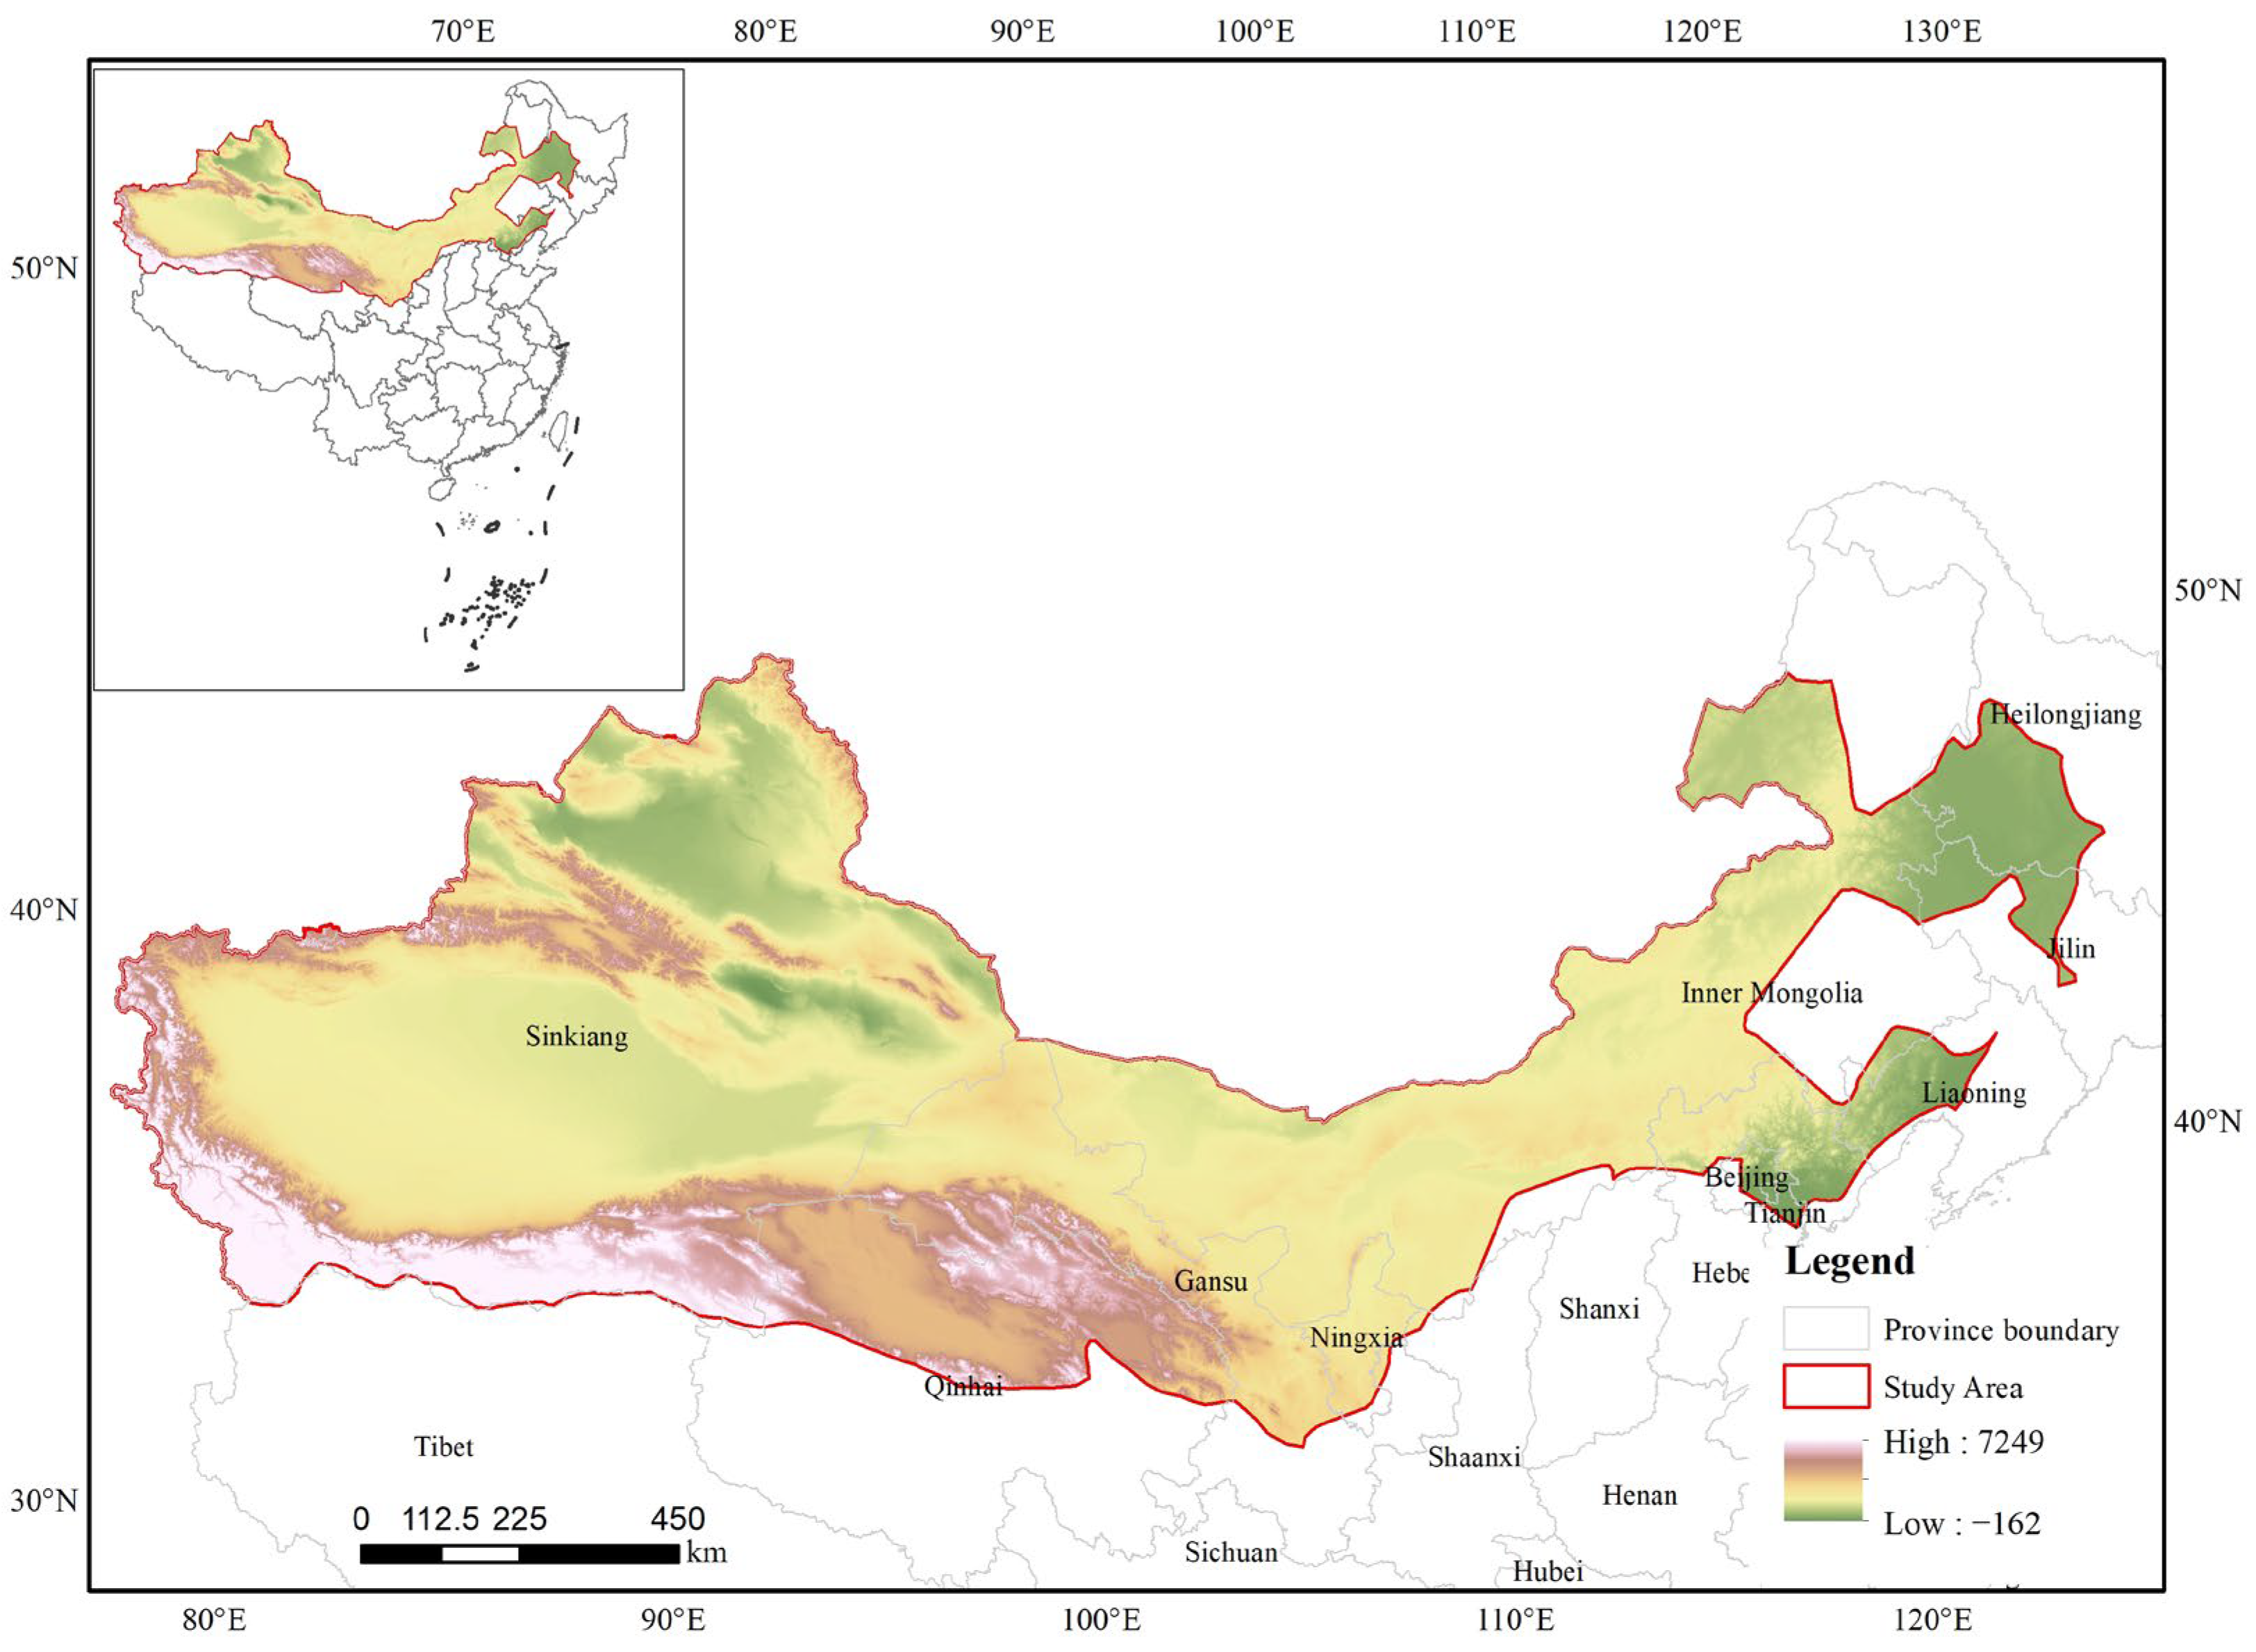
2.1. The Study Area

The geographical location of the Three North Protection Forest Project area is between 73°26′~127°50′ E and 33°30′~50°12′ N, including 13 provinces (autonomous regions and municipalities directly under the central government) with a total area of 406.9 × 10⁴ km2 [25]. The topography is high in the west and low in the east, dominated by plateaus and hills, most of which belong to arid and semi-arid climate zones with long hours of sunlight and low and concentrated rainfall [26]. The vast majority of China’s deserts and deserted lands are located in the Three North Protection Forest Project area, where droughts and floods are frequently experienced, and the ecological condition is delicate due to the lack of forest regulation [26]. The soil in the Three North Protection Forest Project area is generally infertile and desertification is serious [27], with low annual precipitation which decreases from east to west and from south to north [28]. The main vegetation types are forest, grassland, and desert [29]. Details of the study area are shown in Figure 1.

2.2. Data Sources

MODIS 3Q1 with a temporal resolution of 16 d and a spatial resolution of 250 m, derived from the GEE platform (https://developers.google.com, accessed on 5 September 2022), was used for the calculation of bi-directional atmospheric surface reflectance corrected for the presence of water, clouds, heavy aerosols, and cloud shadow masking, allowing for high data reliability [30].
Temperature data were obtained from [31], and precipitation data were obtained from [32]. The 2000–2020 land use data and digital elevation model(DEM)data were acquired from the Center for Resources and Environment, Chinese Academy of Sciences (http://www.resdc.cn, accessed on 5 September 2022). The resolution was 1 km, which was based on Landsat series images and manually interpreted visually, and the accuracy of the first class was over 90% after sampling [33,34].

2.3. Research Method

2.3.1. Vegetation Coverage Calculation

The image dichotomous model assumes that the information contained in an image element is only vegetation and bare soil, and the reflectance value of any image element can be expressed as a linearly weighted sum of the vegetation cover and non-vegetation cover parts [35]:
N D V I t o t a l = N D V I v e g × F V C + N D V I n o n × ( 1 F V C )
where N D V I t o t a l represents the N D V I of mixed image elements; N D V I v e g and N D V I n o n represent the N D V I of vegetation end elements and non-vegetation end elements, respectively; and F V C represents the vegetation coverage.
According to the principle of the image dichotomous model, we can represent the N D V I value of 1 image element in the form of a surface consisting of a vegetation cover part and a non-vegetation cover part. Therefore, the formula for calculating the vegetation cover can be expressed again as [36]:
F V C = N D V I t o t a l N D V I n o n N D V I v e g N D V I n o n
since N D V I n o n cannot be equal to the theoretical 0 due to the influence of atmospheric, soil, and light conditions. In order to make the estimation results more objective, the index values were not artificially selected as minimum and maximum values for fully bare land or fully vegetated areas [37]. According to the characteristics of the study area in the Sanbei project area and previous studies [38,39], we selected the values that corresponded to 5% and 95% of N D V I ’s cumulative frequency as the F V C for each month of the year, and this method proved to be valid, with a high degree of authenticity and reliability.

2.3.2. Trend Analysis

The trend in vegetation cover based on image elements was obtained using a one-dimensional linear regression analysis [40]:
θ s l o p e = n k = 1 j j * F V C k k = 1 j j k = 1 j F V C k k = 1 j j 2 ( k = 1 j j ) 2
where θ s l o p e denotes the slope value, F V C k denotes the vegetation cover in year k, and j denotes the year of observation. θ s l o p e > 0 indicates an increase in vegetation and vice versa. Less than −0.005 represents a significant decrease; −0.005~−0.002 represents a mild decrease; −0.002~0.002 means essentially unchanged; 0.002~0.005 represents a slight increase; and greater than 0.005 represents a significant increase.

2.3.3. Analysis Related to Climatic Factors

In order to explore the relationship between climatic factors and vegetation characteristics in the Three North Protection Forest Project area, 21 years of vegetation data were selected by this paper to analyze the relationship between meteorological factors and vegetation cover with the following equation [41]:
R x y = i = 1 n [ ( x i x ¯ ) ( y i y ¯ ) ] i = 1 n ( x x ¯ ) 2 i = 1 n ( y y ¯ ) 2
where R x y is the correlation coefficient; n is the number of years in the study period; and x and y are the two variables x ¯ and y ¯ used for correlation analysis, respectively, representing the sample means of the variables.

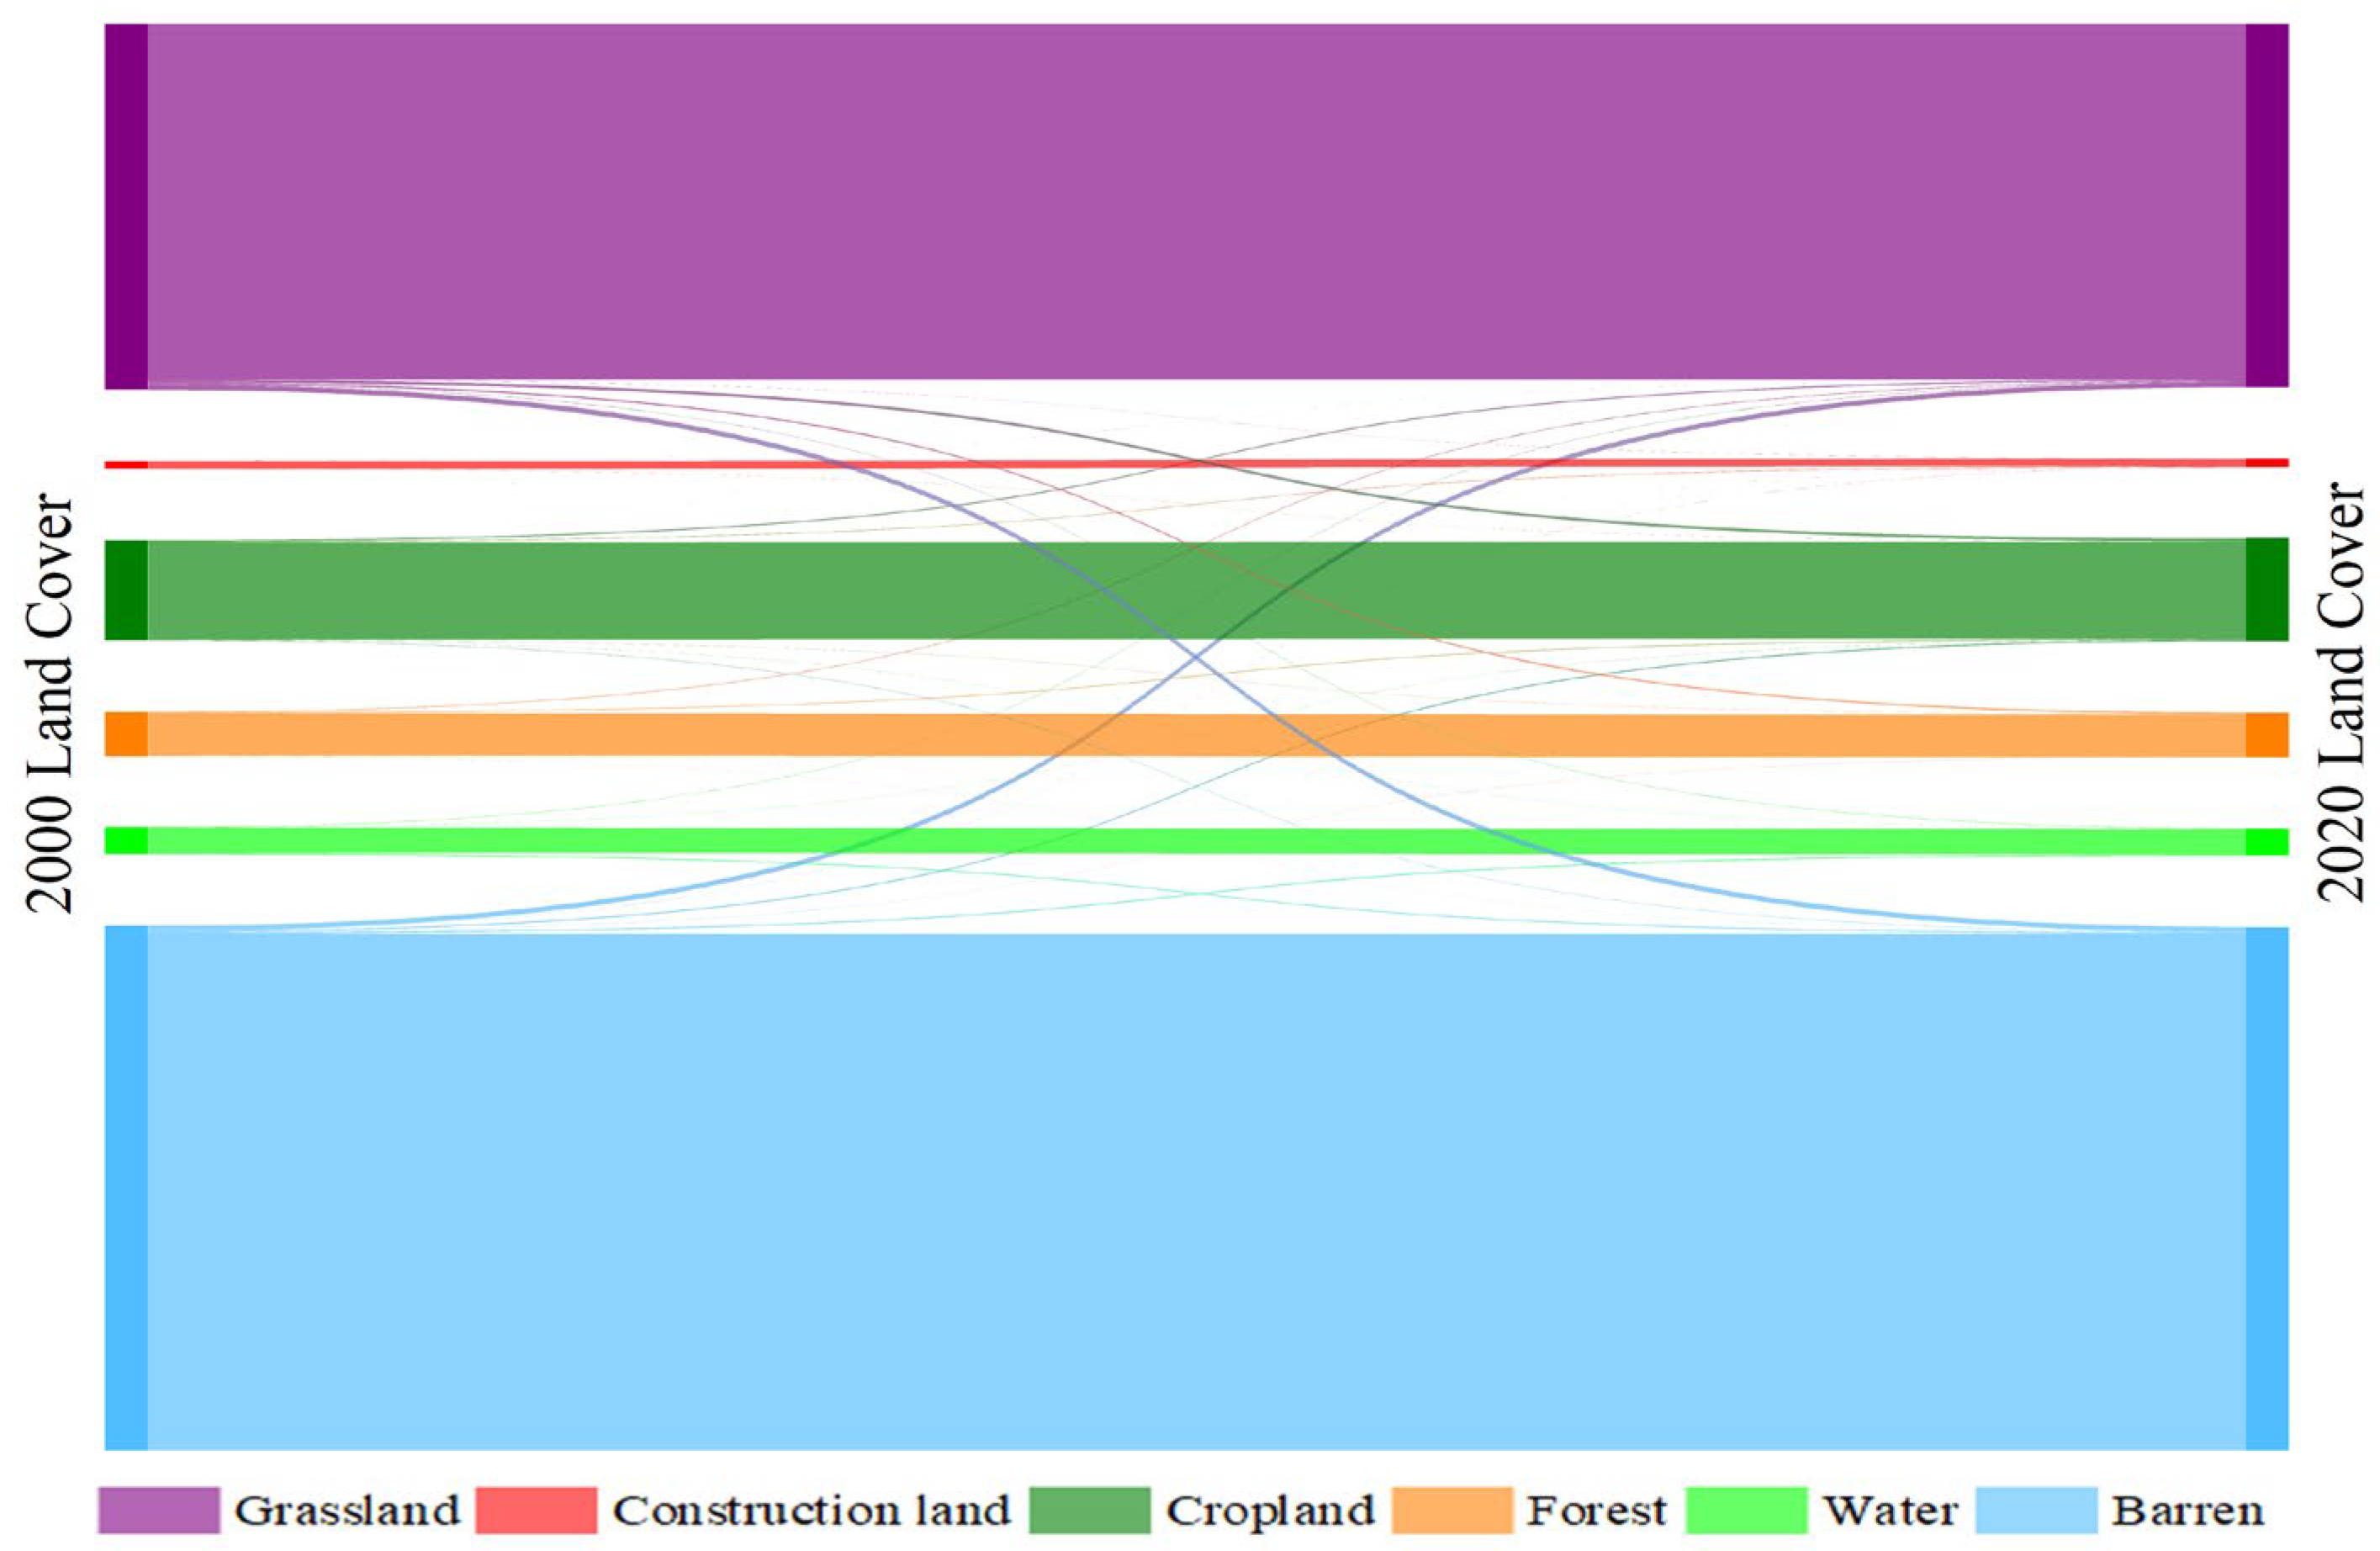
2.3.4. Land Use Transfer Matrix

The land use transfer matrix is a quantitative description of the system state and state transfer based on the analysis of different simultaneous phase systems in the same region [42,43].

3. Results

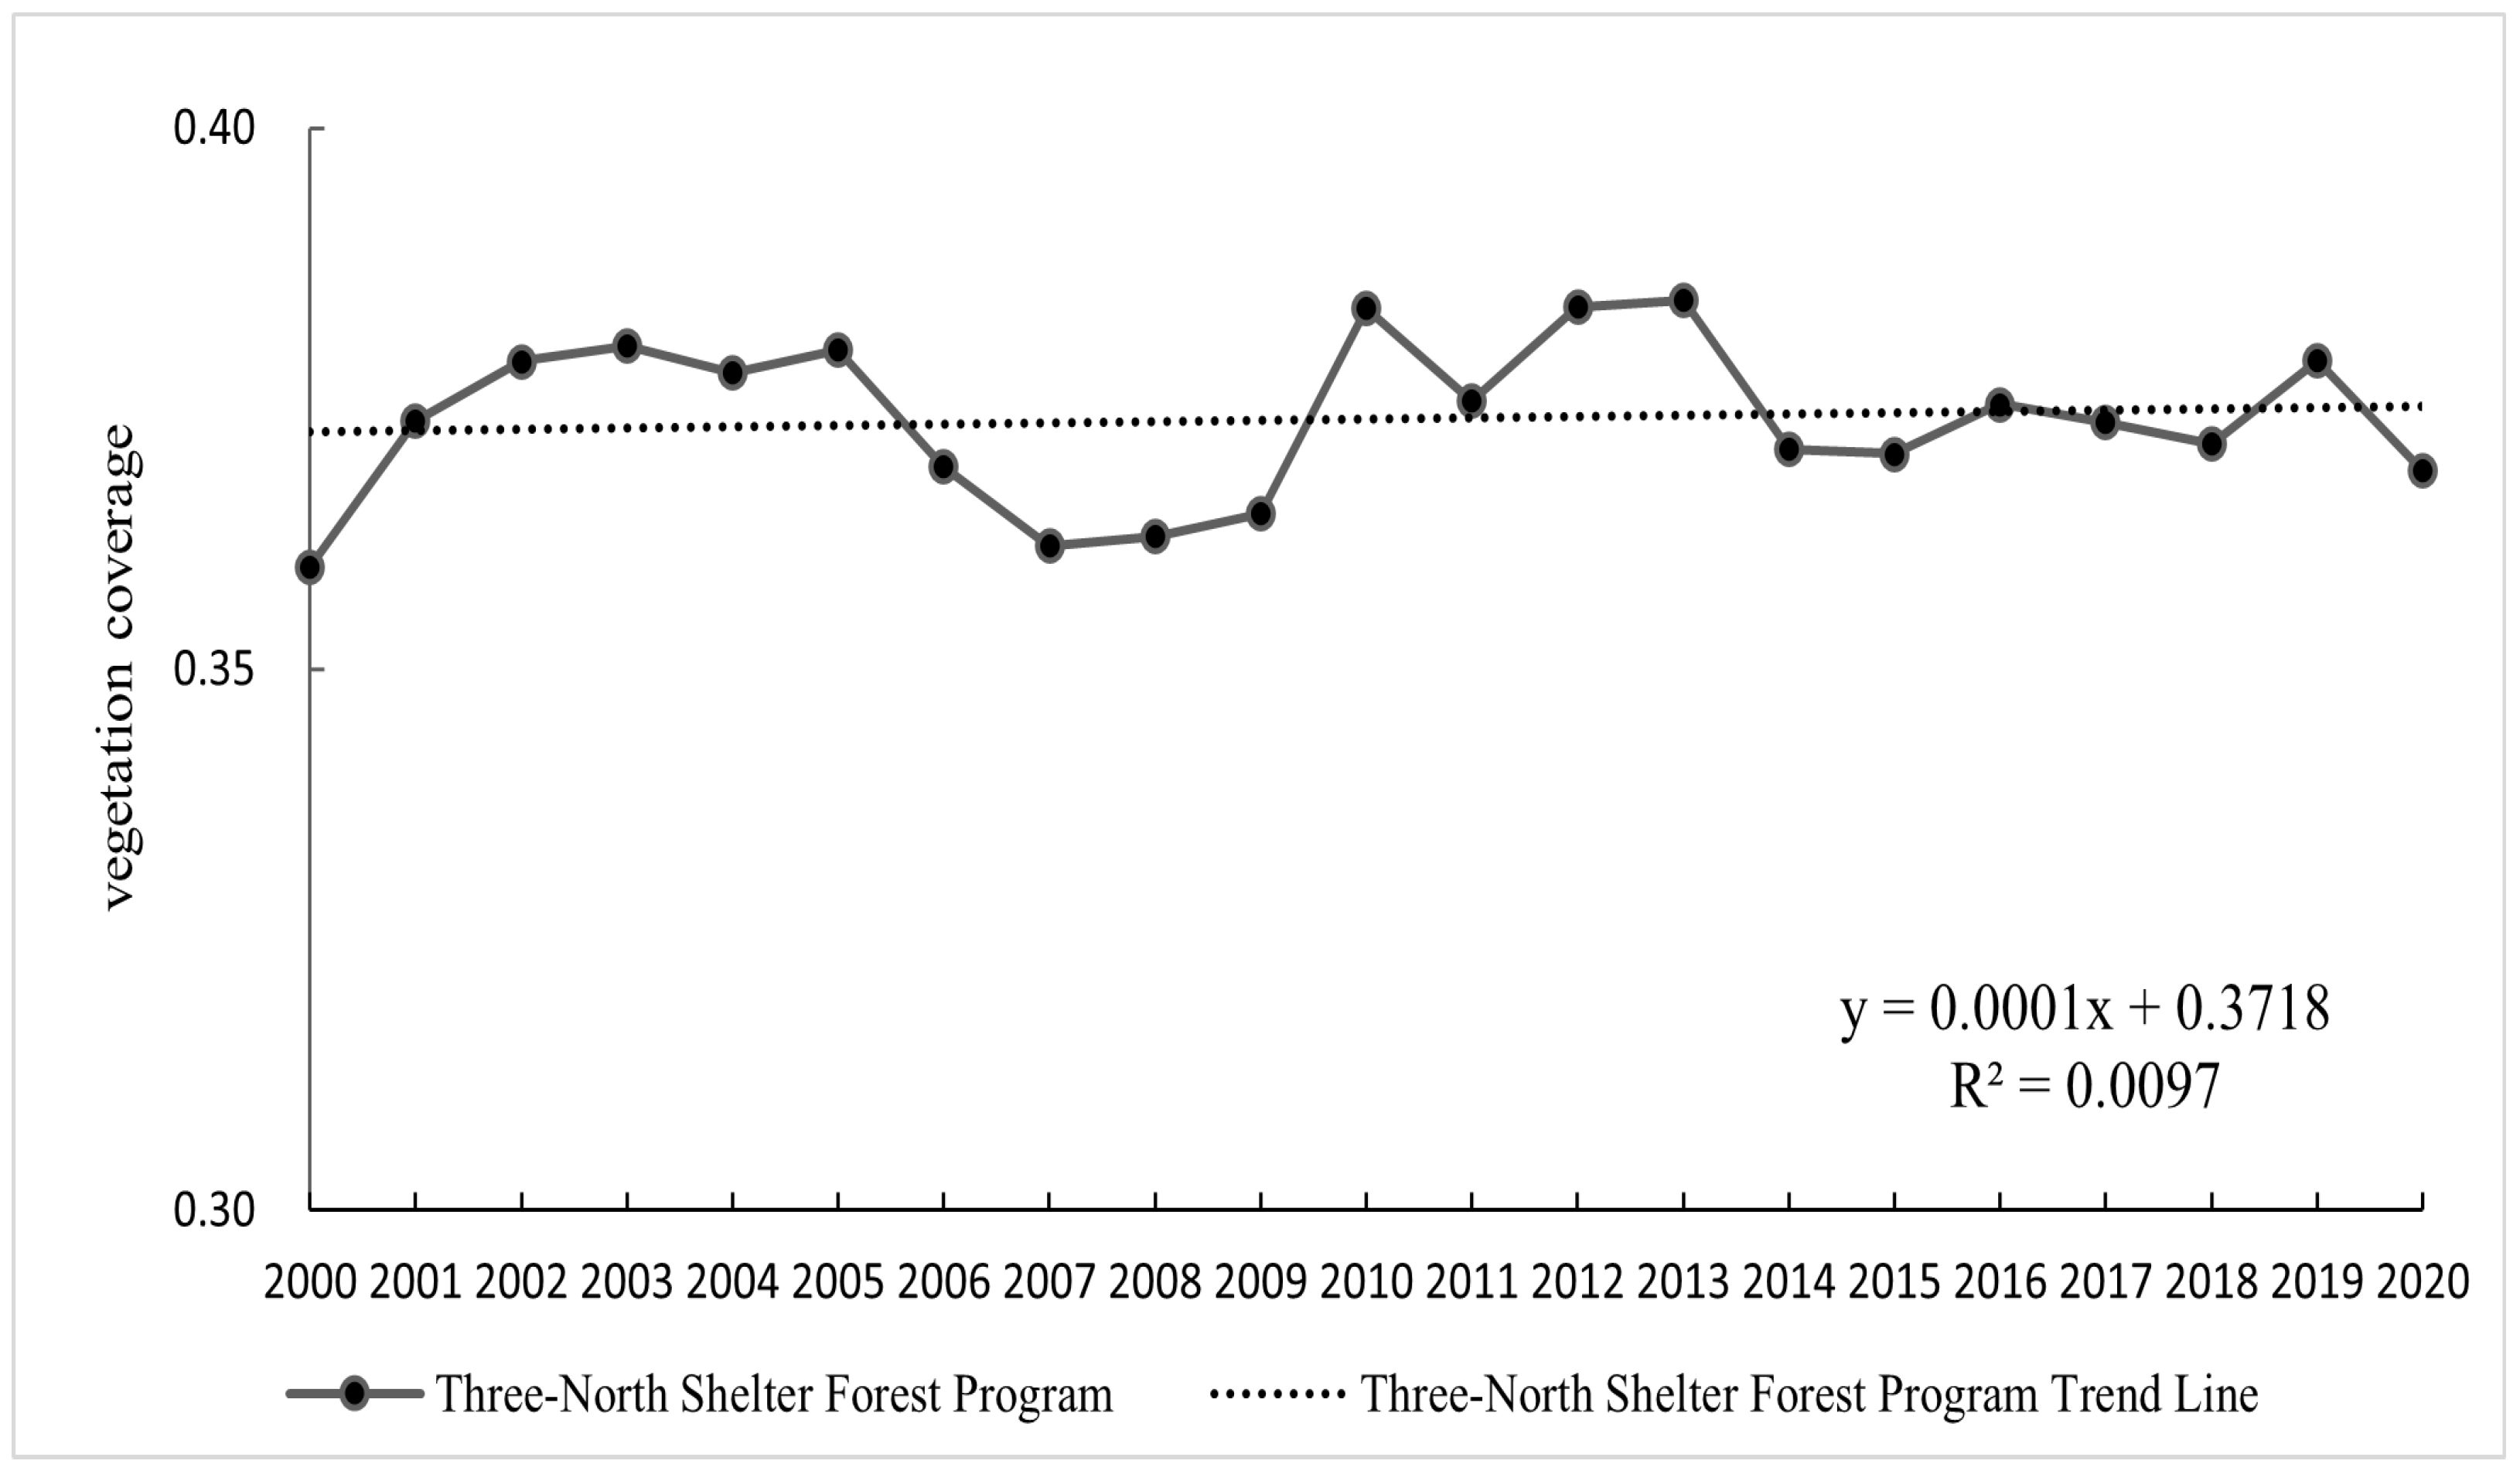
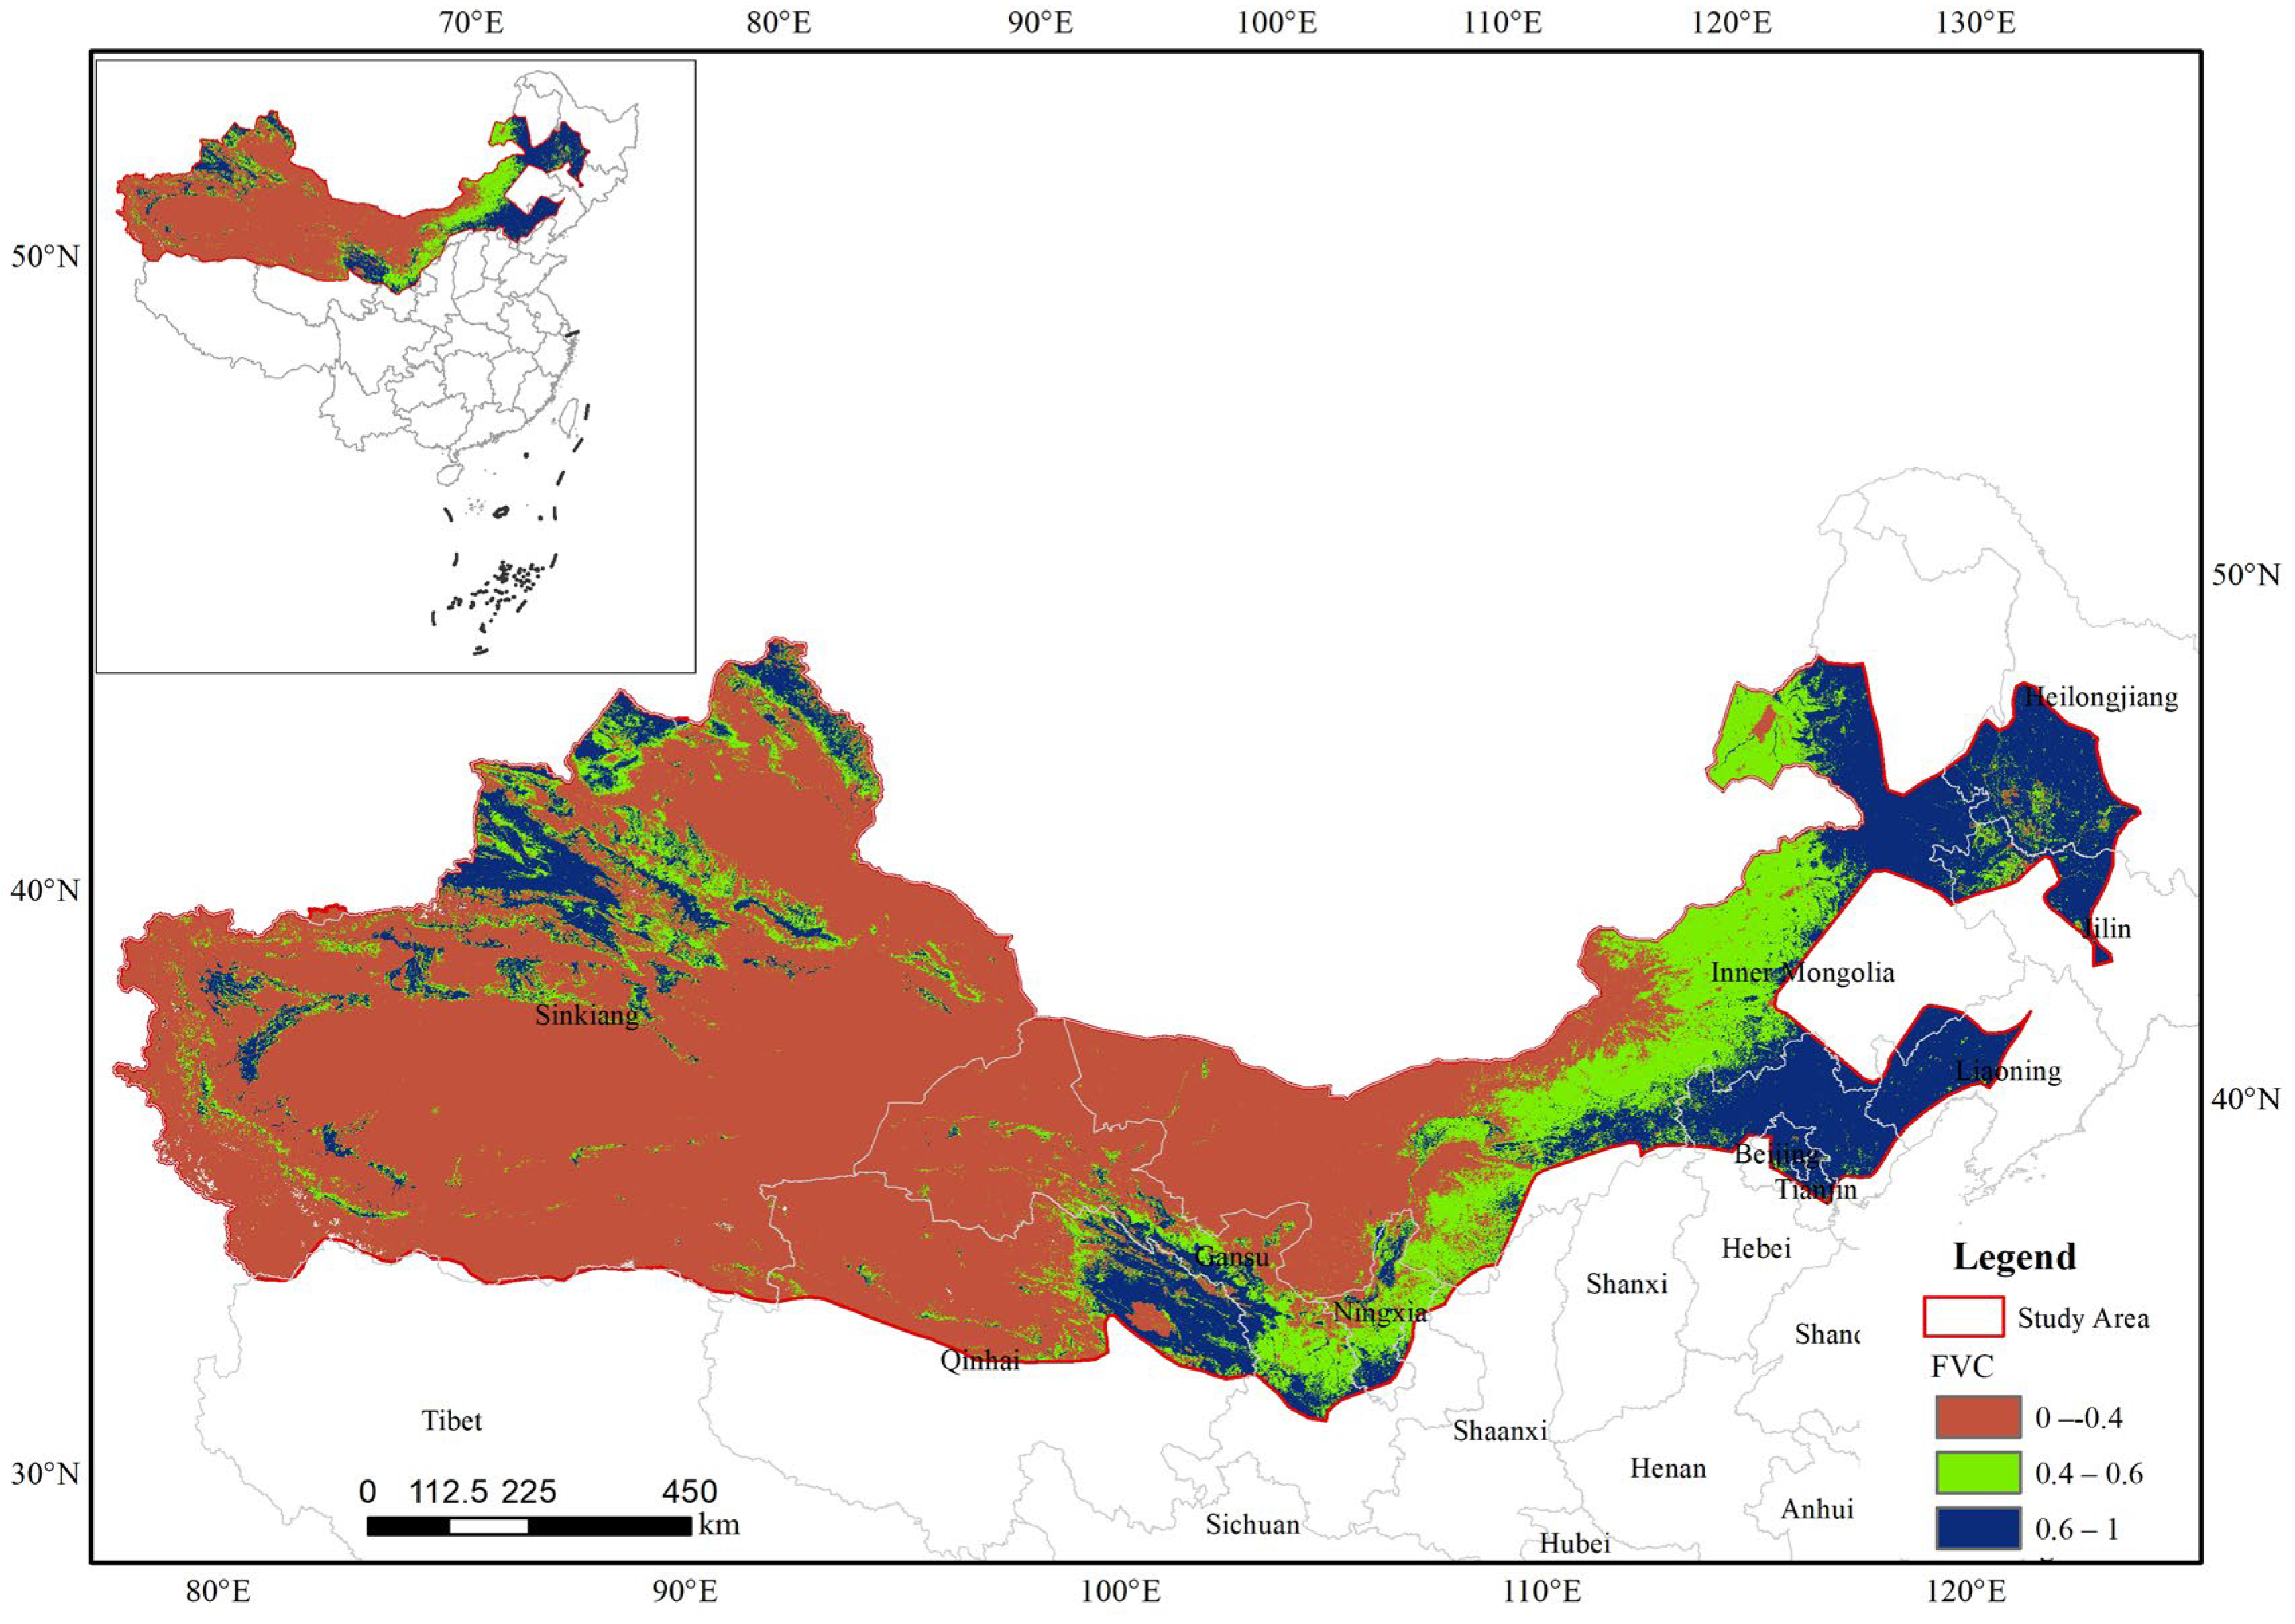
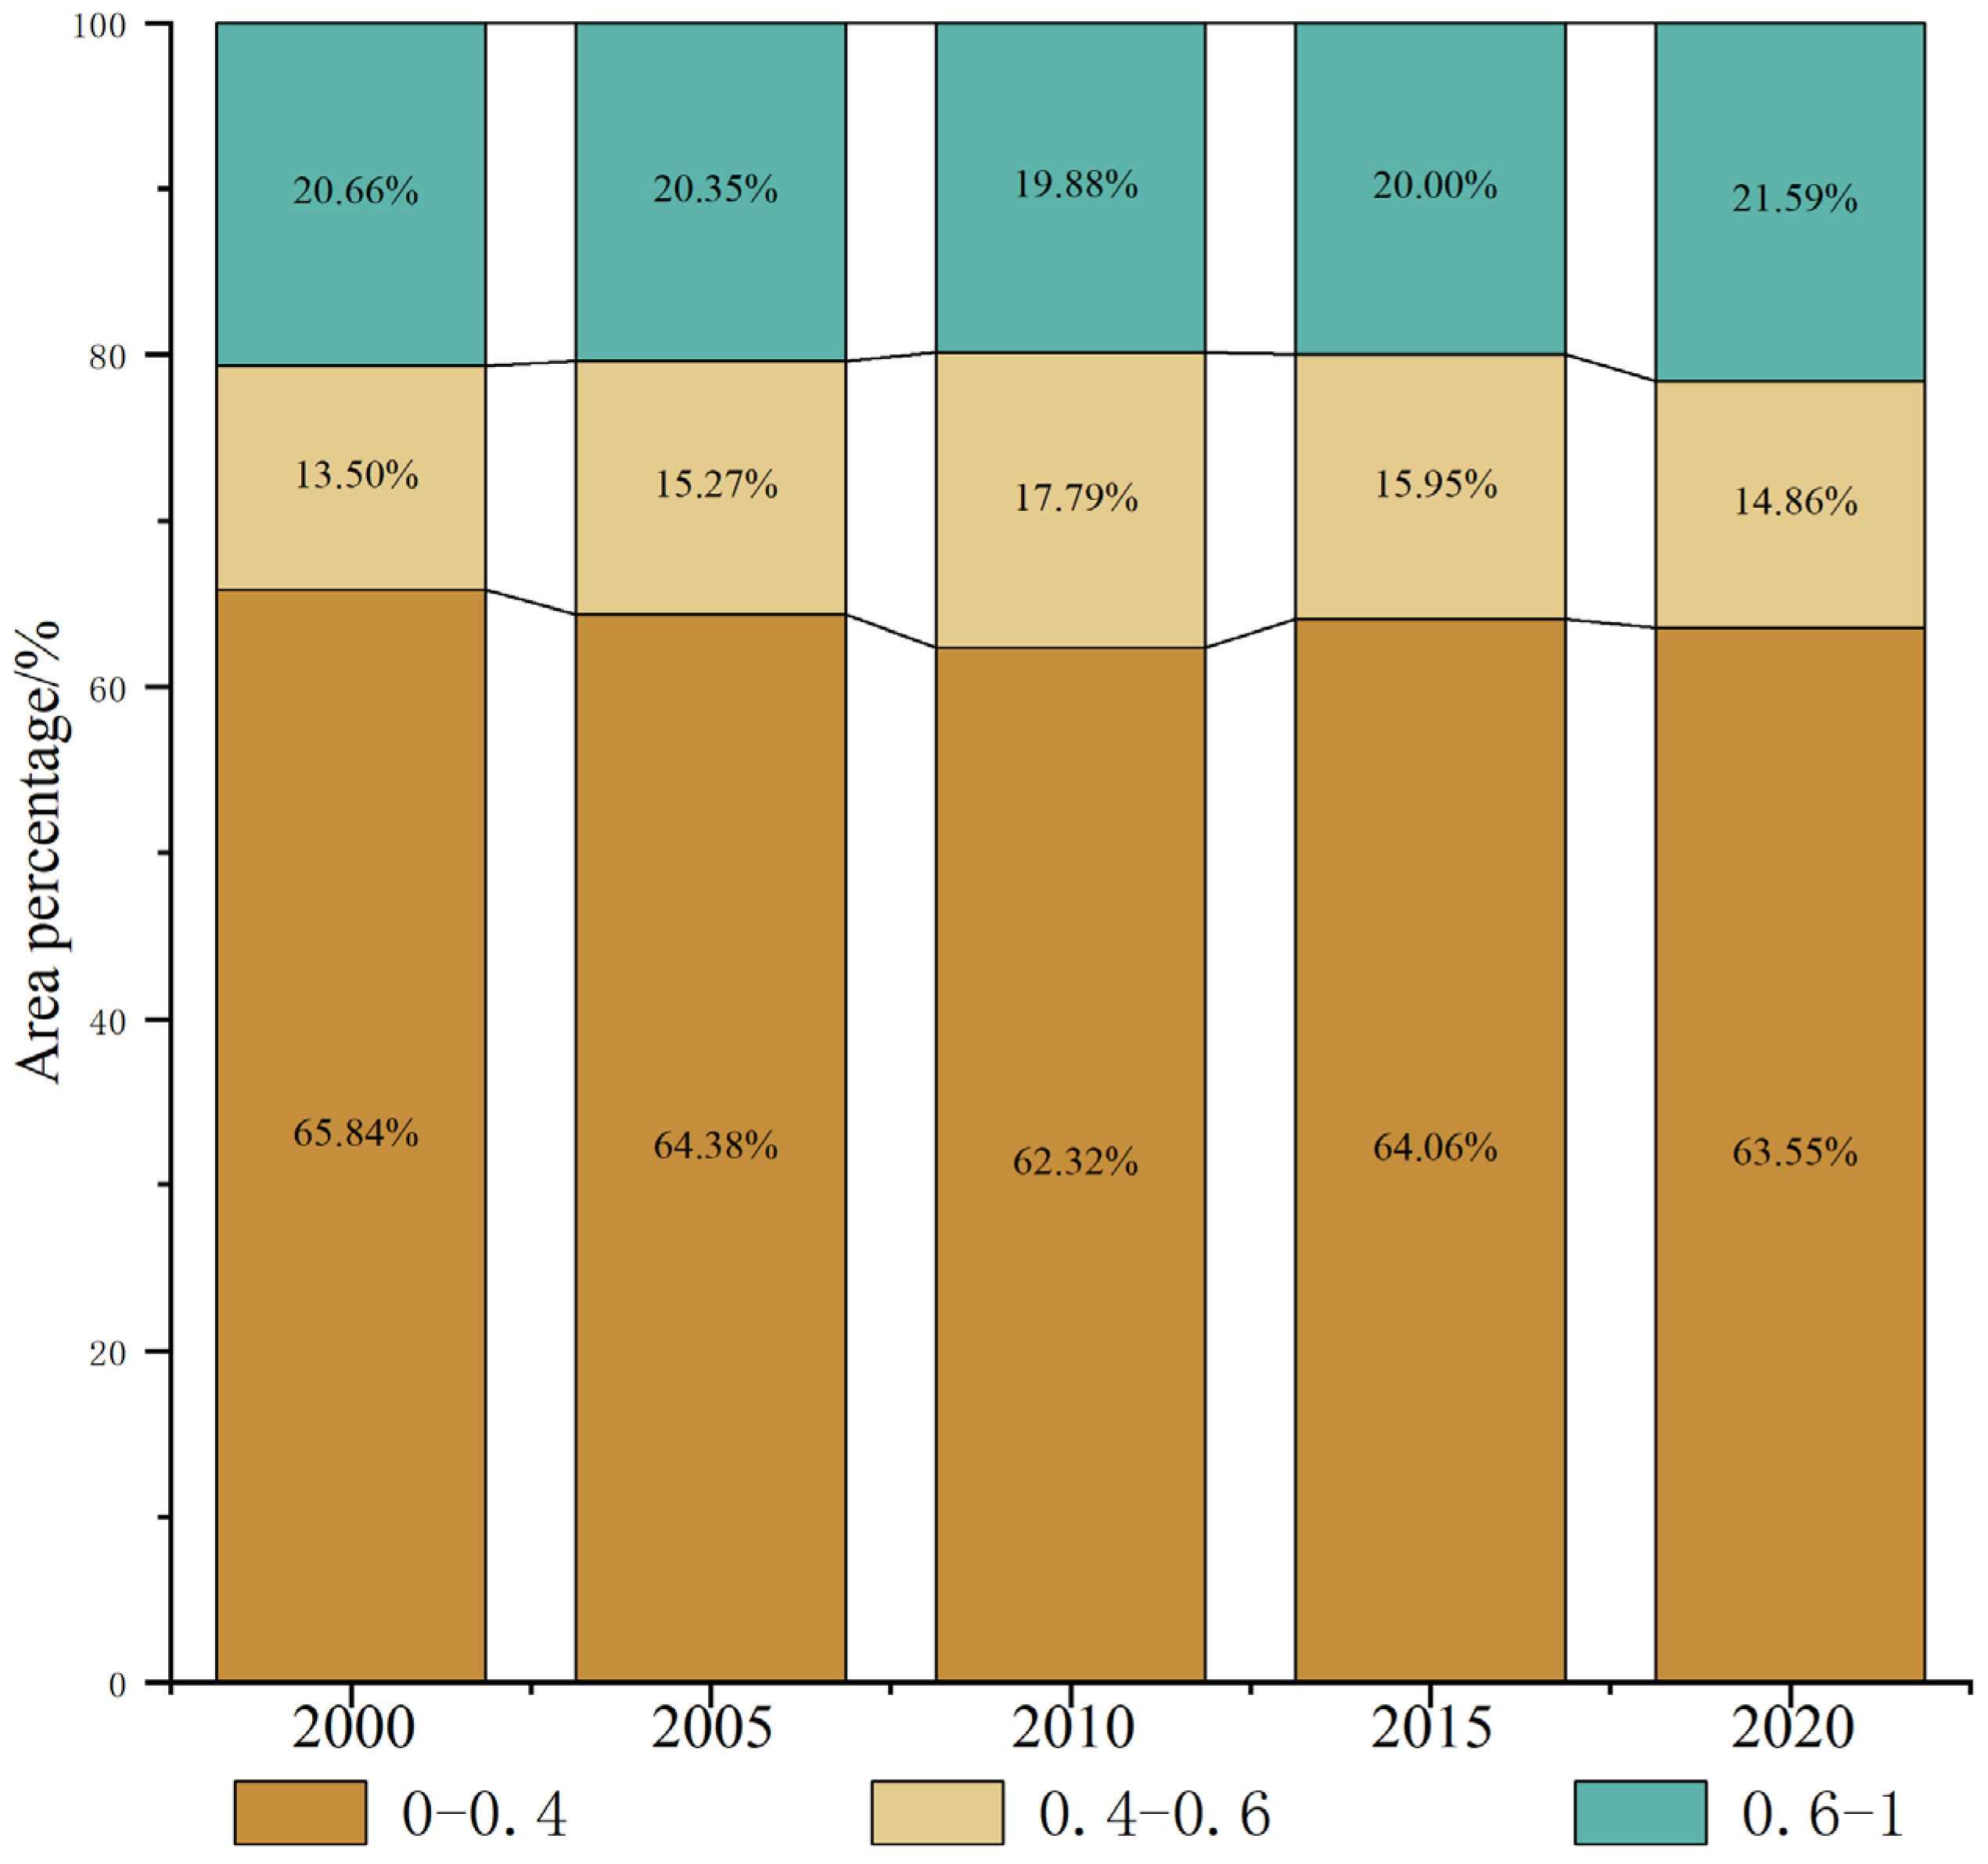
3.1. Characteristics of Temporal Changes in Vegetation Cover

The interannual FVC trends and the spatial distribution and classification of vegetation cover from 2000 to 2020 are shown in Figure 2, Figure 3 and Figure 4, respectively. The high vegetation cover was mainly concentrated in Heilongjiang, Jilin, Liaoning, Hebei, Beijing, north-east Qinghai, north-west Xinjiang, and northern Ningxia; the medium vegetation cover was in central Inner Mongolia, southern Ningxia, and central Gansu; and the low vegetation cover was in Xinjiang, northwest Gansu, Qinghai, western Inner Mongolia, and central Ningxia. The FVC displayed a fluctuating increasing trend in the past 20 years, which indicates that the vegetation activity in the Three Norths Project area was continuously increasing. The average vegetation cover rose from 0.359 in 2000 to 0.383 in 2010 and to 0.37 after 20 years; the low vegetation cover decreased from 65.84% in 2000 to 63.55% in 2020; and the medium vegetation cover and high vegetation cover increased by 1.36% and 0.93%, respectively. This is attributed to many instances of afforestation and good protection of vegetation [44].

3.2. Trends in Vegetation Cover

As shown in Figure 5, areas with mildly reduced vegetation cover included the Altai and Tacheng areas in the northern part of the Xinjiang region and the western part of Xilinguole; League and Ulanqab City in Inner Mongolia; and Yili Kazakh Autonomous Prefecture in the northwestern part of Xinjiang. A few areas in Harbin, Suihua, and Daqing City in Heilongjiang Province showed significant reductions. In 2000, only the southern part of the Ningxia region belonged to the medium vegetation cover area, but in 2020, all the Ningxia regions were included in the medium vegetation cover area. The southern part of Guyuan, Yinchuan, Shizu, and Zhongwei cities became the high vegetation cover area. The change in vegetation cover in Gansu province was also large, and the southeastern part of Gansu province, Baiyin, and Lanzhou cities showed medium vegetation cover. The increase in vegetation cover indicates that the mountainous area is the main distribution area of the forest in Northwest China, and the mountainous forest is the main part of the three northern protected forests.

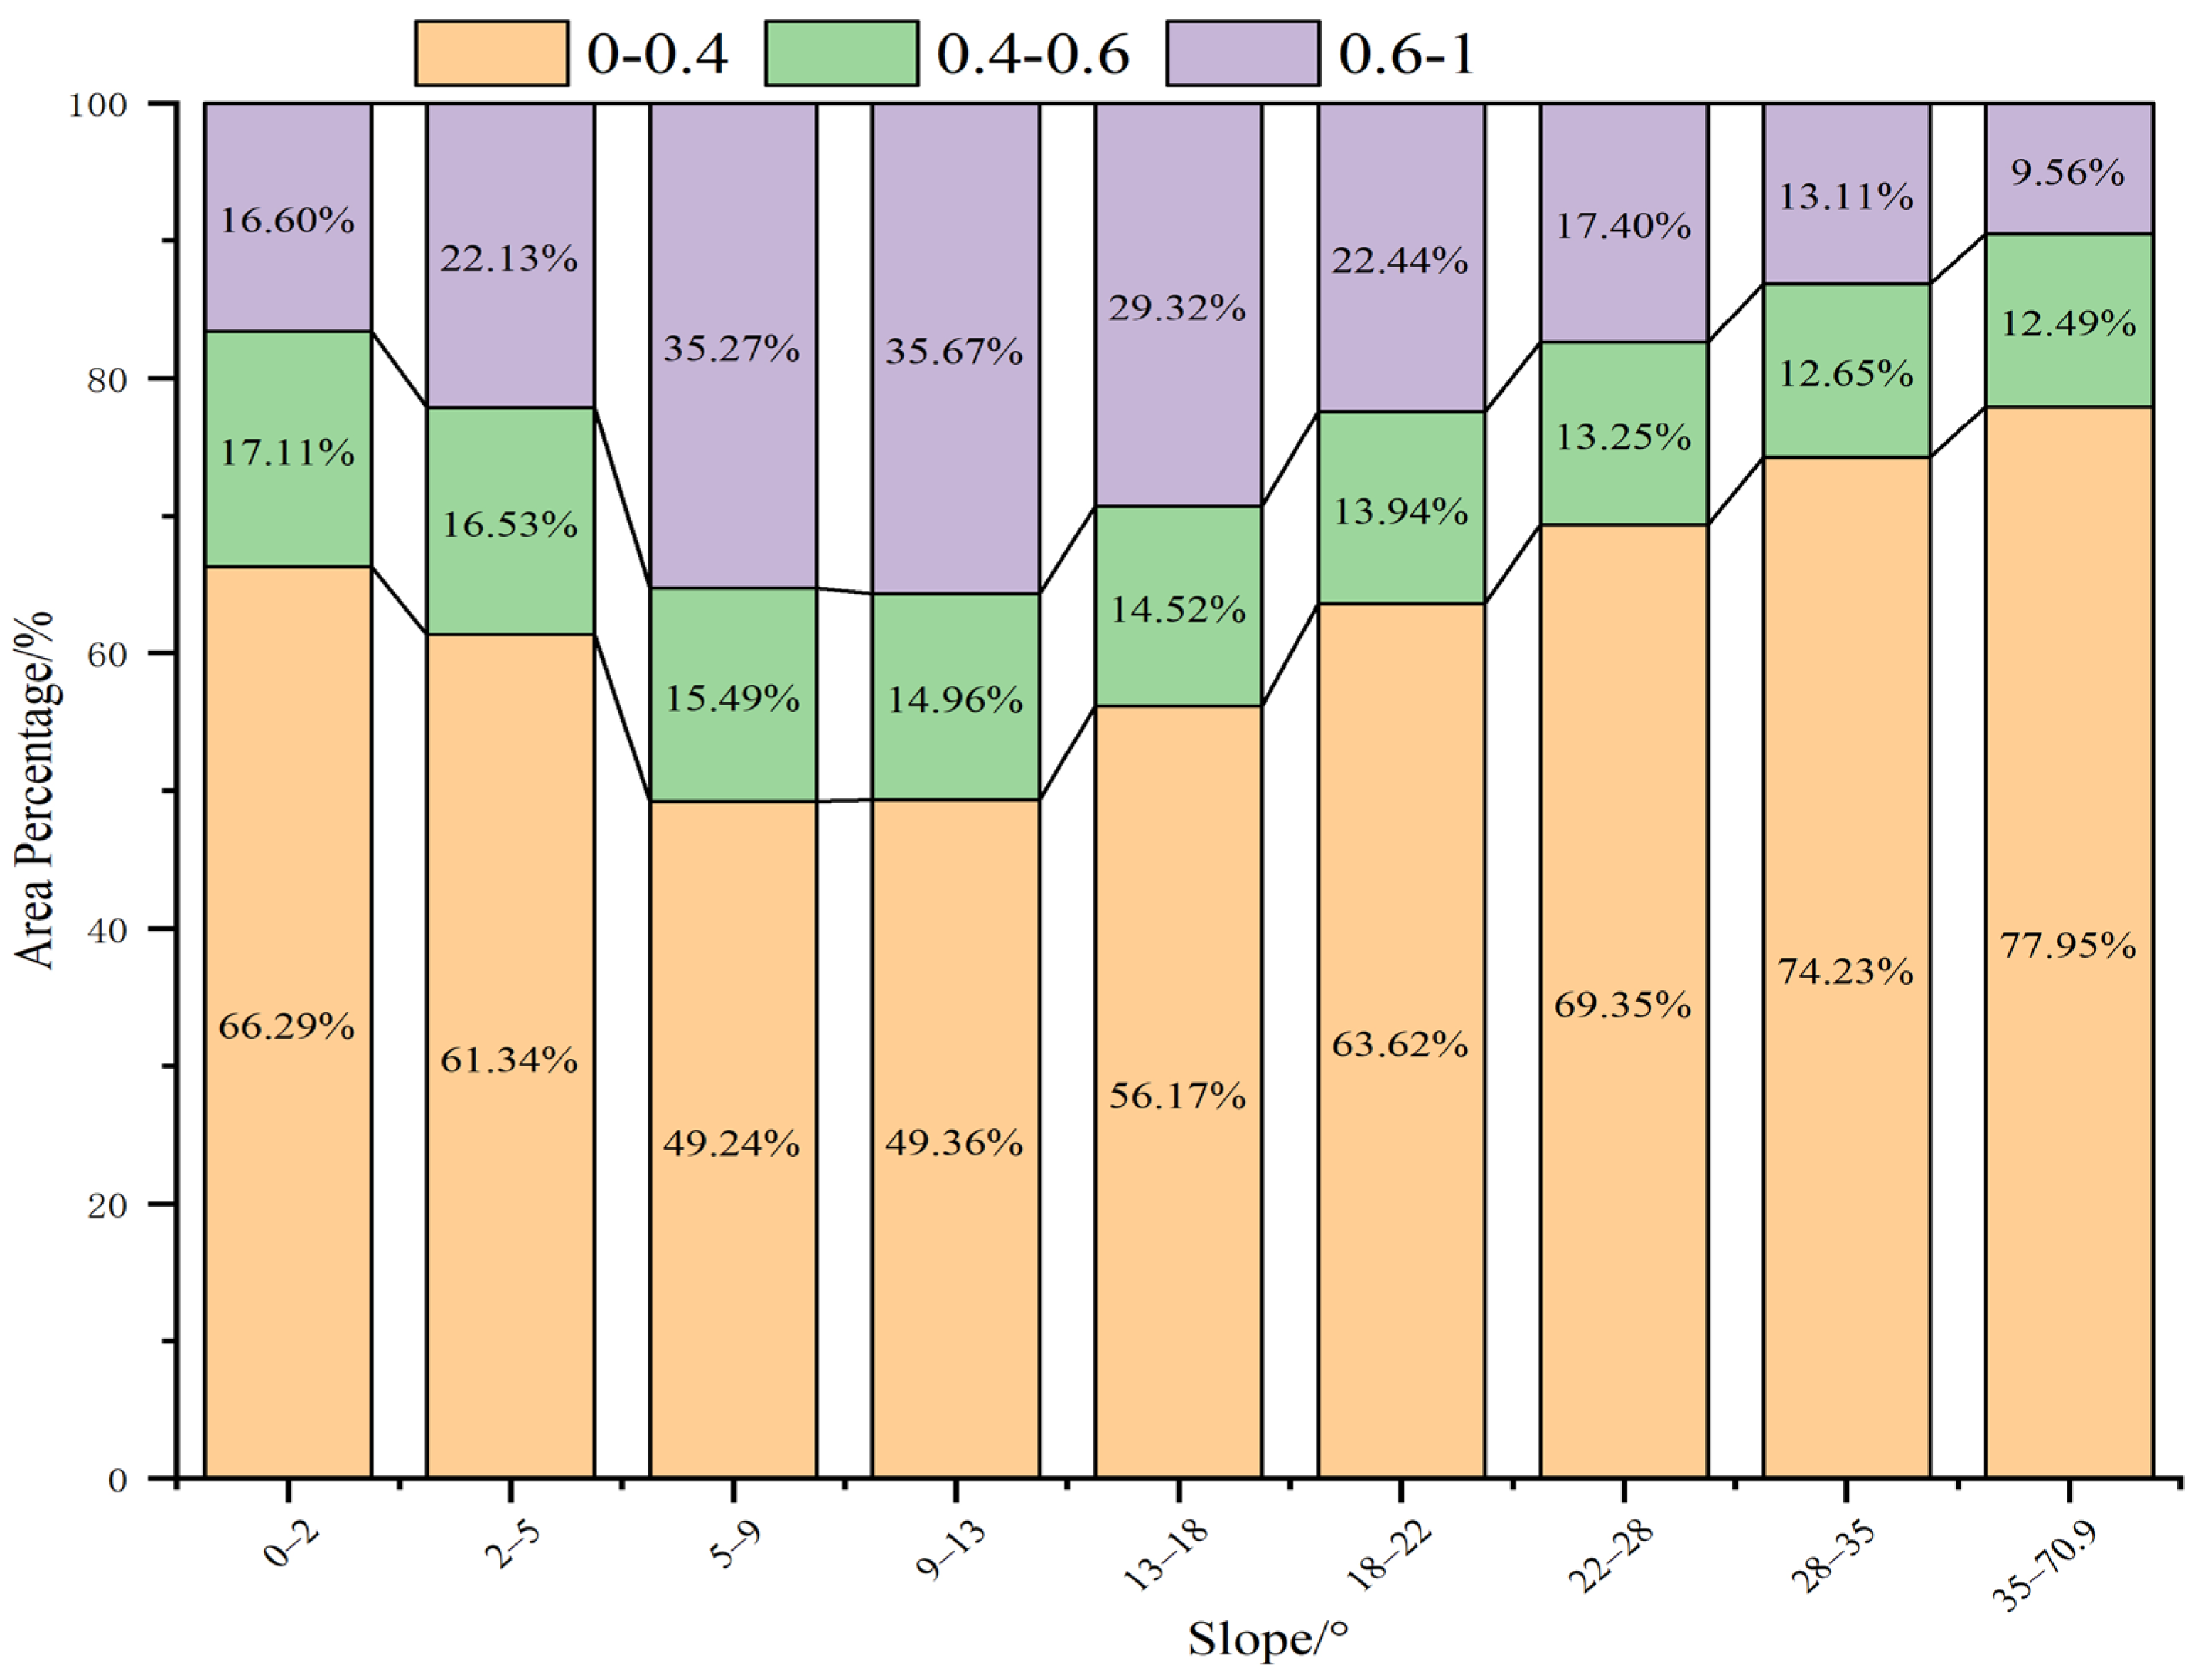
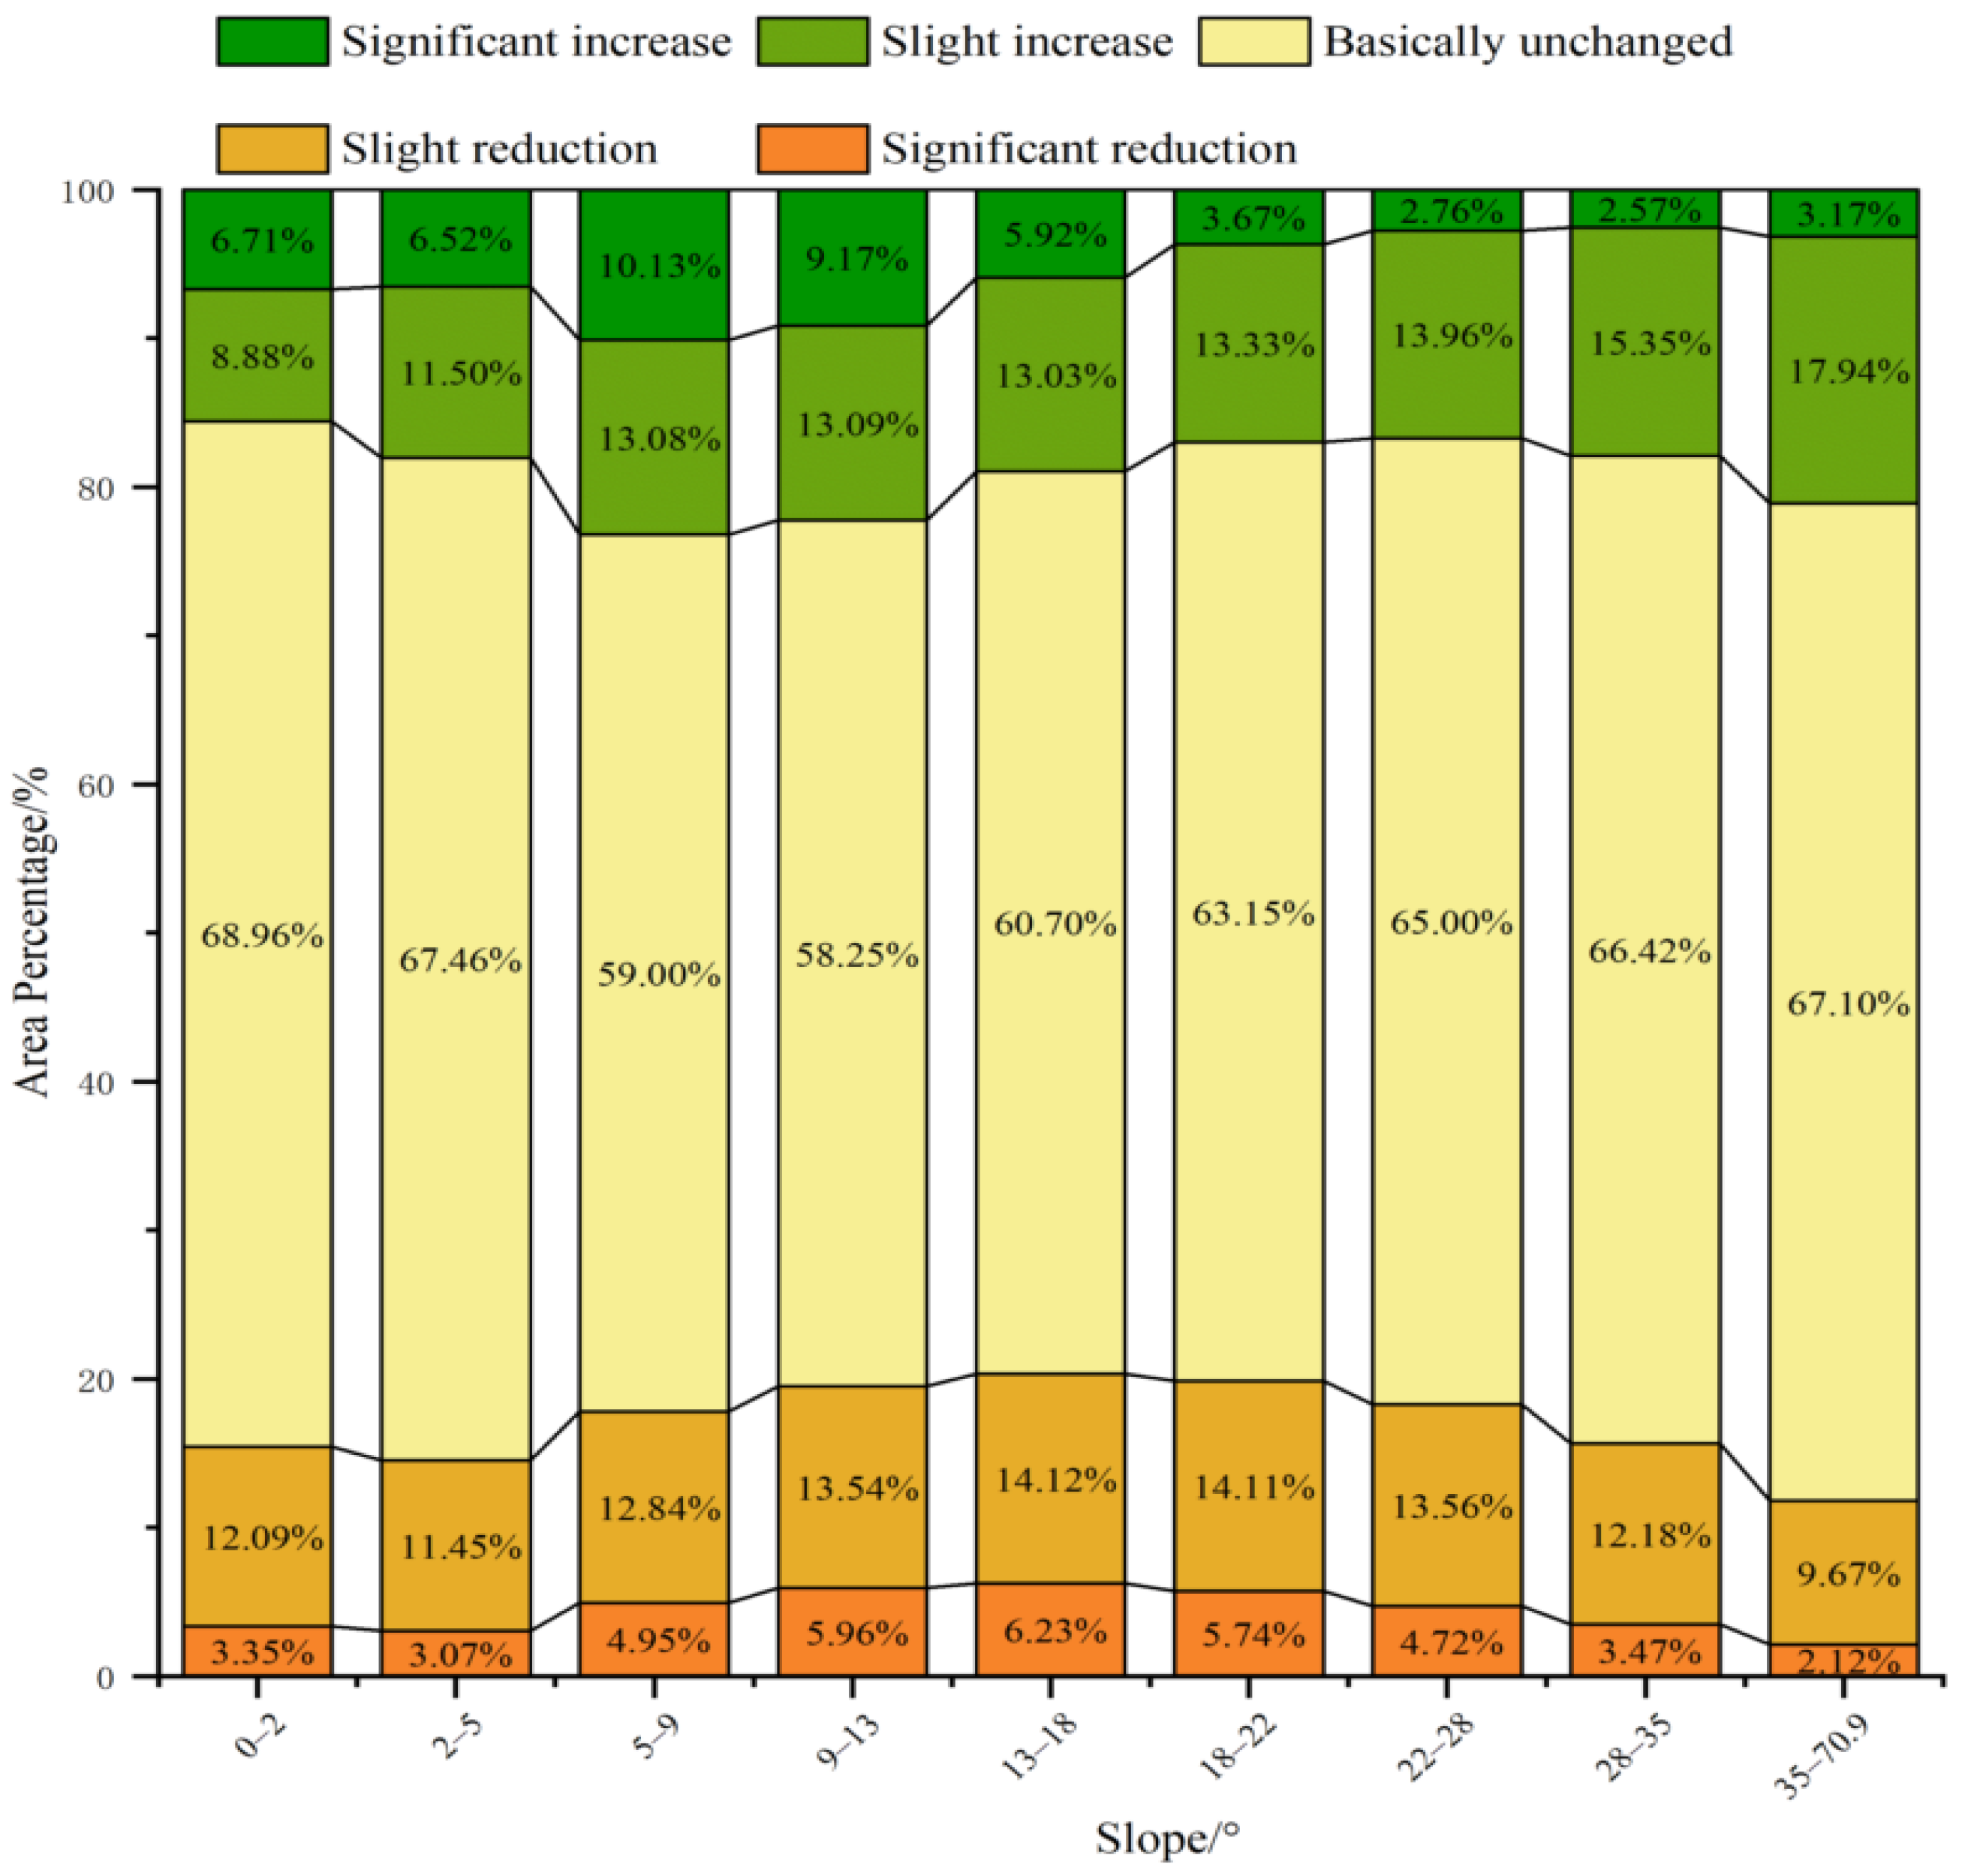
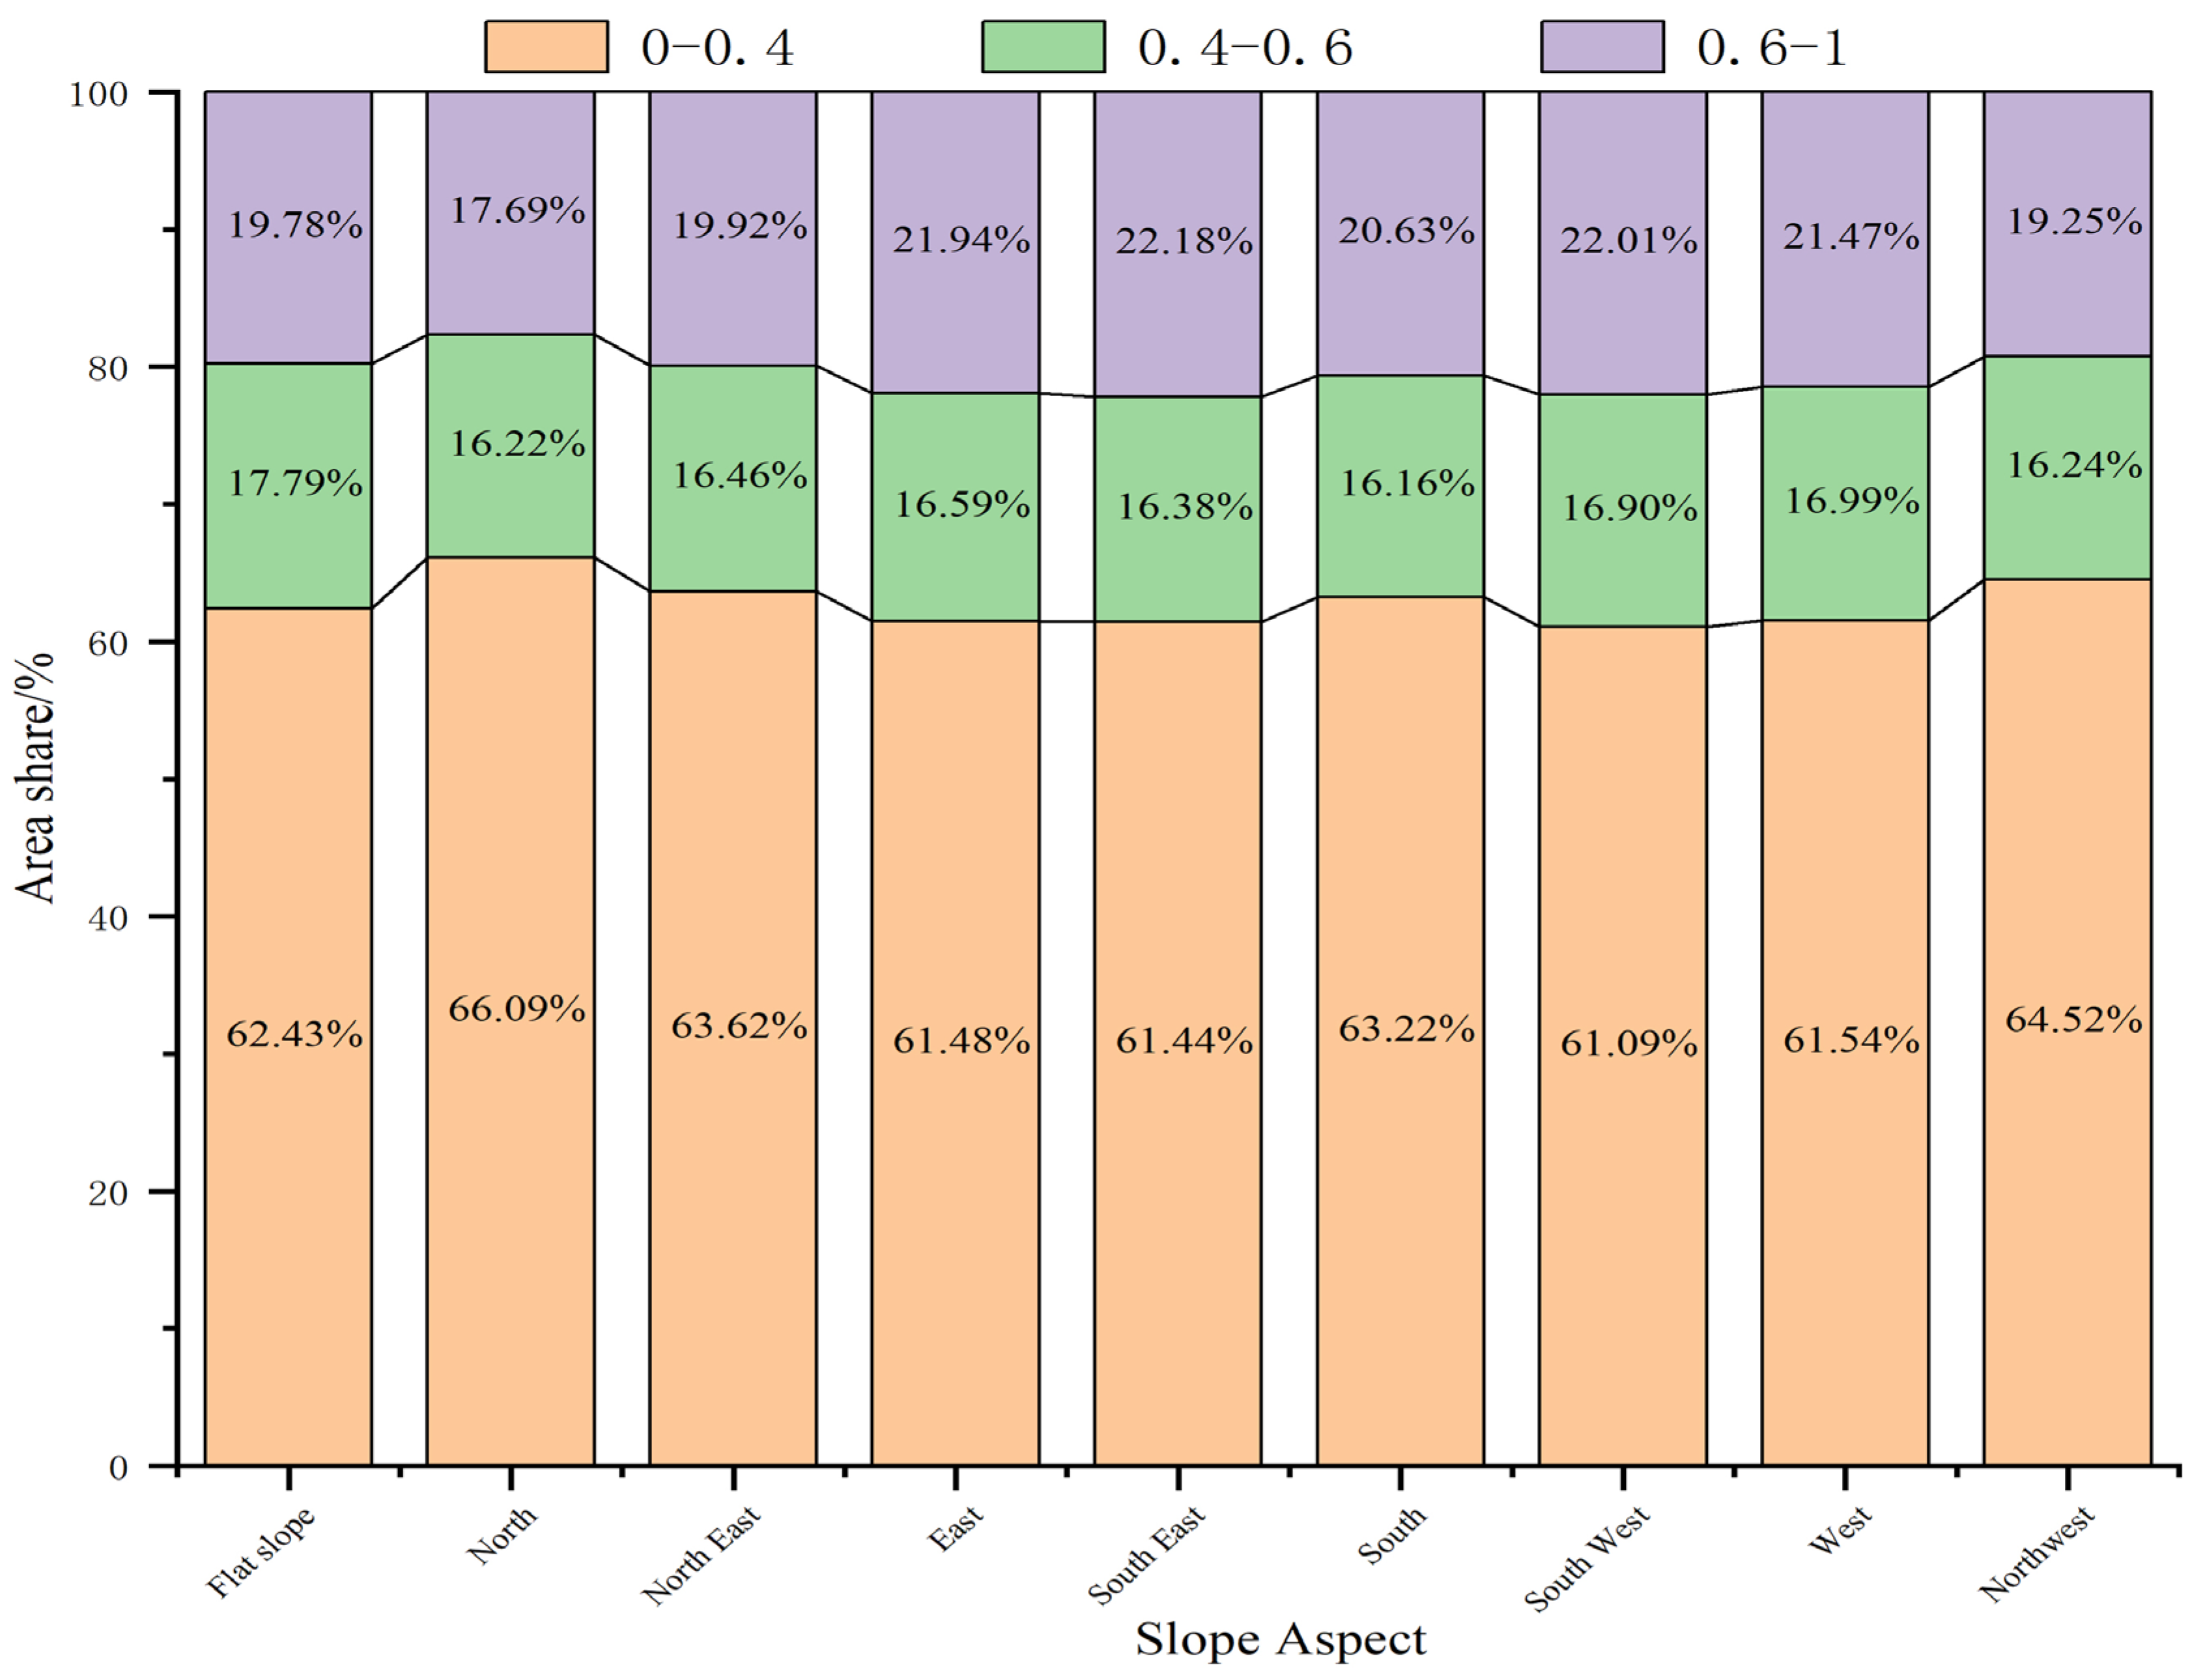
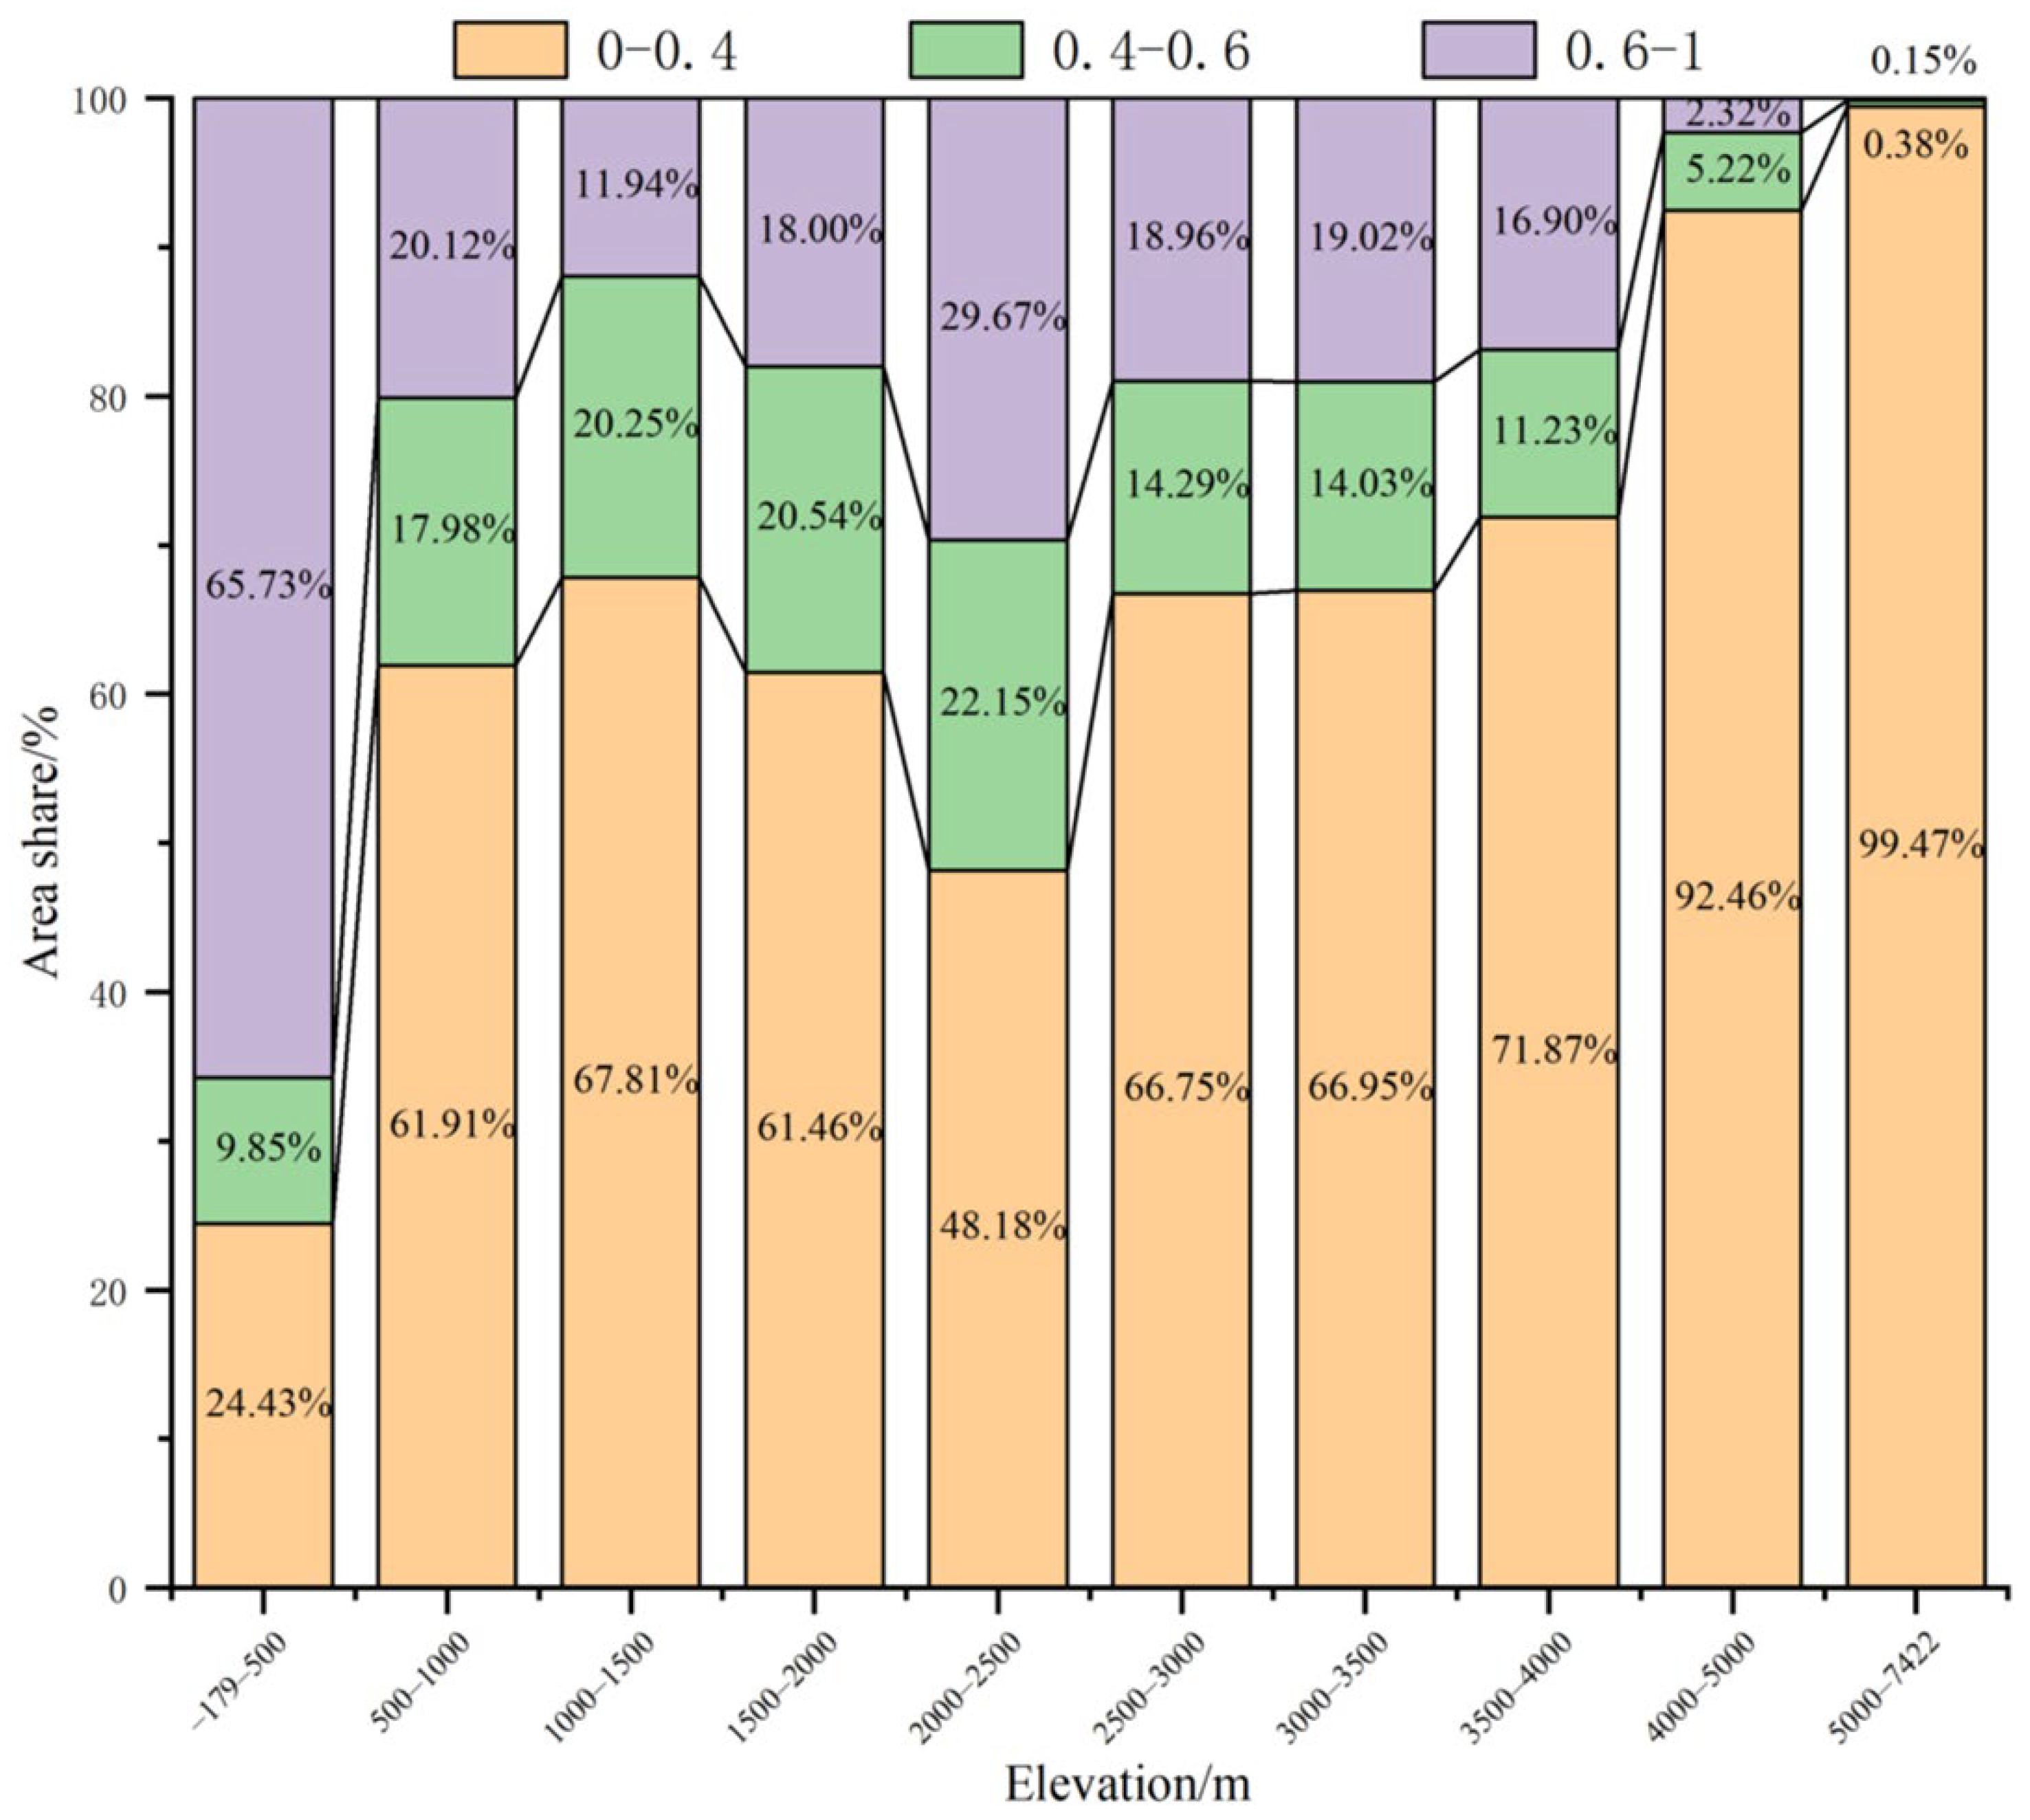
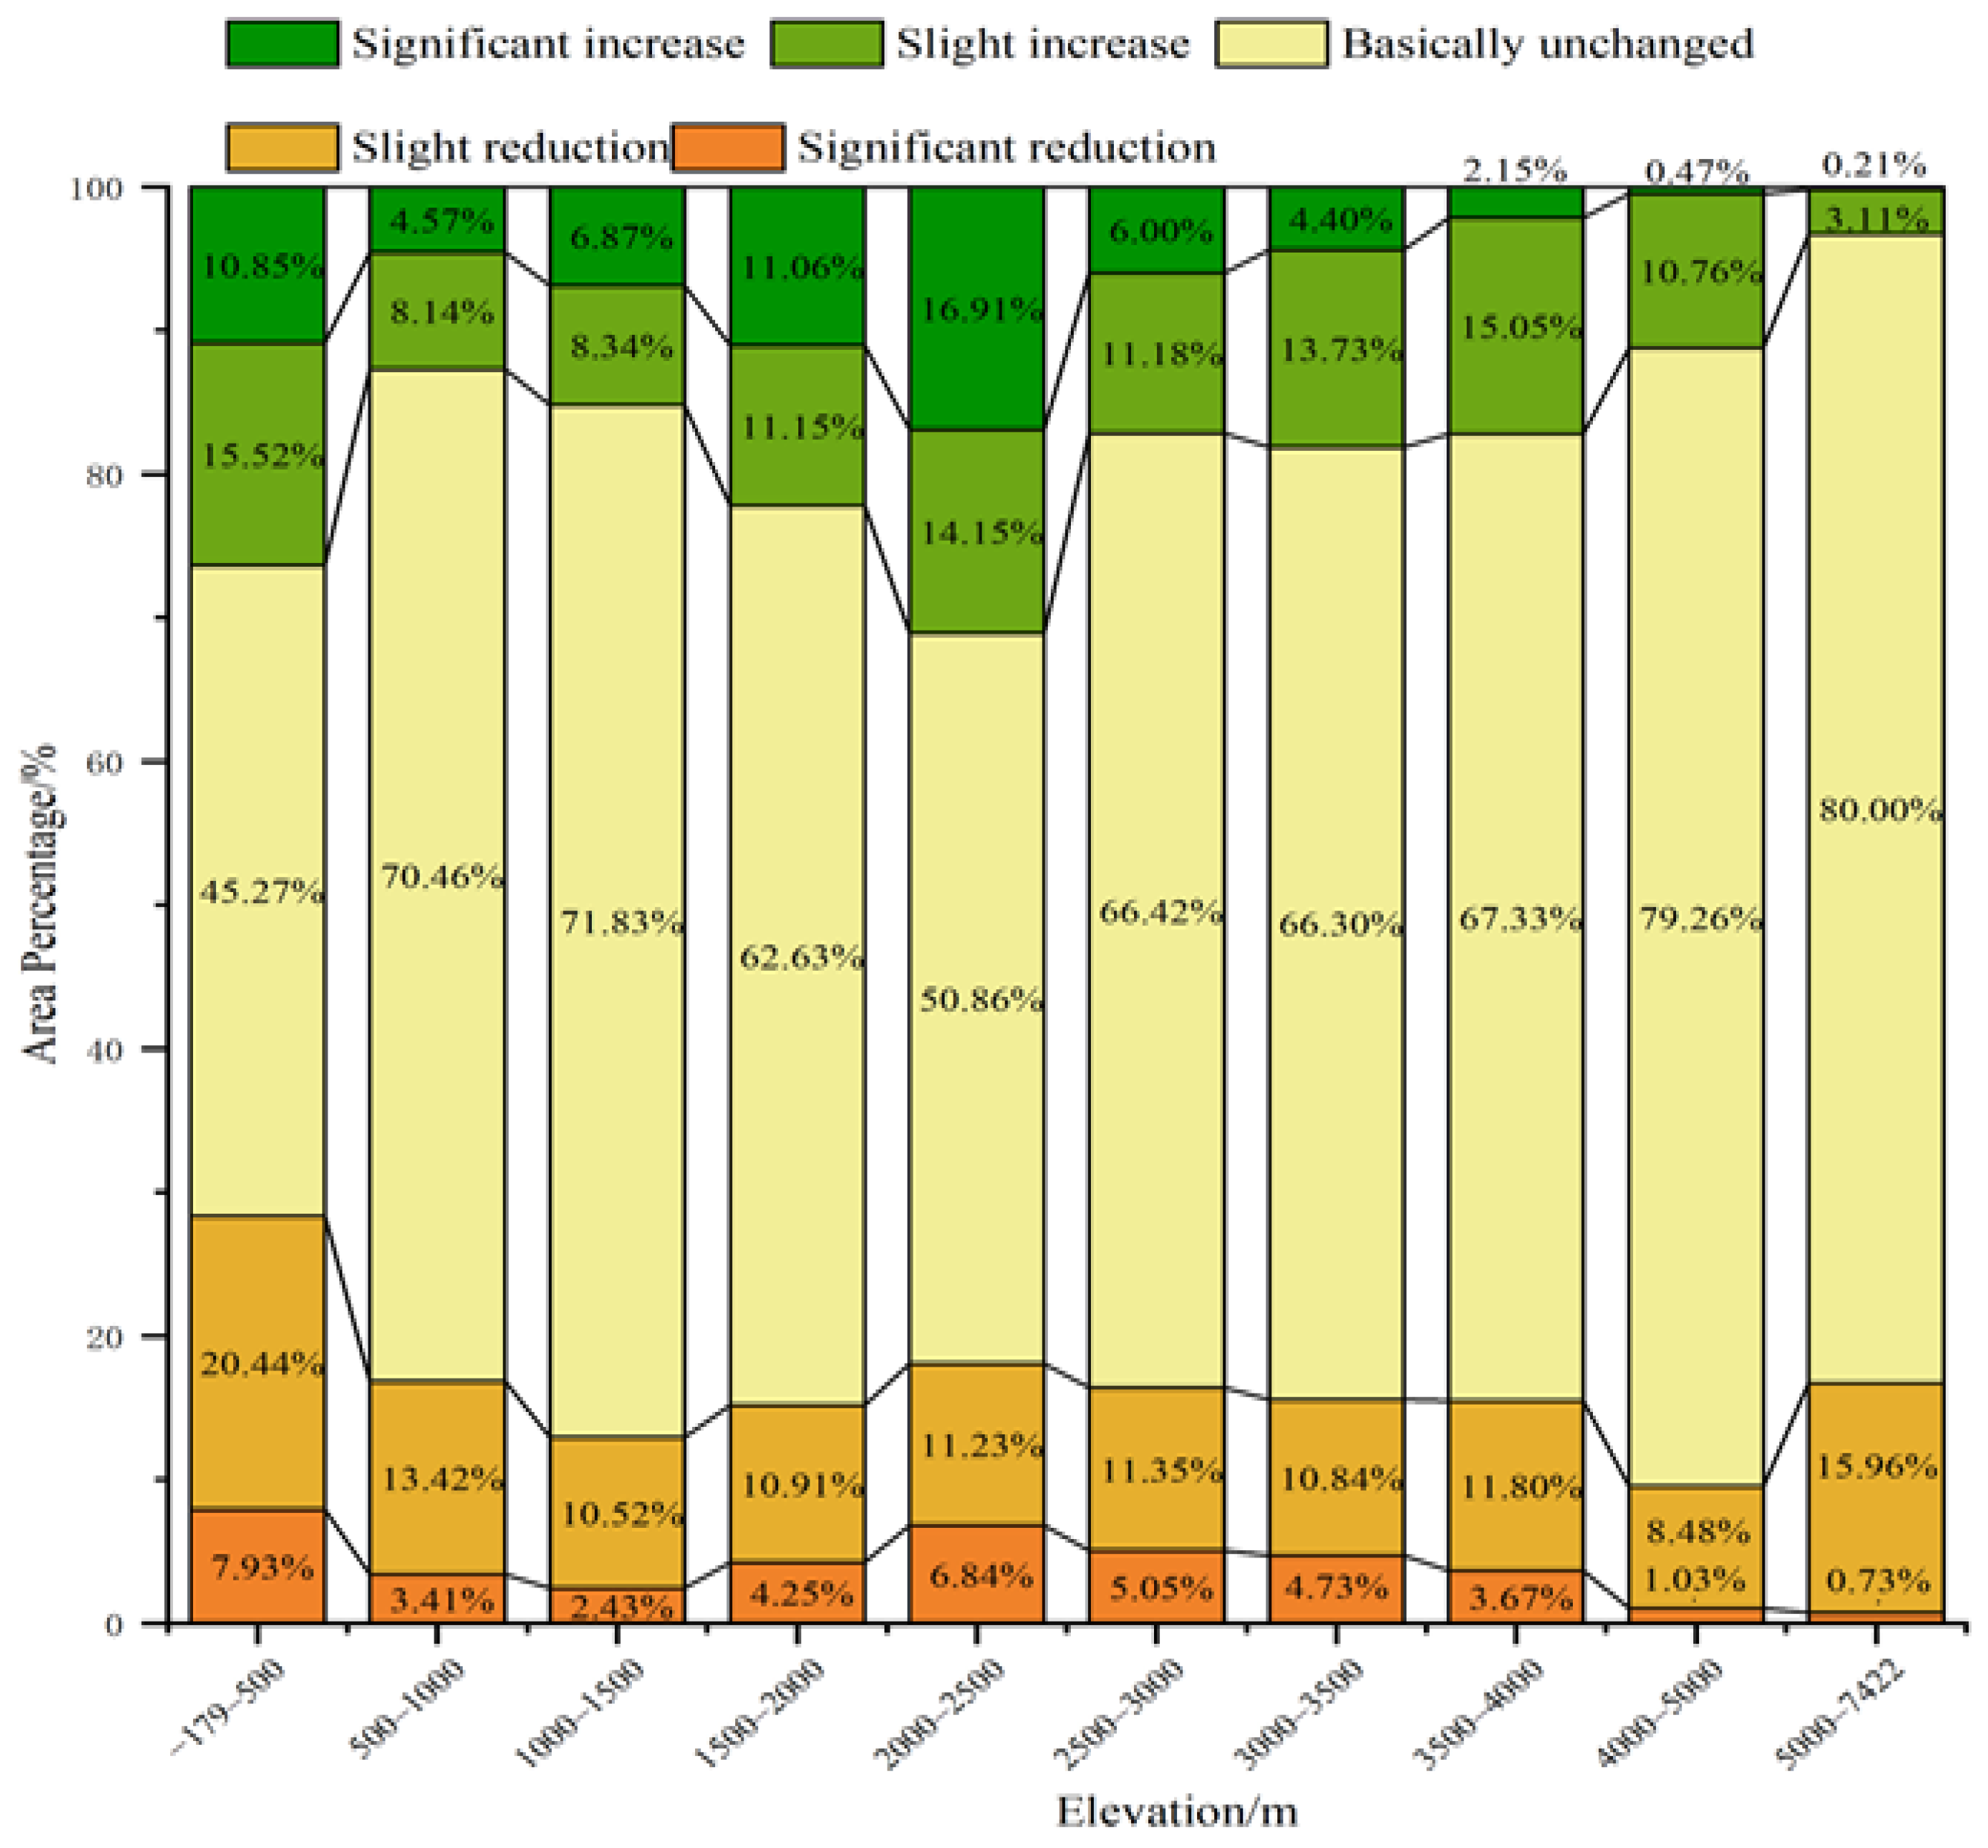
3.3. The Topographic Effects of FVC

To eliminate the effect of vegetation cover variation in extreme years, in the terrain effect analysis, we chose the average vegetation cover in 2000, 2005, 2010, 2015, and 2020 to represent the average condition of vegetation cover in the three northern regions. There were massive differences in vegetation cover between the three northern regions, with an overall increasing trend from the northwest to the southeast. Vegetation cover was lowest in the west, second highest in the center, and highest in the east, with a predominance of low coverage overall.
Figure 6 shows that the proportion of area in each class of vegetation coverage in the three northern regions varied significantly with slope. The percentage of the area covered by high-grade vegetation increased and then decreased as the slope increased, with the highest proportion of area covered by high-grade vegetation at 5–13°, reaching 35%. The percentage of area covered by medium-grade vegetation decreased with increasing slope but did not fluctuate significantly. The proportion of area covered by low-grade vegetation decreased and then increased with increasing slope. Vegetation cover was at its best when the slope was 5–13°, where the percentage of area covered by medium and above vegetation coverage was 50% or more. As shown in Figure 7, there was a remarkable slope effect as the percentage of the area of change in vegetation cover trends for each type varied with slope. The proportion of significantly increased area increased and then decreased with increasing slope. The percentage of the slightly increased area increased with slope, with minimal values occurring when the slope was above 5000 m. The proportion of stable and unchanged area decreased and then increased as the slope increased, and the percentage of significantly reduced area increased and then decreased, with 5–9° and 9–13° being the best slope positions for vegetation improvement, and the proportion of improved area (including slightly improved and significantly improved) was 22% in both cases.
As shown in Figure 8, the vegetation cover of the three northern regions did not fluctuate significantly in different slope directions for each class. The overall picture shows that the largest proportion of the area was covered by low-grade vegetation and the smallest by medium-grade vegetation. As shown in Figure 9, the percentage change in vegetation cover trend did not fluctuate much with slope direction. The overall change in vegetation cover trend with changes in slope direction was less than 1% for all types except for the fundamental constant. Slope influences the redistribution of surface runoff and water and thermal factors, which in turn changes the characteristics and distribution of the soil, as well as the distribution pattern of vegetation [45].
As shown in Figure 10, there was a clear difference in the percentage of area in each class of vegetation cover with changing elevation in the three northern regions. Among them, the percentage of low-grade vegetation cover mainly showed a gradually increasing trend with increasing elevation, with elevations above 4000 m showing a low-grade vegetation cover of over 90% of the area. The vegetation cover was at its worst when the altitude was too high for vegetation to grow. Elevations ranged from −179 to 500 m, with 75% of the area covered by medium and above vegetation in the best condition. As shown in Figure 11, there was also a clear topographic response to the change in vegetation cover trends at different elevations. The minimum amount of area was significantly reduced whereas the maximum percentage of the area was essentially unchanged. At elevations of 2000–2500 m, there was a total of 31% increase in area, with the best improvement in vegetation. The variation in natural factors such as climatic constraints and soil conditions is determined by the altitude, with a distinct vertical zone of vegetation forming as the altitude increased [45].

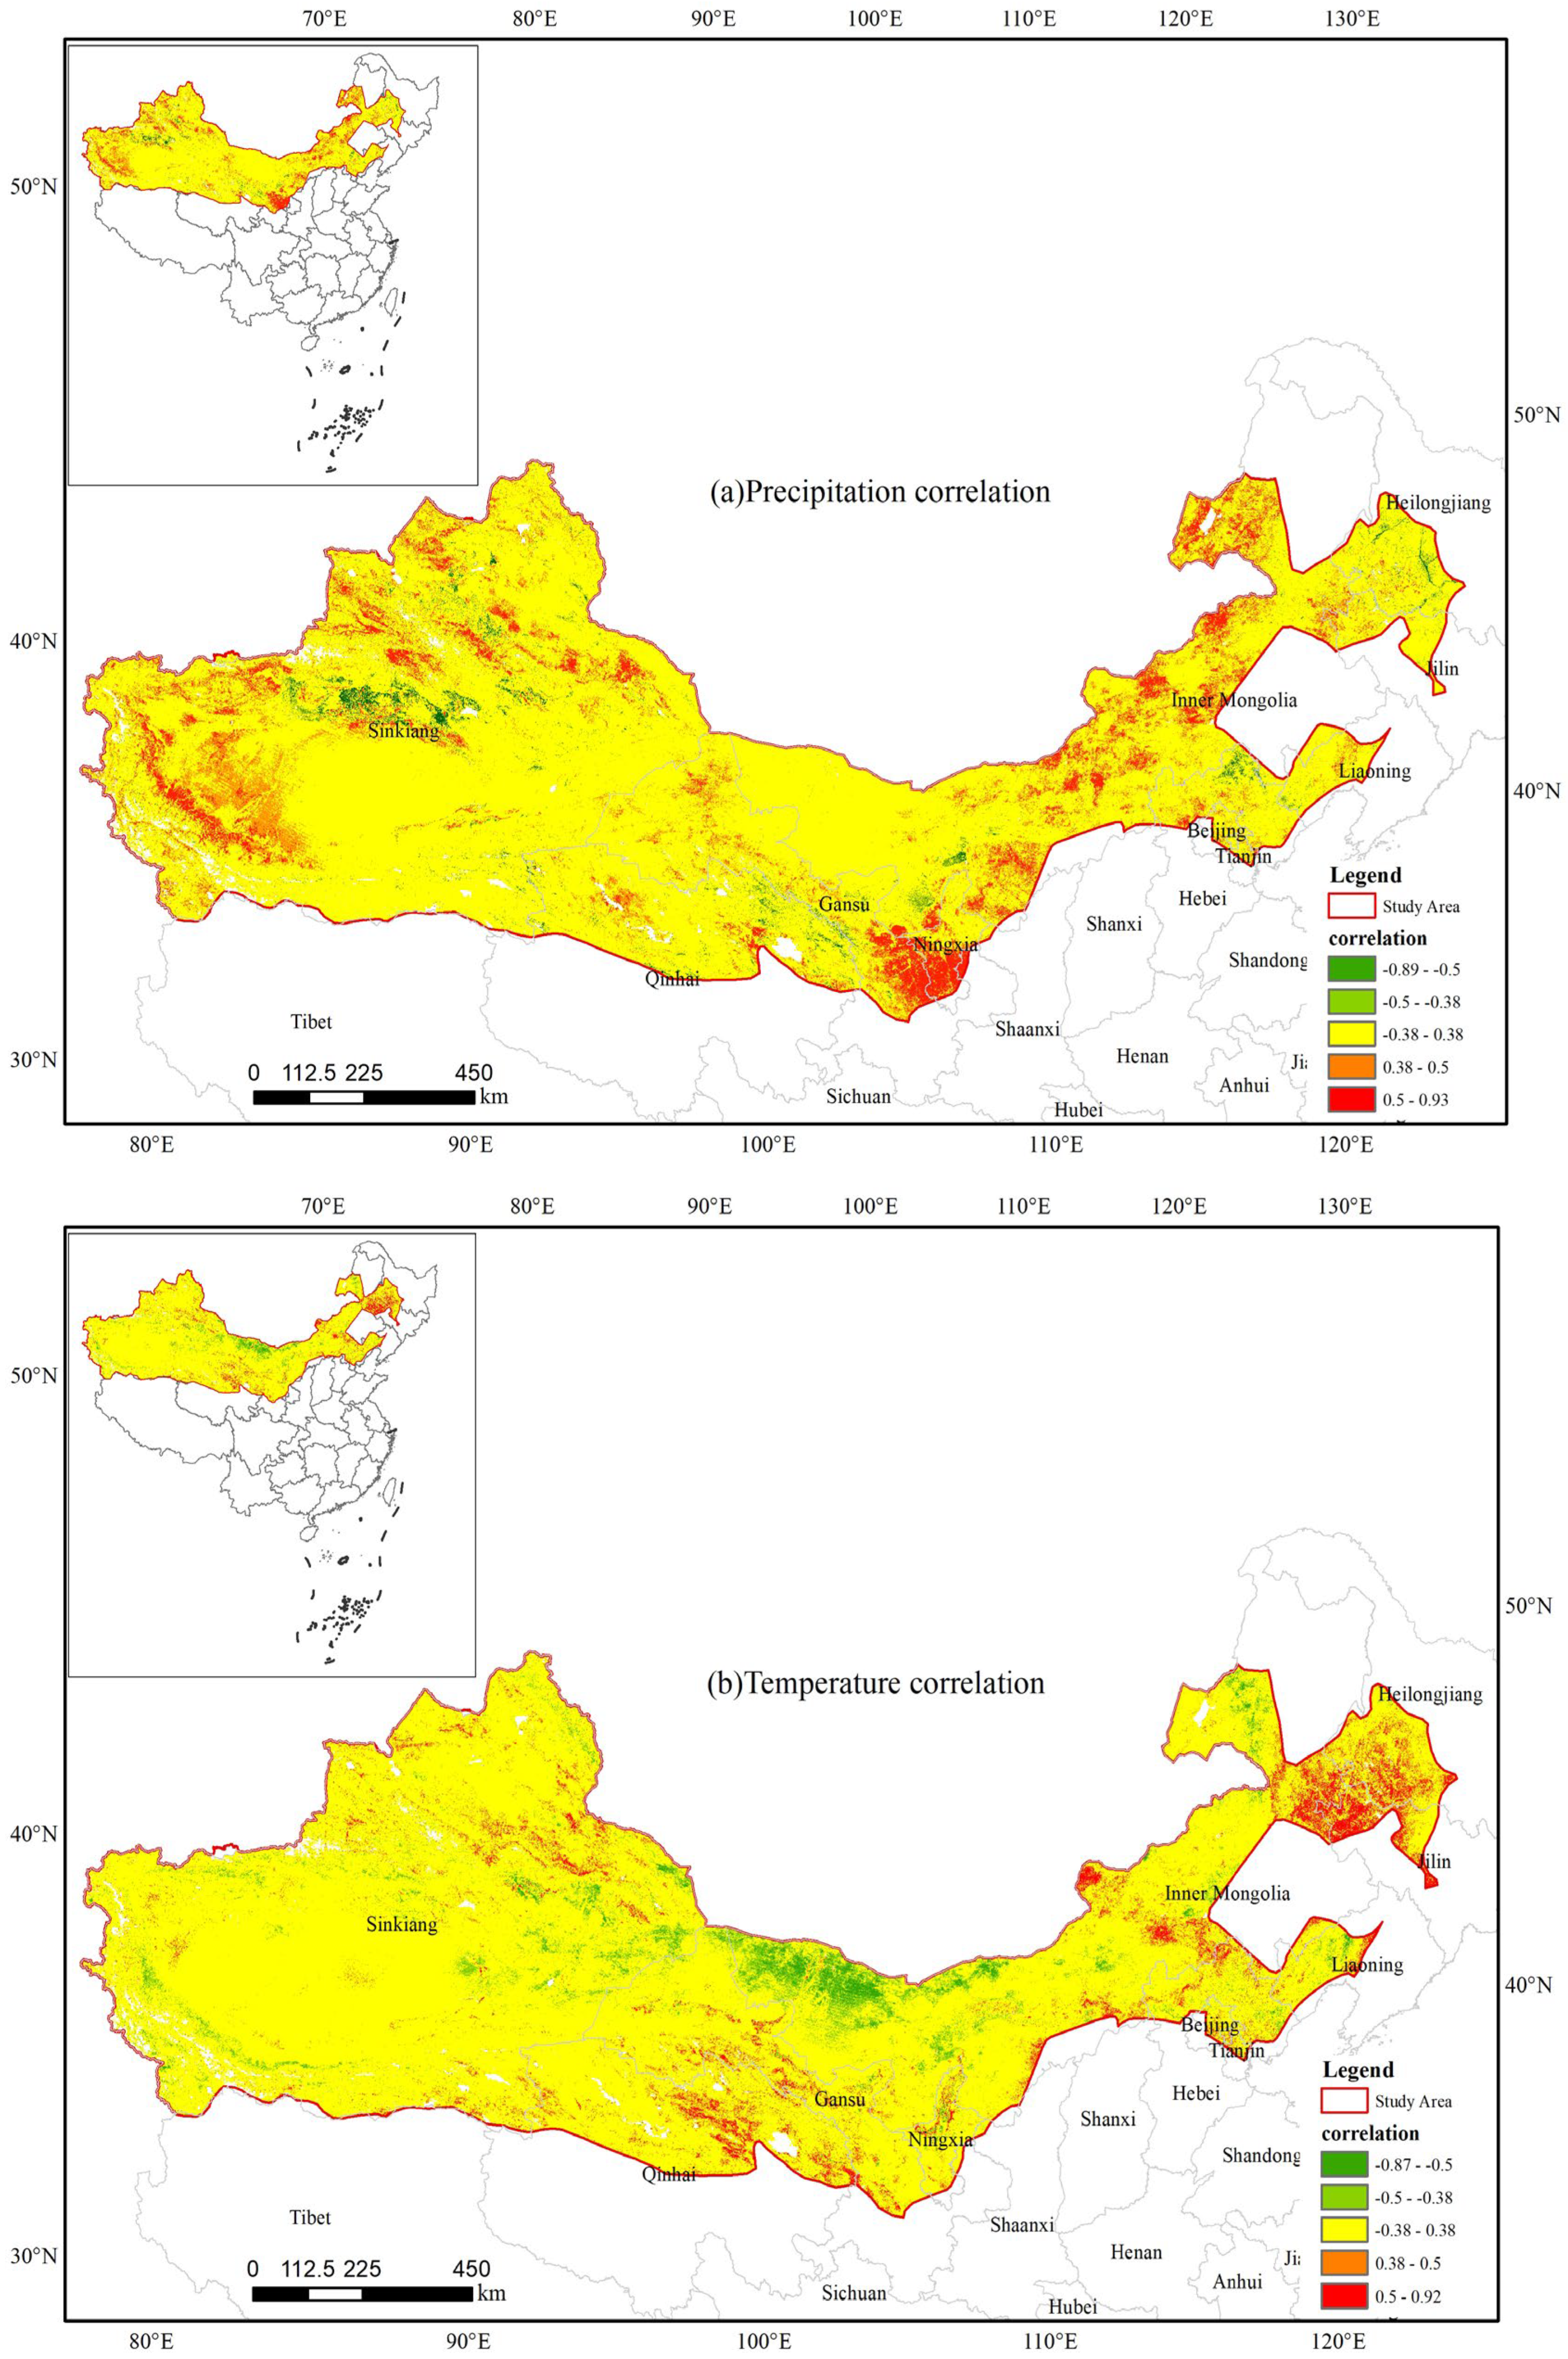
3.4. Factors Influencing Vegetation Cover Change

The correlation between vegetation cover and temperature and precipitation in the Three North Project areas was analyzed. The result is shown in Figure 12. In general, the proportion of regions with a positive correlation between vegetation cover and precipitation was significantly higher than that with a positive correlation between vegetation and temperature in the three northern protected forests. The areas with significant positive correlation with precipitation were mainly in the central and western part of Ningxia Hui Autonomous Region Zhongwei, Baiyin and Guyuan in southeastern Gansu, and Hulunbeier and Xilingolmeng in eastern Inner Mongolia. Areas showing low positive correlation were Hotan and Kashgar in the western Tarim Basin and Erdos, Baotou, Ulanqab, and Xilingolmeng in central Inner Mongolia. There was no negative correlation. A strong positive correlation was shown in most areas in Northwest China between precipitation and vegetation cover, and the temperature’s effect on vegetation growth was relatively weak [46]. There were relatively few areas with a positive correlation with temperature, including Baicheng City in Jilin Province and Xing’an Meng in Inner Mongolia. The correlation between vegetation cover and temperature in Northeast China was significantly higher than that between vegetation and precipitation, which is consistent with the study [47].
The area showing significant negative correlation was the northern part of Alashan League in western Inner Mongolia, and the areas showing low negative correlation included Alashan League in western Inner Mongolia and Bayannur City. Most of these regions are in arid or semi-arid areas, with high evaporation, high average annual temperature, and low precipitation, which accelerates the evapotranspiration process on the surface, resulting in serious water loss and soil drying; this has a strong inhibitory impact on vegetation growth [48]. In arid or semi-arid areas, precipitation is the main limiting factor affecting vegetation growth changes, while in mountainous or humid areas, where precipitation is abundant, the water conditions required for plant growth can be fulfilled [49]. The ecological benefits brought about by the construction of the three northern protected forests are now being seen, with the positive impacts outweighing the negative disturbances [50].
Our study found that the areas with low vegetation cover were mainly located in the desert and Gobi regions in the northwest, while the areas with high vegetation cover were concentrated in the northwestern part of Xinjiang, the northeastern Daxinganling region, and the southeastern part of the Loess Plateau, which are mostly woodlands, farmlands, and grasslands with rich vegetation cover and good growth. Cartographic analysis on land use change in the Three North Project areas was carried out, and the results are shown in Figure 13. In the last 20 years, the area of main vegetation coverage (forest land, grassland, and farmland) converted to other land types (rural and urban industrial areas, mining areas, residential lands, arable lands, water areas, etc.) was 430,274.3 km2, and the area of other land types converted to main vegetation coverage areas was 453,468.1 km2, with 23,193.8 km2 more transferred in than transferred out. Since the launch of the Three North Project, large-scale afforestation and ecological restoration have been carried out under the influence of government policies [51]. Xinjiang is a high-quality cotton production area, and the northeastern plain is a major grain production base in China. These areas are driven by policies and economic guidance around intensive farming, developed agriculture, and animal husbandry, and human activities play a constructive part in the increase in regional vegetation [52,53,54].

4. Discussion and Conclusions

Based on the Google Earth Engine cloud platform, this paper selected MODIS 3Q1 data from 2000–2020 and used the image element dichotomous model to estimate the vegetation cover (FVC) in the Three North Protection Forest Project area. We evaluated the stability and temporal and spatial variation of FVC and the coupling relationship between FVC and temperature and rainfall through evaluation indexes such as the slope of partial correlation coefficient and interannual variation. We then analyzed the impact of land use change on FVC. The results indicate that the trend in vegetation cover in the Three North Protection Forest Project area from 2000 to 2020 was mainly growth. The quantitative analysis of the topographic effect factor response relationship on the change in vegetation trend showed that the vegetation growth in the Three North Protection Forest Project area was suitable for the terrain-dominated interval. The best slopes for vegetation improvement were 5–9° and 9–13°, and the vegetation improvement effect was good at elevations between 2000–2500 m, with little change due to the slope direction. Changes in vegetation cover are influenced by many factors and complex mechanisms, and there are also time lag effects in the changes, which require long-term series and detailed data accumulation to clarify [55].
The transformation of different levels of vegetation cover types was characterized by the transformation from low-cover areas to high-cover areas. Climatic factors on the vegetation cover alterations in the research area were more influenced by precipitation.
Precipitation and temperature are the main climatic factors affecting vegetation growth, and on a large scale, climatic elements are often the main factors that determine the special distribution of vegetation cover [56]. Natural factors, however, are outweighed by the impact of human activities on vegetation in the short term in both speed and magnitude [57]. Over the past two decades, the vegetation cover of the Three North Project area has generally shown an increasing trend, due to the effective recovery of the vegetation in the area under the combined influence of policies and the natural environment. In contrast, the vegetation cover in Beijing and Tianjin has decreased, mainly due to the accelerated urbanization process, which has had a negative impact on vegetation growth [58]. On the other hand, the high correlation between vegetation cover and precipitation in the Three North Protection Forest Project area is found in many mountainous areas, which is due to the low human activity and the influence of precipitation. In contrast, irrigation conditions are needed in the plains, which are influenced by human activities [59]. Taken together, this shows the impact of human activity on the environment.
Most of the current studies on vegetation cover in the Three North Protection Forest Project area use correlation analysis to ascertain the influence of climatic factors on vegetation through simple correlation coefficients of temperature, precipitation, and NDVI, ignoring the interactions between human activity factors [27]. The process of the vegetation cover response to regional climate is very complex and limited by the sheer volume of work, which only considers the effects of temperature and precipitation on vegetation among climate factors. The method of estimating vegetation cover based on an image dichotomous model is simple and effective. Using background information such as soil type and vegetation type, fully considering the influence of background factors such as regional soil and vegetation type on NDVI, as well as analyzing and determining pure image elements by time and area, can effectively improve the spatial and temporal relevance of vegetation cover calculations. At the same time, the method cannot reveal the ecological and physical processes embodied in vegetation cover, which is similar to the shortcomings of the meta-dichotomous method itself. In the future, a comparative analysis and mutual validation can be carried out in combination with relevant remote sensing ecological mechanism models [35].
The method adopted in this paper is a reference point for the estimation of vegetation cover and the analysis of its topographic slope effect on a large scale and even on a national scale. In the future, remote sensing images with higher spatial resolution will be combined with field surveys to further improve the accuracy of vegetation inversions. As we only measured the impact of human activities on vegetation based on land use data, other human activities were not considered. In future studies we will add and refine the impact of different human activities on vegetation cover, and the driving factors such as evapotranspiration, soil, and sunlight will be considered comprehensively. In addition, in the future we will analyze the intensity of the different classes of vegetation cover [60] and conduct spatial autocorrelation analysis [61].
It is suggested that the pursuit of green quantity should be transformed into the pursuit of quality in the regions with high vegetation coverage in the project area of the three north shelterbelts (east of Inner Mongolia and the western Tianshan Mountains of Xinjiang) to create high-quality projects and to strengthen the effective protection of the existing afforestation achievements.

Author Contributions

X.L. and Q.H.: methodology, software, and writing—original draft preparation; Z.Z.: conceptualization, writing—review and editing, project administration, and funding acquisition; D.Z. and Y.S.: investigation, data curation, and visualization; Y.Z. and H.L.: writing—review and editing, supervision, and project administration; B.V., X.N., D.C. and Y.L.: data curation, writing—review and editing, visualization, and software. All authors have read and agreed to the published version of the manuscript.

Funding

This research was funded by the National Natural Science Foundation of China (41761036), the Major Science and Technology Project of Anhui Province (202003a06020002), the Natural Science Research Project of Universities in Anhui Province (KJ2021A1063), the Outstanding Youth Scientific Research Project in Anhui Province (2022AH020069), the Major Science and Technology Project of High-Resolution Earth Observation System (76-Y50G14-0038-22/23), the Key Research and Development Program of Anhui Province (2021003; 2022107020028) and the Science and Technology Plan Project of Chuzhou City (2021ZD013).

Data Availability Statement

The data and algorithm code presented in this study are available on request from the corresponding author.

Conflicts of Interest

The authors declare no conflict of interest.

References

  1. Fernández, R.J. Do humans create deserts? Trends Ecol. Evol. 2002, 17, 6–7. [Google Scholar] [CrossRef]
  2. Wang, M.; Lyu, Y.; Wu, C. International Research Progress of Land Degradation Neutrality and Its Implications in China. China Land Sci. 2020, 34, 64–74. [Google Scholar]
  3. Jiang, Z. Integrated Ecosystem Management of Degraded Lands in Western China-Presentation at the 2005 Annual Academic Conference of the Chinese Association for Science and Technology. World For. Res. 2005, 5, 3–6. [Google Scholar] [CrossRef]
  4. Huang, S.; Li, X.; Wu, B.; Pei, L. Analysis of land degradation and driving forces in the Three North Protection Forest Project area in the past 25 years. Acta Geogr. Sin. 2012, 67, 589–598. [Google Scholar]
  5. Baozhang, C.; Guang, X.; Nicholas, C.C.; Philippe, C.; Ranga, B.M. Satellite-observed changes in terrestrial vegetation growth trends across the Asia-Pacific region associated with land cover and climate from 1982 to 2011. Int. J. Digit. Earth 2016, 9, 1055–1076. [Google Scholar] [CrossRef]
  6. Zhu, C.; LI, J.; Shen, Z.; Shen, Q. Spatiotemporal dynamics of vegetation activities in the lower reach of the Tarim River based on MODIS intensive time series data. Resour. Sci. 2019, 41, 591–600. [Google Scholar]
  7. Senseman, G.M.; Bagley, C.F.; Tweddale, S.A. Correlation of rangeland cover measures to satellite-imagery-derived vegetation indices. Geocarto Int. 1996, 11, 29–38. [Google Scholar] [CrossRef]
  8. Zhang, Y.; Li, X.; Chen, H. A review of multi-scale remote sensing and field measurement methods for grassland vegetation cover. Adv. Earth Sci. 2003, 18, 85–93. [Google Scholar]
  9. Han, J. Change of Fractional Vegetation Cover in Northeast Asia from 2000 to 2011. Master’s Thesis, Northeast Institute of Geography and Agroecology, Chinese Academy of Sciences, Harbin, China, 2012. [Google Scholar]
  10. Duo, A.; Zhao, W.; Gong, Z.; Zhang, M.; Fan, Y. Temporal analysis of climate change and its relationship with vegetation cover on the north china plain from 1981 to 2013. Acta Ecol. Sin. 2017, 37, 576–592. [Google Scholar]
  11. Zhong, Q.; Hu, J.; Kang, J. Study on vegetation coverage in daning mining area based on pixel dichotomy. Met. Mine 2021, 11, 197–203. [Google Scholar] [CrossRef]
  12. Zhu, L. Study on the Spatial-Temporal Variation of Vegetation Coverage and Karst Rocky Desertification Based on MODIS Data. Ph.D. Thesis, Southwest University, Chongqing, China, 2018. [Google Scholar]
  13. Liu, C.; Zhang, L.; Zhou, Y.; Zhang, B.; Hou, X. Retrieval and analysis of grassland coverage in arid Xinjiang, China and five countries of Central Asia. Pratacultural Sci. 2016, 33, 861–870. [Google Scholar]
  14. Liu, R.; Xu, L.; Feng, F.; Liu, Y.; Zhang, X. Spatiotemporal Variation of Vegetation Coverage in Wuhai City from 2000 to 2018. Res. Soil Water Conserv. 2022, 29, 265–273. [Google Scholar] [CrossRef]
  15. Tong, S.; Bao, Y.; Zhang, Q.; Du, W. Spatiotemporal changes of vegetation coverage in inner mongolia based on the dimidiate pixel model and intensity analysis. Ecol. Environ. Sci. 2016, 25, 737–743. [Google Scholar] [CrossRef]
  16. Yi, Y.; Hu, X.; Shi, M.; Kang, H.; Wang, B.; Zhang, C.; Liu, C. Vegetation dynamics and its relationship with climate factors in the middle reaches of the Yangtze River Based on MODIS NDVI. Acta Ecol. Sin. 2021, 41, 7796–7807. [Google Scholar]
  17. Li, M.; Yin, L.; Zhang, Y.; Su, X.; Liu, G.; Wang, X.; Ao, Y.; Wu, X. Spatio-temporal dynamics of fractional vegetation coverage based on MODIS-EVI and its driving factors in Southwest China. Acta Ecol. Sin. 2021, 41, 1138–1147. [Google Scholar]
  18. Sang, G.; Tang, Z.; Deng, G.; Guan, Q.; Chen, H.; Li, C.; Wang, X. Study on vegetation change in hunan province based on MODIS NDVI time series data. Resour. Environ. Yangtze Basin 2021, 30, 1100–1109. [Google Scholar]
  19. Long, S.; Guo, Z.; Xu, L.; Zhou, H.; Fang, W.; Xu, Y. Spatiotemporal Variations of Fractional Vegetation Coverage in China based on Google Earth Engine. Remote Sens. Technol. Appl. 2020, 35, 326–334. [Google Scholar]
  20. Gorelick, N.; Hancher, M.; Dixon, M.; Ilyushchenko, S.; Thau, D.; Moore, R. Google Earth Engine: Planetary-scale geospatial analysis for everyone. Remote Sens. Environ. 2017, 202, 18–27. [Google Scholar] [CrossRef]
  21. Stefanidis, S.; Alexandridis, V.; Mallinis, G. A cloud-based mapping approach for assessing spatiotemporal changes in erosion dynamics due to biotic and abiotic disturbances in a Mediterranean Peri-Urban forest. Catena 2022, 218, 106564. [Google Scholar] [CrossRef]
  22. Gemitzi, A.; Koutsias, N. A Google Earth Engine code to estimate properties of vegetation phenology in fire affected areas–A case study in North Evia wildfire event on August 2021. Remote Sens. Appl. Soc. Environ. 2022, 26, 100720. [Google Scholar] [CrossRef]
  23. Liu, X.; Hu, G.; Chen, Y.; Li, X.; Xu, X.; Li, S.; Pei, F.; Wang, S. High-resolution multi-temporal mapping of global urban land using Landsat images based on the Google Earth Engine Platform. Remote Sens. Environ. 2018, 209, 227–239. [Google Scholar] [CrossRef]
  24. Shao, Y.; Wang, L.; Zhu, C.; Fang, H.; Zhang, X.; Huang, D.; Tao, L. Forest survey and spatio-temporal analysis in West Tianshan mountains supported by Google Earth Engine. Bull. Surv. Mapp. 2020, 8, 13. [Google Scholar]
  25. Zhang, Y.; Peng, C.; Li, W.; Tian, L.; Zhu, Q.; Chen, H.; Fang, X.; Zhang, G.; Liu, G.; Mu, X.; et al. Multiple afforestation programs accelerate the greenness in the ‘Three North’ region of China from 1982 to 2013. Ecol. Indic. 2016, 61, 404–412. [Google Scholar] [CrossRef]
  26. Wang, Y.; Zhang, C.; Liu, C.; Liu, C.; Zhen, L. Research on the pattern and change of forest water conservation in Three-North Shelterbelt Forest Program region, China. Acta Ecol. Sin. 2019, 39, 5847–5856. [Google Scholar]
  27. Xie, S.; Mo, X.; Hu, S.; Chen, X. Responses of vegetation greenness to temperature and precipitation in the Three-North Shelter Forest Program. Geogr. Res. 2020, 39, 152–165. [Google Scholar]
  28. Zhang, Z.; Liu, L.; Jia, Y.; Li, X. Climatic ecological adaptation of shelter forests in Three-North Regions. Chin. J. Ecol. 2009, 28, 1696–1701. [Google Scholar]
  29. Shen, Y.; Zhang, M. The characteristics of land resources in the “Three Norths” protective forest areas of China and the rational layout of the protective forest system. Resour. Sci. 1993, 5, 21–27. [Google Scholar]
  30. Li, K.; Sun, Y.; Jiang, B.; Guo, J.; Wang, Y.; Yue, D. Analysis on spatial-temporal patterns of the vegetation coverage and landslides in Bailongjiang River Basin based on the Dimidiate Pixel Model. J. Lanzhou Univ. (Nat. Sci.) 2014, 50, 376–382. [Google Scholar] [CrossRef]
  31. He, Q.; Wang, M.; Liu, K.; Li, K.; Jiang, Z. GPRChinaTemp1km: A high-resolution monthly air temperature dataset for China (1951–2020) based on machine learning. Earth Syst. Sci. Data Discuss. 2021, 2021, 1–29. [Google Scholar] [CrossRef]
  32. Qu, L.; Zhu, Q.; Zhu, C.; Zhang, J. Monthly Precipitation Data Set with 1 km Resolution in China from 1960 to 2020. 2022. Available online: https://www.scidb.cn/en/detail?dataSetId=ff7ee051d2d44ab4a221cd810bf37251&dataSetType=personal (accessed on 5 September 2022).
  33. Xu, X.; Liu, J.; Zhang, S.; Li, R.; Yan, C.; Wu, S. Multi-Period Land Use Land cover Remote Sensing Monitoring Dataset in China (CNLUCC). 2018. Available online: https://www.resdc.cn/ (accessed on 5 September 2022).
  34. Liu, J.; Zhang, Z.; Xu, X.; Kuang, W.; Zhou, W.; Zhang, S.; Li, R.; Yan, C.; Yu, D.; Wu, S.; et al. Spatial patterns and driving forces of land use change in China during the early 21st century. J. Geogr. Sci. 2010, 20, 483–494. [Google Scholar] [CrossRef]
  35. Ma, N.; Hu, Y.; Zhuang, D.; Zhang, X. Vegetation coverage distribution and its changes in plan blue banner based on remote sensing data and dimidiate pixel model. Sci. Geogr. Sin. 2012, 32, 251–256. [Google Scholar] [CrossRef]
  36. Zhang, Z.; Liu, H.; Zuo, Q.; Yu, J.; Li, Y. Spatiotemporal change of fractional vegetation cover in the Yellow River Basin during 2000–2019. Resour. Sci. 2021, 43, 849–858. [Google Scholar]
  37. Wu, Z.; He, G.; Huang, S.; Wang, M.; Lin, J. Terrain effects assessment on remotely sensed fractiona vegetation cover in hilly area of southern China. J. Remote Sens. 2017, 21, 159–167. [Google Scholar]
  38. Wang, Q.; Zhang, B.; Dai, S.; Zou, Y.; Ma, Z.; Zhang, Y. Dynamic Changes in Vegetation Coverage in the Three-North Shelter Forest Program Based on GIMMS AVHRR NDVI. Resour. Sci. 2011, 33, 1613–1620. [Google Scholar]
  39. Wu, Y.; Cao, Y.; Wu, B.; Li, X.; Wu, W. Retrievaland analysis of vegetation cover in the Three-North Regions of Chna based on MODIS data. Chin. J. Ecol. 2009, 28, 1712–1718. [Google Scholar]
  40. Kang, X.; Cao, J.; Chen, C.; Yang, J.; Wang, J. Analysis of long-term vegetation change in Ningxia with different trend methods. Bull. Surv. Mapp. 2020, 11, 23–27. [Google Scholar] [CrossRef]
  41. Hong, H.; Li, X.; Li, X.; Yu, F.; Yu, H.; Yang, H. The correlation between meteorological factors and NDVI in northeastern China. J. Beijing Norm. Univ. (Nat. Sci.) 2005, 41, 425–430. [Google Scholar]
  42. Luo, H.; Yang, C. Analysis of land-use change and its driving forces in Sichuan province from 2005 to 2015. Ecol. Sci. 2021, 40, 86–94. [Google Scholar] [CrossRef]
  43. Liu, R.; Zhu, D. Methods for Detecting Land Use Changes Based on the Land Use Transition Matrix. Resour. Sci. 2010, 32, 1544–1550. [Google Scholar]
  44. Meng, S.; Xie, X.; Zhu, B.; Wang, Y. The relative contribution of vegetation greening to the hydrological cycle in the Three-North region of China: A modelling analysis. J. Hydrol. 2020, 591, 125689. [Google Scholar] [CrossRef]
  45. LI, J.; Gong, c. Effects of Terrain Factors on Vegetation Cover Change in National Park of Qilian Mountains. Bull. Soil Water Conserv. 2021, 41, 228–237. [Google Scholar] [CrossRef]
  46. Zhou, M.; Li, J.; Zhu, K. Changes of NDVI in Different Regions of Northwest Area and Its Responses to Climate Factor. Res. Soil Water Conserv. 2015, 22, 182–187. [Google Scholar] [CrossRef]
  47. Shen, X.; Wu, Z.; Du, H. Variation of vegetation in the Northeast China and its response to meteorological factors. J. Northeast. Norm. Univ. (Nat. Sci. Ed.) 2013, 45, 123–130. [Google Scholar]
  48. Wang, Q.; Zhang, B.; Dai, S.; Zhang, F.; Zhao, Y.; Yin, H.; He, X. Analysis of the vegetation cover chang and its relationship with factors in the Three-North Shelter Forest Program. China Environ. Sci. 2012, 32, 1302–1308. [Google Scholar]
  49. Jin, C.; Yang, X.; Jing, H. A RS-based study on changes in fractional vegetation cover in North Shaanxi and their driving factors. Remote Sens. Nat. Resour. 2021, 33, 258–264. [Google Scholar]
  50. Cao, S.; Suo, X.; Xia, C. Payoff from Afforestation under the Three-North Shelter Forest Program. J. Clean. Prod. 2020, 256, 120461. [Google Scholar] [CrossRef]
  51. Mu, H.; Li, X.; Ma, H.; Du, X.; Huang, J.; Su, W.; Yu, Z.; Xu, C.; Liu, H.; Yin, D.; et al. Evaluation of the policy-driven ecological network in the Three-North Shelterbelt region of China. Landsc. Urban Plan. 2022, 218, 104305. [Google Scholar] [CrossRef]
  52. Li, X.; Shi, Q.; Chang, S.; Guo, J.; Dara, B.; Qi, J. Change of NDVI based on NOAA image in northwest arid area of China in 1981–2001. Arid. Land Geogr. 2008, 31, 940–945. [Google Scholar] [CrossRef]
  53. Hu, S.; Liu, J.; Mao, X. Extraction and change of vegetation coverage of 2007-2010 in Northeast China. J. Northeast. For. Univ. 2017, 45, 45–50. [Google Scholar] [CrossRef]
  54. Shao, S.; Shi, Q. Spatial and temporal change of vegetation cover in Xinjiang based on FVC. Sci. Silvae Sin. 2015, 51, 35–42. [Google Scholar]
  55. Zhang, J.; Feng, Z.; Jiang, L.; Yang, Y. Analysis of the Correlation between NDVI and Climate Factors in the Lancang River Basin. J. Nat. Resour. 2015, 30, 1425–1435. [Google Scholar]
  56. He, Y.; Fan, G.; Zhang, X.; Liu, M.; Gao, D. Variation of vegetation NDVI and its response to climate change in Zhejiang Province. Acta Ecol. Sin. 2012, 32, 4352–4362. [Google Scholar] [CrossRef]
  57. Zhou, H.; Wang, J.; Yue, Y.; Li, R. Research on spatial pattern of human-induced vegetation degradation and restoration:a case study of Shaanxi Province. Acta Ecol. Sin. 2009, 29, 4847–4856. [Google Scholar]
  58. Wang, J.; Zhou, W.; Xu, K.; Yan, J. Spatiotemporal pattern of vegetation cover and its relationship with urbanization in Beijing-Tianjin-Hebei megaregion from 2000 to 2010. Acta Ecol. Sin. 2017, 37, 7019–7029. [Google Scholar]
  59. Zhao, J.; Zhou, Y.; Deng, X. Temporal-spatial dynamic change characteristics of vegetation coverage in arid regions of Northwest China. For. Resour. Manag. 2017, 1, 118–126. [Google Scholar] [CrossRef]
  60. Wang, Y.; Ding, J.; Li, X.; Zhang, J.; Ma, G. Impact of LUCC on ecosystem services values in the Yili River Basin based on an intensity analysis model. Acta Ecol. Sin. 2022, 42, 3106–3118. [Google Scholar]
  61. Shao, Y.; Wang, Z.; Feng, Z.; Sun, L.; Yang, X.; Zheng, J.; Ma, T. Assessment of China’s forest fire occurrence with deep learning, geographic information and multisource data. J. For. Res. 2022, 6, 1–14. [Google Scholar] [CrossRef]
Figure 1. Location of study area.
Forests 14 00295 g001
Figure 2. Interannual trends in average FVC in the Three North Protection Forest Project area from 2000 to 2020.
Forests 14 00295 g002
Figure 3. Spatial distribution of vegetation cover in the Three North Protection Forest Project area (0–0.4 is low cover, 0.4–0.6 is medium vegetation cover, 0.6–1 is high vegetation cover).
Forests 14 00295 g003
Figure 4. Vegetation cover grading chart.
Forests 14 00295 g004
Figure 5. Trends in vegetation cover in the Three Norths Project area (less than −0.005 indicates significant decrease, −0.005~−0.002 indicates mild decrease, −0.002~0.002 indicates basically unchanged, 0.002~0.005 indicates mild increase, and greater than 0.005 indicates significant increase).
Forests 14 00295 g005
Figure 6. Percentage of FVC on different slopes in the Three North Protection Forest Project area.
Forests 14 00295 g006
Figure 7. Vegetation cover change statistics of different slopes in the Three North Protection Forest Project area.
Forests 14 00295 g007
Figure 8. Percentage of FVC in different slope directions in the Three North Protection Forest Project area.
Forests 14 00295 g008
Figure 9. Vegetation cover change statistics of different slope orientations in the Three North Protection Forest Project area.
Forests 14 00295 g009
Figure 10. Percentage of FVC at different elevations in the Three North Protection Forest Project area.
Forests 14 00295 g010
Figure 11. Vegetation cover change statistics at different elevations in the Three North Protection Forest Project area.
Forests 14 00295 g011
Figure 12. Distribution of correlation coefficients between vegetation cover and temperature and precipitation in the Three North Project areas from 2000 to 2020 (first: precipitation correlation, second: temperature correlation).
Forests 14 00295 g012
Figure 13. Land use change map.
Forests 14 00295 g013
Disclaimer/Publisher’s Note: The statements, opinions and data contained in all publications are solely those of the individual author(s) and contributor(s) and not of MDPI and/or the editor(s). MDPI and/or the editor(s) disclaim responsibility for any injury to people or property resulting from any ideas, methods, instructions or products referred to in the content.

