Article

Effect of Pressurized Hydrothermal Treatment on the Properties of Cellulose Amorphous Region Based on Molecular Dynamics Simulation

College of Engineering and Technology, Northeast Forestry University, Harbin 150040, China
*
Author to whom correspondence should be addressed.
Forests 2023, 14(2), 314; https://doi.org/10.3390/f14020314
Submission received: 3 January 2023 / Revised: 1 February 2023 / Accepted: 2 February 2023 / Published: 5 February 2023
(This article belongs to the Special Issue Lignocellulosic Fiber-Based Composites)

Abstract

:
Based on Materials Studio software, a cellulose chain with a polymerization degree of 20 and several water molecules were constructed to form a cellulose amorphous region–water model. The effect of pressure on the wood properties during hydrothermal treatment was investigated to explain the changes in the macroscopic properties from a microscopic perspective, thus providing a theoretical basis for wood heat treatment research. In this study, we performed dynamic simulations at atmospheric pressure (0.1 MPa) and pressurized (0.2 MPa, 0.4 MPa, and 0.6 MPa) conditions under a combination of NPT. In addition, five aspects were analyzed in terms of energy change: cell parameters and density, cellulose mean square displacement, number of hydrogen bonds, and mechanical properties. The results showed that pressurized hydrothermal treatment increased the densification of the wood, decreased the volume, and increased the density. As the pressure increased, the difference between the average value of the nonbond energy and the total potential energy gradually decreased, the bond energy decreased, and the interatomic repulsive force within the molecule gradually weakened. The increase in the number of hydrogen bonds enhanced the restraining effect on the arrangement of cellulose molecular chains and slowed down the movement of the cellulose chains. Young’s modulus (E) and shear modulus (G) increased with increasing pressure, and Poisson’s ratio ( γ ) and K/G decreased with increasing pressure during the pressurized hydrothermal treatment of wood. The pressurized hydrothermal treatment increased the stiffness and decreased the toughness of the wood compared with those of the model with atmospheric pressure hydrothermal treatment.

1. Introduction

Wood is widely used as a renewable and green material due to its abundant raw materials and workability. Wood products are hygroscopic materials and are thus prone to wet rise and dry shrinkage under natural conditions, which affect the dimensional stability of wood products. Therefore, modification of natural wood can improve its quality [1]. Heat treatment is the most typical form of wood alteration [2]. The concept of heat treatment was first introduced by Stamm in 1946 [3]. Since then, wood heat treatment has been extensively studied and continuously improved by scholars to enhance the quality and use of wood [4].
Heat treatment changes the internal structure and composition of wood, resulting in decreased water absorption, which helps to increase the stability of wood in wet environments [5]. The effects of heat treatment on the chemical composition of the modified material and on the structure of the wood were investigated, and it was found that the thermal modification process resulted in a more hydrophobic and dimensionally stable wood, providing protection against decomposition factors [6]. Heat treatments use physical means to treat wood, which is less costly and easier to produce on a large industrial scale than with chemical modification.
Heat treatment often uses heat transfer media such as water vapor, inert gas, and nitrogen to physically modify wood by subjecting it to high temperatures ranging from 150 to 240 °C [7]. Existing heat treatment studies have focused on the effects of temperature and transfer media on wood, and a few scholars have also explored the effects of pressure on wood heat treatment. When pressure is used as a variable in the heat treatment process: it can be classified into atmospheric pressure heat treatment (0.1 MPa) and pressure heat treatment (pressurized or negative pressure) [8,9,10]. In recent years, wood heat treatment under pressure was carried out by Tao et al. [11], who compared the effects of wood heat treatment of Pinus sylvestris var. mongolica and Quercus mongolica Fisch under atmospheric pressure and pressure conditions using a steam medium at a certain pressure. In 2005, Qi et al. studied the mechanical properties and chemical composition of wood treated with superheated steam at high temperatures (80 to 180 °C) and pressure (3 MPa) [12]. The study showed that after superheated steam treatment, the compressive strength of the wood did not greatly change, while the chemical composition slightly changed. Jiang used pressurized steam media for heat treatment of wood, with pressures generally below 0.6 MPa, where the overall strength of wood gradually increased with increasing pressure in the treatment kiln at a certain treatment temperature [13,14]. By using pressure steam as the heat treatment medium, the final moisture content of the wood significantly increased when the wood was treated in high-temperature orpressure steam [15], which reduced the time required for heat treatment and subsequent moisture conditioning, and saves energy. The changes in wood properties after pressure steam heat treatment were the focus of the research.
Wood’s primary constituent, cellulose, which dictates both its structural and physical characteristics, is a polymeric substance made by polymerizing D-glucopyranose rings. It has both crystalline and noncrystalline areas. The crystalline region has good mechanical properties, even at high temperatures, because it has a neat and regularly arranged structure. Small molecules poorly interact with the crystalline area and struggle to break the link between the cellulose strands [16]. The amorphous region has a more irregular structure and is prone to structural changes through temperature or small gas molecules. In addition to its irregular structure, the amorphous cellulose region has good flexibility, and its mechanical properties are more susceptible to the influence of temperature. In order to explore the patterns of change in wood during heat treatment, the amorphous area of cellulose was selected as the focus in this research.
Molecular dynamics is a method to study the motion of molecular models from a microscopic perspective, allowing for more intuitive simulation of changes that are not visible in macroscopic experiments [17,18]. Qi used molecular dynamics to simulate the effect of temperature on the mechanical state of nitrocellulose (NC)/nitroglycerol (NG) blends [19]. The results showed that the mechanical state of the NC/NG blended system mainly depended on the free volume required for chain segment motion, the thermal motion ability, and the interaction force between the NC/NG molecules. In order to study the aging mechanism of transformer insulation paper from a more in-depth microscopic perspective, Zhu investigated the thermodynamic properties of the amorphous region of cellulose at different temperatures using molecular dynamics simulation [20]. The results showed that the temperature had a greater influence on the cellulose amorphous region than on the crystalline region. MDS is known to establish macro- and microscopic linkages, but few studies on the internal organization and mechanical properties of wood have been performed by this method in wood heat treatment.
In this study, molecular dynamics simulations were used to examine the effects of pressurized hydrothermal treatment on the properties of amorphous cellulose regions, which is essential for improving wood utilization. Under the controlled environment of pressurized hydrothermal treatment, a model of cellulose at certain humidity and temperature was developed and used to analyze the microscopic mechanism of the effect of pressure on properties of cellulose amorphous regions. In addition, the model was analyzed based on the properties of energy changes, cell parameters, mean square displacement, mechanical parameters, and hydrogen bonding. The effects of heat treatment on wood could be simulated from a microscopic point of view to more intuitively explain how it acts on the wood’s main component, cellulose.

2. Materials and Methods

2.1. Model Establishment

The amorphous cellulose region–water model was built using Materials Studio software 2019 (BIOVIA, San Diego, CA, USA). Materials Studio is a new generation of materials computing software developed by Accelrys specifically for the materials science field. It enables easy 3D molecular modeling and in-depth analysis of organic crystals, inorganic crystals, amorphous materials, and polymers. The design and modification of polymer materials by molecular simulation technology can shorten the experimental period, improve efficiency, and reduce costs. The water molecule model was constructed using the amorphous polymer construction system, while the amorphous region of cellulose was created using the amorphous cell module [21]. Cellulose chains with a degree of polymerization of 20 were chosen because there was no major difference in the effects of the degree of polymerization on the cellulose amorphous region [22]. We chose 1.5 g/cm3 as the model’s goal density [23]. The amorphous cellulose region–water model was set to contain 7% water [24], i.e., the obtained model measured 20.1 × 20.1 × 20.1 nm. Cellulose molecules are displayed in stick mode, while water molecules are displayed in ball-and-stick mode. White and red spheres represent the hydrogen and oxygen atoms, respectively. Figure 1 contains 29 water molecules.

2.2. Dynamic Simulation

In this study, the PCFF force field is was [18], which is suitable for simulating polymeric materials and particularly natural polymeric materials, which served as the foundation for all simulations in this study. Following the construction of the model shown in Figure 1, the initial geometry optimization was carried out using the computational options in the Forcite module. To achieve energy minimization, the first step was to simulate 5000 steps using intelligent algorithms to relax molecules throughout the model [22]. At a temperature of 25 °C, the model was then subjected to an initial kinetic relaxation in a macroscopic rule (NVT) system synthesis. Next, we set the initial speed randomly and output a frame every 5000 steps. The time step as set to 1 fs, and the entire simulation duration was 1 ns. Following model relaxation, the system tended to occur in a lower energy steady state, allowing for further simulations to be run. This process reduced the initial internal stress.
The wood heat treatment was simulated at a temperature of 473.15 K, at atmospheric pressure (0.1 MPa), and in pressurized conditions (0.2 MPa, 0.4 MPa, and 0.6 MPa). Dynamics simulation was performed for 1 ns under isothermal isobaric system synthesis (NPT). The pressure was controlled by the Berendsen method. The calculation method used in the system is based on the calculation of atomic van der Waals forces and electron summation with the Ewald method [25,26,27,28].

3. Results and Discussion

3.1. Energy

3.1.1. System Energy

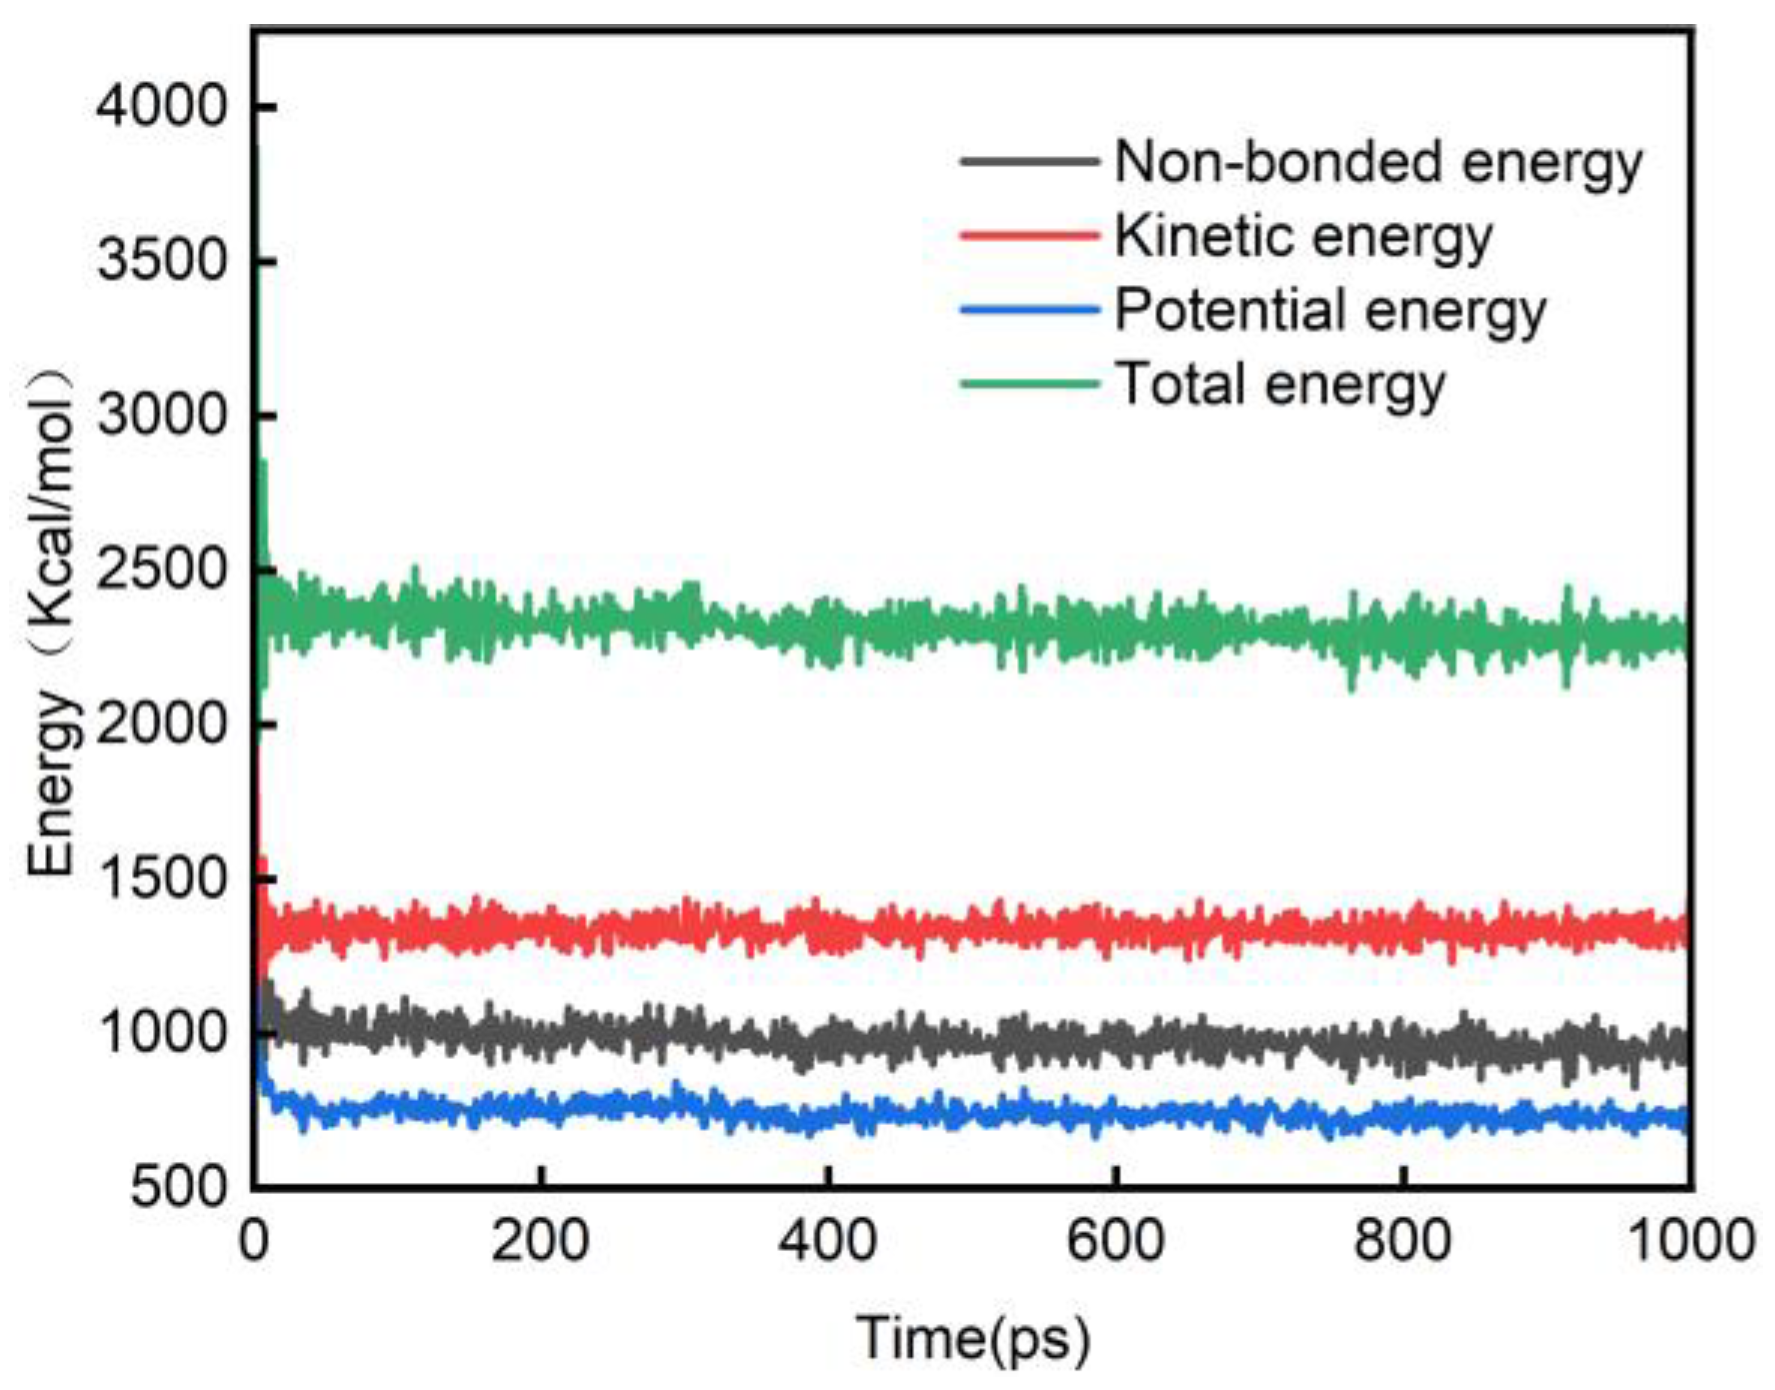
The values of temperature and energy changes over time can be used to assess whether a system is in equilibrium in molecular dynamics simulations [29]. After the dynamics simulation of the amorphous cellulose region–water model for 1 ns, the energy and temperature fluctuations of the system with time were as shown in Figure 2 and Figure 3. The energy fluctuations of the amorphous cellulose region–water model at atmospheric pressure (0.1 MPa) are used as an example.
As shown in Figure 2, the energy (total) value of the system fluctuated above and below its average value in the last 200 ps of the simulation, and the average value of its fluctuation was 2.01%.
Furthermore, Figure 3 shows that the temperature variance over time during the simulation was minimal and essentially under control within a range of 25 K. As a result, the fluctuation was within the normal range, which indicated that the system as in equilibrium.

3.1.2. Total Potential Energy and Nonbonding Energy

The force field chosen in this study was PCFF, which has a complex expression for the total potential energy [30,31], which can be simply expressed as Equation (1).
E total = E cross + E internal + E nonbond
where E nonbond represents the nonbonding energy term, E cross + E internal represents the bonding energy term, and Equation (1) states that the system’s total potential energy is equal to the sum of its bonding and nonbonding energies. The non-bond energy includes hydrogen bonding, electrostatic interaction and van der Waals interaction. During the dynamics simulation, when the gap between total potential energy and nonbond energy varies as pressure increased, the bond energy at that time also changed. When the bond energy was positive, the repulsive force between the atoms within the molecule as greater than the attractive force. When the bond energy as negative, the attractive forces between the atoms within the molecule were greater than the repulsive forces.
The values in Figure 4 are the average values of total potential energy and nonbond energy under four different pressure models. It can be found that the mean value of total potential energy is greater than the mean value of nonbond energy in the overall data, indicating that the mean value of bond energy is positive. As shown in Table 1, as the pressure increases, the difference between the mean value of nonbond energy and the total potential energy gradually decreases, and the interatomic repulsive force within the molecule gradually weakens.
Table 1 shows that the bond energy decreases with increasing pressure, indicating that pressurization has a positive effect on the amorphous cellulose region–water model, thus enhancing the stability of the structure.

3.2. Lattice Parameters and Density

The amorphous cellulose region–water model created a square cube as the lattice cell, and the cell parameters indicated the square’s length, width, and height to characterize the cell volume. The amorphous cellulose region–water models presented in this paper all had a single cellulose chain (DP = 20) and 29 water molecules. The density and volume of cells were impacted by pressure variations. Following the dynamics simulations, Table 2 displays the cell parameters for the amorphous cellulose region–water model under various pressures.
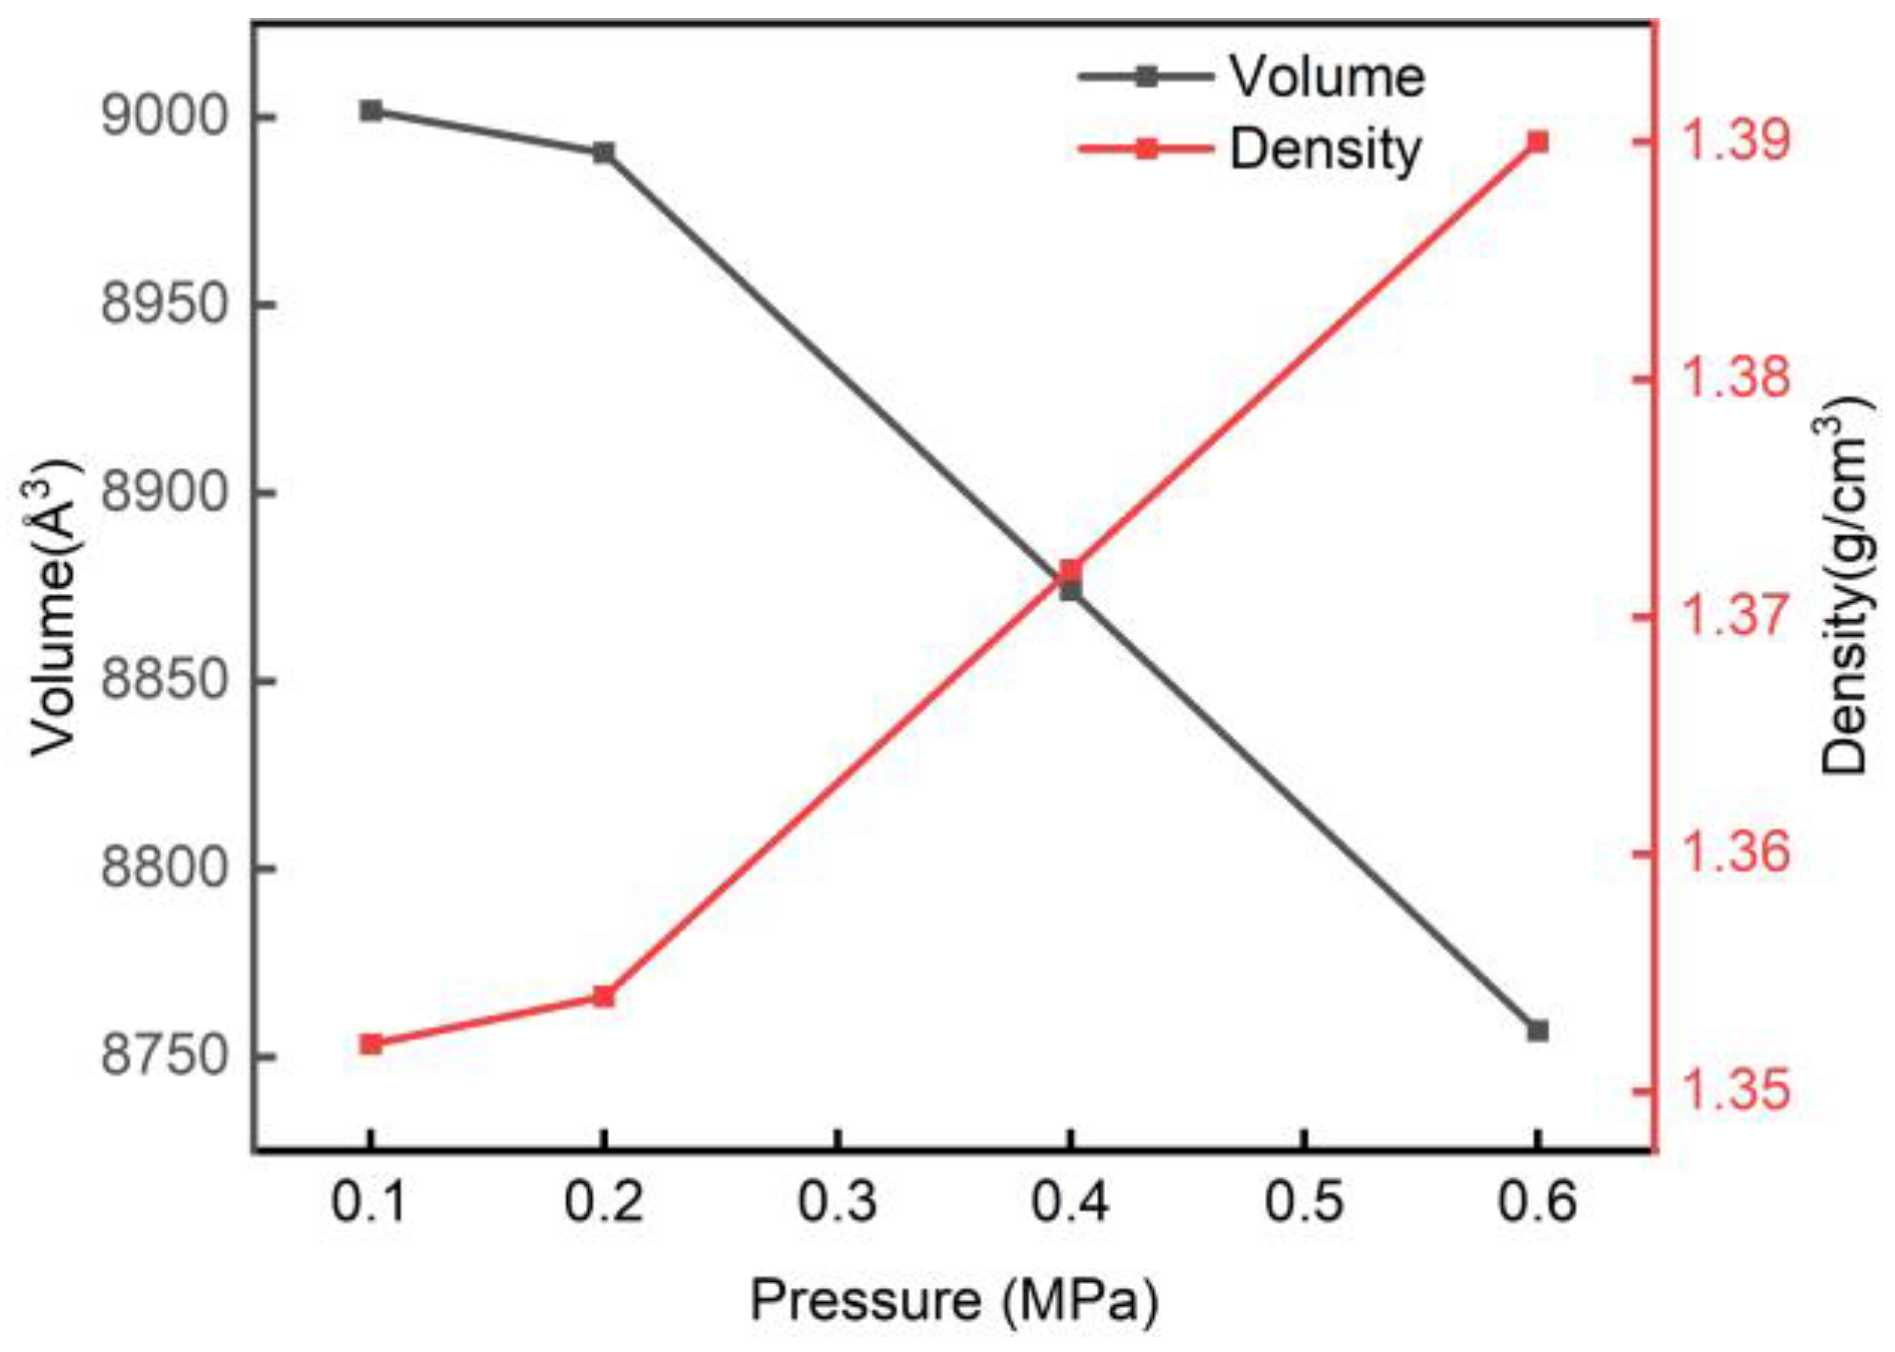
According to the data in Table 2, the length, width, and height of the cell decreased from 20.80 Å to 20.61 Å as the pressure increased, and the cellulose amorphous region–water model’s overall cell size showed a decreasing tendency. The density and volume changes of the amorphous cellulose region–water model after pressurized hydrothermal treatment at different pressures are plotted in Figure 5.
Density is a parameter used to evaluate a model [32]. NPT system synthesis allows the cell volume to vary; therefore, the cell volume varies under different simulation conditions. As the pressure increased from 0.1 to 0.6 MPa, the density of the model increased from 1.352 to 1.390 g/cm3. The accompanying decrease in density was accompanied by a decrease in cell volume from 9001.651 to 8756.956 Å3. The internal structure of the model was affected by the pressure; as a consequence, the volume decreased, generating new interchain hydrogen bonds and enhancing the constraining effect on the arrangement of cellulose molecular chains. At the same time, the increase in weak van der Waals forces that make the lamellae stably stacked also made the interchain distance between cellulose chains decrease.

3.3. Mean Square Displacement of the Cellulose Chains

The mean square displacement of the cellulose chains indicates their motion, and the degree of violent cellulose chain motion determines their stability [33]. When the cellulose chains move more violently, their stability is lower, thus reducing the stability of the overall structure of the wood. The cellulose chain motion can be characterized by the mean square displacement [34],
MSD = i = 1 n | r i ( t ) r i ( 0 ) | 2
where r i ( t ) and r i ( 0 ) represent the position vectors of t atoms at time t and time 0 , respectively.
Figure 6 shows the mean square displacement of the cellulose chains under different pressures.
As can be seen from Figure 6, the mean square displacement of the cellulose chains under pressurization (0.2, 0.4, and 0.6 MPa) were all smaller than that of the heat treatment at atmospheric pressure (0.1 MPa). Moreover, the mean square displacement gradually decreased with increasing pressure, which indicated that the motion of the cellulose chains slowed down after pressurization and improved the thermal stability of cellulose.

3.4. Hydrogen Bonding

Hydrogen bonding is a strong nonbonding interaction between atoms that form hydrogen bonds with both van der Waals and Coulomb forces, the strength of which lies between chemical bonding and nonbonding interactions. The atom to which the hydrogen atom is bonded is usually called the donor, and the atom to which the hydrogen atom is attached is called the acceptor. Among the geometrical criteria used to determine the existence of hydrogen bonds, the distance between the acceptor of a hydrogen atom is not greater than 0.28 Å [35]; the angle between the donor, hydrogen atom, and acceptor is not less than 110°. The state and distribution of hydrogen bonds are of great significance for the structure of cellulose, so the analysis of the quantitative changes of hydrogen bonds is essential for understanding cellulose. The computational hydrogen bonding module of Material Studio software was used to analyze hydrogen bonds, and a Perl script was used to count the number of hydrogen bonds. The distribution of the number of hydrogen bonds between the water and amorphous region of cellulose is shown in Figure 7 for various pressures.
As seen in Figure 7, the number of hydrogen bonds gradually increased with increasing pressure, indicating that more hydrogen bonds formed between the water and amorphous cellulose region. This may be due to the densification of the amorphous cellulose region–water model caused by pressurization, which reduces the volume of the model and increases the intermolecular contact, facilitating the formation of hydrogen bonds [36]. In addition to improving the structure’s stability, intermolecular hydrogen bonds also lessen the detrimental effects of water infiltration on the mechanical properties of the cells. The density and volume changes of the amorphous cellulose region–water model in Section 3.2 corroborate with each other.

3.5. Mechanical Properties

Molecular dynamics simulations can be used to calculate the mechanical properties of cellulose’s amorphous region at different pressures. The kinetic trajectory file of the model at each pressure is calculated to obtain the elasticity coefficient matrix, where the mechanical parameters can describe the wood’s mechanical characteristics. Because solid linear elastic materials are subject to Hooke’s rule, it is possible to compute the mechanical characteristics of cellulose using Equation (3).
[ C i j ] = [ λ + 2 μ λ λ 0 0 0 λ λ + 2 μ λ 0 0 0 λ λ λ + 2 μ 0 0 0 0 0 0 μ 0 0 0 0 0 0 μ 0 0 0 0 0 0 μ ]
where λ and μ are the Lamé constants [8] and are usually used to calculate mechanical parameters, λ = C 12   and   μ = ( C 11 C 12 ) / 2 .
The parameters in Equation (3) are the elastic stiffness constants, and Table 3 gives the partial elastic stiffness constants and the Cauchy pressure values for different pressures.
The mechanical parameter Cauchy pressure ( C 11 C 12 ) is used to characterize the ductility of the material, where a larger value indicates the higher ductility of the material, and if the Cauchy pressure is negative, it indicates a more brittle material [20]. As can be seen from Table 3, the Cauchy pressure value increased with increasing pressure, indicating an increase in ductility.
The commonly used mechanical parameters include Young’s modulus ( E ), shear modulus ( G ), Poisson’s ratio ( γ ), and bulk modulus ( K ). The formulas are as follows:
E = μ ( 3 λ + 2 μ ) λ + μ
G = μ
γ = λ 2 ( λ + μ )
K = λ + 2 3 μ
Young’s modulus ( E ) indicates a material’s capacity to fend off deformation; the higher the value, the more rigid the material and the less likely it is to deform. The shear modulus ( G ) is the ratio of the stress to the strain of a material in shear and characterizes the ability to resist shear strain. The bulk modulus ( K ) is the ratio of stress to the strain of a material under uniform compression. The larger the ratio of volume variable to shear variable ( K / G ), the higher the toughness of the material. Poisson’s ratio ( γ ) is the absolute value of the ratio of the transverse variable to the longitudinal variable of the material when it is subjected to external stress, where larger values indicate greater plasticity of the material. The above mechanical parameters were calculated by Materials Studio software simulation, as shown in Table 4.
As can be seen from Table 4, Young’s modulus ( E ) and shear modulus ( G ) increased with increasing pressure, and Poisson’s ratio ( γ ) and K / G decreased with increasing pressure during the pressurized hydrothermal treatment of wood. The results showed that the E and G values of the pressurized hydrothermal treatment model at 0.6 MPa increased by 11.6804 and 4.7807 GPa, respectively; the Poisson’s ratio ( γ ) and K / G values decreased by 43.3% and 8.0407 GPa, respectively, compared with those of the model with atmospheric pressure hydrothermal treatment. The data indicated that pressurized hydrothermal treatment increased the stiffness and decreased the toughness of the wood, in agreement with the findings of the studies by Bao and Yu et al. [37,38]. The change in mechanical properties was also corroborated by the change in the number of hydrogen bonds in Section 3.4. An increase in hydrogen bonds also increases the van der Waals forces in interchain contacts [39], and the enhanced intermolecular forces result in a denser structure throughout the cellulose system. As a result, the wood has greater stiffness to resist deformation.

4. Conclusions

In this study, an amorphous cellulose region–water model was developed using molecular dynamics. Five aspects were analyzed: energy changes, cell parameters and density, mean square displacement of cellulose, number of hydrogen bonds, and mechanical properties. The conclusions are as follows:
  • With increasing pressure, the difference between the average value of the nonbond energy and the total potential energy gradually decreases, and the interatomic repulsion within the molecule gradually weakens. The bond energy also decreases with increasing pressure, indicating that pressurization has a positive effect on the amorphous region–water model of cellulose and enhances the structural stability of the amorphous cellulose region.
  • The internal structure of the model is affected by pressure, which reduces the volume and increases the density, creating new interchain hydrogen bonds and enhancing the restraining effect on the arrangement of cellulose molecular chains. At the same time, the increase in weak van der Waals forces that stabilize the stacking of the lamellar structure also reduce the distance between the cellulose chains and slow down the cellulose chain movement. It was shown that the pressurized hydrothermal treatment improves the denseness of the cellulose amorphous region.
  • Young’s modulus ( E ) and shear modulus ( G ) increase with increasing pressure, and Poisson’s ratio ( γ ) and K / G decrease with increasing pressure during the pressurized hydrothermal treatment of wood. The pressurized hydrothermal treatment increases the stiffness and decreases the toughness of the wood compared with those of the model with atmospheric pressure hydrothermal treatment. In addition, the changes in mechanical properties were corroborated by the changes in the number of hydrogen bonds. The increase in hydrogen bonding also increases the van der Waals forces in the interchain contacts, and the enhanced intermolecular forces lead to a more dense structure of the entire cellulose system. Thus, pressurized hydrothermal treatment of wood can significantly improve the resistance to deformation.
  • The effect of pressurized hydrothermal treatment on the properties of the cellulose amorphous region was simulated from a microscopic perspective; model energy changes, cell parameters, mean square displacement, mechanical parameters, and hydrogen bonding were all analyzed to more intuitively explain how pressurized hydrothermal treatment acts on cellulose, the main component of wood.

Author Contributions

Conceptualization, X.J. and Y.G.; methodology, X.J.; software, X.J.; validation, X.J., W.W., Y.G. and M.D.; formal analysis, X.J.; investigation, Y.G.; resources, X.J.; data curation, X.J.; writing—original draft preparation, X.J.; writing—review and editing, X.J.; visualization, X.J.; supervision, Y.G. and M.D.; project administration, W.W.; funding acquisition, W.W. All authors have read and agreed to the published version of the manuscript.

Funding

This research was funded by the Fundamental Research Funds for the Central Universities, grant number 2572019BL04; and the Scientific Research Foundation for the Returned Overseas Chinese Scholars of Heilongjiang Province, grant number LC201407.

Data Availability Statement

Data are available upon request from the corresponding author.

Conflicts of Interest

The authors declare no conflict of interest.

References

  1. Esteves, B.; Pereira, H. Wood modification by heat treatment: A review. BioResources 2009, 4, 370–404. [Google Scholar] [CrossRef]
  2. Pelaez-Samaniego, M.R.; Yadama, V.; Lowell, E.; Espinoza-Herrera, R. A review of wood thermal pretreatments to improve wood composite properties. Wood Sci. Technol. 2013, 47, 1285–1319. [Google Scholar] [CrossRef]
  3. Stamm, A.J.; Burr, H.K.; Kline, A.A. Staybwood—Heat-stabilized wood. Ind. Eng. Chem. 1946, 38, 630–634. [Google Scholar] [CrossRef]
  4. Mohebby, B.; Ilbeighi, F.; Kazemi-Najafi, S. Influence of hydrothermal modification of fibers on some physical and mechanical properties of medium density fiberboard (MDF). Holz Als Roh-Und Werkstoff 2008, 66, 213–218. [Google Scholar] [CrossRef]
  5. Ding, T.; Gu, L.; Cai, J. Effect of heat treatment on moisture absorption properties and dimensional stability of wood. J. Nanjing For. Univ. 2015, 39, 143–147. [Google Scholar]
  6. Li, Y.; Tang, R.; Bao, B.; Fu, S. Study on mechanical properties and dimensional stability of high temperature heat treated fir wood. J. Beijing For. Univ. 2010, 32, 232–236. [Google Scholar]
  7. Kamperidou, V. Chemical and structural characterization of poplar and black pine wood exposed to short thermal modification. Drvda Ind. 2021, 72, 155–167. [Google Scholar] [CrossRef]
  8. Karlsson, O.; Sidorova, E.; Morén, T. Influence of heat transferring media on durability of thermally modified wood. BioResources 2011, 6, 356–372. [Google Scholar] [CrossRef]
  9. Rahimi, S.; Singh, K.; DeVallance, D. Effect of different hydrothermal treatments (steam and hot compressed water) on physical properties and drying behavior of yellow-poplar (Liriodendron tulipifera). For. Prod. J. 2019, 69, 42–52. [Google Scholar] [CrossRef]
  10. Ali, M.R.; Abdullah, U.H.; Ashaari, Z.; Hamid, N.H.; Hua, L.S. Hydrothermal modification of wood: A review. Polymers 2021, 13, 2612. [Google Scholar] [CrossRef]
  11. Ding, T.; Gu, L.; Wu, Z. Influence of steam pressure on mechanical properties of heat-treated wood. China For. Prod. Ind. 2010, 37, 32. [Google Scholar]
  12. Qi, H.; Cheng, W.; Liu, Y. Mechanical characteristics and chemical compositions of superheated steam-treated wood under high temperature and pressure. J. North-East For. Univ. 2005, 33, 44–46. [Google Scholar]
  13. Ding, T.; Gu, L.; and Liu, X. Comparative on chemical component changes of pressurized-steam-treated Mongolian oak. Sci. Silvae Sin. 2012, 48, 148–152. [Google Scholar]
  14. Jiang, J.; Lu, J.; Zhou, Y.; Huang, R.; Zhao, Y.; and Jiang, J. Optimization of processing variables during heat treatment of oak (Quercus mongolica) wood. Wood Sci. Technol. 2014, 48, 253–267. [Google Scholar] [CrossRef]
  15. Rosen H, N. Pressure steam drying of lumber. For. Prod. J. 1983, 33, 17–24. [Google Scholar]
  16. Khazraji, A.C.; Robert, S. Interaction effects between cellulose and water in nanocrystalline and amorphous regions: A novel approach using molecular modeling. J. Nanomater. 2013, 2013, 1–11. [Google Scholar] [CrossRef] [Green Version]
  17. Hou, T.J.; Zhang, W.; Xu, X.J. Binding affinities for a series of selective inhibitors of gelatinase-A using molecular dynamics with a linear interaction energy approach. J. Phys. Chem. B 2005, 105, 5304–5315. [Google Scholar] [CrossRef]
  18. Wang, W.; Ma, W.; Wu, M.; Sun, L. Effect of Water Molecules at Different Temperatures on Properties of Cellulose Based on Molecular Dynamics Simulation. BioResources 2020, 17, 269–280. [Google Scholar] [CrossRef]
  19. Qi, X.; Zhang, X.; Yan, Q.; Hu, M. Temperature dependence of mechanical state for nitrocellulose/nitroglycerin blend. J. Propuls. Technol. 2016, 37, 1387–1392. [Google Scholar]
  20. Zhu, M.Z.; Chen, Y.F.; Chao, K.; Liao, R.J.; Zhu, W.B.; Du, X.M. Molecular dynamics-based simulation of thermodynamic properties of amorphous cellulose. High Volt. Technol. 2015, 41, 432–439. [Google Scholar]
  21. Theodorou, D.N.; Suter, U.W. Detailed molecular structure of a vinyl polymer glass. Macromolecules 1985, 18, 1467–1478. [Google Scholar] [CrossRef]
  22. Mazeau, K.; Heux, L. Molecular dynamics simulations of bulk native crystalline and amorphous structures of cellulose. J. Phys. Chem. B 2003, 107, 2394–2403. [Google Scholar] [CrossRef]
  23. Allen, M.P.; Tildesley, D.J. Computer Simulation of Liquids; Clarendon Press: Oxford, UK, 1987. [Google Scholar]
  24. Jiang, J.H. Research on the change of properties and mechanism of superheated steam treatment of Quercus serrata. China Acad. For. Sci. 2013. [Google Scholar]
  25. Ewald, P. Evaluation of optical and electrostatic lattice potentials. Ann. Phys. 1921, 64, 253–287. [Google Scholar] [CrossRef]
  26. Andersen, H.C. Molecular dynamics simulations at constant pressure and/or temperature. J. Chem. Phys. 1980, 72, 2384–2393. [Google Scholar] [CrossRef]
  27. Andrea, T.A.; Swope, W.C.; Andersen, H.C. The role of long ranged forces in determining the structure and properties of liquid water. J. Chem. Phys. 1983, 79, 4576–4584. [Google Scholar] [CrossRef]
  28. Berendsen, H.J.; Postma, J.P.; Van Gunsteren, W.F.; DiNola, A.; Haak, J.R. Molecular dynamics with coupling to an external bath. J. Chem. Phys. 1984, 81, 3684–3690. [Google Scholar] [CrossRef]
  29. Wang, W.; Wang, Y.; Li, X. Molecular dynamics study on mechanical properties of cellulose with air/nitrogen diffusion behavior. BioResources 2018, 13, 7900–7910. [Google Scholar] [CrossRef]
  30. Sun, H. Ab initio calculations and force field development for computer simulation of polysilanes. Macromolecules 1995, 28, 701–712. [Google Scholar] [CrossRef]
  31. Maple, J.R.; Hwang, M.J.; Stockfisch, T.P.; and Hagler, A.T. Derivation of class II force fields. III. Characterization of a quantum force field for alkanes. Isr. J. Chem. 2013, 34, 195–231. [Google Scholar] [CrossRef]
  32. Wang, X.; Tu, D.; Chen, C.; Zhou, Q.; Huang, H.; Zheng, Z.; Zhu, Z. A thermal modification technique combining bulk densification and heat treatment for poplar wood with low moisture content. Constr. Build. Mater. 2021, 291, 123395. [Google Scholar] [CrossRef]
  33. David, G.; Orszag, S.A. Numerical Analysis of Spectral Methods: Theory and Applications; Society for Industrial and Applied Mathematics: Philadelphia, PA, USA, 1977. [Google Scholar]
  34. Zhu, M.Z.; Liao, R.J.; Zhou, X. Molecular dynamics of hydrated hydrogen ion diffusion in oil media mechanics simulation. High Volt. Technol. 2011, 37, 1930–1936. [Google Scholar]
  35. Nishiyama, Y.; Langan, P.; Chanzy, H. Crystal structure and hydrogen-bonding system in cellulose Iβ from synchrotron X-ray and neutron fiber diffraction. J. Am. Chem. Soc. 2002, 124, 9074–9082. [Google Scholar] [CrossRef] [PubMed]
  36. Taghiyari, H.R.; Bayani, S.; Militz, H.; Papadopoulos, A.N. Heat treatment of pine wood: Possible effect of impregnation with silver nanosuspension. Forests 2020, 11, 466. [Google Scholar] [CrossRef]
  37. Bao, M.; Huang, X.; Jiang, M.; Yu, W.; Yu, Y. Effect of thermo-hydro-mechanical densification on microstructure and properties of poplar wood (Populus tomentosa). J. Wood Sci. 2017, 63, 591–605. [Google Scholar] [CrossRef]
  38. Yu, Y.; Zhang, F.; Zhu, S.; Li, H. Effects of high-pressure treatment on poplar wood: Density profile, mechanical properties, strength potential index, and microstructure. BioResources 2017, 12, 6283–6297. [Google Scholar] [CrossRef]
  39. Du, D.; Tang, C.; Zhang, J.; Hu, D. Effects of hydrogen sulfide on the mechanical and thermal properties of cellulose insulation paper: A molecular dynamics simulation. Mater. Chem. Phys. 2020, 240, 122153. [Google Scholar] [CrossRef]
Figure 1. The amorphous cellulose region–water molecule model.
Forests 14 00314 g001
Figure 2. Energy–time variation.
Forests 14 00314 g002
Figure 3. Temperature–time variation.
Forests 14 00314 g003
Figure 4. Total potential energy and nonbonding energy under different pressure models.
Forests 14 00314 g004
Figure 5. The density and volume of the amorphous cellulose region–water model at different pressures; 1 nm = 10 Å.
Forests 14 00314 g005
Figure 6. MSD curves of the cellulose chain under different pressures.
Forests 14 00314 g006
Figure 7. Number of hydrogen bonds between amorphous cellulose region–water at 0.1, 0.2, 0.4, and 0.6 MPa (red, orange, green, blue).
Forests 14 00314 g007
Table 1. Mean value of bond energy for different pressure models.
Pressure (MPa)0.10.20.40.6
Bond energy (kcal/mol)179.847159.015112.822106.209
Table 2. The cell parameters of the amorphous cellulose region–water model at different pressures.
Pressure (MPa) Cell Parameters (Å)
The LengthThe WidthThe Height
0.120.80 20.8020.80
0.220.7920.7920.79
0.420.7020.7020.70
0.620.6120.6120.61
Table 3. Elastic stiffness constants of the cellulose amorphous region for different pressures.
Pressure (MPa)0.10.20.40.6
C 11 7.331210.228915.267816.6379
C 12 5.84525.04676.39715.5905
C 44 3.92292.42194.05911.3101
C 11 C 12 1.92232.62482.3384.2804
Table 4. Mechanical parameters of the amorphous cellulose region–water model for different pressures.
Pressure (MPa)0.10.20.40.6
E 2.14526.894211.489913.8258
G 0.74302.59114.43545.5237
γ 0.44360.33040.29520.2515
K / G 9.07462.04701.47621.0339
Disclaimer/Publisher’s Note: The statements, opinions and data contained in all publications are solely those of the individual author(s) and contributor(s) and not of MDPI and/or the editor(s). MDPI and/or the editor(s) disclaim responsibility for any injury to people or property resulting from any ideas, methods, instructions or products referred to in the content.