Article

Seasonal Dynamics and Influencing Factors of Litterfall Production and Carbon Input in Typical Forest Community Types in Lushan Mountain, China

1
Key Laboratory of National Forestry and Grassland Administration on Forest Ecosystem Protection and Restoration of Poyang Lake Watershed, College of Forestry, Jiangxi Agricultural University, Nanchang 330045, China
2
Lushan National Nature Reserve Administration, Jiujiang 332900, China
3
Lushan National Observation and Research Station of Chinese Forest Ecosystem, Jiujiang 332900, China
*
Author to whom correspondence should be addressed.
Forests 2023, 14(2), 341; https://doi.org/10.3390/f14020341
Submission received: 11 December 2022 / Revised: 1 February 2023 / Accepted: 6 February 2023 / Published: 9 February 2023

Abstract

:
Litterfall is an important part of the process of nutrient circulation and energy flow in forest ecosystems. Mountain forests are strongly eroded by running water in that the surface soil is thinner, and the terrain is complex and diverse. They are more sensitive to climate change, which will affect the ecological processes and carbon sink functions of forest ecosystems. Taking Lushan Mountain as an example, we studied the dynamic characteristics of litterfall components, seasonal changes in carbon input and the influencing factors of typical forest communities in the subtropics. The results showed that the total annual average litterfall components of evergreen broad-leaved forest (EBF) > artificial coniferous forest (ACF) > deciduous broad-leaved forest (DBF) > renew young forest (RYF), and that leaf litterfall is the first productivity in the litterfall components, and the peak of litterfall is mainly concentrated in spring and autumn, showing a single- or double-peaked change pattern. There was a linear relationship between the components of litterfall in the four forest communities and the stand factor, but the correlation degree R2 was small. Overall, the results showed that the total amount of litterfall in the four forest communities was affected by canopy density and stand density. Light, temperature and water at different altitudes had different effects on the amount of litterfall, with excessive temperatures at lower altitudes likely to limit forest growth and development under adequate light and water, and the opposite was true at higher altitudes. The results of Pearson correlation analysis showed that EBF and DBF were negatively correlated with rainfall, that ACF and RYF were negatively correlated with temperature and rainfall, and that wind speed was positively correlated. The average annual carbon input size of the four forest communities was EBF > ACF > RYF > DBF, which may be related to environmental conditions and vegetation types, and the seasonal differences were arranged in order of spring > autumn > summer > winter. It can be seen that, considering performance under future climate change, EBF is more conducive to nutrient input and has good soil fertility maintenance ability.

1. Introduction

In the context of global change, characterized by climate warming and changes in precipitation patterns, climate change leads to ecosystem imbalance. Additionally, mountain ecosystems, which are more sensitive to global change and more difficult to restore than other ecosystems, with high topographic complexity and stronger erosion by flowing water, are important factors in regulating the effects of climate change on vegetation [1].
Litterfall is a basic process of carbon cycle and nutrient return in forest ecosystems, and is a major component of global forest productivity [2]. The quantity and composition of forest litterfall directly affect the nutrient status of the forest land, which is of great significance for maintaining the nutrient balance of the forest [3]. Quantifying litterfall production is therefore an essential step in assessing productivity and evaluating phenology, carbon dynamics, biogeochemical cycles, and the ability of forests to recover from natural and anthropogenic disturbances [4]. In addition, the amount of litterfall is affected by forest type [5,6], tree species composition [7], stand structure [8], and terrain factors [4], etc. The annual production of litterfall also depends on environmental conditions, such as temperature, rainfall, wind and humidity levels [9,10,11]. As an important source of soil nutrients, litterfall acts as an input and output system of organic matter and humus, playing a key role in improving ecosystem productivity and carbon sequestration potential [12]. Due to the huge heterogeneity of different forest ecosystems, the high variability of nutrient cycling, the complexity of mountain ecosystem topography and the sensitivity to climate change, there are large uncertainties in the estimation of carbon content and its changes in different forest communities. Additionally, forest litterfall is not a single component, mainly including fallen leaves, fallen branches, bark, reproductive organs and residues (leaves, branches, fruit litter debris, animal manure, bud scales, etc.). Therefore, stratified research on montane forest litter and the assessment of carbon components and their input dynamics have important impacts on forest carbon pools and global climate change, and also provide a scientific reference for the accurate evaluation of subtropical montane forest soil fertility.
Lushan Mountain has experienced different degrees of human disturbance in history in that the original vegetation has been destroyed, and it has been reduced to various secondary forests, etc. Additionally, the composition and structure of tree species tend to be complex [13]. Evergreen broad-leaved forest and deciduous broad-leaved forest are the main natural secondary forests in Lushan Mountain, with strong natural regeneration abilities and relatively stable communities. At the same time, in order to meet the needs of rapid social and economic development for timber production, Cryptomeria japonica plantations (L. f.) D. Don and Pinus taiwanensis Hayata are cut down. These typical artificial coniferous forests in Lushan Mountain, which play an important role in ecological functions such as water connotation and atmospheric environment purification, are amongst the main afforestation species with high ecological and economic values [14]. However, a large number of artificial forests have led to soil fertility decline and tree productivity decline, which has posed serious challenges to soil fertility maintenance and forest management. Natural disturbance and regenerated young forests can adjust the structure of forest ecosystems, improve the quality of forest land, and enhance the water conservation capacity of forest land. It has become a community of concern in the transformation of artificial coniferous forests in Lushan Mountain in recent years. Therefore, the purpose of this study is to quantify the yield and carbon production of each component of litterfall in these typical forest communities, evaluate the dynamic changes of carbon input in the four forest communities, and analyze the key factors affecting the dynamic changes of litterfall component yield. These devlopments will enchance ourunderstanding the changing rules and differences in forest productivity under the background of climate change, improve the theoretical basis for vegetation restoration and the sustainable management of Lushan Mountain, and are of great significance to the carbon balance of the ecosystem and the improvement of the ecological environment.

2. Materials and Methods
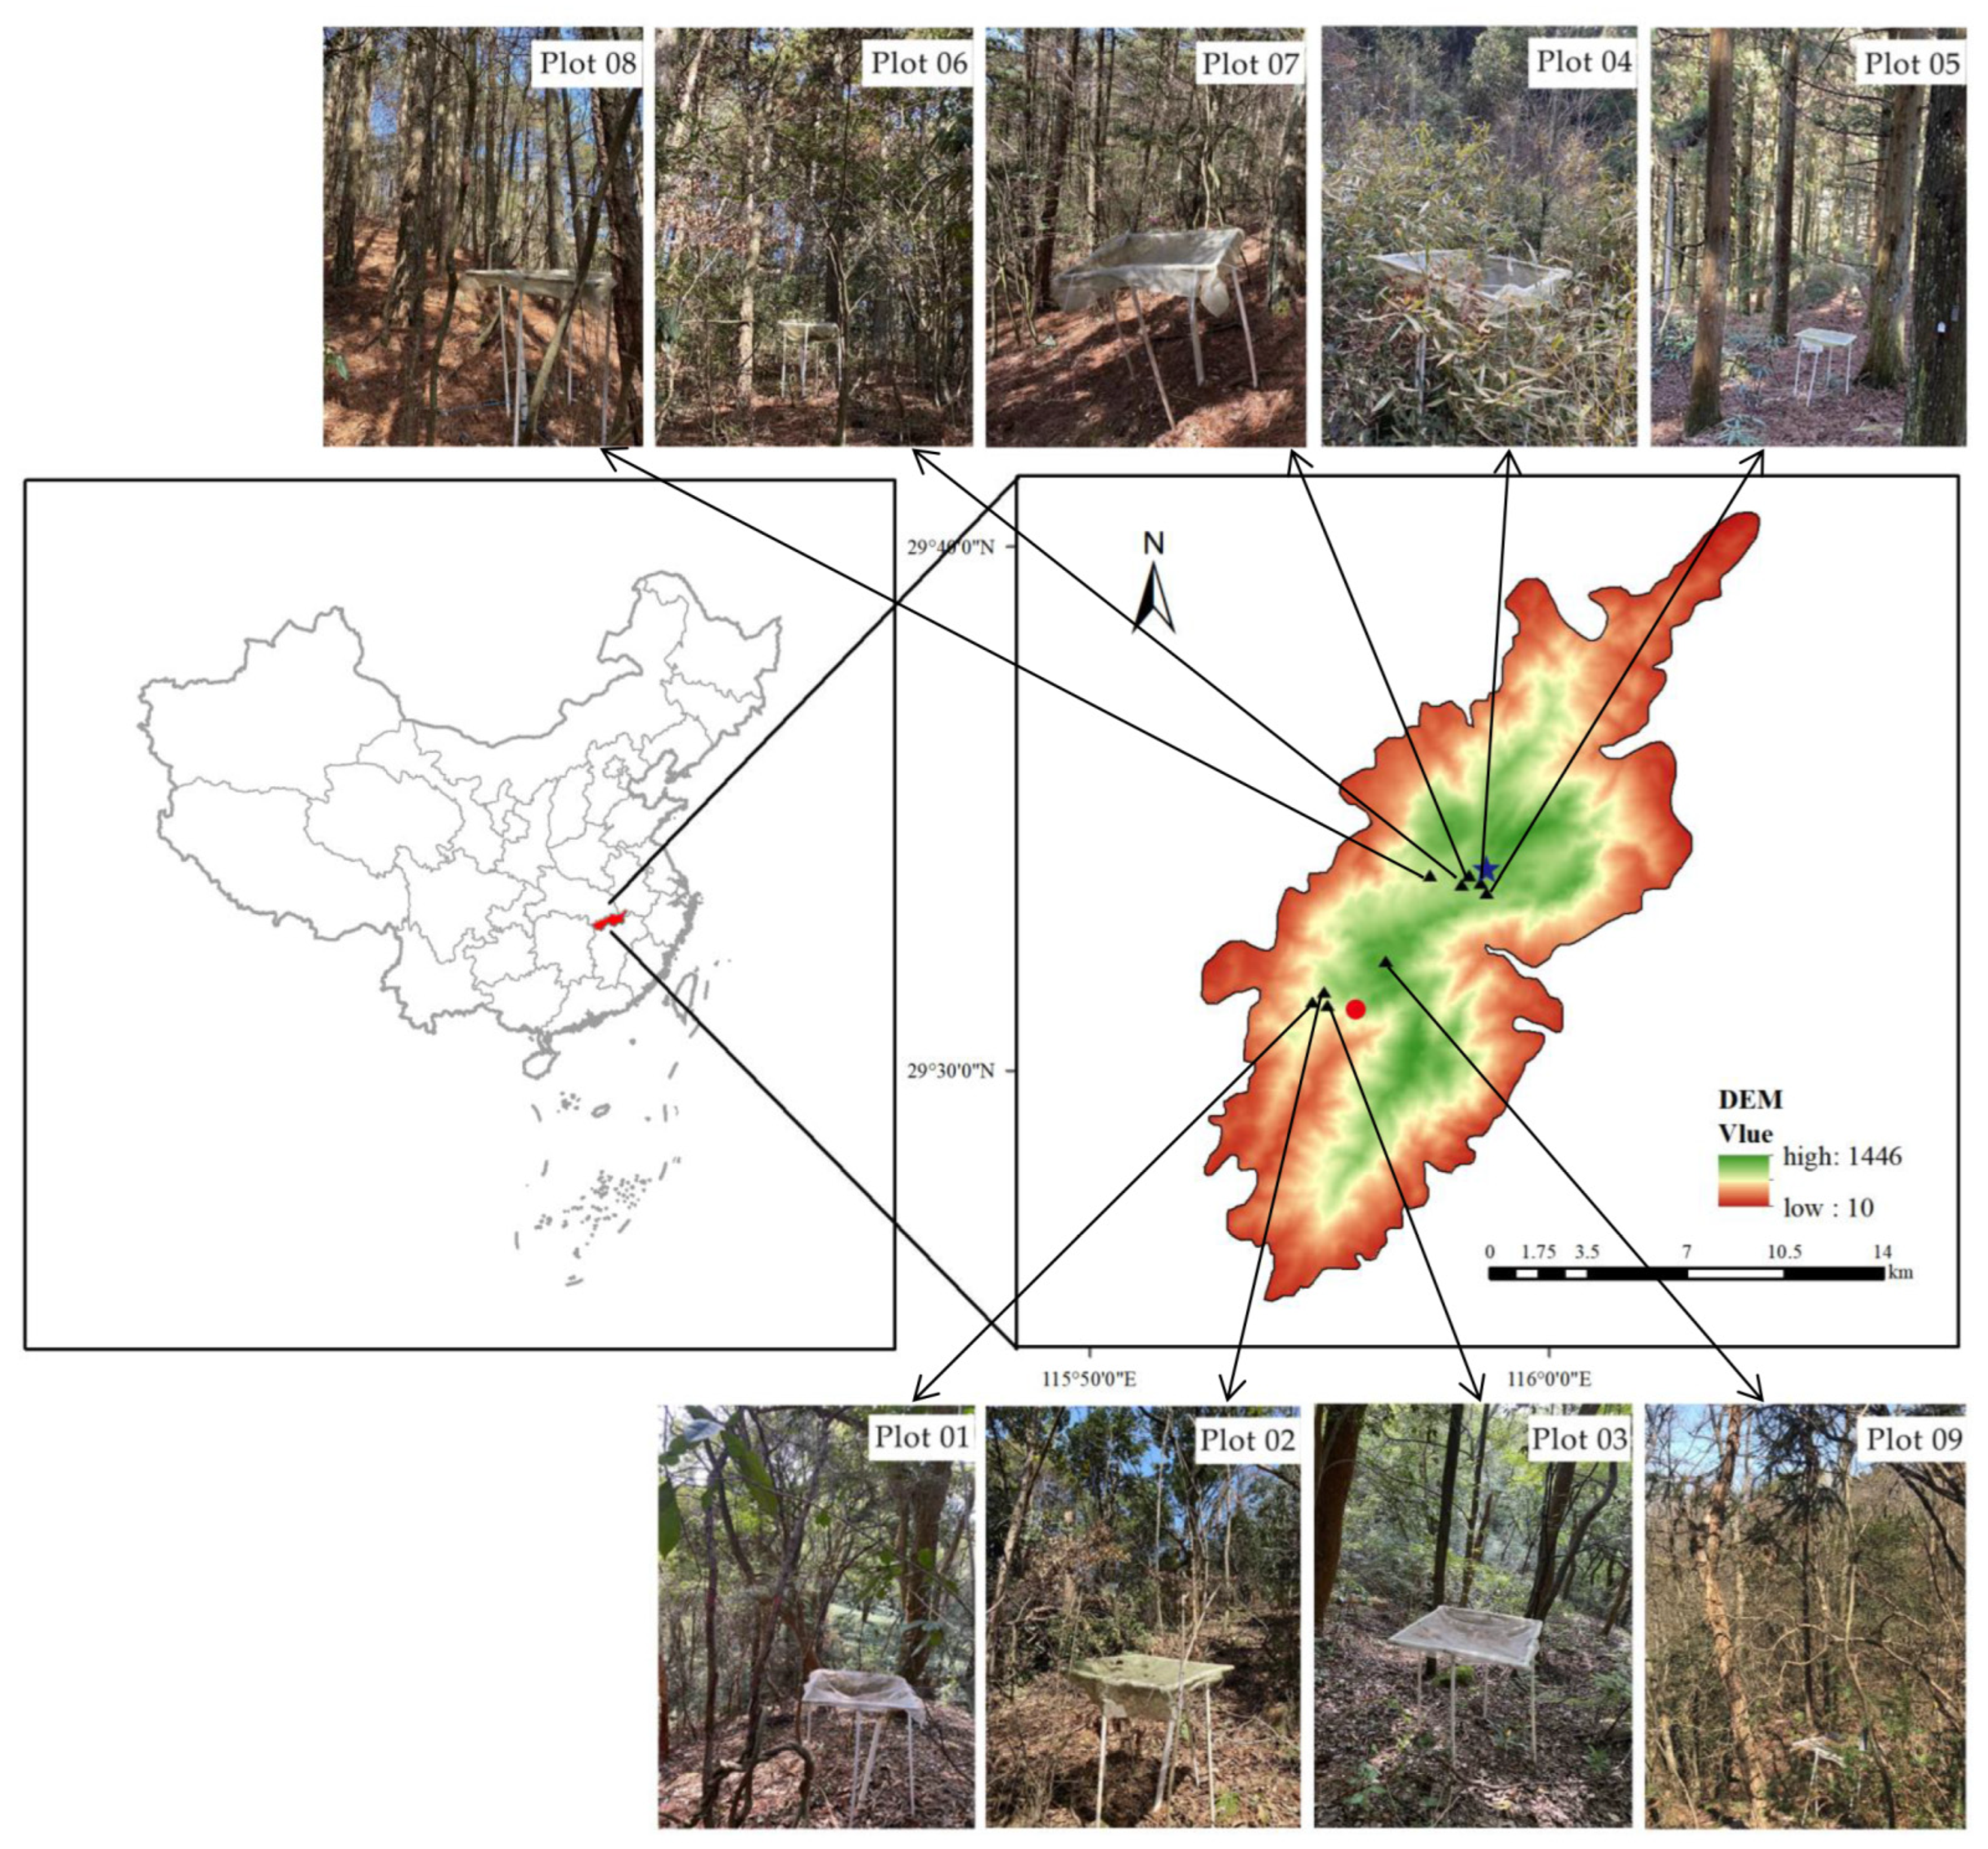
2.1. Research Area

This experiment was carried out in Lushan National Nature Reserve, Jiujiang City, Jiangxi Province, China (Figure 1) (115°52′–116°06′ E, 29°25′–29°41′ N), about 25 km long from north to south, and about 10 km wide from east to west, with a total area of 3.05 × 10⁴ hm2 and an altitude of 25–1474 m [15]. Affected by the East Asian monsoon circulation, it presents the characteristics of a subtropical monsoon climate, with rain and heat at the same time. The annual average temperature of Lushan Mountain is 11.9 °C, and the annual average precipitation is 2009 mm, which is concentrated in a period from April to September [16]. The Mountain is shrouded in clouds and fog all year round, and the annual foggy days number as many as 188 days. The rainfall in the atmosphere causes the water vapor content to increase, and the relative humidity reaches as high as 100%. Affected by the effects of rivers, lakes and mountains, the uplift of the terrain strengthened the rainfall on Lushan Mountain, and the humid climate gave birth to the local dense EBF and coniferous forest [17]. The soil layer is barren, the soil is rocky, and the soil types are various, including mountainous yellow soil, yellow brown soil, brown soil, and red soil [18].

2.2. Experimental Design and Sample Collection

In this study, 9 fixed monitoring plots were arranged according to the altitude gradient (Figure 1), 6 points were randomly selected in the DBF plot, and a litterfall basket 1 m from the ground was placed, respectively, for a total of 6 plots. For the remaining 8 plots, 4 small quadrats with an area of 1 m × 1 m were set up according to the diagonal of the plot, and a litterfall basket was placed 1 m from the ground, for a total of 38 litterfall baskets. All basket collection nets were nylon nets with a pore size of 0.5 mm.
The litterfall collection time runs from the beginning of March 2021 to the end of February 2022, a period of one year and a total of 12 collections. The litterfall in the basket was collected around the end of each month, and the litterfall was brought back to the laboratory. In order to understand the contribution of the typical forest community on Lushan to litterfall, we considered three components: leaf litterfall, branch litterfall (including bark), and other litterfall (reproductive organs and debris). The samples were sealed in envelopes and placed in an oven (Hangzhou Lubo Instrument Co., LTD., Model SG-700, Hangzhou, China) and dried at 65 °C for more than 48 hours so that we could weigh the samples to determine dry matter weight. These samples were ground in a grinder (Yongkang Hongsun Electromechanical Co., Ltd., Ling Sheng crusher, Yongkang, China), passed through a 60-mesh sieve, and stored in self-sealing bags for plant nutrient determination. Organic carbon was determined using the potassium dichromate volumetric–external heating method. The annual input of litterfall nutrients is calculated as follows:
L N = i = 1 12 j = 1 3 L i j N i j / 1000
In the formula, Lij is the litterfall production (kg/ha) of the j component in the i month; Nij is the nutrient content (g/kg) of the j component in the i month.
Plot investigation: measure and record the species, tree height and DBH of the trees in the plot with a diameter at breast height (DBH) ≥3 cm. Canopy density was calculated by the canopy projected area method, and tree height was measured by a range finder. At the same time, the relative coordinates of each tree in the sample plot were recorded, and the stand structure index was calculated accordingly. Stand density refers to the density of trees, i.e., the number of trees per unit area. The determination of the number of trees can be directly measured by a standard ruler per tree. The basic situation of each place is shown in Table 1.
Meteorological data collection is based on the altitude of the sample site, using two fixed meteorological observation stations (Figure 1). The meteorological data collection for sample sites 1, 2 and 3 is based on a standard meteorological observation station at an altitude of 210 m. The meteorological observation instrument is a CR1000x data collector (BEIJING TECHNO SOLUTIONS LIMITED), which is approximately 0.8 km away from sample sites 1, 2 and 3 and is at the same low altitude. The meteorological data of sample plots 4–9 are based on an integrated observation tower, established at an altitude of 1082 m on Mount Lushan for dynamic observation of forest microclimate gradient changes and atmospheric environment-related indicators. The tower uses a CR1000x data collector (BEIJING TECHNO SOLUTIONS LIMITED) to collect meteorological data. The tower is at the same altitude as sample plots 4–9 in this study and is approximately 0.5 km away from sample plots 4–7, 0.8 km away from sample plot 8 and 4.3 km away from sample plot 9. The monitoring instrument automatically samples once per minute, and the data logger takes the average value in a period of 1 h and then calculates the daily average temperature, daily maximum temperature, daily minimum temperature, daily total precipitation, daily maximum precipitation, daily average wind speed, daily maximum wind speed and daily relative humidity.

2.3. Statistical Analyses

All data analyses in this paper were analyzed in the SPSS 21.0 software, which was developed by Norman H. Nie, C. Hadlai (Tex) Hull and Dale H. Bent. at Stanford University (IBM/SPSS, Chicago, IL, USA).The Shapiro–Wilk test was used to test the normal distribution of monthly litterfall and carbon content. One-way analysis of variance was used to analyze the total monthly litterfall and litterfall of each component of four forest community types on Lushan Mountain. The meteorological factors at two altitudes were tested by t test. Pearson correlation analysis was used to analyze the relationship between meteorological data, the total amount of litterfall and the content of each component in four forest community types. Multiple linear regression analysis was performed on the total amount of litterfall and the content of each component at the two altitudes and the corresponding altitude meteorological factors, and the main meteorological factors that significantly affected the litterfall amount and its components were selected. Multiple linear regression analysis was performed on the annual yield of litterfall components in different communities and stand factors, and the influence of altitude factors (different meteorological factors) on annual litterfall components was compared by multiple linear regression analysis. One-way ANOVA was used to analyze the differences in carbon production and carbon input in different seasons and forest communities. Our graphics were done in origin 2019 and R studio 3.0.2.

3. Results

3.1. Monthly Dynamics and Composition of Total Litterfall in Four Forest Community Types

The litterfall of four forest communities on Lushan Mountain was continuously counted for one year (Table 2). The total annual litterfall production of the four forest community types was significantly different, and the size was in the order of EBF (3.90 ± 0.47 t/ha) > ACF (2.98 ± 0.47 t/ha) > DBF (2.92 ± 0.38 t/ha) > RYF (2.56 ± 0.27 t/ha) (p < 0.05). The fallen leaves of the four communities were the first production component of litterfall, accounting for 63%–68% of the total litterfall production, followed by fallen branches (17%–20%) and other litterfall (15%–18%).
We noticed that all the forest communities in Figure 2 made significant contributions to litterfall production, and the change trend of the total amount of litterfall in each community was basically consistent with that of fallen leaves (Figure 2a,b). Among them, the leaves of EBF, ACF and RYF showed a bimodal pattern, with the highest peak in spring and the second peak in autumn (October); on the contrary, the DBF had the highest peak in autumn, and the second peak was in early spring in March (Figure 2b). It can be seen from Figure 2c that the highest peak of fallen branches in the EBF occurred in January (0.14 ± 0.01 t/ha), that the second peak was in autumn (October), and both appeared in autumn. The highest peaks of EBF and DBF appeared in spring in April and May, and the second peak was in August (0.11 ± 0.01 t/ha, 0.07 ± 0.01 t/ha). October was the highest peak month for ACF and RYF, and May was the second peak month.

3.2. Relationship between Litterfall Production and Stand Factors

The results of the correlation analysis (Table 3) showed that the annual litterfall production in EBF was significantly negatively correlated with average stand density and average tree height, and the amount of fallen leaves was extremely significantly negatively correlated with the average stand density and average tree height (p < 0.01). Additionally, the stand variable was closely related to the amount of fallen branches and reproductive organ litterfall was the average diameter at breast height, which was related to the amount of fallen branches (negative correlation) and the amount of fallen flowers and fruits (positive correlation) (p < 0.01). The amount of leaf drop in DBF was significantly correlated with canopy density (positive) and average diameter at breast height (negative) (p < 0.05), and the amount of fallen branches was highly significantly negatively correlated with average diameter at breast height and average tree height (p < 0.01), and the amount of flower and fruit drop was highly significantly positively correlated with average tree height (p < 0.01). The annual litterfall production of each component in the ACF and RYF was significantly negatively correlated with the canopy density, the annual production of the ACF was negatively and significantly correlated with the average stand density and the RYF (negatively correlated), while the production of the reproductive organs was not significantly correlated with the stand structural parameters (p > 0.05).

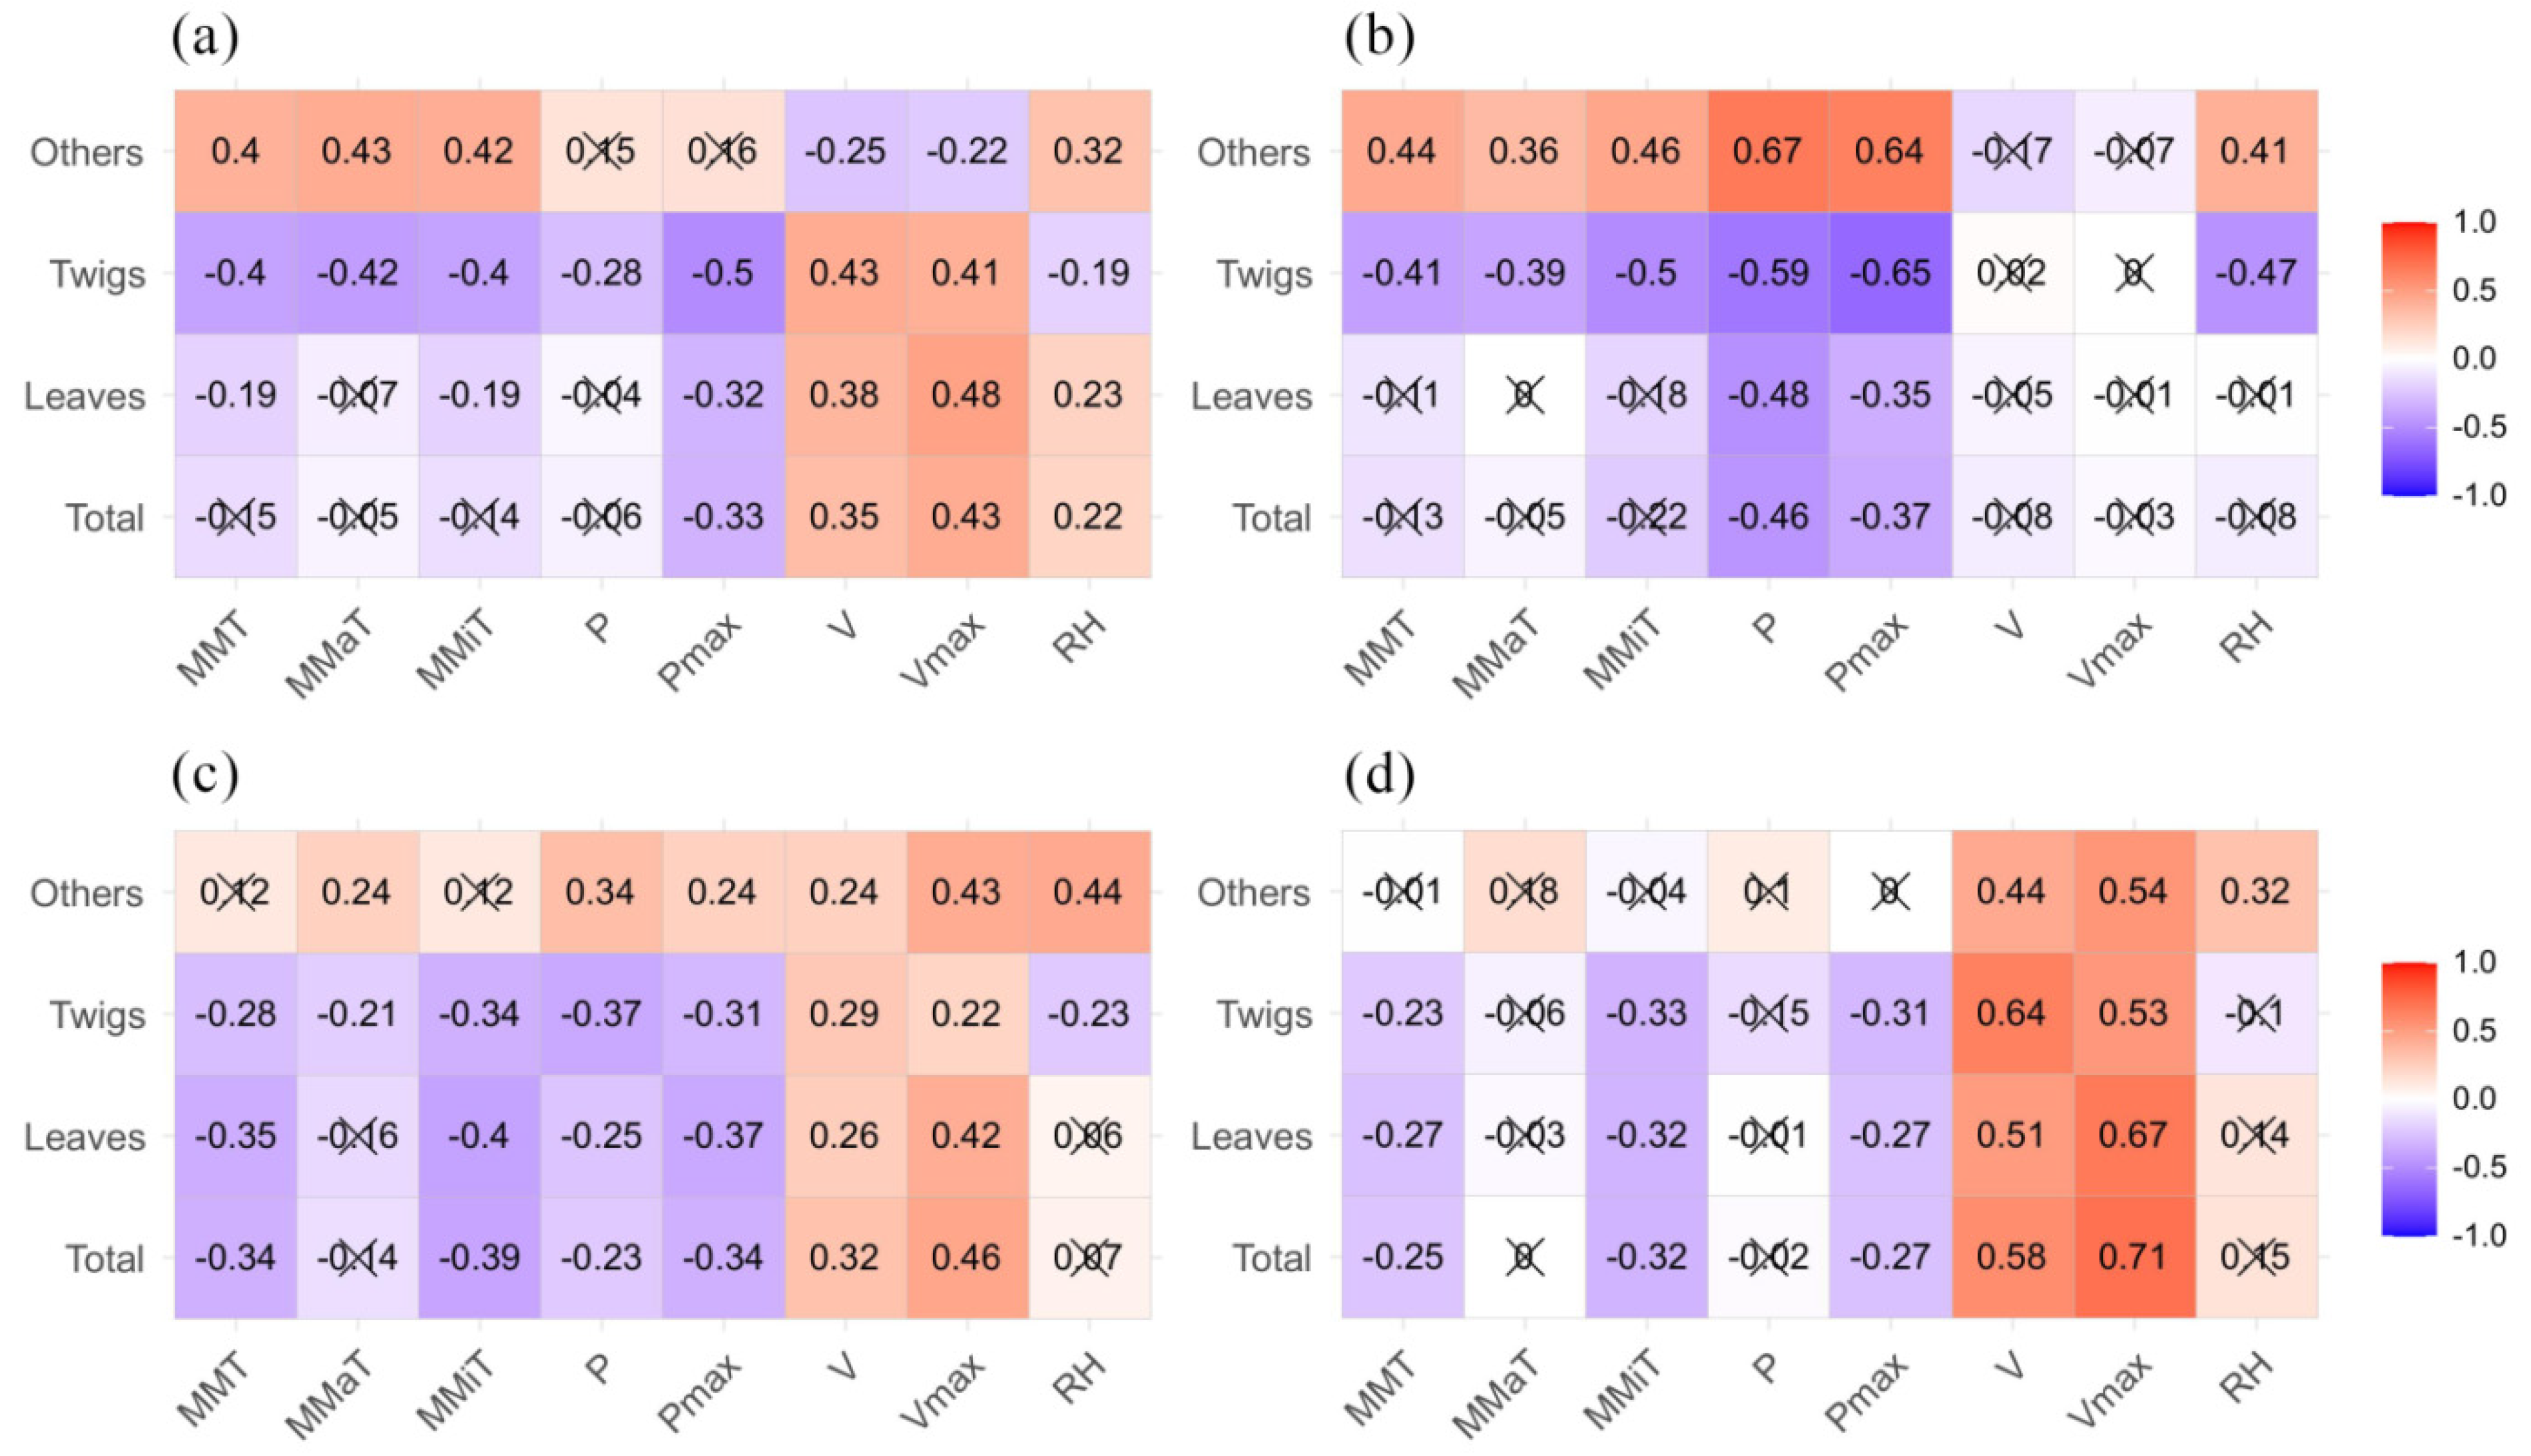
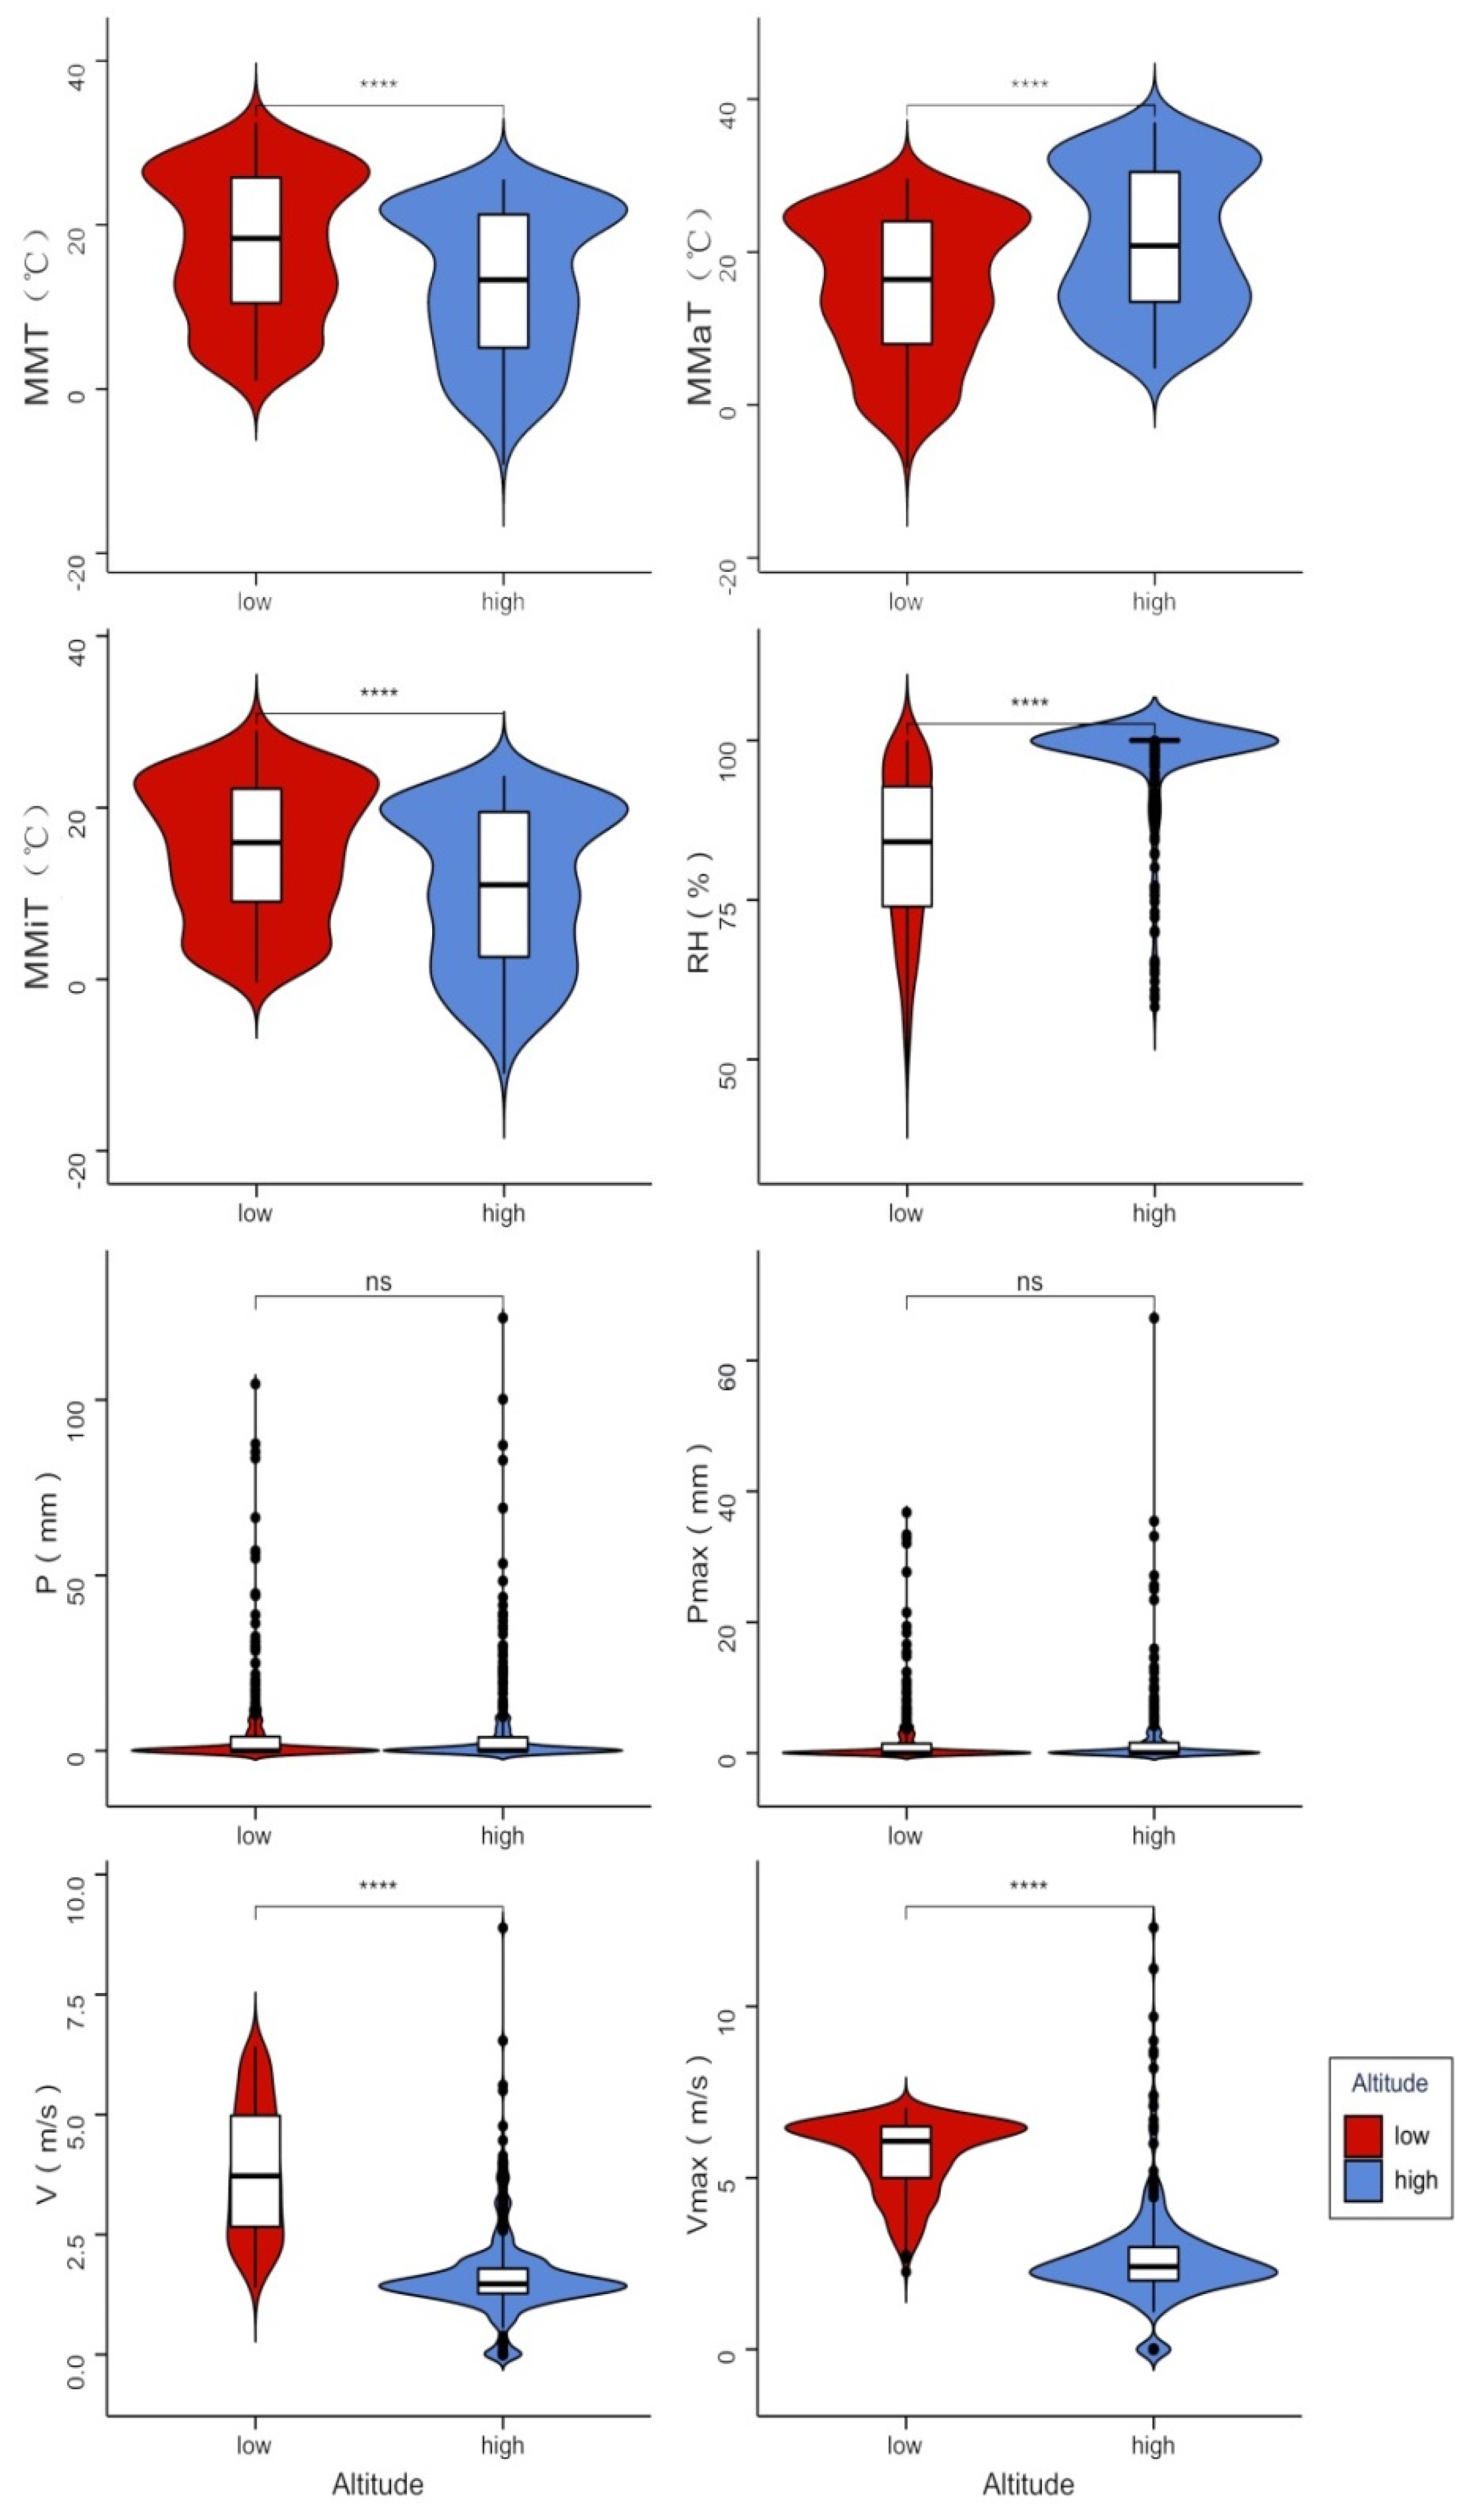
3.3. Relationships between Litterfall Production and Meteorological Factors

The results of Pearson correlation analysis (Figure 3) showed that the climate variables most closely related to monthly litterfall production varied among different communities. Both the leaf litterfall in the EBF and RYF were negatively correlated with air temperature (average, minimum) and monthly maximum precipitation, and extremely significantly positively correlated with wind speed (average, maximum) and relative humidity, with maximum wind speed showing a strong positive correlation with RYF (R = 0.67). Leaf litterfall in DBF was only negatively affected by rainfall, whereas ACF was negatively correlated with temperature and rainfall, and positively correlated with wind speed. Temperature and rainfall influenced and were negatively correlated with the annual production of branch litterfall in these four communities, while wind speed showed a positive correlation. EBF and DBF showed positive correlations between reproductive organ abscission and temperature, with rainfall showing a strong positive correlation in DBF(R = 0.67), and both ACF and RYF were positively influenced by wind speed.
The results of the t test showed that, in addition to total precipitation and maximum precipitation, there were only six meteorological factors at low altitudes in the study area from 2021 to 2022 that were significantly different from those at high altitude (p < 0.05) (Figure 4).
Linear regression analysis (Table 4) showed that the annual total production of litterfall at low altitudes and other litterfall (reproductive organs and debris) was significantly affected by air temperature (average, minimum), wind speed (average, maximum) and relative humidity (p < 0.01). Five variables explained 64.3% of the variation in total litterfall production (F = 33.25), and 22.9% of the variation in other litterfall (F = 6.31). In addition, the annual total litterfall at high altitudes was also negatively affected by rainfall (F = 25.49, p < 0.001), although other litterfall was not affected by air temperature (p > 0.05). Low altitude leaf litterfall was significantly positively correlated with minimum temperature, maximum precipitation, average wind speed, and relative humidity (p < 0.001), and 67.8% of the variation could be used to explain these four variables (F = 38.57), while high altitude leaf litterfall was highly significantly negatively correlated with minimum temperature, precipitation and average wind speed. There was a very significant negative correlation between the amount of branch litterfall at low altitudes and the minimum temperature (F = 19.61, p < 0.001), but a very significant positive correlation at high altitudes (F = 18.56, p < 0.001).

3.4. Carbon Production

As shown in Table 5, the annual average carbon content of total litterfall in different forest communities on Lushan was highly significant (p < 0.001), showing that ACF 480.71 ± 42.00 g/kg) > RYF (476.25 ± 28.98 g/kg) > DBF (461.87 ± 49.65 g/kg) > EBF (445.36 ± 44.67 g/kg). Whereas the carbon content of the four types of forests did not differ significantly between different seasons (p > 0.05), the carbon content of leaf litterfall differed highly significantly between different seasons (p < 0.01), with seasonal variations showing winter > spring > autumn > summer (Table 6). However, the carbon content of both branch litterfall and other litterfall did not vary significantly among different seasons (p > 0.05), but there were significant differences among different forest types (p < 0.01). The average annual carbon content of branch litterfall (483.43 ± 62.25 g/kg) and other litterfall (478.99 ± 48.32 g/kg) were the highest in ACF (Table 5).
As shown in Table 7 and Table 8, the differences in carbon input to litterfall between forest communities and seasons were highly significant (p < 0.001), with EBF (29.74 ± 21.26 kg/ha) > ACF (23.93 ± 13.13 kg/ha) > RYF (20.77 ± 12.85 kg/ha) > DBF (11.40 ± 5.84 kg/ha ). In general, the annual average carbon input from leaf litterfall > branch litterfall > other litterfall among different forest communities. The seasonal differences in total and leaf litterfall carbon input were spring > autumn > winter > summer, with branch litterfall being autumn > spring > winter > summer, and other litterfall in spring > autumn > summer > winter.

4. Discussion

4.1. Changes in the Total Amount of Litterfall and Its Components in the Four Forest Communities

Forest litterfall is a reflection of the primary productivity of forest ecosystems and is important for the material cycle and energy flow of a forest ecosystem [19]. The annual litterfall production levels of different forest community types were significantly different during the study period, at EBF > ACF or DBF > RYF. Additionally, the difference between ACF and DBF was not significant, which may be related to the insignificant difference in the amount of branch litterfall between the two communities (Figure 2). The variation range of the total annual litterfall in the four forest communities is 256.06~390.03 t/hm2, and the difference in the proportion of each component is leaf litterfall > branch litterfall > other litterfall. The main factor affecting the annual litterfall output is the amount of fallen leaves, which is consistent with the proportion order of litterfall components in most tropical and subtropical forests in China [20,21].
For forests in the central subtropics, the peak of leaf fall production is mostly in spring and autumn [22,23]. In this study, the dynamics of leaf fall in the two secondary natural forests on Lushan Mountain were different. The peak of leaf litterfall in the EBF was in April, while that in the DBF was in October. Compared with DBF, evergreen broad-leaved tree species will produce a large amount of litterfall during the replacement of new and old leaves in spring, which provides a material basis for their rapid decomposition and nutrient return under high temperature and humidity conditions in summer [24]. The reason for the litter peak in autumn in DBF is that as the temperature decreases in autumn, the trees produce a large amount of physiological leaf fall in order to reduce the consumption of nutrients and water [25]. The highest peak in leaf drop in ACF and RYF is before the beginning of the growing season (March), which may be related to the presence of dominant tree species such as Cryptomeria japonica (L. f.) D. Don and P. taiwanensis in the community [26]. Both species prefer cool and alpine climates with high relative air humidity, and these two tree species are distributed at an altitude of about 1000 m. The warming temperatures and increased precipitation in March have a significant effect on plant nutrient availability at high altitudes on Lushan [27,28,29] (Figure 3a), thus increasing leaf drop.
Most of the branch litterfall occurred in autumn, but there were three peaks in the change of fallen branch peaks in the EBF during the study period. The reasons that affect the fall of branches include the phenological period of the tree itself [30], typhoon [31,32] and precipitation [33], etc. The randomness of branch litterfall and the possible delayed fall of dead branches may lead to uncertainty in the law of fall. This was also similar to the litterfall law of Mt. Ailao, SW China studied by Zhou J et al. [34]. Affected by the littering rhythm of tree species, the increase in reproductive organ litterfall in a period from April to May was due to factors such as plant growth and flowering and fruiting in spring [35], In contrast, the highest fruit drop in ACF and RYF occurred in October [36]. In this study, the second peak month of flower and fruit litterfall in the EBF and DBF was in August, probably due to the high metabolic rate in summer when the plants are at their peak growth due to the external temperature [37].

4.2. Effects of Stand Factors and Terrain Factors on Litterfall Production of the Four Forest Communities

The amount of forest litterfall is closely related to climate factors, as well as species composition [38] and stand structure [39,40], with each forest community type also showing great variation in the same climatic zone. Our research shows (Table 3) that the annual litterfall production of DBF increases with the increase in canopy closure, while the results of ACF and RYF indicate the opposite on the contrary, a disparity which is largely dependent on the relationship between leaf litterfall and canopy density. The increase in canopy density will significantly reduce understory shrubs [41], resulting in the decrease in litterfall production. However, the EBF and RYF are negatively correlated with the average stand density. Smaller stand density trees will receive more light to participate in photosynthesis and promote plant growth, thus producing more litterfall [42,43]. In contrast, the correlation between tree diameter and tree height was affected by both individual development and the external environment, and the amount of branch litterfall itself was uncertain [44].
Topographic factors can also affect changes in litterfall production, incident solar radiation and soil water effectiveness, which in turn affect plant phenology [4]. As slope increases, factors affecting plant growth such as temperature, light and moisture become important limiting conditions for plant growth [45], with shallow summit soils and lower water retention capacity [46]. Thus, the production of litterfall on the top of the hill was lower than that at the bottom of the slope (Table 1, Figure 2). The biological characteristics of forest dominant species not only affect the amount of litterfall in a stand, but also change the litterfall mode and the proportion of litterfall organs, resulting in a peak of litterfall in a specific month (Table 1, Figure 2).

4.3. Effects of Meteorological Factors on Litterfall Production in Four Forest Communities

In this study, it was found that the amount of leaf and branch litterfall in four forest communities was significantly negatively correlated with maximum rainfall and temperature (except for DBF) (Figure 3), indicating that the heat and moisture all are the limiting factors restricting the ecological force of Lushan forest. Water stress often affects the seasonality of precipitation, and trees under water stress conditions will have a negative impact on litterfall [47]. EBF produces a peak of branch drop in January, which is an adaptation strategy for plants to cope with low temperature [48,49,50]. The DBF has no significant difference in air temperature, indicating that the slope of the plot is steep (Table 1), that the forest is evenly heated, and that the temperature meets the growth needs of plants. Strong wind has a certain physical effect on the litterfall of leaves and branches, and the wind speed was positively correlated with the litterfall of the three forest communities during the study period (Figure 3).
Temperature and precipitation will have different effects on litterfall production under different altitude gradients [51,52]. During the study period, the amount of leaf litterfall in the low altitude area was negatively correlated with the maximum temperature, and in high altitude areas (positive correlation), this shows that Lushan Mountain has abundant annual precipitation which can meet the water requirements of plants during normal growth. Under the conditions of sufficient light and water, high temperature may restrict the growth and development of forests at low altitudes [53], and the litterfall production in high altitude area may be significantly increased after the temperature rises, indicating that temperature may be an important factor affecting forest productivity on Lushan Mountain. In addition, the physical effects of wind speed and maximum rainfall have also become the main factors affecting forest productivity on Lushan Mountain (Figure 3).

4.4. Differences in Carbon Input and Component Characteristics of Litterfall in Four Forest Communities in Different Seasons

Our study found that the energy distribution patterns of different tree species have certain similarities (Table 5). The annual average carbon content of leaf litterfall, branch litterfall and total litterfall of the four forest communities was the highest in the ACF and the lowest in the EBF (Table 5). The community structure of plantation forest is single, the competition between stand species is small, and it is easier for forest canopy to quickly reach a relatively stable state [54]. For montane forest climates, tall tree species in ACF (Cryptomeria japonica (L. f.) D. Don) enhance light capture while increasing carbon uptake and retention in aboveground and belowground components. The seasonal variation of carbon components in different forest communities is generally shown as winter > spring > autumn > summer (Table 6). Large amounts of fresh leaf deposition, occurring due to the mechanical action of strong winds or thunderstorms in spring, may show higher nutrient concentration levels [55]. The highest carbon content in winter may be related to extreme weather, such as heavy snowfall in the Lushan area in February, resulting in the production of fresh litterfall. Despite the limitations of our data, increasing global climate change will also affect nutrient cycling in mountain forest ecosystems.
Compared with other forest communities, the EBF had a higher average annual carbon input (Table 7). The total litterfall carbon input of the four forest communities was the highest in spring, followed by autumn, which may be related to the change trend of litterfall. EBF has rich species diversity, stable community structure, and general adaptability, while faster litterfall decomposition and turnover can better input nutrients and maintain soil fertility [56]. Therefore, protecting the EBF and studying the mechanism of controlling litterfall changes in other communities are of profound significance for improving the carbon sink function and for the ecological restoration of the whole forest ecosystem. In addition, among the nutrients absorbed by forest plants, more than 90% of the nitrogen and phosphorus and more than 60% of the mineral elements come from the nutrients returned to the soil by litterfall [57]. As such, the impact of soil nutrients on the nutrient input of litterfall needs to be further studied.

5. Conclusions

The dynamic change in litterfall production reflects the ecological process of the forest and the impact of environmental variables on vegetation. The annual litterfall production of Lushan Mountain is the highest in the EBF in the natural secondary forest, and fallen leaves are the main productivity. The results show that the natural restoration model is more conducive to the increase in litterfall productivity, and the ecological restoration after forest degradation should choose natural restoration for forest management. There is a linear relationship between stand factor and litter yield, but the correlation degree R2 is small. Reasonable human management can improve forest structure and function, improve its resistance and resilience, and accelerate its succession. The yield of litterfall on the top of the hill is lower than that at the bottom of the slope. In order to reduce erosion and soil degradation, priority should be given to protecting and maintaining the top of the slope with a steep slope. Litterfall carbon input in the Lushan area mainly comes from EBF, strengthening the scientific management of litterfall in this community is of great significance for maintaining and improving soil carbon pool on Lushan. The annual litterfall production and annual average carbon input in spring and autumn are higher. In the context of global change, litterfall production and nutrient input may change with climate change. The factors affecting the characteristics of forest litterfall are complex and diverse. It is necessary to deeply study the response of litterfall to climatic factors, and then grasp the changes of litterfall and the material cycle and energy flow of forest.

Author Contributions

Conceptualization, L.Q., T.X. and Y.L.; Methodology, L.Q., T.X., T.B., X.M., J.H. and W.D.; Data curation and analysis, L.Q. and T.X.; writing—original draft, L.Q.; writing—review and editing, T.X. and Y.L. All authors have read and agreed to the published version of the manuscript.

Funding

This research was supported by the National Natural Science Foundation of China (No. 31960303) and by Ant Group through the CCF-AFSG Research Grant (CCF-AFSG RF20220214).

Data Availability Statement

Not applicable.

Acknowledgments

We would like to thank Tianjun Bai and Jiahui Huang for his help in sampling in the field.

Conflicts of Interest

The authors declare no conflict of interest.

References

  1. Albrich, K.; Rammer, W.; Seidl, R. Climate change causes critical transitions and irreversible alterations of mountain forests. Glob. Chang. Biol. 2020, 26, 4013–4027. [Google Scholar] [CrossRef] [PubMed]
  2. Marler, T.E.; Cruz, G.N. Temporal Variation of Litterfall and Nutrient Return of Serianthes nelsonii Merr. in a Tropical Karst Forest. Plants 2022, 11, 2310. [Google Scholar] [CrossRef] [PubMed]
  3. Pugh, T.A.; Lindeskog, M.; Smith, B.; Poulter, B.; Arneth, A.; Haverd, V.; Calle, L. Role of forest regrowth in global carbon sink dynamics. Proc. Natl. Acad. Sci. USA 2019, 116, 4382–4387. [Google Scholar] [CrossRef] [PubMed]
  4. Morffi-Mestre, H.; Ángeles-Pérez, G.; Powers, J.S.; Andrade, J.L.; Huechacona Ruiz, A.H.; May-Pat, F.; Chi-May, F.; Dupuy, J.M. Multiple factors influence seasonal and interannual litterfall production in a tropical dry forest in mexico. Forests 2020, 11, 1241. [Google Scholar] [CrossRef]
  5. Liu, X.; Zeng, X.; Zou, X.; González, G.; Wang, C.; Yang, S. Litterfall production prior to and during Hurricanes Irma and Maria in four Puerto Rican forests. Forests 2018, 9, 367. [Google Scholar] [CrossRef]
  6. Zheng, H.; Ouyang, Z.Y.; Wang, X.K.; Fang, Z.G.; Zhao, T.Q.; Miao, H. Effects of regenerating forest cover on soil microbial communities: A case study in hilly red soil region, Southern China. For. Ecol. Manag. 2005, 217, 244–254. [Google Scholar] [CrossRef]
  7. Kamruzzaman, M.; Osawa, A.; Deshar, R.; Sharma, S.; Mouctar, K. Species composition, biomass, and net primary productivity of mangrove forest in Okukubi River, Okinawa Island, Japan. Reg. Stud. Mar. Sci. 2017, 12, 19–27. [Google Scholar] [CrossRef]
  8. Williams-Linera, G.; Bonilla-Moheno, M.; López-Barrera, F.; Tolome, J. Litterfall, vegetation structure and tree composition as indicators of functional recovery in passive and active tropical cloud forest restoration. For. Ecol. Manag. 2021, 493, 119260. [Google Scholar] [CrossRef]
  9. Lopes, M.C.A.; Araújo, V.F.P.; Vasconcellos, A. The effects of rainfall and vegetation on litterfall production in the semiarid region of northeastern Brazil. Braz. J. Biol. 2015, 75, 703–708. [Google Scholar] [CrossRef]
  10. Zhang, Y.; Sun, P. Study on the diurnal dynamic changes and prediction models of the moisture contents of two litters. Forests 2020, 11, 95. [Google Scholar] [CrossRef] [Green Version]
  11. Giweta, M. Role of litter production and its decomposition, and factors affecting the processes in a tropical forest ecosystem: A review. J. Ecol. Environ. 2020, 44, 11. [Google Scholar] [CrossRef]
  12. Erkan, N.; Comez, A.; Aydin, A.C. Litterfall production, carbon and nutrient return to the forest floor in Pinus brutia forests in Turkey. Scand. J. For. Res. 2020, 35, 341–350. [Google Scholar] [CrossRef]
  13. Du, B.; Liu, C.; Kang, H.; Zhu, P.; Yin, S.; Shen, G.; Hou, J.; Ilvesniemi, H. Climatic control on plant and soil δ13C along an altitudinal transect of Lushan Mountain in Subtropical China: Characteristics and interpretation of soil carbon dynamics. PLoS ONE 2014, 9, e86440. [Google Scholar] [CrossRef]
  14. Xiao, T.; Wang, C.; Yuan, X.; Tao, L.; Li, P.; Deng, W.; Liu, Y. Effects of Different Forest Gap Ages on Soil Physical Properties and Stoichiometric Characteristics in Cryptomeria japonica plantations (Lf) D. Don, 1839. Forests 2022, 13, 1708. [Google Scholar] [CrossRef]
  15. Liu, X.; Wang, L. Scientific Survey and Study of Biodiversity on the Lushan Nature Reserve in Jiangxi Province; Science Press: Beijing, China, 2010. [Google Scholar]
  16. Liu, X.; Nie, Y.; Wen, F. Seasonal dynamics of stem radial increment of Pinus taiwanensis Hayata and its response to environmental factors in the Lushan Mountains, Southeastern China. Forests 2018, 9, 387. [Google Scholar] [CrossRef]
  17. Liu, W.; Liao, L.; Liu, Y.; Wang, Q.; Murray, P.J.; Jiang, X.; Zou, G.; Cai, J.; Zhao, X. Effects of Phyllostachys Pubescens Expansion on Underground Soil Fauna Community and Soil Food Web in a Cryptomeria Japonica Plantation, Lushan Mountain, Subtropical China. J. Soils Sediments 2021, 21, 2212–2227. [Google Scholar] [CrossRef]
  18. Yu, F.; Zhang, Z.; Chen, L.; Wang, J.; Shen, Z. Spatial distribution characteristics of soil organic carbon in subtropical forests of mountain Lushan, China. Environ. Monit. Assess. 2018, 190, 545. [Google Scholar] [CrossRef]
  19. Koyejo, A.O.; Okpara, D.A.; Onyeonagu, C.C.; Eteng, E.U. Effects of climatic variations on leaf litter production in A. floribunda agroforestry system in South-East Nigeria. Niger. J. Soil Sci. 2020, 30, 42–48. [Google Scholar]
  20. Huang, Y.; Ma, Y.; Zhao, K.; Niklaus, P.A.; Schmid, B.; He, J.S. Positive effects of tree species diversity on litterfall quantity and quality along a secondary successional chronosequence in a subtropical forest. J. Plant Ecol. 2017, 10, 28–35. [Google Scholar] [CrossRef]
  21. Jia, B.; Xu, Z.; Zhou, G.; Yin, X. Statistical characteristics of forest litterfall in China. Sci. China Life Sci. 2018, 61, 358–360. [Google Scholar] [CrossRef]
  22. Kamruzzaman, M.D.; Basak, K.; Paul, S.K.; Ahmed, S.; Osawa, A. Litterfall production, decomposition and nutrient accumulation in Sundarbans mangrove forests, Bangladesh. For. Sci. Technol. 2019, 15, 24–32. [Google Scholar] [CrossRef]
  23. Xing, J.; Wang, K.; Song, Y.; Zhang, Y.; Zhang, Z.; Pan, T. Characteristics of litter return and nutrient dynamic change in four typical forests in the subalpine of central Yunnan province. J. Cent. South Univ. Technol. 2021, 41, 134–144. [Google Scholar]
  24. Liu, X.; Wang, Z.; Liu, X.; Lu, Z.; Li, D.; Gong, H. Dynamic Change Characteristics of Litter and Nutrient Return in Subtropical Evergreen Broad-Leaved Forest in Different Extreme Weather Disturbance Years in Ailao Mountain, Yunnan Province. Forests 2022, 13, 1660. [Google Scholar] [CrossRef]
  25. Zhao, Y.; Chen, X.; Kim, J.S.; Williams, M. Effects of temperature and precipitation on litterfall phenology in four evergreen broad-leaved forests of southern China. Biotropica 2022, 54, 739–753. [Google Scholar] [CrossRef]
  26. Yoshida, T.; Hijii, N. Spatiotemporal distribution of aboveground litter in a Cryptomeria japonica plantation. J. For. Res.-Jpn. 2006, 11, 419–426. [Google Scholar] [CrossRef]
  27. Guo, J.; Yu, L.H.; Fang, X.; Xiang, W.H.; Deng, X.W.; Lu, X. Litter production and turnover in four types of subtropical forests in China. Acta Ecol. Sin. 2015, 35, 4668–4677. [Google Scholar]
  28. Almagro, M.; Maestre, F.T.; Martínez-López, J.; Valencia, E.; Rey, A. Climate change may reduce litter decomposition while enhancing the contribution of photodegradation in dry perennial Mediterranean grasslands. Soil Biol. Biochem. 2015, 90, 214–223. [Google Scholar] [CrossRef]
  29. Wang, C.G.; Zheng, X.B.; Wang, A.Z.; Dai, G.H.; Zhu, B.K.; Zhao, Y.M.; Dong, S.J.; Zu, W.Z.; Wang, W.; Zheng, Y.G.; et al. Temperature and Precipitation Diversely Control Seasonal and Annual Dynamics of Litterfall in a Temperate Mixed Mature Forest, Revealed by Long-Term Data Analysis. J. Geophys. Res.-Biogeosci. 2021, 126, e2020JG006204. [Google Scholar] [CrossRef]
  30. Muller-Landau, H.C.; Cushman, K.C.; Arroyo, E.E.; Martinez Cano, I.; Anderson-Teixeira, K.J.; Backiel, B. Patterns and mechanisms of spatial variation in tropical forest productivity, woody residence time, and biomass. New Phytol. 2021, 229, 3065–3087. [Google Scholar] [CrossRef]
  31. Qun, L.X.C.M.F.; Mei, L.M.H.Y.D. Leaf fall patterns of 12 evergreen woody species in subtropical evergreen forest in Tiantong Mountain of Zhejiang Province, China. Bull. Bot. Res. 2014, 34, 741–750. [Google Scholar]
  32. Jaramillo, V.J.; Martínez-Yrízar, A.; Machado, L.I. Hurricane-Induced Massive Nutrient Return via Tropical Dry Forest Litterfall: Has Forest Biogeochemistry Resilience Changed? Ecosystems 2022, 25, 1767–1779. [Google Scholar] [CrossRef]
  33. Ge, X.; Wang, C.; Wang, L.; Zhou, B.; Cao, Y.; Xiao, W.; Li, M.H. Drought changes litter quantity and quality, and soil microbial activities to affect soil nutrients in moso bamboo forest. Sci. Total. Environ. 2022, 838, 156351. [Google Scholar] [CrossRef]
  34. Zhou, J.; Lang, X.; Du, B.; Zhang, H.; Liu, H.; Zhang, Y.; Shang, L. Litterfall and nutrient return in moist evergreen broad-leaved primary forest and mixed subtropical secondary deciduous broad-leaved forest in China. Eur. J. For. Res. 2016, 135, 77–86. [Google Scholar] [CrossRef]
  35. Azad, M.S.; Kamruzzaman, M.; Paul, S.K.; Kanzaki, M. Litterfall release, vegetative, and reproductive phenology investigation of Heritiera fomes Buch-Ham in the Sundarbans mangrove forests, Bangladesh: Relationship with environmental variables. For. Sci. Technol. 2020, 16, 105–115. [Google Scholar] [CrossRef]
  36. Sun, X.; Liu, F.; Zhang, Q.; Li, Y.; Zhang, L.; Wang, J.; Zhang, H.; Wang, C.; Wang, X. Biotic and climatic controls on the interannual variation in canopy litterfall of a deciduous broad-leaved forest. Agric. For. Meteorol. 2021, 307, 108483. [Google Scholar] [CrossRef]
  37. De Queiroz, M.G.; da Silva, T.G.F.; Zolnier, S.; de Souza, C.A.A.; de Souza, L.S.B.; Neto, A.J.S.; de Araújo, G.G.L.; Ferreira, W.P.M. Seasonal patterns of deposition litterfall in a seasonal dry tropical forest. Agric. For. Meteorol. 2019, 279, 107712. [Google Scholar] [CrossRef]
  38. Gaspar-Santos, E.S.; González-Espinosa, M.; Ramírez-Marcial, N.; Álvarez-Solís, J.D. Acumulación y descomposición de hojarasca en bosques secundarios del sur de la Sierra Madre de Chiapas, México. Bosque 2015, 36, 467–480. [Google Scholar] [CrossRef]
  39. Erkan, N.; Comez, A.; Aydin, A.C.; Denli, O.; Erkan, S. Litterfall in relation to stand parameters and climatic factors in Pinus brutia forests in Turkey. Scand. J. For. Res. 2018, 33, 338–346. [Google Scholar] [CrossRef]
  40. Kim, C.; Baek, G.; Choi, B.; Baek, G.; Kim, H. Quantifying Litterfall Input from the Stand Parameters of Korean Red Pine (Pinus densiflora S. et Z.) Stands in Gyeongnam Province. J. Korean Soc. For. Sci. 2021, 110, 569–576. [Google Scholar]
  41. Feng, C.; Wang, Z.; Ma, Y.; Fu, S.; Chen, H.Y. Increased litterfall contributes to carbon and nitrogen accumulation following cessation of anthropogenic disturbances in degraded forests. For. Ecol. Manag. 2019, 432, 832–839. [Google Scholar] [CrossRef]
  42. Jiménez, M.N.; Navarro, F.B. Thinning effects on litterfall remaining after 8 years and improved stand resilience in Aleppo pine afforestation (SE Spain). J. Environ. Manag. 2016, 169, 174–183. [Google Scholar] [CrossRef] [PubMed]
  43. Bahru, T.; Ding, Y. Effect of stand density, canopy leaf area index and growth variables on Dendrocalamus brandisii (Munro) Kurz litter production at Simao District of Yunnan Province, southwestern China. Glob. Ecol. Conserv. 2020, 23, e01051. [Google Scholar] [CrossRef]
  44. Murphy, B.P.; Prior, L.D.; Cochrane, M.A.; Williamson, G.J.; Bowman, D.M. Biomass consumption by surface fires across Earth’s most fire prone continent. Glob. Chang. Boil. 2019, 25, 254–268. [Google Scholar] [CrossRef] [PubMed]
  45. Sanaphre-Villanueva, L.; Dupuy, J.M.; Andrade, J.L.; Reyes, C.; Jackson, P.C.; Paz, H. Patterns of plant functional variation and specialization along secondary succession and topography in a tropical dry forest. Environ. Res. Lett. 2017, 12, 55004. [Google Scholar] [CrossRef]
  46. Markesteijn, L.; Poorter, L.; Paz, H.; Sack, L.; Bongers, F. Ecological differentiation in xylem cavitation resistance is associated with stem and leaf structural traits. Plant Cell Environ. 2010, 34, 137–148. [Google Scholar] [CrossRef]
  47. Liu, C.; Westman, C.J.; Berg, B.; Kutsch, W.; Wang, G.Z.; Man, R.; Ilvesniemi, H. Variation in Litterfall-Climate Relationships between Coniferous and Broadleaf Forests in Eurasia. Glob. Ecol. Biogeogr. 2010, 13, 105–114. [Google Scholar] [CrossRef]
  48. Gu, X.; Yang, C.; Zhao, H.; Hu, N.; Krauss, K.W.; Deng, C.; Chen, L. Sap flow evidence of chilling injury and recovery in mangroves following a spring cold spell. Trees 2021, 35, 907–917. [Google Scholar] [CrossRef]
  49. Zhang, H.; Zhao, Y.; Zhu, J.K. Thriving under stress: How plants balance growth and the stress response. Dev. Cell 2020, 55, 529–543. [Google Scholar] [CrossRef]
  50. Zhu, X.; Liu, W.; Chen, H.; Deng, Y.; Chen, C.; Zeng, H. Effects of forest transition on litterfall, standing litter and related nutrient returns: Implications for forest management in tropical China. Geoderma 2019, 333, 123–134. [Google Scholar] [CrossRef]
  51. Kitayama, K.; Ushio, M.; Aiba, S.I. Temperature is a dominant driver of distinct annual seasonality of leaf litter production of equatorial tropical rain forests. J. Ecol. 2021, 109, 727–736. [Google Scholar] [CrossRef]
  52. Zhou, G.; Guan, L.; Wei, X.; Zhang, D.; Zhang, Q.; Yan, J.; Wen, D.; Liu, J.; Liu, S.; Huang, Z.; et al. Litterfall production along successional and altitudinal gradients of subtropical monsoon evergreen broadleaved forests in Guangdong, China. Plant Ecol. 2007, 188, 77–89. [Google Scholar] [CrossRef]
  53. Dai, Y.; Gong, F.; Yang, X.; Chen, X.; Su, Y.; Liu, L.; Sun, Q. Litterfall seasonality and adaptive strategies of tropical and subtropical evergreen forests in China. J. Plant Ecol. 2022, 15, 320–334. [Google Scholar] [CrossRef]
  54. Wan, S.; Fu, S.; Zhang, C.; Liu, J.; Zhang, Y.; Mao, R. Effects of understory removal and litter addition on leaf and twig decomposition in a subtropical Chinese fir plantation. Land Degrad. Dev. 2021, 32, 5004–5011. [Google Scholar] [CrossRef]
  55. Asigbaase, M.; Dawoe, E.; Lomax, B.H.; Sjogersten, S. Temporal changes in litterfall and potential nutrient return in cocoa agroforestry systems under organic and conventional management, Ghana. Heliyon 2021, 7, e08051. [Google Scholar] [CrossRef]
  56. Maas, G.C.B.; Sanquetta, C.R.; Marques, R.; Machado, S.D.A.; Sanquetta, M.N.; Corte, A.P.D.; Barberena, I.M. Carbon production from seasonal litterfall in the Brazilian Atlantic Forest. South. For. 2021, 83, 128–134. [Google Scholar] [CrossRef]
  57. Chen, Z.; Jin, Y.; Yao, X.; Wei, X.; Li, X.; Li, C.; White, J.; Nan, Z. Gene analysis reveals that leaf litter from Epichloë endophyte-infected perennial ryegrass alters diversity and abundance of soil microbes involved in nitrification and denitrification. Soil Biol. Biochem. 2021, 154, 108123. [Google Scholar] [CrossRef]
Figure 1. Location of the study area. The black triangles represent the locations of the 9 sample plots, and the black arrows point to the various plots (Plots 01–09); the red circle represents the standard meteorological observation station at an altitude of 210 m; the blue five-pointed star represents the comprehensive observation tower at an altitude of 1082 m.
Forests 14 00341 g001
Figure 2. Monthly dynamic in total litterfall production and components in four forest community types (mean ± standard deviation). (a) represents the monthly dynamics of total litterfall production, (b) represents the monthly dynamics of leaf litterfall production, (c) represents the monthly dynamics of branch litterfall production, and (d) represents the monthly dynamics of other litterfall production.
Forests 14 00341 g002
Figure 3. Correlation analysis of litterfall production and components with meteorological factors in four forest community types (ad). (a): evergreen broad-leaved forest; (b): deciduous broad-leaved forest; (c): artificial coniferous forest; (d): renew young forest. x axis: yield of each component of litterfall; y axis: various meteorological factors. Blue represents a negative correlation between two variables, red represents a positive correlation between variables, the number in each cell indicates the correlation coefficient, and the numbers with “×” indicate there is no significant correlation. MMT: average temperature; MMaT: maximum temperature; MMiT: minimum temperature; P: total precipitation; Pmax: maximum precipitation; V: average wind speed; Vmax: maximum wind speed; RH: relative humidity. Leaves: leaf litterfall; Twigs: twig litterfall; Others: other litterfall.
Forests 14 00341 g003
Figure 4. Differences in diurnal variation of eight meteorological factors at low and high altitudes on Lushan Mountain. x axis: two altitudes; y axis: various meteorological factors. MMT: average temperature; MMaT: maximum temperature; MMiT: minimum temperature; P: total precipitation; Pmax: maximum precipitation; V: average wind speed; Vmax: maximum wind speed; RH: relative humidity. **** means p < 0.001; ns means p > 0.05.
Forests 14 00341 g004
Table 1. Lushan Mountain ecological station fixed monitoring sample site information.
PlotCommunity TypesSample SizeAltitude (m)SlopeSlope GradientSlope PositionMain Species
01Evergreen broad-leaved forest30 m × 40 m229W24Base of slopeLithocarpus glaber (Thunb.) Nakai; Loropetalum chinense (R. Br.) Oliver; Castanopsis sclerophylla (Lindl.) Schott.; Cinnamomum Camphora (L.) Presl.
02Evergreen deciduous broad-leaved forest30 m × 40 m319NW28Base of slopeLithocarpus glaber (Thunb.) Nakai;
Clerodendrum cyrtophyllum Turcz.; Castanopsis eyrei (Champ. ex Benth.) Tutch.; Alangium chinense; Liquidambar formosana
03Evergreen deciduous broad-leaved forest30 m × 40 m330S29Base of slopePhotinia beauverdiana C. K. Schneid.; Loropetalum chinense (R. Br.) Oliver; Camellia oleifera Abel.; Styrax japonicus Sieb. et Zucc.; Alniphyllum fortunei (Hemsl.) Makino
04Retrofitting regeneration community of Cryptomeria japonica (L. f.) D. Don (2012 years)30 m × 30 m1084SW27Slope crestCryptomeria japonica (L. f.) D. Don; Indocalamus tessellatus (Munro) Keng f.; Lindera reflexa Hemsl.; Symplocos stellaris Brand
05Pure forest of Cryptomeria japonica (L. f.) D. Don30 m × 30 m1080SW30Slope crestCryptomeria japonica (L. f.) D. Don
06Pure forest of P. taiwanensis30 m × 30 m1076SW35Slope crestP. taiwanensis
07Retrofitting regeneration community of P. taiwanensis
(2012 years)
30 m × 30 m1075SW20Slope crestP. taiwanensis; Koelreuteria paniculata Laxm.; Pterostyrax corymbosus Sieb. et Zucc.; Quercus glandulifera Bl.
08Pure forest of P. taiwanensis30 m × 30 m972W45Slope crestP. taiwanensis
09Deciduous broad-leaved forest200 m × 300 m990–1200N50Slope crestCerasus serrulata (Lindl.) G. Don ex London; Sorbus folgneri (Schneid.) Rehd.; Cornus kousa subsp. chinensis (Osborn) Q. Y. Xiang; Corylopsis sinensis Hemsl.; Lindera reflexa Hemsl.
Table 2. Annual yield and proportion of total litterfall and its components in four forest community types.
Forest TypesComponent
Leaves
/t·ha−1
Branches
/t·ha−1
Others
/t·ha−1
Total
/t·ha−1
EBF2.45 ± 0.41 a
(63.00%)
0.78 ± 0.15 a
(20.00%)
0.67 ± 0.12 a
(17.00%)
3.90 ± 0.47 a
(100.00%)
DBF1.88 ± 0.32 c
(64.00%)
0.51 ± 0.09 c
(18.00%)
0.53 ± 0.12 b
(18.00%)
2.92 ± 0.38 b
(100.00%)
ACF2.03 ± 0.37 b
(68.00%)
0.51 ± 0.17 c
(17.00%)
0.43 ± 0.09 c
(15.00%)
2.98 ± 0.47 b
(100.00%)
RYF1.74 ± 0.22 d
(68.00%)
0.45 ± 0.09 b
(18.00%)
0.37 ± 0.08 d
(15.00%)
2.56 ± 0.27 c
(100.00%)
Note: The number in the first row of each cell in the table is the annual yield of each component of litters (mean ± standard deviation), and the number in parentheses is the percentage of this component in the total annual litters. Different lowercase letters indicated significant differences in the components of the four community types in the same column (p < 0.05). EBF: evergreen broad-leaved forest; DBF: deciduous broad-leaved forest; ACF: artificial coniferous forest; RYF: renew young forest.
Table 3. Multiple linear regression models of litterfall production and its components with stand factors for four forest communities.
Forest TypesComponent (y)Regression EquationR2Fp
EBFTotalY = −0.02 MSD − 3.72 Ht + 152.620.08725.490.012
LeavesY = −0.02 MSD − 3.91 Ht + 140.890.1275.0330.001
BranchesY = −0.68 DBH + 17.6440.1606.6250.000
OthersY = 0.69 DBH − 5.920.1405.6480.000
DBFTotalY = 38.83 CD − 20.10 DBH + 217.770.1553.0650.022
LeavesY = 29.94 CD − 16.86 DBH + 165.460.1402.7160.037
BranchesY = −5.77 DBH − 2.17 Ht + 85.240.2816.5370.000
OthersY = 1.56 Ht − 32.930.2625.9620.000
ACFTotalY = −26.78 CD − 0.01 MSD + 79.600.23210.5070.000
LeavesY = −22.19 CD − 0.01 MSD − 1.55 Ht + 75.870.28814.0240.000
BranchesY = −6.31 CD − 0.01 MSD + 0.45 Ht − 3.440.1385.5540.000
RYFTotalY = −64.95 CD + 0.01 MSD − 1.71 DBH + 38.690.1574.2440.003
LeavesY = −51.53 CD + 0.01 MSD − 1.70 DBH + 38.690.2206.4140.000
BranchesY = −9.80 CD + 3.690.1202.1530.050
Note: Y: litterfall production; MSD: mean stand density; CD: canopy density; Ht: average tree height; DBH: average stem diameter.
Table 4. Regression analysis of litterfall production and its components with meteorological factors at different altitudes.
Component (y)Regression EquationR2Fp
Low altitudeTotalY = −15.29 MMT + 17.27 MMiT + 107.43 V − 46.74 Vmax + 5.61 RH − 479.060.64333.250.000 ***
LeavesY = −13.846 MMT + 14.74 MMiT − 0.10 P + 0.49 Pmax + 89.21 V −29.29 Vmax + 5.13 RH − 509.170.67838.570.000 ***
BranchesY = −1.20 MMaT + 0.88 MMiT + 0.05 P − 0.29 Pmax + 10 V − 11.17 Vmax + 62.190.51019.610.000 ***
OthersY = −1.70 MMT + 1.70 MMiT + 8.44 V − 6.33 Vmax + 0.57 RH − 33.480.2296.310.000 ***
High altitudeTotalY = 1.6 MMaT − 1.62 MMiT − 0.02 P − 10.47 V + 3.53 Vmax + 1.34 RH − 117.470.38625.490.000 ***
LeavesY = 2.34 MMaT − 11.75 V + 3.04 Vmax + 0.80 RH − 67.280.38325.110.000 ***
BranchesY = 1.28 MMT − 0.78 MMaT − 0.76 MMiT + 3.44 V − 0.54 Vmax + 0.34 RH − 30.910.31118.560.000 ***
OthersY = 0.12 Pmax + 2.16 V − 1.03 Vmax + 0.21 RH − 19.340.32319.540.000 ***
Note: MMT: average temperature; MMaT: maximum temperature; MMiT: minimum temperature; P: total precipitation; Pmax: maximum precipitation; V: average wind speed; Vmax: maximum wind speed; RH: relative humidity. *** means p < 0.001.
Table 5. Average annual carbon content of litterfall in different forest communities (g·kg−1).
Forest TypesComponent
Leaves
/g·kg−1
Branches
/g·kg−1
Others
/g·kg−1
Total
/g·kg−1
EBF448.18 ± 55.51 c
(33.55%)
436.53 ± 47.93 c
(32.68%)
451.11 ± 66.34 b
(33.77 %)
445.36 ± 44.67 c
(100.00%)
DBF469.72 ± 61.44 b
(33.94%)
475.61 ± 68.70 ab
(34.37%)
438.56 ± 62.03 b
(31.69%)
461.87 ± 49.65 b
(100.00%)
ACF479.54 ± 64.16 ab
(33.26%)
483.43 ± 62.25 a
(33.53%)
478.99 ± 48.32 a
(33.22%)
480.71 ± 42.00 a
(100.00%)
RYF492.26 ± 39.39 a
(34.49%)
459.05 ± 47.36 b
(32.16%)
476.14 ± 48.70 a
(33.36%)
476.25 ± 28.98 ab
(100.00%)
Note: The number in the first row of each cell in the table is the annual carbon yield of each component of litterfall (mean ± standard deviation), and the number in parentheses is the percentage of this component in the total annual carbon. Different lowercase letters indicated significant differences in the components of the four community types in the same column (p < 0.05). EBF: evergreen broad-leaved forest; DBF: deciduous broad-leaved forest; ACF: artificial coniferous forest; RYF: renew young forest.
Table 6. Carbon content of litterfall compositions in different seasons (g·kg−1).
SeasonComponent
Leaves
/g·kg−1
Branches
/g·kg−1
Others
/g·kg−1
Total
/g·kg−1
Spring479.85 ± 61.02 ab
(33.55%)
454.74 ± 48.66 a
(32.68%)
459.11 ± 55.68 a
(33.77%)
464.64 ± 44.93 ab
(100.00%)
Summer450.75 ± 66.89 c
(33.94%)
469.700 ± 74.74 a
(34.37%)
471.54 ± 52.17 a
(31.69%)
463.85 ± 35.90 ab
(100.00%)
Autumn464.04 ± 38.82 cb
(33.26%)
453.17 ± 47.23 a
(33.53%)
451.48 ± 40.73 a
(33.22%)
456.26 ± 29.64 b
(100.00%)
Winter488.23 ± 58.72 a
(34.49%)
474.06 ± 62.92 a
(32.16%)
465.75 ± 80.35 a
(33.36%)
476.22 ± 60.54 a
(100.00%)
Note: The number in the first row of each cell in the table is the seasonal carbon yield of each component of litterfall (mean ± standard deviation), and the number in parentheses is the percentage of this component in the total carbon. Different lowercase letters indicated significant differences in the components of the different seasons in the same column (p < 0.05).
Table 7. Annual average carbon input of different forest community litterfall components (kg·ha−1).
Forest TypesComponent
Leaves
/kg·ha−1
Branches
/kg·ha−1
Others
/kg·ha−1
Total
/kg·ha−1
EBF18.89 ± 14.62 a
(64.00%)
5.66 ± 2.87 a
(19.00%)
5.19 ± 3.77 a
(17.00%)
29.74 ± 21.26 a
(100.00%)
DBF7.46 ± 3.48 c
(65.00%)
1.95 ± 1.35 c
(17.00%)
1.99 ± 1.01 c
(18.00%)
11.40 ± 5.84 c
(100.00%)
ACF16.33 ± 9.34 ab
(68.00%)
4.14 ± 2.16 b
(17.00%)
3.46 ± 1.63 b
(15.00%)
23.93 ± 13.13 b
(100.00%)
RYF14.33 ± 9.24 b
(69.00%)
3.49 ± 1.76 b
(17.00%)
2.95 ± 1.85 b
(14.00%)
20.77 ± 12.85 b
(100.00%)
Note: The number in the first row of each cell in the table is the annual carbon input yield of each component of litterfall (mean ± standard deviation), and the number in parentheses is the percentage of this component in the total annual carbon input. Different lowercase letters indicated significant differences in the components of the four community types in the same column (p < 0.05). EBF: evergreen broad-leaved forest; DBF: deciduous broad-leaved forest; ACF: artificial coniferous forest; RYF: renew young forest.
Table 8. Carbon input of litterfall compositions in different seasons (kg·ha−1).
SeasonComponent
Leaves
/kg·ha−1
Branches /kg·ha−1Others
/kg·ha−1
Total
/kg·ha−1
Spring21.56 ± 10.73 a
(73.00%)
3.45 ± 1.86 c
(12.00%)
4.59 ± 3.43 a
(15.00%)
29.60 ± 16.02 a
(100.00%)
Summer7.21 ± 3.80 c
(55.00%)
2.40 ± 1.06 d
(18.00%)
3.51 ± 1.12 b
(27.00%)
13.12 ± 5.98 c
(100.00%)
Autumn18.74 ± 7.69 a
(66.00%)
5.57 ± 2.71 a
(20.00%)
3.85 ± 1.50 ab
(14.00%)
28.16 ± 11.90 a
(100.00%)
Winter12.19 ± 5.06 b
(63.00%)
4.69 ± 1.71 b
(25.00%)
2.37 ± 1.03 c
(12.00%)
19.25 ± 7.80 b
(100.00%)
Note: The number in the first row of each cell in the table is the seasonal carbon input yield of each component of litterfall (mean ± standard deviation), and the number in parentheses is the percentage of this component in the total carbon input. Different lowercase letters indicated significant differences in the components of the different seasons in the same column (p < 0.05).
Disclaimer/Publisher’s Note: The statements, opinions and data contained in all publications are solely those of the individual author(s) and contributor(s) and not of MDPI and/or the editor(s). MDPI and/or the editor(s) disclaim responsibility for any injury to people or property resulting from any ideas, methods, instructions or products referred to in the content.

