Article

Distribution Characteristics of Active Soil Substances along Elevation Gradients in the Southern of Taihang Mountain, China

1
College of Forestry, Henan Agricultural University, Zhengzhou 450046, China
2
China Construction Seventh Engineering Division Corp. Ltd., Zhengzhou 450004, China
3
State Key Laboratory of Atmospheric Boundary Layer Physics and Atmospheric Chemistry, Institute of Atmospheric Physics, Chinese Academy of Sciences, Beijing 100029, China
4
Department of Atmospheric Chemistry and Environmental Science, College of Earth and Planetary Sciences, University of Chinese Academy of Sciences, Beijing 100049, China
*
Author to whom correspondence should be addressed.
Forests 2023, 14(2), 370; https://doi.org/10.3390/f14020370
Submission received: 31 December 2022 / Revised: 7 February 2023 / Accepted: 8 February 2023 / Published: 12 February 2023

Abstract

:
Active soil substances, which can indicate environmental changes sensitively, have the fastest turnover rate. Vegetation diversity and soil bio-physicochemical properties according to five elevations classes (800 m, 1000 m, 1100 m, 1200 m, and 1500 m a.s.l.) in the Southern Taihang Mountain were investigated. Soil ammonium-N (NH4+—N), nitrate-N (NO3—N), microbial biomass carbon (MBC), and nitrogen (MBN), as well as soil urease (URE) and sucrose (SUC) activities were determined. The results showed that elevation gradients, soil layers, and their interaction had significant effects on most of the active soil substances. With the rise of elevation, soil NO3—N, inorganic N, MBC, and MBN contents, as well as SUC activity and SUC/MBC ratio basically showed an inverted V-shaped distribution trend and reached the peak value at 1100 m (p < 0.05). Soil URE showed a fluctuating upward trend and reached the peak value at 1500 m (p < 0.05), and the URE/MBC ratio showed a straight upward trend. With the depth of soil layer, the contents of active soil substances tended to decrease, showing a phenomenon of surface aggregation. Active soil substances were correlated with plant community diversity indexes, soil water content, pH, available N, and available phosphorus contents, and available N was the main factor affecting active soil substances, which could explain 34.4% of the variation. In summary, at the intermediate slope of 1100 m, soil moisture and tightness were suitable for soil microbial activity and plant growth, the highest contents of active soil substances, indicating a fast turnover of soil carbon and nitrogen. The present study enriched our understanding of soil carbon and nitrogen turnover mechanisms in the mountain ecosystem.

1. Introduction

Global warming causes ecological imbalances, leading to the decline of biodiversity, and mountain ecosystems, as one of the most climate-sensitive ecosystems in the world, are particularly vulnerable to the effects of climate warming [1,2,3]. Forests, the largest carbon pool in terrestrial ecosystems, play an important role in the carbon cycle and also affect nitrogen dynamics [4,5]. Soil active carbon (C) and nitrogen (N) are the most active components underground, and their dynamics are of great significance to the C and N cycle processes within and between ecosystems [6]. In addition, altitude has been identified as a potential factor affecting soil nutrient cycling. With the increase of altitude, microclimates will affect the distribution and composition of vegetation, soil conditions, and nutrient cycling [7,8].
Active soil substances, including soil inorganic nitrogen, soil microbial biomass, and soil enzymes, have a fast turnover rate and are very sensitive to micro-environmental changes. Soil ammonium-N (NH4+—N), nitrate-N (NO3—N), soil microbial biomass carbon (MBC), and nitrogen (MBN) are important components of soil active C and N, which are sensitive to environmental changes [9]. NH4+—N and NO3—N are the material basis of important biochemical processes in the soil N cycle and are important indicators of soil N biological effectiveness [10]. MBC and MBN are involved in the soil-atmosphere C and N cycle and are also one of the indexes of soil microbial indicators. Soil urease (URE) activity is often used as an indicator of N mineralization. URE is catalyzing the hydrolysis of urea to ammonia and CO2, one of the many organic substrates of nitrogen in the soil [11]. Sucrase (SUC) decomposes soil carbohydrates and increases the soil soluble nutrient content, which is the main energy source of soil microorganisms. Its activity affects the decomposition, conversion and accumulation efficiency of soil organic carbon. Therefore, SUC activity is often used as an indicator of the carbon cycle [11]. Soil enzyme activity can be expressed as absolute enzyme activity and relative enzyme activity [12], and most of studies in mountain ecosystems mainly focused on the variations of absolute enzyme activity [13,14], which is greatly affected by environmental heterogeneity. Moreover, relative soil enzyme activity is commonly used to characterize soil quality status [15,16], which can better reflect the catalytic ability of soil enzymes, making the comparison of enzyme activities under different environments more meaningful. Soil enzyme activity can be an important indicator of soil quality and microbial activity due to its functional properties and sensitivity to the environment [17]. The analysis of active soil substances along the altitude gradient is helpful to improve our understanding of spatial changes of active soil substances and provide a scientific basis for vegetation restoration in vulnerable mountain ecosystems.
Elevation gradient, which can significantly change soil properties, vegetation types and climate characteristics in a small geographical scale, is an important topographic factor for mountain ecosystems [18]. In addition, elevation gradient affects biological processes and plant community composition and growth by affecting water distribution and temperature changes, and indirectly changes litter loss rate [19]. However, with altitude gradient, the variation characteristics of soil nutrient content are not consistent. For example, soil available P, total nitrogen (TN), and soil organic C (SOC) increased with elevation in the Segila Mountains of Southeast Tibet along an elevation gradient (3500–4300 m a.s.l.) [20]. SOC and pH increased and available P decreased significantly according to elevation, whereas other soil factors had no significant variations on the south slope of Qinling Mountains according to elevations (1500–1900 m a.s.l.) [21]. Soil MBC content increased and then decreased with the elevation gradient in a broadleaf forest [22], soil enzyme activity increased with elevation in the mountain bamboo forest [13], while Hofmann et al. found that the soil MBC linearly decreased along the altitudinal gradient in the Austrian Central Alps [23]. These similar or opposite results indicate that the effects of elevation gradient and vegetation type on soil properties are very complex. It is of great significance to comprehensively understand the distribution characteristics of soil active carbon and nitrogen, available nutrients and enzyme activities under different vegetation types along with altitudes.
Taihang Mountain, located in the center of North China, is an important ecological barrier of the North China Plain and a key area of forestry ecological engineering construction in China [24]. However, human overexploitation and the unique continental monsoon climatic conditions lead to the degradation of the ecosystem, the reduction of vegetation richness and soil fertility, which seriously limits the sustainable development of this region [25]. Since the 1950s, a series of afforestation projects have gradually improved the soil conditions and the local ecological environment [26]. At present, a large number of scientific studies have been carried out in this region, but most of them focus on the effects of tree species or age on soil properties, while ignoring the effects of elevation change, which is an important topographic factor in mountain ecosystems, on active soil substances. We hypothesized that the change of elevation gradients would influence soil carbon and nitrogen turnover by governing plant diversity and the microenvironment, and that different types of active soil substances may have different responses to the rise of the elevation gradient. Therefore, we investigated vegetation and soil according to five elevation classes (800–1500 m a.s.l.) in this region, and analyzed plant community composition and soil biotic and abiotic factors. We aimed to explore the vertical distribution patterns of active soil substances and vegetation and their relationships, so as to give some new insights into the carbon and nitrogen turnover mechanisms in mountain ecosystems.

2. Materials and Methods

2.1. Study Area Description

The study site is located in the Wangwu Mountain scenic spot in the south of Taihang Mountain, northwest of Jiyuan City, Henan Province (35°8′45″–35°13′43″ N, 112°14′24″–112°18′17″ E), with a total area of 265 km2. The study area belongs to a temperate monsoon climate, with four distinct seasons. The annual sunshine is 1727.6 h, and the annual precipitation is 860 mm. The precipitation is mainly concentrated from July to September, accounting for 70% of the annual precipitation. The geographical conditions of Wangwu Mountain area are complex, the terrain is high in the north and low in the south, the main mountain in the area is the Tiantan peak with an altitude of 1715 m, while the altitude of the southern mountain is only 400 m. Due to the large height difference, the climate has a large vertical change. The soil type in the study area is mainly cambisols. The vegetation in the study area is mainly secondary forest dominated by Quercus variabilis Blume, Quercus aliena Blume, etc. The shrub layer is dominated by Forsythia suspensa, Vitex negundo L. var. heterophylla, Viburnum dilatatum, and the herbaceous layer includes Carex rigescens, Oplismenus undulatifolius, Circaea lutetiana, and Thalictrum aquilegiifolium.

2.2. Soil Sampling and Plant Investigation

In August 2020, five sampling sites with elevation gradients of 800 m, 1000 m, 1100 m, 1200 m, and 1500 m were set up in the research area (Figure 1). Three sample plots with an area of 20 × 20 m was set up in each elevation using a total station, and the spacing of each two quadrants is greater than 50 m. The elevation, latitude, and longitude coordinates, slope direction, slope, and other environmental factors at the center of the sample plots were also recorded, and the basic conditions of the sample plots are shown in Table 1.
In each plot, five 2 × 2 m shrub subplots and five 1 × 1 m herb subplots were surveyed, respectively. Plant species names of all trees, shrubs, and herb layer species in the plots and tree sizes were recorded in detail. For trees, the diameters at breast height, tree height, and tree density were measured. Shrub surveyed items included shrub density, shrub height, and shrub coverage. In the case of the herb layers, relative coverage of each species and herb height were recorded.
In each sample plot, five sample points were selected according to the grid-based sampling method. Following the removal of the surface dead leaves and small shrubs and other herbs, the soil profile was excavated for a total of 75, and soil samples were collected from 0–10 cm, 10–20 cm, and 20–30 cm, respectively. Each soil sample was about 500 g and a total of 225 samples were collected. At the same time, soil core samples were also collected. The soil samples were taken back to the laboratory, and the gravel, plants, roots, stems, leaves, insects, and other animal and plant remains were picked out. All samples were sieved through a 2 mm sieve and divided into two parts, one part was refrigerated at 4 °C and the other part was dried at room temperature for the determination of relevant indicators.

2.3. Chemical and Biochemical Analyses

Air-dried soil (10 g) was mixed with 25 mL distilled water to perform the soil pH by a glass electrode (Leici PHS-3C, Shanghai INESA Scientific Instrument Co., Ltd., Shanghai, China). Soil bulk density and soil porosity were determined by a soil triple-phase meter (Daiki-1130, Daiki Rika Kogyo Co., Ltd., Saitama, Japan) combined with the drying method for core cutter samples. The soil water content determination was made by drying in an oven at 105 °C. The soil available P contents were determined by the Olsen method, the soil available K was determined by flame photometry after extraction with 1 M CH3COONH4 [16].The soil available N content was determined by the alkaline diffusion method. The soil total carbon (TC) and total nitrogen (TN) were measured using the elemental analyzer (Euro EA3000, Euro Vector, Pavia, Italy).
The soil NH4+—N and NO3—N contents were determined by 1M KCl extracts by a leaching-flow analyzer (SAN++, HQ-Skalar Analytical B.V., Breda, Netherlands). The soil inorganic nitrogen (SIN) was the sum of NH4+—N and NO3—N. The soil MBC and MBN were determined by the fumigation–extraction protocol [22]. The soil urease (URE) activity was determined by sodium phenol-sodium hypochlorite colorimetric method, expressed as the amount of NH3—N contained per g of soil for 1 h after 24 h incubation (mg). The soil sucrase (SUC) activity was determined by the 3, 5-dinitrosalicylic acid colorimetric method, expressed as milligrams of glucose produced per g of soil for 1 h after incubation [27].

2.4. Plant Diversity and Litter Biomass

Based on previous studies, this paper adopts the following four indicators to indicate the number of species contained in the community and the distribution of species in the community, avoiding the disadvantage of a single selection. The main four formulas are described as follows:
Shannon–Wiener index: H = −Σ(PilnPi)
Simpson index: D = 1 − ΣPi2
Pielou index: J = H/lnS
Margalef index: R = (S − 1)/lnN
where Pi = Ni/N is the relative abundance of a certain species; Ni is the number of individuals of species i; S is the total number of plants of all species in the sample plot where species i resides.
Litter biomass: The withering samples brought back to the laboratory were dried in an oven at 65 °C to a constant weight, and the dry weight was obtained and calculated.

2.5. Statistical Analysis

A one-way ANOVA was used to examine the significant differences of the soil physicochemical properties, such as NH4+—N, NO3—N, MBC, MBN, URE, and SUC at different altitude gradients, and a multi-way ANOVA was used to investigate the effects of the altitude gradient, soil layer changes, and their interaction on active soil substances; CANOCO 5.0 software was used to investigate the effects of altitude on soil NH4+—N, NO3—N, MBC, MBN, URE, and SUC. The relationship between active soil substances and other soil parameters was explored by a Pearson correlation analysis (Biometris-Plant research international, Wageningen, The Netherlands). All data were statistically analyzed using SPSS 20 software (IBM, New York, NY, USA) and plotted using Origin 2022 (Origin Lab, Northampton, MA, USA).

3. Results

3.1. Variation Characteristics of Plant Diversity along Altitudinal Gradients

The altitude gradient has a significant effect on Shannon–Wiener, Simpson, and Pielou indexes (p < 0.05), whereas it has no remarkable effect on the Margalef index (Table 2). With the increase of altitude gradient, the Shannon–Wiener, Simpson, and Pielou indexes all showed an increasing trend and reached the peak value at 1500 m (p < 0.05), while the Margalef index showed a slight increase, but did not reach a notable change. In addition, with the increase of altitude gradient, the litter thickness and litter biomass increased first and then decreased, reaching the maximum values at 1200 m (Table 1).

3.2. Characteristics of the Soil’s Physical and Chemical Properties

The altitudinal gradient significantly affected the soil’s physical and chemical properties (p < 0.05), but they showed different trends with the increase of the altitudinal gradient (Table 3). Soil porosity and soil water contents SWC showed a fluctuating upward trend and reached the peak value at 1500 m, while soil bulk density had an opposite trend and reached the maximum value at 800 m. The soil pH ranged from 4.67 to 6.09, which was slightly acidic and showed a unimodal trend with the increase of altitude. The average contents of the soil available N, available K, and available P in the 0–30 cm layer fluctuated with the increase of altitude, and the highest values occurred at 1100 m or 1500 m, and their maximum value was 2.49–3.51 times the minimum value. The soil’s TN and TC content also showed a fluctuating trend and reached the maximum value at 1500 m.
The soil layer had no significant influence on soil porosity, soil bulk density and soil pH, while remarkably, it controlled the distribution of the soil water contents, available N, available P, available K, TN, and TC content in the soil (p < 0.05). With the depth of the soil layer, the contents of the 0–10 cm soil layer were notably higher than those of the subsurface layer or deep layer (p < 0.05), showing the phenomenon of surface aggregation (Table 3).

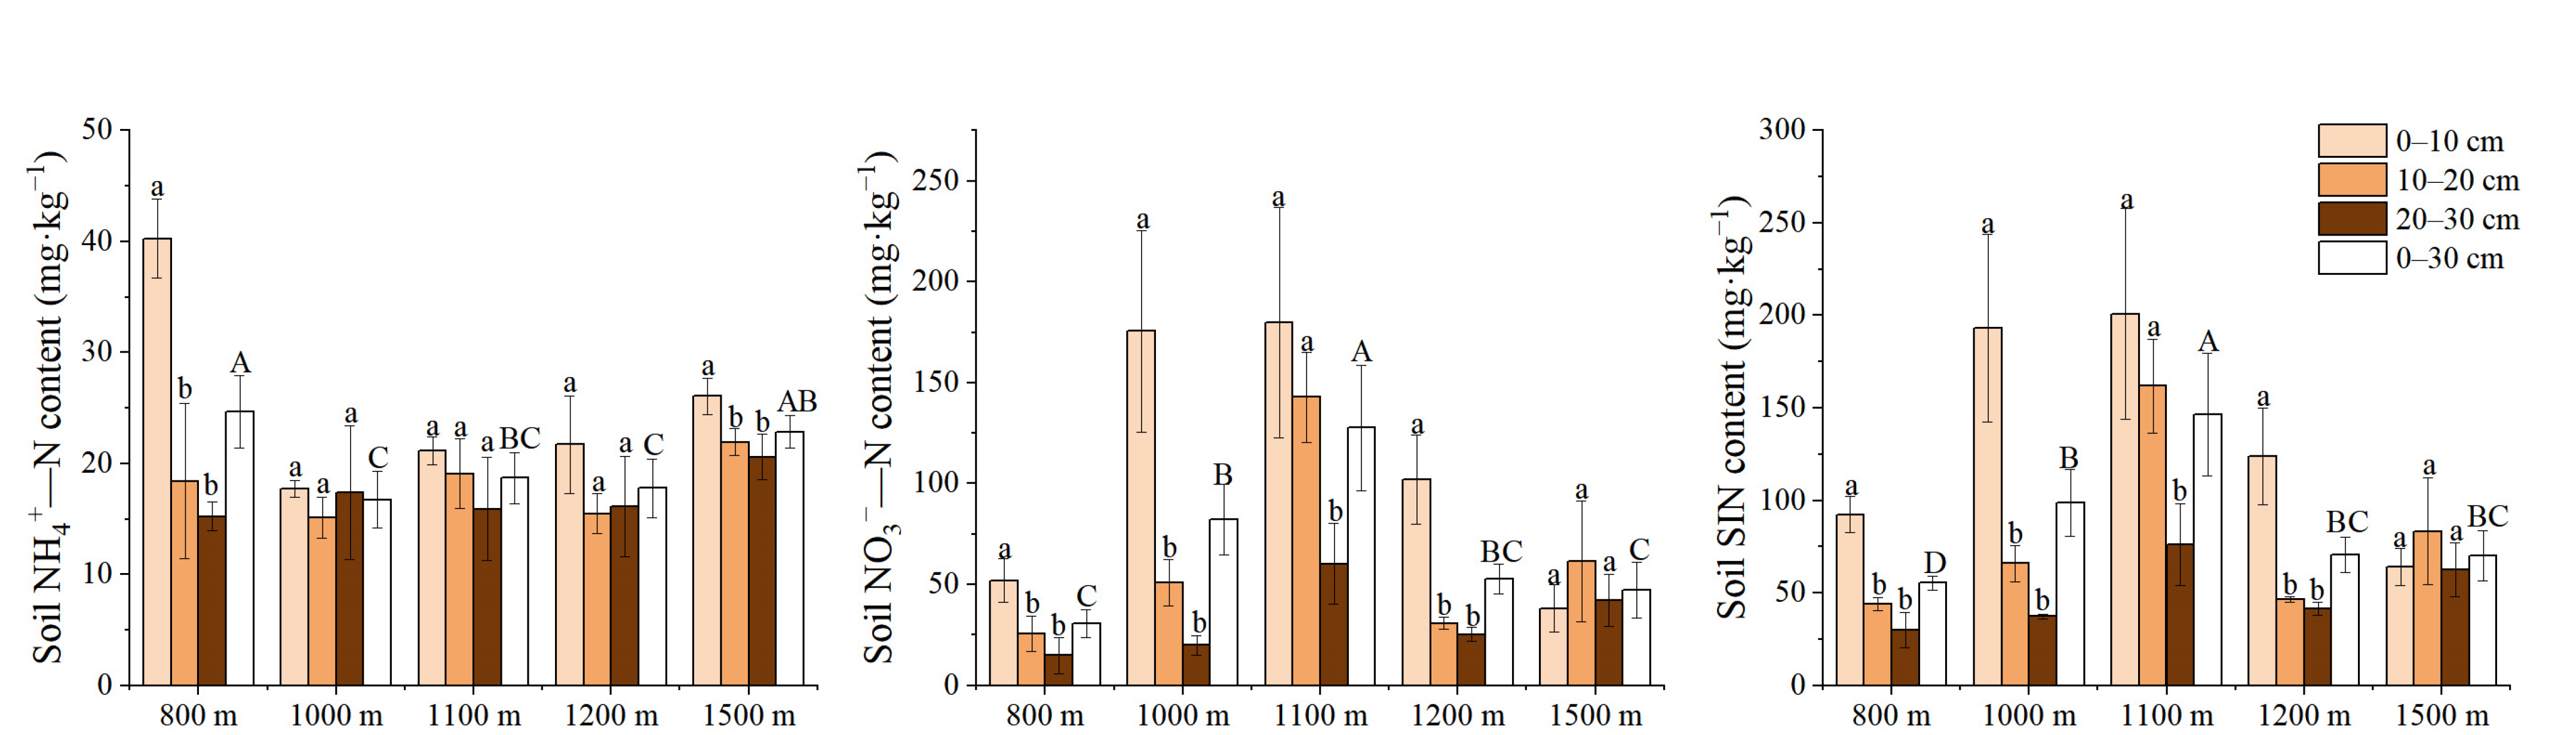
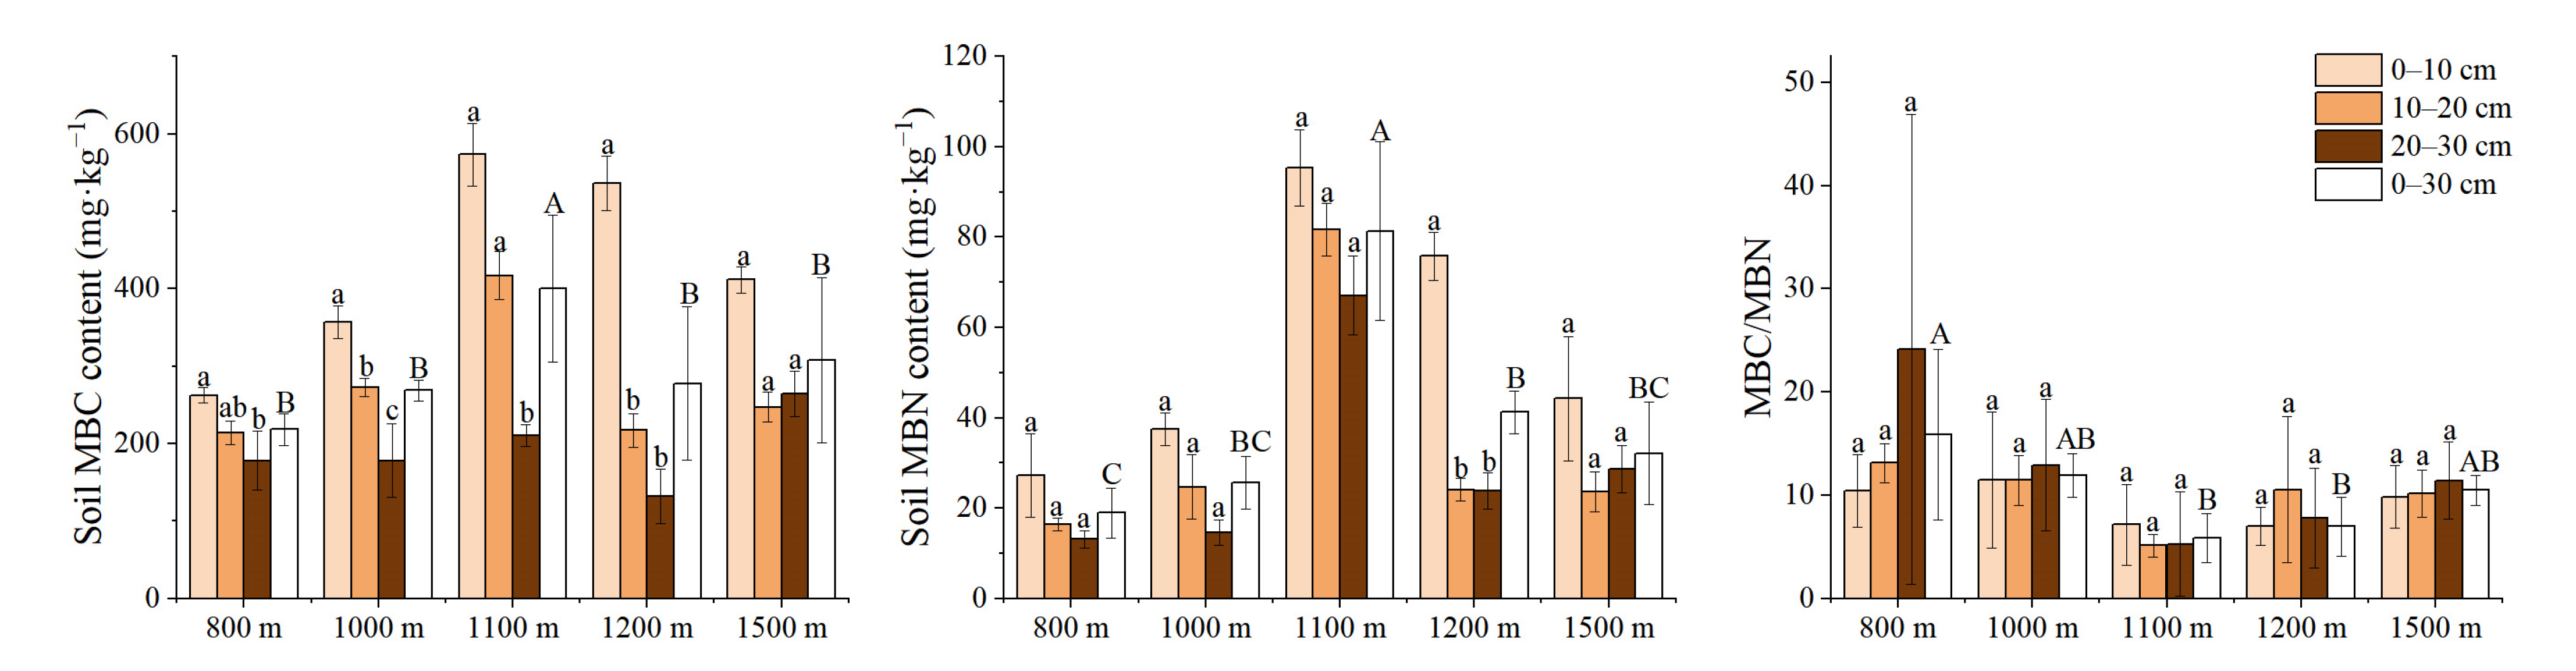
3.3. Variation Characteristics of Active Soil Substances along the Elevation Gradients

The soil’s NH4+—N, NO3—N and SIN contents were significantly affected by altitude, soil layer, and their interaction (p < 0.0001, Table 4). With the increase of elevation, the soil NH4+—N content showed a U-shaped trend, and the NO3—N and SIN content showed an inverted V-shaped trend. The highest content of NH4+—N is at 800 m (p < 0.05), which was 1.1–1.5 times that of other altitudes. The trend of the soil’s SIN was basically consistent with that of NO3—N, peaked at 1100 m, indicating that the SIN in the study area was dominated by NO3—N in the study area (p < 0.05, Figure 2). Except for 1500 m, the soil’s NO3—N and SIN contents decreased remarkably with the deepening of the soil layer, while the soil’s NH4+—N content only reached a prominent difference at 800 m and 1500 m.
With the rise of elevation, both of the soil’s MBC and MBN content showed an inverted V-shaped distribution trend and reached the peak value at 1100 m (p < 0.05, Figure 3). The mean content of MBC in the 0–30 cm soil layer varied from 218.25 to 400.29 mg·kg−1. The maximum content of MBN was 81.39 mg·kg−1 at 1100 m, which was 1.97–4.29 times than that of other elevations. In addition, the soil’s MBC/MBN was not chiefly governed by elevation and soil layer, and exhibited a fluctuating trend along with the elevation rise.
Soil URE and SUC activities were significantly influenced by altitude, soil layer, and their interaction (p < 0.0001, Table 4). With the elevation increasing, the soil’s URE activity in 0–30 cm soil layer showed a fluctuating pattern and reached its peak value at 1500 m, which was 173%, 83%, 23%, and 104% higher than that of 800 m, 1000 m, 1100 m, and 1200 m, respectively (Figure 4). The largest soil SUC activity was found at 1100 m, which was 209%, 112%, 322%, and 123% higher than that of 800 m, 1000 m, 1200 m, and 1500 m, respectively (Figure 4). The soil’s URE/MBC ranged from 68.85 to 170.71 g NH3-N·g−1·h−1·MBC−1, and showed a linear increase with the elevation. The soil’s SUC/MBC was remarkably affected by elevation, peaked at 1100 m, which was 1.56–1.94 times higher than other elevations (Figure 4).
The soil layer had no remarkable influence on MBC/MBN, URE/MBC, and SUC/MBC, but had remarkable influences on the soil’s NH4+—N, NO3—N, SIN MBC, MBN, URE, and SUC (p < 0.05, Table 4). With the depth of the soil layer, the content of the 0–10 cm soil layer was notably higher than those of the subsurface layer or deep layer, showing the phenomenon of surface aggregation.

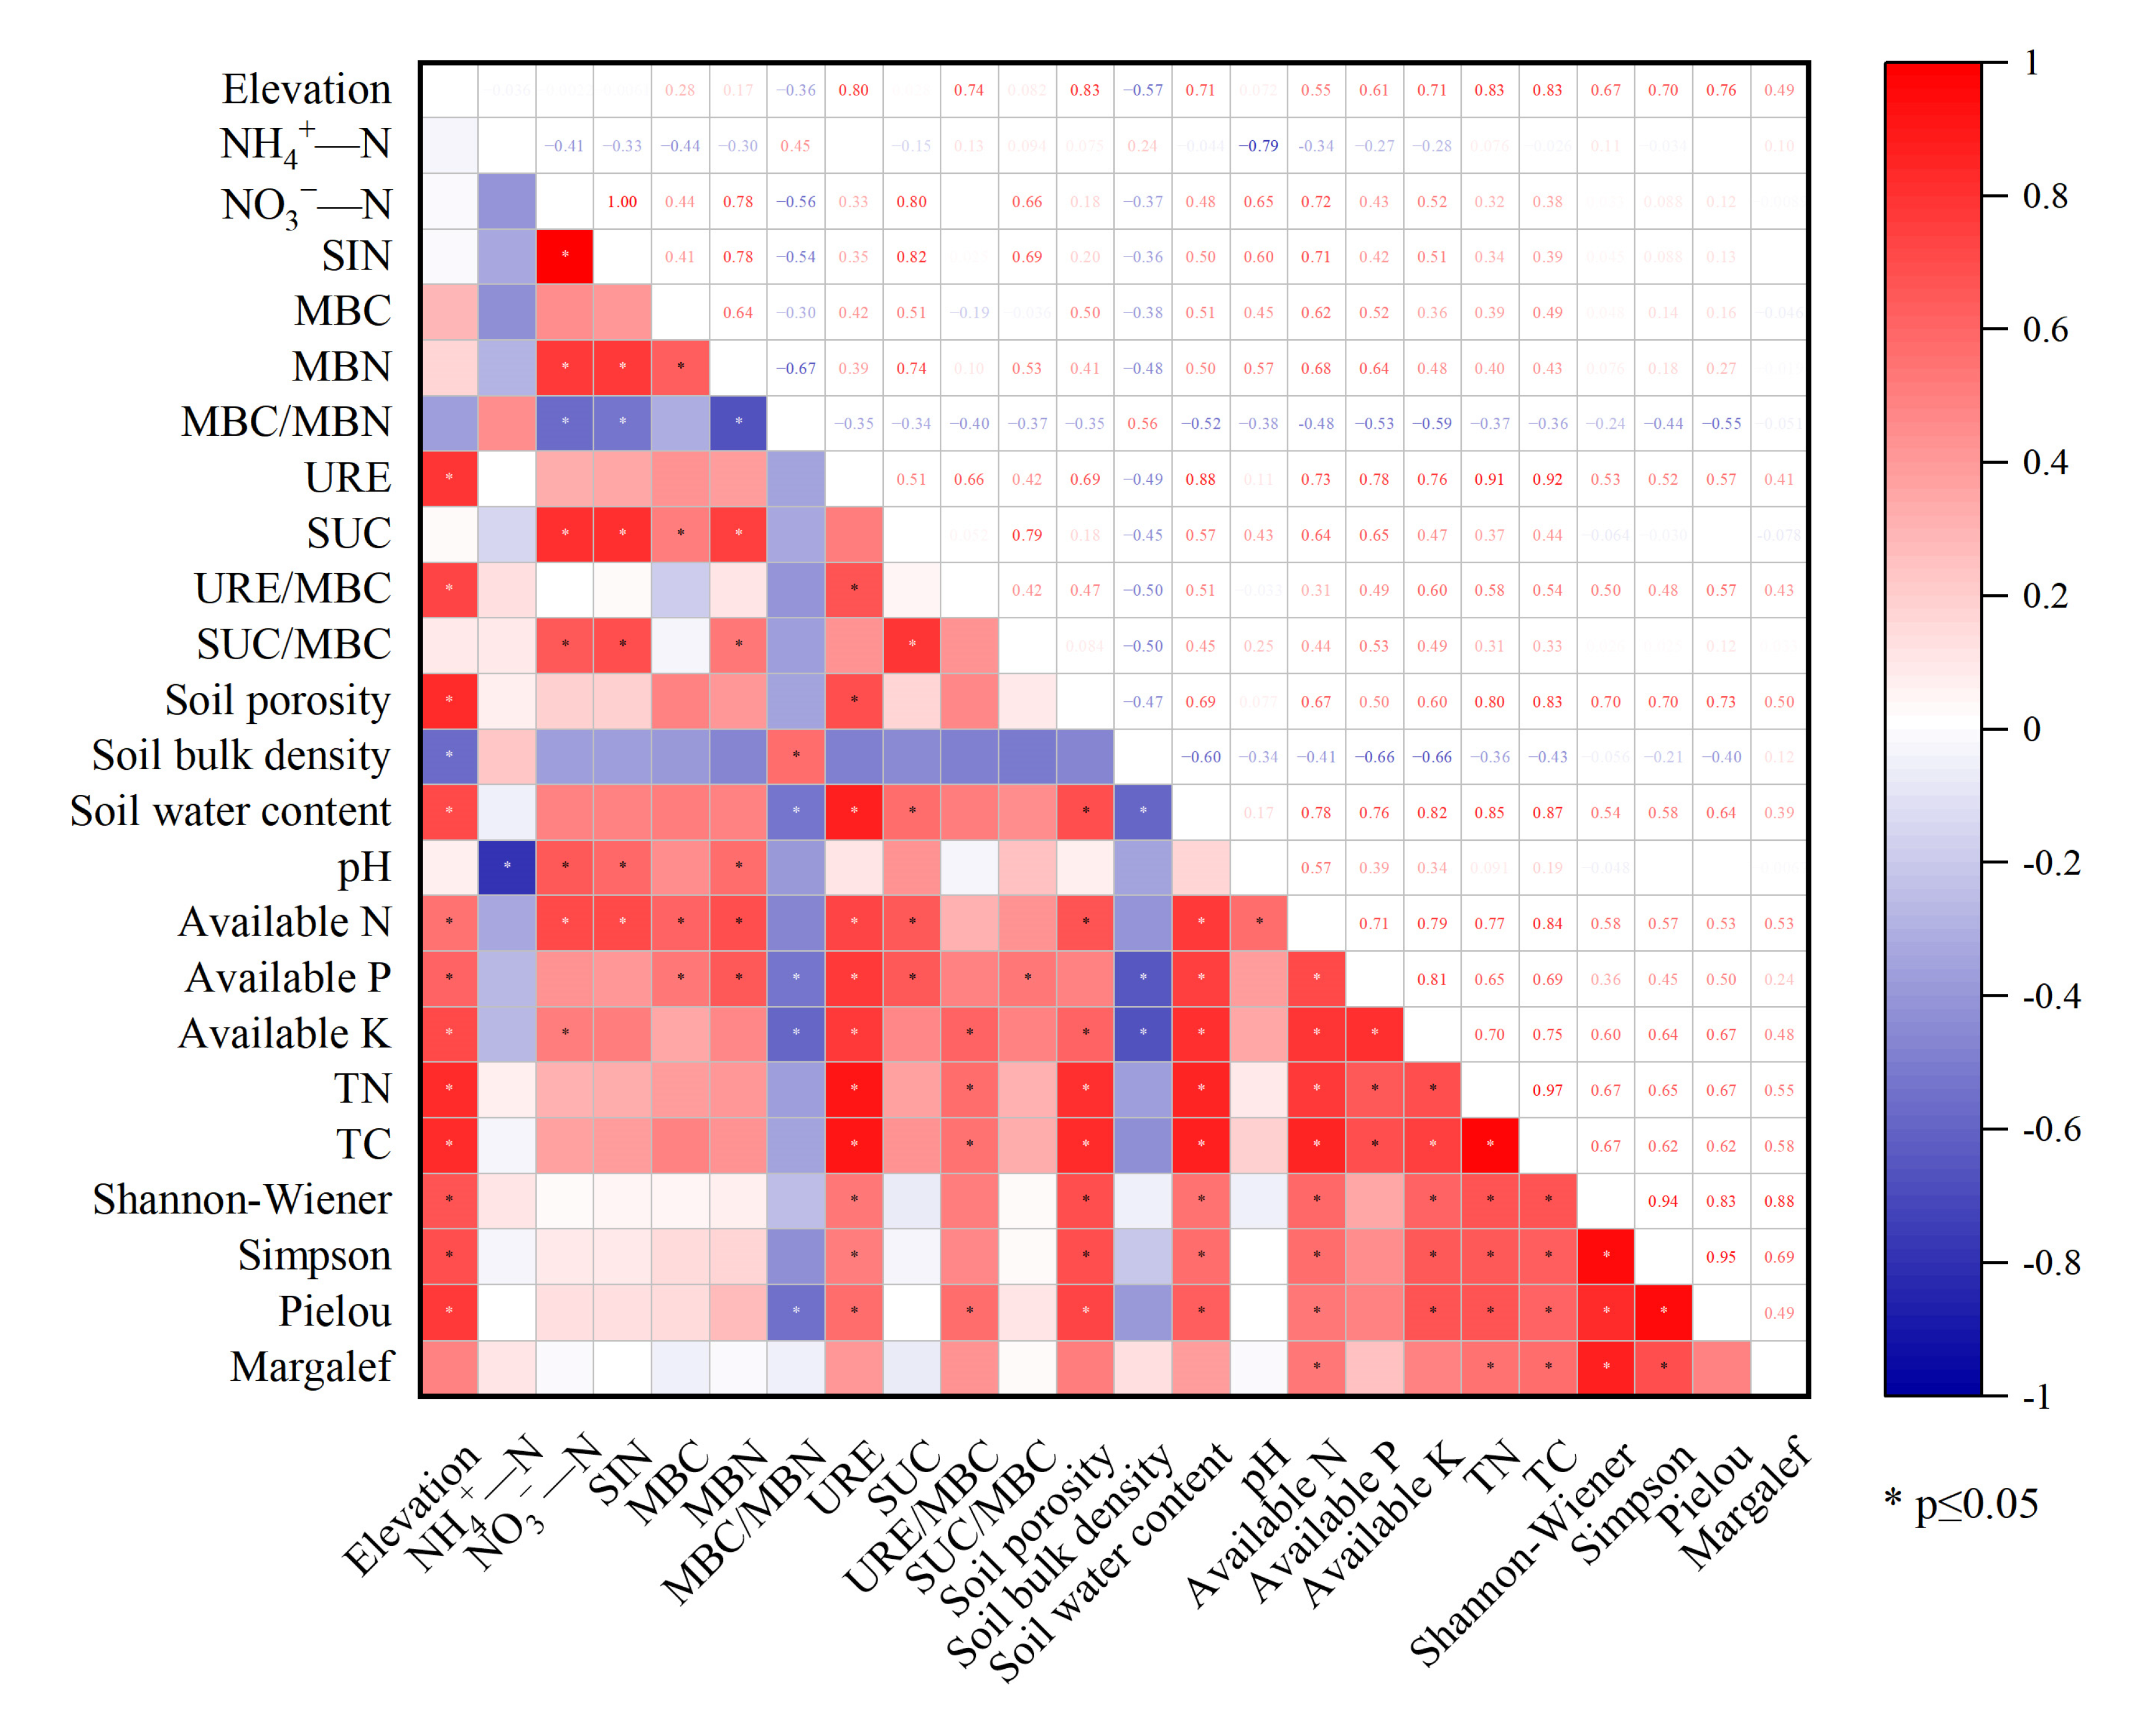
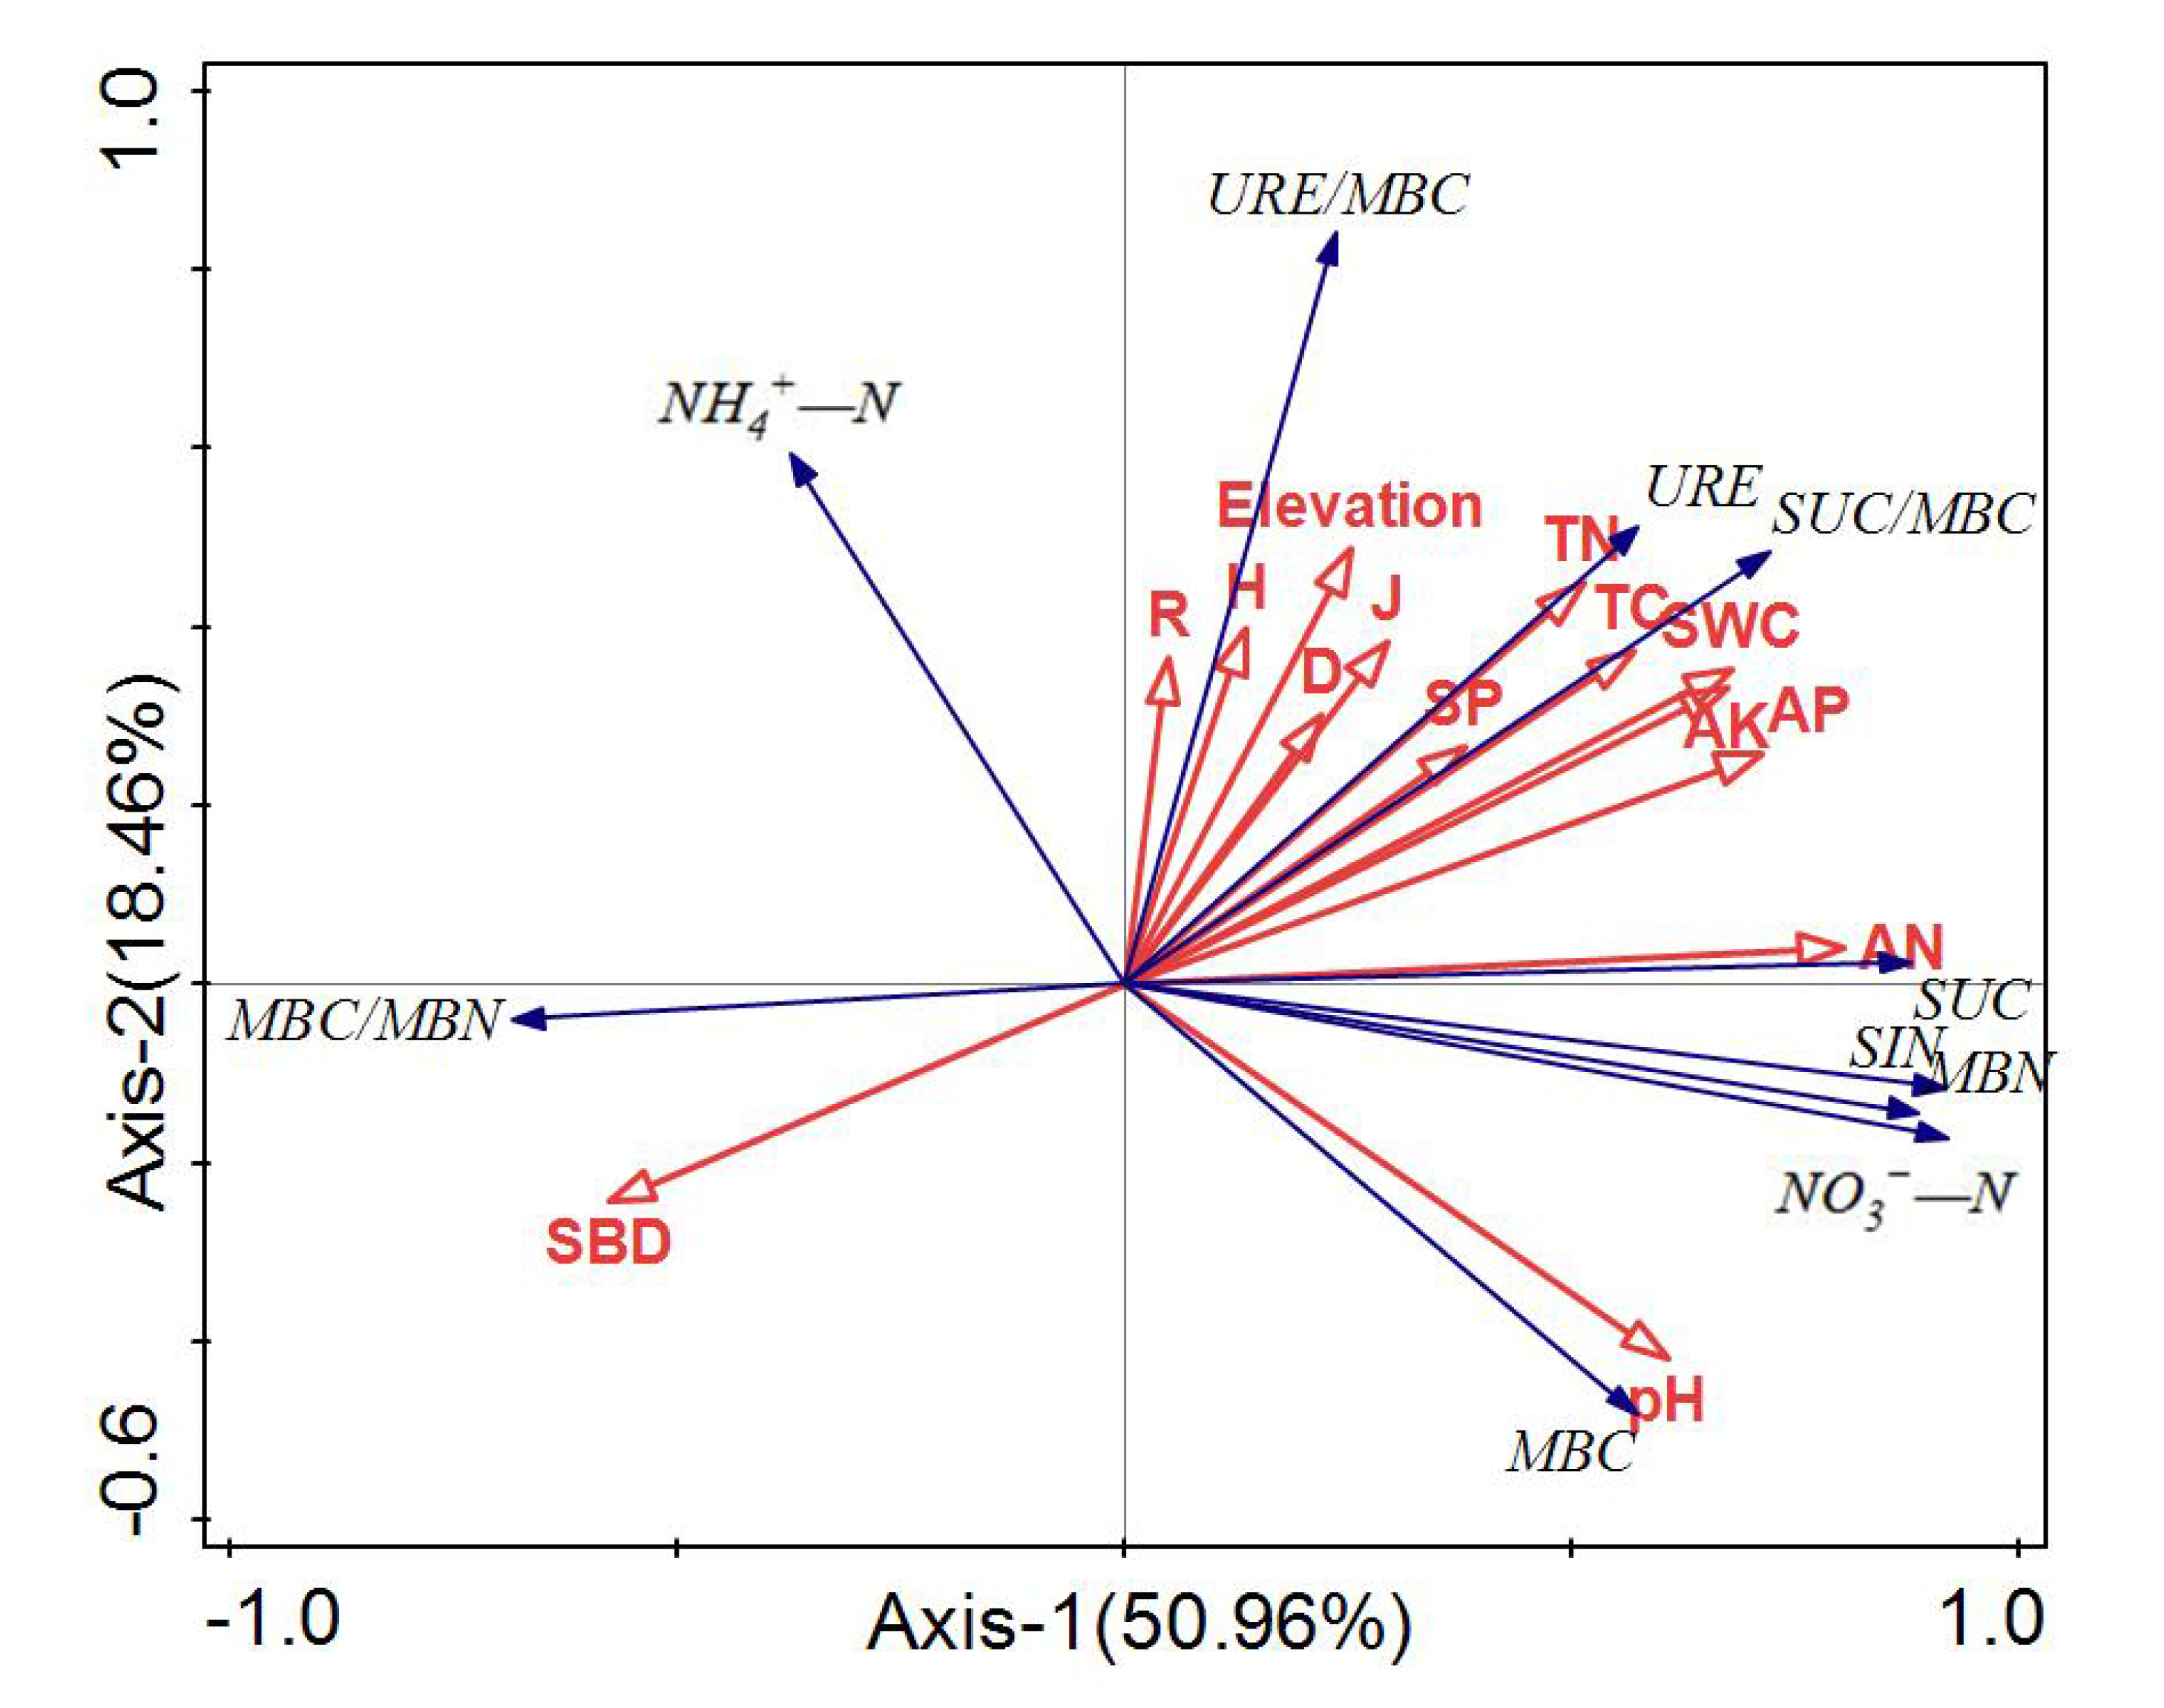
3.4. Correlation between Active Soil Substances and Environmental Factors

A Pearson’s correlation analysis showed that soil NH4+—N, NO3—N, and SIN were significantly correlated with pH (p < 0.05, Figure 5). Interestingly, only NO3—N and SIN were positively correlated with pH, which may be due to the predominance of NO3—N in SIN in this study area. The soil’s MBC and MBN were significant positively correlated with available N and available P content, the soil’s MBC/MBN ratio was notably negatively correlated with the soil water contents, available P, available K, and the Pielou index (p < 0.05, Figure 5). URE was considerably positively correlated with the soil porosity, soil water contents, available N, available P, available K, TN, TC, Shannon–Wiener, Simpson and Pielou indexes. While the SUC was only remarkably influenced by the soil water contents, available N, and available P contents (p < 0.05, Figure 5). The URE/MBC was prominent positively correlated with the available K, TN, TC, and Pielou indexes, while SUC/MBC was only notably influenced by the soil’s available P content (p < 0.05, Figure 5), indicating that the URE is more susceptible to environmental influences.
To further understand the main influencing factors of active soil substances, a redundancy analysis (RDA) of active soil substances and soil physicochemical properties was performed. The first axis was closely related to NO3—N, MBN, URE, SUC, MBC/MBN, and SUC/MBC, which explained the 50.96% variation. While the second axis was mainly related to NH4+—N and URE/MBC, explained the 18.46% variation (Figure 6). The role of available N was the most pronounced, explaining the 34.4% of the variation for active soil substances, followed by elevation, soil bulk density, and TN (Table 5), which together they accounted for 67.4% of the variation.

4. Discussion

The elevation gradient is one of the important factors of mountain ecosystems. With the increase of altitude, the average annual temperature decreases and the average annual precipitation increases, thus causing climate change in mountain systems [16,28]. Changes in environmental factors caused by elevation gradients directly or indirectly lead to changes in plant species composition and community structure. Species richness of plant communities in alpine meadows decreases with the elevation increase [29], and vegetation community diversity and biomass present a unimodal distribution with the elevation gradient [30]. However, in this study, the plant diversity indexes were positively correlated with the elevation gradient (Table 2), probably due to the differences in climatic conditions and soil properties. Furthermore, with the increase of the altitude gradient, higher water content, soil porosity, and rich nutrient conditions (Table 3), it promoted the growth of the dominant understory vegetation, and thus increased the diversity indexes. In addition, we also found that the Shannon–Wiener, Simpson, and Pielou indexes are significantly positively correlated with the URE activity, and the Margalef index is also significantly positively correlated with URE/MBC (Figure 5). This may be due to the abundant and diverse plant roots, which produce more root exudates, thus providing substrate for the microbial growth, leading to increased soil enzyme activity [31]. Previous studies have also shown that a higher diversity of understory vegetation is conducive to litter decomposition and nutrient cycling [32,33], and the decomposition rate of litter is regulated by the soil enzyme activity [34], and abundant soil nutrients and higher soil enzyme activity in turn promote plant growth [35]. The relationship between the plant diversity index and soil nutrients and enzyme activities in this study could also indirectly reflect this view.
Active soil substances are greatly affected by the environment, among which the soil’s SIN is closely related to N mineralization, nitrification, and denitrification [36]. NH4+—N and NO3—N are fast-acting N which can be directly absorbed and utilized by plants [37]. In this study, the soil’s NH4+—N and NO3—N contents were significantly different according to elevations (p < 0.05). At the elevation of 1100 m, the soil’s SIN and NO3—N showed a higher content while NH4+—N showed a lower content, probably because of more active soil nitrifying bacteria at 1100 m, accelerating the nitrification reaction. The change in the altitude gradient causes the change of temperature and water, which influences nitrogen mineralization and inorganic nitrogen production [38,39]. Furthermore, in this study, soil moisture and SIN contents showed a highly consistent variation trend (Table 2, Figure 2). It has been generally accepted that the soil nitrification rate depends largely on the soil pH [40,41], and the result of this study also supports this view (Figure 5).
The soil’s MBC and MBN are closely related to many biotic and abiotic parameters, and they have a fast turnover and high sensitivity for a rapid response to changes of elevation and soil environment [20,42]. Some studies on altitudes below 3000 m indicated that the soil microbial biomass was positively correlated with altitude [43,44], which is not consistent with the results of this study. In this paper, the soil’s MBC and MBN contents showed a unimodal trend with increasing altitude (Figure 3), and were notably and positively correlated with the soil’s available N and available P contents (Figure 5). On one hand, the surface temperature at a low altitude was higher and water evaporation was intense, which reduced the soil moisture content and thus the activity of soil microorganisms. On the other hand, at the altitude of 1100 m and 1200 m, a higher vegetation diversity resulted in the remarkable turnover rate of soil organic matter. Soil microorganisms benefited from this since high quantities of dead root and leaf litter, as well as higher soil water contents and available nutrients, primarily provide an ideal environment for their growth and development [45]. Thus, the accumulation of soil microbial carbon and nitrogen was promoted.
Soil enzyme activities were significantly affected by the soil water content [46], and positively correlated with most soil nutrients [13,14,23]. In this study, the soil’s URE and SUC activities were positively correlated with the soil water contents, available N, available P, and available K contents (Figure 5). The soil URE and SUC participate in soil N and C cycling and different stages of organic matter degradation, so they do not respond identically to changes in elevation gradient [4,13]. Previous studies under similar elevation gradients have shown that soil enzyme activity increases with elevation [13]. It has been shown that the relative activity of soil enzymes can characterize the metabolic activity of microbial communities and, to some extent, can reflect the catalytic efficiency of enzymes [47], which can be used as a tool to stabilize changes in enzyme activity. In this study, URE/MBC and SUC/MBC were significantly affected by elevation changes (Table 4). Interestingly, SUC/MBC showed the same trend as MBC with elevation increasing, while URE/MBC showed an increasing change with elevation increasing. In general, enzymes are derived from animal, plant, and microbial secretions and the decomposition of their residues, and an increase in MBC increases the enzyme activity, while a lower MBC environment improves the efficiency of the enzyme utilization of nutrients, maintains soil metabolic activity, and indirectly increases the proportion of enzymes in MBC. URE/MBC was remarkably correlated with TC and TN in the study area, and SUC/MBC was only remarkably correlated with available P, indicating that URE/MBC was mainly limited by soil carbon and nitrogen, while SUC/MBC was more influenced by the soil’s available P content, and a more pronounced response of relative enzyme activity to elevation changes in the study area.
With the deepening of the soil layer, the soil SIN, MBC, and MBN, as well as the soil enzyme activities all showed decreasing trends, which were consistent with the results of previous studies [20,27,48]. This result could be explained by a smaller soil bulk density, good hydrothermal, and aeration conditions in the surface soil layer. In addition, the poor ventilation and nutrient content of the deep soil weaken the microbial activity and affect the active matter content. At the same time, an abundant litter return in the surface soil layer, which provides a suitable living environment and sufficient nutrient sources for microbial growth, and the microbial metabolism is strong, resulting in a higher active matter content.
However, the present experiment did not take into account the effect of elevation gradients on soil microbial community structure. It has been shown that soil bacterial and fungal composition is closely related to soil organic matter and total nitrogen content [13]. Therefore, it is necessary to further investigate the effects of microbial community structures on soil carbon and nitrogen content along elevation gradients in mountain ecosystems.

5. Conclusions

In the Southern Taihang Mountains, active soil substances contents were significantly influenced by elevation gradients and soil layer. With the rise of elevation, the soil’s NO3—N, MBC and MBN content as well as SUC activity basically showed an inverted V-shaped distribution trend and reached the peak value at 1100 m, while soil URE activity showed a fluctuating pattern. With the deepening of the soil layer, the content of active soil substances tended to decrease, showing a phenomenon of surface aggregation. The soil’s available N, elevation, and the soil bulk density and TN were important factors driving the changes of active soil substances, and together they accounted for 67.4% of the variation. The soil microbial community structure is mostly probably to explain the changes of soil active substance contents with altitude more deeply. It is suggested to further strengthen the study of soil microbial community structure in mountain ecosystem.

Author Contributions

Conceptualization, E.F. and Y.K.; Methodology and investigation, C.W. and T.W.; Software and data curation, E.F. and L.Z.; Formal analysis, X.X. and L.Z.; Writing—original draft preparation, E.F. and Y.K.; Writing—review and editing, Y.K. and E.F.; Supervision, Y.K. and X.X.; Funding acquisition, Y.K. and T.W. All authors have read and agreed to the published version of the manuscript.

Funding

This research was supported by the Research and Demonstration of Key Technologies of Afforestation in Barren Lands of Henan Province (Grant No. YLK202209) and the pilot project for ecological protection and restoration of mountains, water, forests, fields, lakes, and grasses in South Taihang, Henan (JGZJ—Grant—2019125).

Data Availability Statement

Not applicable.

Conflicts of Interest

The authors declare no conflict of interest.

References

  1. Fang, J.; Chen, A.; Peng, C.; Zhao, S.; Ci, L. Changes in forest biomass carbon storage in China between 1949 and 1998. Science 2001, 292, 2320–2322. [Google Scholar] [CrossRef] [PubMed]
  2. Yu, G.; Song, X.; Wang, Q.; Liu, Y.; Guan, D.; Yan, J.; Sun, X.; Zhang, L.; Wen, X. Water-use efficiency of forest ecosystems in eastern China and its relations to climatic variables. New Phytol. 2008, 177, 927–937. [Google Scholar] [CrossRef]
  3. Verrall, B.; Pickering, C.M. Alpine vegetation in the context of climate change: A global review of past research and future directions. Sci. Total Environ. 2020, 748, 141344. [Google Scholar] [CrossRef] [PubMed]
  4. Nottingham, A.T.; Turner, B.L.; Whitaker, J.; Ostle, N.J.; McNamara, N.P.; Bardgett, R.D.; Salinas, N.; Meir, P. Soil microbial nutrient constraints along a tropical forest elevation gradient: A belowground test of a biogeochemical paradigm. Biogeosciences 2015, 12, 6071–6083. [Google Scholar] [CrossRef]
  5. Ndossi, E.M.; Becker, J.N.; Hemp, A.; Dippold, M.A.; Kuzyakov, Y.; Razavi, B.S. Effects of land use and elevation on the functional characteristics of soil enzymes at Mt. Kilimanjaro. Eur.J.Soil Biol. 2020, 97, 103167. [Google Scholar] [CrossRef]
  6. Kaiser, K.; Guggenberger, G. The role of DOM sorption to mineral surfaces in the preservation of organic matter in soils. Org. Geochem. 2000, 31, 711–725. [Google Scholar] [CrossRef]
  7. Johnson, B.G.; Verburg, P.S.J.; Arnone, J.A., III. Effects of climate and vegetation on soil nutrients and chemistry in the Great Basin studied along a latitudinal-elevational climate gradient. Plant Soil 2014, 382, 151–163. [Google Scholar] [CrossRef]
  8. Sundqvist, M.K.; Wardle, D.A.; Vincent, A.; Giesler, R. Contrasting nitrogen and phosphorus dynamics across an elevational gradient for subarctic tundra heath and meadow vegetation. Plant Soil 2014, 383, 387–399. [Google Scholar] [CrossRef]
  9. Parfitt, R.L.; Yeates, G.W.; Ross, D.J.; Mackay, A.D.; Budding, P.J. Relationships between soil biota, nitrogen and phosphorus availability, and pasture growth under organic and conventional management. Appl. Soil Ecol. 2005, 28, 1–13. [Google Scholar] [CrossRef]
  10. Michel, K.; Matzner, E. Nitrogen content of forest floor Oa layers affects carbon pathways and nitrogen mineralization. Soil Biol. Biochem. 2002, 34, 1807–1813. [Google Scholar] [CrossRef]
  11. Sardans, J.; Penuelas, J.; Estiarte, M. Changes in soil enzymes related to C and N cycle and in soil C and N content under prolonged warming and drought in a Mediterranean shrubland. Appl. Soil Ecol. 2008, 39, 223–235. [Google Scholar] [CrossRef]
  12. Wang, B.; Xue, S.; Liu, G.B.; Zhang, G.H.; Li, G.; Ren, Z.P. Changes in soil nutrient and enzyme activities under different vegetations in the Loess Plateau area, Northwest China. Catena 2012, 92, 186–195. [Google Scholar] [CrossRef]
  13. Chang, E.-H.; Chen, T.-H.; Tian, G.; Chiu, C.-Y. The effect of altitudinal gradient on soil microbial community activity and structure in moso bamboo plantations. Appl. Soil Ecol. 2016, 98, 213–220. [Google Scholar] [CrossRef]
  14. Siles, J.A.; Cajthaml, T.; Minerbi, S.; Margesin, R. Effect of altitude and season on microbial activity, abundance and community structure in Alpine forest soils. FEMS Microbiol. Ecol. 2016, 92, fiw008. [Google Scholar] [CrossRef]
  15. Liu, X.; Guo, K.; Huang, L.; Ji, Z.; Jiang, H.; Li, H.; Zhang, J. Responses of absolute and specific enzyme activity to consecutive application of composted sewage sludge in a Fluventic Ustochrept. PLoS ONE 2017, 12, e0177796. [Google Scholar] [CrossRef]
  16. Xiao, L.; Li, P.; Shi, P.; Liu, Y. Soil nutrient stoichiometries and enzymatic activities along an elevational gradient in the dry-hot valley region of southwestern China. Arch. Agron.Soil Sci. 2019, 65, 322–333. [Google Scholar] [CrossRef]
  17. Luo, L.; Meng, H.; Gu, J.-D. Microbial extracellular enzymes in biogeochemical cycling of ecosystems. J.Environ.Manage. 2017, 197, 539–549. [Google Scholar] [CrossRef]
  18. Khan, S.; Chen, N.; Zhang, C.; Wang, L.; Han, C.; Lu, K.; Li, Y.; Rafiq, M.; Iqbal, A.; Zhao, C. Soil fungal taxonomic diversity along an elevation gradient on the semi-arid Xinglong Mountain, Northwest China. Arch. Microbiol. 2020, 202, 2291–2302. [Google Scholar] [CrossRef]
  19. Cardelli, V.; De Feudis, M.; Fornasier, F.; Massaccesi, L.; Cocco, S.; Agnelli, A.; Weindorf, D.C.; Corti, G. Changes of topsoil under Fagus sylvatica along a small latitudinal-altitudinal gradient. Geoderma 2019, 344, 164–178. [Google Scholar] [CrossRef]
  20. Li, J.; Chen, L.; Wang, H.; Ouyang, S.; Liu, X.; Lu, J. Pattern and drivers of soil fungal community along elevation gradient in the Abies georgei forests of Segila mountains, Southeast Tibet. Glob.Ecol.Conserv. 2022, 39, e02291. [Google Scholar] [CrossRef]
  21. Zhou, Y.; Jia, X.; Han, L.; Liu, Z.; Kang, S.; Zhao, Y. Fungal community diversity in soils along an elevation gradient in a Quercus aliena var. acuteserrata forest in Qinling Mountains, China. Appl. Soil Ecol. 2021, 167, 104104. [Google Scholar] [CrossRef]
  22. Massaccesi, L.; De Feudis, M.; Leccese, A.; Agnelli, A. Altitude and vegetation affect soil organic carbon, basal respiration and microbial biomass in Apennine forest soils. Forests 2020, 11, 710. [Google Scholar] [CrossRef]
  23. Hofmann, K.; Lamprecht, A.; Pauli, H.; Illmer, P. Distribution of prokaryotic abundance and microbial nutrient cycling across a high-alpine altitudinal gradient in the Austrian Central Alps is affected by vegetation, temperature, and soil nutrients. Microb. Ecol. 2016, 72, 704–716. [Google Scholar] [CrossRef]
  24. Tong, X.; Zhang, J.; Meng, P.; Li, J.; Zheng, N. Ecosystem water use efficiency in a warm-temperate mixed plantation in the North China. J. Hydrol. 2014, 512, 221–228. [Google Scholar] [CrossRef]
  25. Gong, S.; Feng, Z.; Qu, A.; Sun, J.; Xu, X.; Yong, L.; Kong, Y. Effects of land-use types on the temporal dynamics of soil active carbon and nitrogen in the rocky mountainous of North China. Soil Sci. Plant Nutr. 2022, 68, 72–80. [Google Scholar] [CrossRef]
  26. Kong, Y.; Ma, N.L.; Yang, X.; Lai, Y.; Feng, Z.; Shao, X.; Xu, X.; Zhang, D. Examining CO2 and N2O pollution and reduction from forestry application of pure and mixture forest. Environ. Pollut. 2020, 265, 114951. [Google Scholar] [CrossRef]
  27. Guan, S. Soil Enzymes and their Research Methods; Agriculture Press: Beijing, China, 1986; pp. 274–301. [Google Scholar]
  28. Zuo, Y.; Li, J.; Zeng, H.; Wang, W. Vertical pattern and its driving factors in soil extracellular enzyme activity and stoichiometry along mountain grassland belts. Biogeochemistry 2018, 141, 23–39. [Google Scholar] [CrossRef]
  29. Han, W.; Chen, L.; Su, X.; Liu, D.; Jin, T.; Shi, S.; Li, T.; Liu, G. Effects of soil physico-chemical properties on plant species diversity along an elevation gradient over alpine grassland on the Qinghai-Tibetan Plateau, China. Front. Plant Sci. 2022, 13, 822268. [Google Scholar] [CrossRef]
  30. Deng, Q.; Zhang, X.; Niu, J.; Qin, H. Species diversity of plant communities along an altitude gradient in Yinmachi Mountain, northwestern Shanxi, China. Ecol. Environ. 2019, 28, 865–872. [Google Scholar]
  31. Gong, S.; Zhang, T.; Guo, R.; Cao, H.; Shi, L.; Guo, J.; Sun, W. Response of soil enzyme activity to warming and nitrogen addition in a meadow steppe. Soil Res. 2015, 53, 242–252. [Google Scholar] [CrossRef]
  32. Xiong, Y.; Xia, H.; Li Za Cai Xa Fu, S. Impacts of litter and understory removal on soil properties in a subtropical Acacia mangium plantation in China. Plant Soil 2008, 304, 179–188. [Google Scholar] [CrossRef]
  33. Qiao, Y.; Miao, S.; Silva, L.C.R.; Horwath, W.R. Understory species regulate litter decomposition and accumulation of C and N in forest soils: A long-term dual-isotope experiment. For. Ecol. Manag. 2014, 329, 318–327. [Google Scholar] [CrossRef]
  34. Smart, K.A.; Jackson, C.R. Fine scale patterns in microbial extracellular enzyme activity during leaf litter decomposition in a stream and its floodplain. Microb. Ecol. 2009, 58, 591–598. [Google Scholar] [CrossRef]
  35. Pauli, H.; Gottfried, M.; Dullinger, S.; Abdaladze, O.; Akhalkatsi, M.; Benito Alonso, J.L.; Coldea, G.; Dick, J.; Erschbamer, B.; Fernandez Calzado, R.; et al. Recent plant diversity changes on Europe’s mountain summits. Science 2012, 336, 353–355. [Google Scholar] [CrossRef]
  36. Kong, Y.; Watanabe, M.; Nagano, H.; Watanabe, K.; Yashima, M.; Inubushi, K. Effects of land-use type and nitrogen addition on nitrous oxide and carbon dioxide production potentials in Japanese Andosols. Soil Sci. Plant Nutr. 2013, 59, 790–799. [Google Scholar] [CrossRef]
  37. Liu, Y.; Chen, L.; Duan, W.; Bai, Y.; Li, X. Effects of litter decomposition on soil N in Picea mongolica forest at different forest ages. Forests 2022, 13, 520. [Google Scholar] [CrossRef]
  38. Cookson, W.R.; Cornforth, I.S.; Rowarth, J.S. Winter soil temperature (2–15 °C) effects on nitrogen transformations in clover green manure amended or unamended soils: A laboratory and field study. Soil Biol. Biochem. 2002, 34, 1401–1415. [Google Scholar] [CrossRef]
  39. Wang, C.; Han, X.; Xing, X. Effects of grazing exclusion on soil net nitrogen mineralization and nitrogen availability in a temperate steppe in northern China. J. Arid Environ. 2010, 74, 1287–1293. [Google Scholar] [CrossRef]
  40. Cheng, Y.; Wang, J.; Mary, B.; Zhang, J.-B.; Cai, Z.-C.; Chang, S.X. Soil pH has contrasting effects on gross and net nitrogen mineralizations in adjacent forest and grassland soils in central Alberta, Canada. Soil Biol. Biochem. 2013, 57, 848–857. [Google Scholar] [CrossRef]
  41. Yao, H.; Campbell, C.D.; Qiao, X. Soil pH controls nitrification and carbon substrate utilization more than urea or charcoal in some highly acidic soils. Biol. Fertil. Soils 2011, 47, 515–522. [Google Scholar] [CrossRef]
  42. Shen, R.; Xu, M.; Li, R.; Zhao, F.; Sheng, Q. Spatial variability of soil microbial biomass and its relationships with edaphic, vegetational and climatic factors in the Three-River Headwaters region on Qinghai-Tibetan Plateau. Appl. Soil Ecol. 2015, 95, 191–203. [Google Scholar] [CrossRef]
  43. Huang, C.-Y.; Jien, S.-H.; Chen, T.-H.; Tian, G.; Chiu, C.-Y. Soluble organic C and N and their relationships with soil organic C and N and microbial characteristics in moso bamboo (Phyllostachys edulis) plantations along an elevation gradient in Central Taiwan. J. Soil Sediments 2014, 14, 1061–1070. [Google Scholar] [CrossRef]
  44. Whitaker, J.; Ostle, N.; Nottingham, A.T.; Ccahuana, A.; Salinas, N.; Bardgett, R.D.; Meir, P.; McNamara, N.P. Microbial community composition explains soil respiration responses to changing carbon inputs along an Andes-to-Amazon elevation gradient. J. Ecol. 2014, 102, 1058–1071. [Google Scholar] [CrossRef] [PubMed]
  45. Prommer, J.; Walker, T.W.N.; Wanek, W.; Braun, J.; Zezula, D.; Hu, Y.; Hofhansl, F.; Richter, A. Increased microbial growth, biomass, and turnover drive soil organic carbon accumulation at higher plant diversity. Glob Chang Biol. 2019, 26, 669–681. [Google Scholar] [CrossRef]
  46. Zuccarini, P.; Asensio, D.; Ogaya, R.; Sardans, J.; Penuelas, J. Effects of seasonal and decadal warming on soil enzymatic activity in a P-deficient Mediterranean shrubland. Global Change Biol. 2020, 26, 3698–3714. [Google Scholar] [CrossRef]
  47. Raiesi, F.; Beheshti, A. Soil specific enzyme activity shows more clearly soil responses to paddy rice cultivation than absolute enzyme activity in primary forests of northwest Iran. Appl. Soil Ecol. 2014, 75, 63–70. [Google Scholar] [CrossRef]
  48. Wang, N.; Zhang, M.; Zhao, N.; Feng, F.; Zhao, M. Season-dependence of soil extracellular enzyme activities in a Pinus koraiensis forest on Changbai Mountain. J. For. Res. 2021, 32, 1713–1722. [Google Scholar] [CrossRef]
Figure 1. Map of the sampling sites in the Wangwu Mountain scenic spot.
Forests 14 00370 g001
Figure 2. Variation characteristics of the soil’s NH4+—N, NO3—N and SIN contents at different elevations. Different lowercase letters indicate significant differences between different soil layers at the same elevation gradient (p < 0.05). Different capital letters indicate significant differences among the different elevation gradients (p < 0.05).
Forests 14 00370 g002
Figure 3. Variation characteristics of the soil’s MBC, MBN contents and MBC/MBN at different elevations. Different lowercase letters indicate significant differences between different soil layers at the same elevation gradient (p < 0.05). Different capital letters indicate significant differences along different elevation gradients (p < 0.05).
Forests 14 00370 g003
Figure 4. Absolute and relative activities of soil enzymes at different elevations. Different lowercase letters indicate significant differences between different soil layers at the same elevation gradient (p < 0.05). Different capital letters indicate significant differences along different elevation gradients (p < 0.05).
Forests 14 00370 g004
Figure 5. Pearson correlation analysis of the active soil substances with environmental factors and soil physicochemical properties at different elevation gradients.
Forests 14 00370 g005
Figure 6. Redundancy analysis of the active soil substances along the elevation. H, Shannon–Wiener index; D, Simpson index; J, Pielou index; R, Margalef index; SP, soil porosity; SBD, soil bulk density; SWC, soil water contents; AN, available N; AP, available P; AK, available K.
Forests 14 00370 g006
Table 1. Summary of site characteristics along the elevation gradients.
Elevation/mCanopy DensityMean Diameter at Breast Height/cmLitter
Thickness/cmBiomass/(t·ha−1)
8000.75 ± 0.01 B12.47 ± 2.27 B3.37 ± 0.64 B2.93 ± 0.24 D
10000.73 ± 0.03 B11.53 ± 1.51 B3.7 ± 1.13 B2.94 ± 0.26 D
11000.81 ± 0.04 A18.03 ± 2.61 A7 ± 1.00 A5.39 ± 0.44 B
12000.78 ± 0.02 AB14.4 ± 1.41 B7.3 ± 0.58 A6.73 ± 0.50 A
15000.81 ± 0.04 A12.87 ± 1.87 B4.7 ± 0.58 B4.52 ± 0.32 C
Different capital letters indicate significant differences at p < 0.05 with elevation gradients.
Table 2. Diversity index of the plant community at different elevation gradients.
Elevation/mShannon–Wiener IndexSimpson IndexPielou IndexMargalef Index
8001.51 ± 0.31 B0.66 ± 0.13 B0.64 ± 0.12 B2.34 ± 0.16 A
10001.90 ± 0.33 AB0.73 ± 0.10 AB0.67 ± 0.09 B3.34 ± 0.83 A
11001.81 ± 0.51 AB0.75 ± 0.11 AB0.74 ± 0.09 AB2.68 ± 1.01 A
12001.85 ± 0.31 AB0.77 ± 0.05 AB0.78 ± 0.01 AB2.59 ± 0.86 A
15002.47 ± 0.22 A0.89 ± 0.02 A0.86 ± 0.02 A3.93 ± 0.91 A
Different capital letters indicate significant differences at p < 0.05 with elevation gradients.
Table 3. Basic physical and chemical properties of the soils at different elevation gradients.
Soil VariablesSoil Layer800 m1000 m1100 m1200 m1500 m
Soil porosity/%0–10 cm44.67 ± 5.59 a54.87 ± 6.79 a62.01 ± 5.56 a66.73 ± 9.83 a78.06 ± 10.86 a
10–20 cm45.54 ± 7.43 a48.26 ± 6.98 a61.32 ± 5.72 a58.75 ± 7.94 a67.71 ± 6.65 a
20–30 cm48.12 ± 4.46 a50.63 ± 5.47 a65.33 ± 4.39 a56.28 ± 9.22 a76.31 ± 6.23 a
0–30 cm46.11 ± 5.80 C51.25 ± 6.36 BC62.89 ± 5.19 AB60.59 ± 8.99 B74.03 ± 7.91 A
Soil bulk density
/(g·cm−3)
0–10 cm1.78 ± 0.10 a1.53 ± 0.09 a1.33 ± 0.09 a1.18 ± 0.13 b1.39 ± 0.11 a
10–20 cm1.71 ± 0.15 a1.63 ± 0.11 a1.39 ± 0.18 a1.40 ± 0.10 ab1.45 ± 0.10 a
20–30 cm1.65 ± 0.09 a1.58 ± 0.16 a1.24 ± 0.12 a1.49 ± 0.13 a1.43 ± 0.13 a
0–30 cm1.71 ± 0.11 A1.58 ± 0.12 AB1.32 ± 0.13 C1.36 ± 0.12 C1.42 ± 0.11 BC
Soil water contents/%0–10 cm26.5 ± 0.08 a33.78 ± 0.05 a39.82 ± 0.04 a32.51 ± 0.03 a36.77 ± 0.02 a
10–20 cm15.16 ± 0.05 b19.35 ± 0.03 b34.16 ± 0.05 a18.07 ± 0.01 b32.54 ± 0.01 b
20–30 cm13.31 ± 0.02 b15.36 ± 0.02 b21.71 ± 0.06 b15.53 ± 0.01 b19.69 ± 0.01 c
0–30 cm18.32 ± 3.72 B22.83 ± 2.29 B31.90 ± 3.65 A22.04 ± 1.69 B33.00 ± 0.48 A
pH0–10 cm4.67 ± 0.39 a5.63 ± 0.25 a5.72 ± 0.11 b5.57 ± 0.31 a4.93 ± 0.09 b
10–20 cm4.90 ± 0.38 a5.67 ± 0.40 a5.87 ± 0.12 b5.73 ± 0.48 a5.11 ± 0.19 ab
20–30 cm5.13 ± 0.10 a5.75 ± 0.29 a6.09 ± 0.09 a5.64 ± 0.49 a5.37 ± 0.10 a
0–30 cm4.90 ± 0.28 B5.68 ± 0.25 A5.89 ± 0.03 A5.65 ± 0.39 A5.14 ± 0.11 B
AvailableN
/(mg·kg−1)
0–10 cm97.31 ± 12.17 a169.17 ± 23.76 a170.41 ± 19.99 a113.67 ± 18.23 a145.46 ± 9.67 a
10–20 cm29.78 ± 9.17 b74.08 ± 14.32 b100.97 ± 15.13 b71.37 ± 11.69 b105.29 ± 15.66 b
20–30 cm18.42 ± 4.73 b42.58 ± 15.55 b91.74 ± 12.39 b42.25 ± 8.61 c69.26 ± 11.17 c
0–30 cm48.50 ± 8.68 D95.28 ± 5.42 BC121.04 ± 15.82 A75.76 ± 12.84 C106.67 ± 12.13 AB
Available P
/(mg·kg−1)
0–10 cm1.40 ± 0.44 a3.06 ± 0.95 a3.85 ± 1.34 a2.62 ± 0.38 a3.67 ± 1.06 a
10–20 cm0.76 ± 0.59 ab0.85 ± 0.23 b2.11 ± 0.77 ab1.27 ± 0.03 b1.86 ± 0.72 b
20–30 cm0.21 ± 0.03 b0.22 ± 0.24 b1.83 ± 0.36 b0.99 ± 0.09 b1.31 ± 0.60 b
0–30 cm0.79 ± 0.29 C1.37 ± 0.35 C2.60 ± 0.44 A1.63 ± 0.10 BC2.28 ± 0.77 AB
Available K
/(mg·kg−1)
0–10 cm98.79 ± 27.34 a204.70 ± 35.66 a238.42 ± 53.37 a202.89 ± 20.95 a230.95 ± 42.47 a
10–20 cm38.83 ± 32.92 b108.30 ± 16.63 b224.84 ± 33.14 a118.03 ± 56.93 b160.80 ± 34.75 b
20–30 cm13.71 ± 11.22 b98.12 ± 16.20 b58.74 ± 11.57 b85.44 ± 35.17 b141.34 ± 20.24 b
0–30 cm50.44 ± 20.71 B137.04 ± 22.53 A174.00 ± 29.97 A135.45 ± 37.41 A177.70 ± 32.29 A
TN
/(g·kg−1)
0–10 cm4.04 ± 0.67 a6.08 ± 0.20 a5.89 ± 1.13 a4.63 ± 0.15 a8.92 ± 0.90 a
10–20 cm1.32 ± 0.59 b3.32 ± 1.44 b5.73 ± 0.97 a3.16 ± 0.75 b6.36 ± 1.31 b
20–30 cm0.87 ± 0.05 b1.04 ± 0.28 c3.47 ± 0.75 b1.50 ± 0.07 c5.58 ± 0.49 b
0–30 cm2.08 ± 0.15 D3.48 ± 0.44 C5.03 ± 0.95 B3.09 ± 0.32 CD6.95 ± 0.89 A
TC
/(g·kg−1)
0–10 cm47.90 ± 6.80 a78.13 ± 5.39 a74.27 ± 5.75 a55.53 ± 3.51 a95.42 ± 8.30 a
10–20 cm11.92 ± 5.51 b46.42 ± 10.01 b63.56 ± 4.70 a40.51 ± 3.15 b68.56 ± 6.75 b
20–30 cm9.58 ± 1.53 b11.03 ± 5.32 c43.07 ± 7.51 b15.70 ± 1.53 c66.30 ± 6.20 b
0–30 cm23.13 ± 3.60 D45.20 ± 2.08 C60.30 ± 5.98 B37.25 ± 2.72 C76.76 ± 7.08 A
Values are the mean ± standard error (n = 3). Different lowercase letters indicate significant differences between the different soil layers at the same elevation gradient (p < 0.05). Different capital letters indicate the significant difference along different elevation gradients (p < 0.05).
Table 4. Analysis of variance between the altitude and soil layer on active soil substances.
ParametersElevationSoil LayerElevation × Soil Layer
FPFPFP
NH4+—N8.436<0.001 ***24.922<0.001 ***6.636<0.001 ***
NO3—N22.315<0.001 ***38.646<0.001 ***6.845<0.001 ***
SIN19.393<0.001 ***46.36<0.001 ***6.146<0.001 ***
MBC3.990.01 *21.452<0.001 ***1.8670.103
MBN12.443<0.001 ***6.8830.003 **0.6650.718
MBC/MBN2.5060.0630.7630.4750.6740.71
URE46.826<0.001 ***52.583<0.001 ***9.032<0.001 ***
SUC58.87<0.001 ***66.812<0.001 ***5.497<0.001 ***
URE/MBC7.149<0.001 ***2.6410.0885.814<0.001 ***
SUC/MBC4.9690.003 **0.6280.0541.2690.296
*, **, and *** indicate significant effects at p < 0.05, p < 0.01, and p < 0.001, respectively.
Table 5. Explanation of the impact factors in the redundancy analysis.
Impact FactorsExplains/%FPImpact FactorsExplains/%FP
Available N34.46.80.002Available P2.61--
Elevation14.53.40.004Soil water contents1.30.40.73
Soil bulk density10.32.80.03Shannon–Wiener1.80.60.678
TN8.22.5--Simpson520.256
Margalef5.920.098Pielou1.50.5--
TC4.91.80.14Available K10.20.818
Soil porosity3.61.40.256pH5.1<0.1--
Disclaimer/Publisher’s Note: The statements, opinions and data contained in all publications are solely those of the individual author(s) and contributor(s) and not of MDPI and/or the editor(s). MDPI and/or the editor(s) disclaim responsibility for any injury to people or property resulting from any ideas, methods, instructions or products referred to in the content.

