Article

Forest Segmentation with Spatial Pyramid Pooling Modules: A Surveillance System Based on Satellite Images

by
Fung Xin Ru
1,
Mohd Asyraf Zulkifley
1,*,
Siti Raihanah Abdani
2 and
Martin Spraggon
3
1
Department of Electrical, Electronic and Systems Engineering, Faculty of Engineering and Built Environment, Universiti Kebangsaan Malaysia, Bangi 43600, Selangor, Malaysia
2
School of Computing Sciences, College of Computing, Informatics and Media, Universiti Teknologi MARA, Shah Alam 40450, Selangor, Malaysia
3
Rabdan Academy, 65, Al Inshirah, Al Sa’adah, Abu Dhabi P.O. Box 22401, United Arab Emirates
*
Author to whom correspondence should be addressed.
Forests 2023, 14(2), 405; https://doi.org/10.3390/f14020405
Submission received: 11 January 2023 / Revised: 13 February 2023 / Accepted: 14 February 2023 / Published: 16 February 2023

Abstract

:
The global deforestation rate continues to worsen each year, and will eventually lead to various negative consequences for humans and the environment. It is essential to develop an effective forest monitoring system to detect any changes in forest areas, in particular, by monitoring the progress of forest conservation efforts. In general, changes in forest status are difficult to annotate manually, whereby the boundaries can be small in size or hard to discern, especially in areas that are bordering residential areas. The previously implemented forest monitoring systems were ineffective due to their use of low-resolution satellite images and the inefficiency of drone-based data that offer a limited field of view. Most government agencies also still rely on manual annotation, which makes the monitoring process time-consuming, tedious, and expensive. Therefore, the goal of this study is to overcome these issues by developing a forest monitoring system that relies on a robust deep semantic segmentation network that is capable of discerning forest boundaries automatically, so that any changes over the years can be tracked. The backbone of this system is based on satellite imaging supplied to a modified U-Net deep architecture to incorporate multi-scale modules to deliver the semantic segmentation output. A dataset of 6048 Landsat-8 satellite sub-images that were taken from eight land parcels of forest areas was collected and annotated, and then further divided into training and testing datasets. The novelty of this system is the optimal integration of the spatial pyramid pooling (SPP) mechanism into the base model, which allows the model to effectively segment forest areas regardless of their varying sizes, patterns, and colors. To investigate the impact of SPP on the forest segmentation system, a set of experiments was conducted by integrating several variants of SPP ranging from two to four parallel paths with different combinations of pooling kernel size, placed at the bottleneck layer of the U-Net model. The results demonstrated the effectiveness of the SPP module in improving the performance of the forest segmentation system by 2.57%, 6.74%, and 7.75% in accuracy ( a c c ), intersection over union ( I o U ), and F1-score ( F 1 s c o r e ), respectively. The best SPP variant consists of four parallel paths with a combination of pooling kernel sizes of 2 × 2 , 4 × 4 , 6 × 6 , and 8 × 8 pixels that produced the highest a c c , I o U , and F 1 s c o r e of 86.71%, 75.59%, and 82.88%, respectively. As a result, the multi-scale module improved the proposed forest segmentation system, making it a highly useful system for government and private agencies in tracking any changes in forest areas.

1. Introduction

Forests are vital natural resources for sustaining life on Earth, even though they cover only 38% of the land surface [1]. Generally, forests serve as water catchment areas that reduce the likelihood of natural disasters, such as floods, landslides, and droughts. Forests absorb carbon dioxide from the atmosphere, which lessens the greenhouse effect, and they also supply oxygen through an effective process of photosynthesis. To ensure the sustainability of forests, various government and non-government organizations have implemented a variety of strategic actions to preserve and conserve them. However, the reduction rate of forests continues to be a worrying issue, mainly due to uncontrollable global deforestation. In 2020 alone, 11,088 km 2 of forest was cut down in Brazil [2]. Furthermore, the average global deforestation rate for primary forests from 2016 to 2020 reached 4.55 mega hectares, implying that a forest area the size of Switzerland is being destroyed each year [3].
Wildfires, forestry exploitation, and illegal deforestation are the three major contributors to deforestation. Normally, wildfires are considered unavoidable disasters, especially during summer and drought seasons. The exploitation of forests, on the other hand, is usually undertaken for agriculture, logging, mining, and infrastructure construction, such as power plants, dams, and roads [4]. Although deforestation activities appear to be carried out for the benefit of mankind, especially for urbanization and economic development, they have a direct negative impact on the environment. These activities also destroy vast natural habitats, contribute to the extinction of some animal species, and disrupt the ecosystem balance. The loss of the forest canopy on the Earth’s surface will also raise global temperatures and cause soil erosion during rainy seasons [5]. Generally, roots from the plants and trees in the forest will trap the soil; without them, precipitation absorption will be less efficient during hydrological cycles.
However, controlled deforestation activities, including sustainable forest management that has been implemented in Sweden, have proven to alleviate this problem through an efficient reforestation policy, whereby every harvested tree must be replaced by two or more trees [6]. If deforestation activities, especially the illegal ones, are left without any restorative efforts, forest areas will surely continue to shrink. According to Koh et al. [7], 6.3 million hectares of Malaysia’s forest has been legally and illegally exploited since 1957. Generally, the suspects were accused of illegally removing logs from the forest and selling them for a quick profit, which clearly shows the ineffectiveness of the deployed forest monitoring system in tracking illegal deforestation activities.
In order to address this issue, a high-accuracy and reliable monitoring system for detecting changes in forest areas must be developed. Over the last few decades, this topic has prompted numerous studies in the field of forest mapping that have focused on the use of automated detection to classify forest and non-forest areas. Drones and satellite imagery are two commonly used modalities in the development of the monitoring systems, but both have limitations [8]. The use of drones involves relatively higher operating costs with a limited field of view, which makes data acquisition a more time-consuming process compared to satellite imagery [9]. On the other hand, the resolution of satellite images and their view angles are more limited compared to drone imaging. According to the “garbage in, garbage out” (GIGO) theory of Kilkenny and Robinson [10], low-resolution and cloud-induced satellite images make monitoring less effective. For this study, we propose to develop our own datasets of forest segmentation tasks by using a high-resolution format of Landsat-8 satellite images for fixed periodical years. Some of the forest areas being considered have different color patterns and scales, making the task of automated forest segmentation more difficult. As a result, this study aims to develop a multi-scale embedded deep-learning-based forest segmentation system that automatically maps forest areas over the years. The main novelty of this study is the optimal design of a multi-scale module by using the spatial pyramid pooling approach, embedded into the U-Net model. This study aims to identify the best network configurations that include multi-scale module placement, number of parallel paths, and the best multi-scale kernel set.
In this work, U-Net is chosen to be the base architecture because of its ability to perform well in semantic segmentation tasks, even without embedding any multi-scale module. Therefore, this work aims to embed the multi-scale capability to the base network by adding a spatial pyramid pooling (SPP) module, placed at the bottleneck layer of the U-Net [11]. A set of experiments are conducted to observe the impact of several SPP variants by using a different combination of pooling kernels and the total number of parallel paths. The overall network will also be configured to produce the optimal forest segmentation system. Then, the periodical changes in forest areas will be analyzed using the time series output of the segmented maps. Hence, governments can utilize these segmented forest maps to keep track of all the reductions in forest sizes automatically. Crucially, this information can be used to detect possible illegal logging activities when the forest areas shrink even though those particular areas are gazetted as reserved forest areas. Besides that, the government can also keep track of the conservation effort by periodically mapping the targeted forest areas to measure progress. This paper is organized into five main sections. The following section discusses the related works, followed by detailed explanations of the modified U-Net with a spatial pyramid pooling mechanism. The results and discussion are explained in Section 4, while the conclusion is given in the final section.

2. Related Works

2.1. Satellite Technology in Forest Monitoring Systems

Landsat-8, Terra, and Sentinel-2 are the three satellites that are commonly used to develop datasets for forest monitoring systems, as used in Krasovskii et al. [12], Wyniawskyj et al. [13], and Torres et al. [14]. The spatial resolutions of these satellites are listed in Table 1, in which they have been successfully used for various other applications, including forest monitoring systems.
With respect to the equiangular grid standard, the spatial resolution of a satellite refers to the maximum land distance represented by a single pixel [15,16]. According to the information given in Table 1, the Terra dataset is unsuitable for use in forest monitoring systems due to the low spatial resolution of the moderate resolution imaging spectroradiometer (MODIS) sensor (250m), which makes it incapable of detecting small-scale changes that are important for forest deterioration because of illegal logging [17]. On the other hand, Mutanga and Kumar [18] revealed that the satellite images from Sentinel-2 performed relatively well, but the quality of the dataset was deemed to be inefficient for model training. Therefore, Singhal and Goel [19] are credited with the inspiration for using Landsat-8 to develop the forest segmentation dataset. They accessed the satellite images through the Google Earth Pro application, which produces satisfactory image quality and resolution.
Table 1. Spatial resolution of the satellite used for automatic forest monitoring systems.
SatelliteSpatial Resolution (m)Source
Landsat-830NASA, 2021 [20]
Sentinel-210ESA, 2021 [21]
Terra250TERRA, 2021 [22]

2.2. Review of Forest Monitoring Systems

There are two approaches that have been employed to develop automated forest monitoring systems: conventional machine learning (ML) and deep learning (DL). An intact forest landscape (IFL) is one of the conventional machine learning methods that is used to identify forest and non-forest areas. It uses a binary scale based on two criteria: rate of change caused by human activities and anthropogenic segmentation [23]. This IFL-based system requires a short processing time, but it is only suitable for analyzing areas that are larger than 50,000 hectares and requires a geographic information system (GIS) application to detect significant changes in forest areas [24]. Since this system relies on a binary scale system, not much fine-detail information can be extracted from the satellite images alone, and hence, it needs to be supported by the GIS to further enrich the decision-making module of the monitoring system.
Souza et al. [25], Schultz et al. [26], Telkenaroglu et al. [27], and Othman et al. [28] developed their forest monitoring systems using a combination of remote sensing technology and vegetation index (VI), calculated according to the wavelength reflected from the Earth’s surface to the satellite. Therefore, different surfaces of the Earth will absorb and reflect light at different rates, and thus, they can be distinguished by adjusting the VI threshold value. There are a few types of VIs that have shown promising performance in detecting and classifying the Earth’s surface into various classes, including the normalized difference vegetation index (NDVI), normalized difference moisture index (NDMI), normalized difference flow index (NDFI), and normalized burn ratio (NBR). The NDFI metric outperforms the other indexes in terms of sensitivity in detecting forest canopy cover by analyzing the members of green vegetation, non-photosynthetic vegetation, and land. Although these approaches were meant for multi-class detection, they are unreliable because of the manually selected VI thresholds for each class without performing systematic analysis.
On the other hand, deep-learning-based technology has driven the study of automated forest monitoring to achieve better performance measures. The convolutional neural network (CNN) is widely used in forest monitoring studies due to its effectiveness in image recognition and processing, especially in distinguishing objects of various classes [29]. The forest monitoring system proposed by Wyniawskyj et al. [13] demonstrated the efficacy of a conventional CNN in forest area segmentation with satisfactory accuracy, but its performance is inferior when compared to other popular models such as SegNet and U-Net [30]. Nonetheless, Lee et al. [31] compared the performance of SegNet and U-Net in landscape segmentation, and found that U-Net produced higher accuracy than SegNet. The study conducted by Pashaei et al. [32] also supports Lee et al.’s findings [31] by confirming that U-Net outperformed SegNet in semantic segmentation, mainly because of SegNet’s expected information loss during pooling layers, coupled with the simplified pooling index being transferred to an expansion path.
In fact, U-Net moved the entire feature map from a contraction to an expansion path, potentially improving the segmentation performance of forest and non-forest areas [29]. As a result, U-Net is popularly implemented as the base architecture for forest monitoring systems. However, there is still ample room for improvement when it comes to the development of forest monitoring systems using the U-Net architecture. Maretto et al. [33] focused on improving U-Net using the early and late fusion methods through spatio-temporal analysis. This study shows that U-Net has a high potential to produce better average accuracy but such improvements require significant modifications to deep learning model architecture.
The improvement of U-Net proposed by Abdani et al. [34] demonstrated that segmentation accuracy increment can be achieved by applying the spatial pyramid pooling (SPP) mechanism to oil palm plantation segmentation. To improve the multi-scale capability of the system, the researchers designed a minor modification by adding an SPP module just before the bottleneck layer of the U-Net model. Liu et al. [35] also showed that U-Net with a SPP mechanism (USPP) produces excellent detection accuracy performance. They revealed that the added SPP module manages to produce better performance for automated forest monitoring systems using the Landsat-8 OLI dataset. Table 2 shows the summary of the review and investigation of the forest monitoring systems developed in the previous studies.

3. Methodology

The automated forest segmentation system in this study was developed in five steps: dataset development, image pre-processing, deep learning model training, system performance evaluation, and image post-processing, as shown in Figure 1. Since the deep learning model requires a set of moderate-resolution satellite images for training and testing, this system collected and annotated a dataset based on Landsat-8 satellite images acquired from the Google Earth Pro application. From the Operational Land Imager sensor of Landsat-8, only red, green, and blue (RGB) channels were utilized in this study because of the three input channels requirement of the pre-trained U-Net model. Furthermore, the chosen RGB bands allow multi-scale complex feature extraction of unique patterns that represented the forest areas compared to the other bands, which are more homogenous in patterns. The downloaded satellite images were then manually annotated by two annotators to produce ground truth maps. These annotated maps were then sliced into smaller land parcels before being fed into the deep learning model after performing the pre-processing steps. Only two class problems are considered for this study, a pixel is either labeled as forest or non-forest. The forest class encompasses various types of forests with different canopy appearances from the South-East Asia region. Therefore, this study aims to address this challenge by introducing the multi-scale capability to the deep semantic segmentation network.
Our work also employs the CNN as the base building block to automatically segment forest and non-forest areas. Generally, the CNN is a network composed of an input layer, hidden layers, and an output layer coupled with normalization and activation functions, which are trained recursively to produce the trained network. Therefore, U-Net, which is one of the CNN architectures designed specifically for semantic segmentation, was used as the base model in this study to build the forest segmentation system. To improve segmentation accuracy, multi-scale capability through an SPP mechanism was embedded at the bottleneck layer of the U-Net model. This experiment was built and trained on Google Colab platform with the help of TensorFlow and Keras libraries as used in [36].

3.1. Basic Network Architecture

In view of the success of U-Net as a deep learning model in semantic segmentation, this study utilizes U-Net [37] as the base network in forest monitoring systems. Figure 2 illustrates the U-Net architecture with the SPP module integrated at its bottleneck. U-Net consists of two main network paths, namely contraction (encoder) and expansion (decoder) paths, each consisting of four down-sampling and up-sampling blocks. It is a symmetric encoder–decoder network connected via a bottleneck layer that contributes to the “U-shaped” network. The blue blocks in Figure 3 are the feature maps, with its dimension represented by W × H × D , where W, H, and D stand for width, height, and depth, respectively. In this study, the numerical values indicated above the blue blocks denote the depth of feature maps. The satellite input images that were fed into U-Net have a dimension of 224 × 224 × 3 pixels in RGB format.
The U-Net architecture starts with the encoder with down-sampling blocks, consisting of two convolutional layers, followed by a rectified linear unit (ReLU) and a maximum pooling layer to capture the context and extract the image features for segmentation. The two-dimensional convolution uses a 3 × 3 convolutional kernel with a stride size of 2 to minimize the loss of spatial information. In addition, since the output feature map is usually smaller than the input feature map after the convolution, the zero-padding technique is used to ensure that the output feature map is the same size as the input feature map. The homogenous kernel is also used in pooling layers with the same height and width for the pooling kernel ( 2 × 2 ) to optimize the processing speed for Tensorflow. An up-sampling block in the decoder path is used to perform the precise localization by merging contextual information from the encoder path through skip connection, which allows U-Net to perform well in image segmentation. The predicted output image will have a dimension of 224 × 224 × 2 at the end of the up-sampling process, whereby the RGB input image is segmented into a binary image, which is in black and white colors.

3.2. The Spatial Pyramid Pooling Mechanism

The SPP mechanism is well known for its excellent performance in multi-size feature extraction, as it effectively preserves the spatial information of an image. Figure 3 depicts an example of the architecture of an SPP mechanism with three parallel paths with pooling kernel sizes of 2 × 2 , 4 × 4 , and 6 × 6 pixels. The SPP operation started by feeding a 14 × 14 pixels feature map into each average pooling layer (parallel path), which was then followed by a convolution operator, a batch normalization function, and a ReLU activation function to extract the multi-scale features of forest areas of various color intensities. The output feature maps from these three paths were resized back to their original size of 14 × 14 pixels before being concatenated with the input feature map (feed-forward path) and fed back into the U-Net model for further processing of the decoder side. The spatial information was preserved by carrying out the feature extraction three times on the same input feature map, thereby extracting the features at different scales. As an SPP module is always composed of multiple paths, it will produce a larger model and is suited to be placed at the bottleneck layer of the U-Net model. This is because the smallest feature map size at the bottleneck layer uses the lowest memory space compared to the module placement at other layers.
To study the impact of optimum SPP on the forest monitoring system, an experiment was conducted using six variants of the SPP modules with the basic settings shown in Table 3. The number of parallel paths and the combination of pooling kernel sizes was adjusted so that the resultant total number of filters remained at 1536. This is because a conventional SPP is made up of three parallel paths, with each path composed of 512 filters, or 1536 filters in total. Due to the adoption of equal division methodology, this study only tested SPP modules with two, three, and four parallel paths (the minimum number of paths for an SPP module is two). The SPP network with five parallel paths was not preferred in this study because of the feature map size limitation at the bottleneck layer, whereby it becomes zero if a larger pooling kernel is used, resulting in too much information loss.
The theory of homogeneous pooling kernel was also applied to the SPP module, leading to more coherent feature maps, especially when dealing with the multi-scale issue. The output feature map from the average pooling layers must also be greater than 3 × 3 pixels, as the applied convolution operator right after the pooling layer has a kernel size of 3 × 3 pixels. Hence, the pooling kernel sizes used in this study only ranged from 2 × 2 to 9 × 9 pixels, with the kernel size selection being a multiple of each other. A pooling kernel size of 1 × 1 pixel is not feasible, as it carries minimal impact, while a pooling operation with a kernel size of 10 × 10 pixels is inappropriate because the resultant output feature map will be 5 × 5 pixels, which is too small to extract any meaningful features.

4. Results and Discussion

4.1. Landsat-8 Satellite Image Dataset

The evolution of satellite technology with the deep learning approach has led to a higher level of accuracy in forest mapping studies. While the Landsat-9 satellite is equipped with the best sensor specifications in the Landsat series, it is not suitable for time series studies, as it was only launched in September 2021, and lacks temporal data from previous years. In contrast, Landsat-8 is the most suitable satellite for this study, as it has the best radiometric resolution (12 bits) with sufficient temporal data over more than 10 years. The satellite imaging dataset used in this study was saved from Landsat-8 using the Google Earth Pro application. Google Earth Pro is a relatively similar application to Google Earth Engine, but it is better suited for use in this study, primarily because it is free of charge.
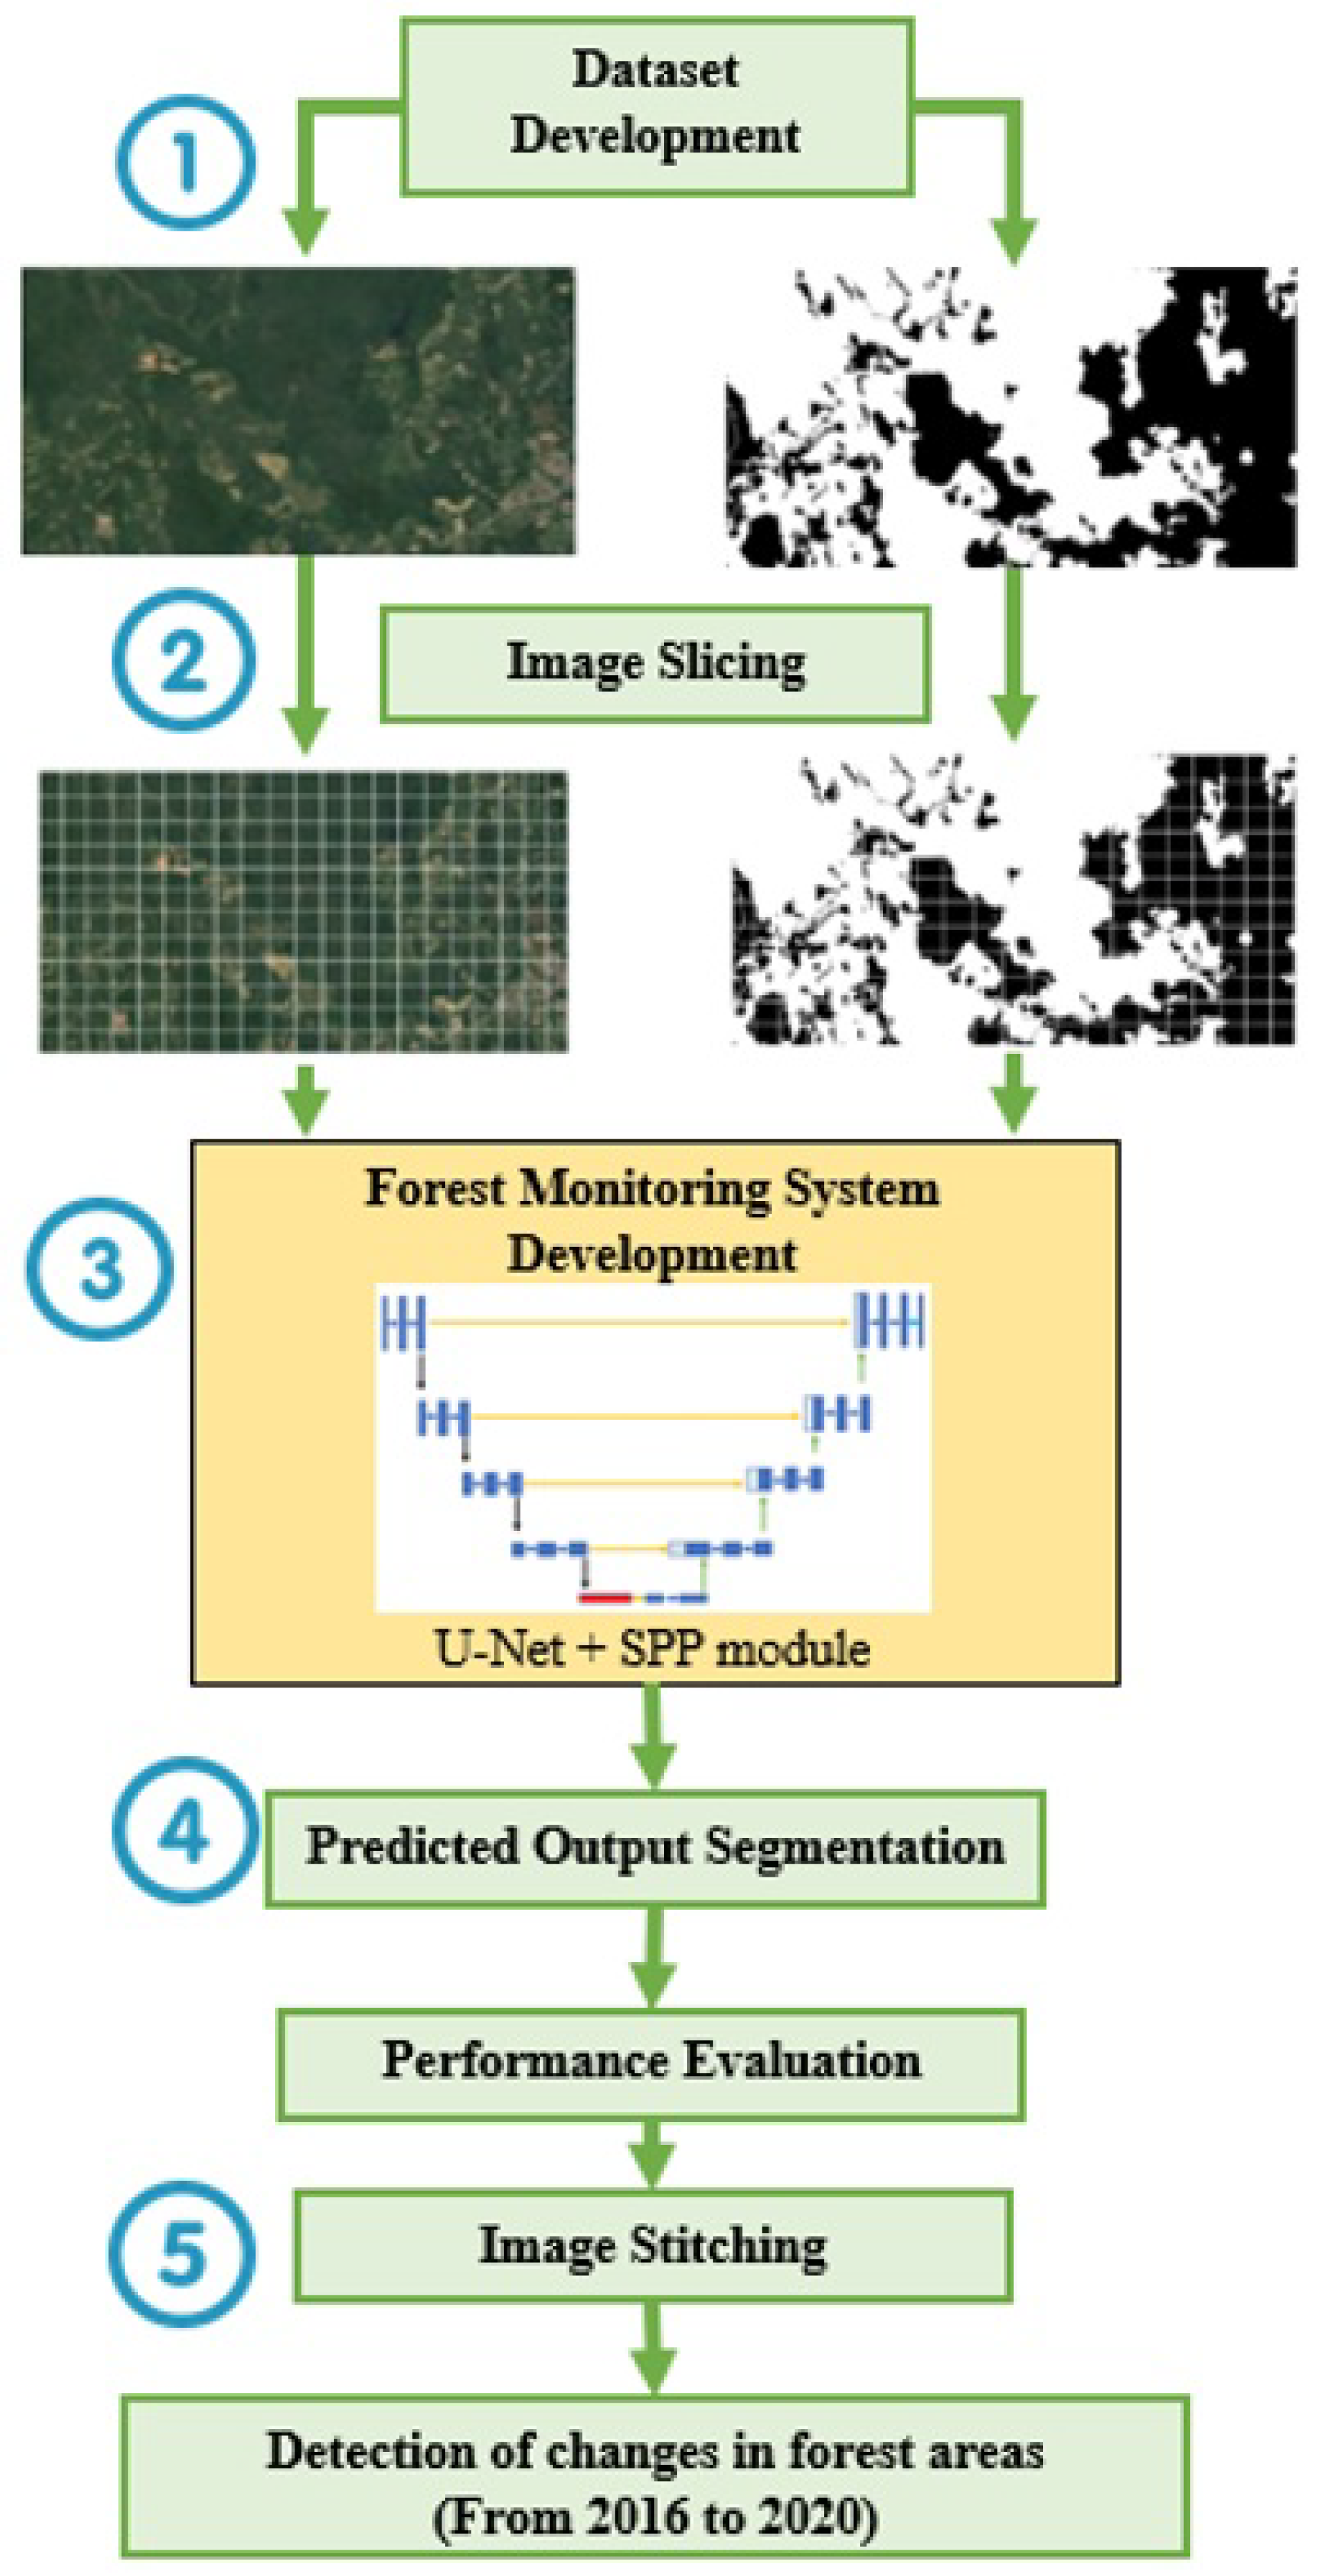
The selection of study locations is the first step in dataset development, and its quality has a direct impact on segmentation accuracy. The forest areas of South-East Asia were the best choice for this research because they offer a clear distinction between forest and non-forest areas. The dataset was extracted from the Landsat-8 satellite, whereby the size for each land parcel is 4800 × 2782 pixels, with a resolution of 1.34 m per pixel. This selection was made so that the satellite images had the widest field of view without any disturbances, such as cloud cover and mosaic-like images that degrade the system’s performance. To track the changes in forest status, this study focused on developing the dataset with time series Landsat-8 satellite images taken from 2016, 2018, and 2020, and sampled at eight different locations throughout the South-East Asia region. Initially, this study focused on changes in forest status for every two years to ensure that small changes could still be clearly detected. If a one-year sampling period is chosen, the changes in the forest status are not too obvious, which is not informative for reporting purposes. Therefore, two years are chosen so that the changes in the forest status are clearly visible to support the intended applications. Please note that Landsat-8 was introduced in 2013, and so the early imaging quality is relatively low as a result of using the Google Earth Pro application. As a result, the sampling process starts from the year 2016 until 2020. For each sampling location, three land parcel samples were extracted, which resulted in a total of 24 Landsat-8 satellite images being extracted and annotated. The acquired satellite images for a particular location must also have the same angle, scale, and resolutions to ensure data consistency.
The ground truth satellite images were manually annotated using the Adobe Photoshop application. Since the performance of the system is heavily dependent on labeled data, the manual annotation of forest and non-forest areas must be performed meticulously and consistently. Thus, forest areas were annotated as the foreground with a white color RGB code of (255, 255, 255), while non-forest areas were annotated as the background with a black color RGB code of (0, 0, 0). Then, the pre-processing phase was completed by slicing the RGB images and their ground truth maps from 4800 × 2782 pixels to subsets of 224 × 224 pixels, which was the input format for U-Net. The satellite image of a selected land parcel was sliced into 252 images, which resulted in 6048 smaller samples, taken from the original satellite images of 24 land parcels. The dataset was then divided into two subsets of 2268 training data and 756 testing data. Table 4 summarizes the study locations for both annotated datasets.
To analyze the system’s capability to segment the forest area at different difficulty levels, the satellite images were further divided into two sets of data based on their difficulty level to distinguish the forest and non-forest areas, as shown in Figure 4. The dataset with a moderate level of difficulty has a clear distinction between forest and non-forest areas, as well as fewer rivers, lakes, and vegetation areas. In contrast, the dataset with a high-difficulty level consists of satellite images with similar features between forest and non-forest areas, and with more rivers, lakes, and vegetation areas.

4.2. Performance Evaluation of the Forest Monitoring System

The performance of the forest segmentation system was measured using three metrics: average accuracy ( a c c ), Intersection over Union ( I o U ), and F1-Score ( F 1 s c o r e ). a c c is used to validate system performance by calculating the correct prediction for both classes based on the confusion metrics shown in Table 5. F 1 s c o r e is a performance metric similar to a c c , but with advantages for real-world classification, especially when there is an imbalanced class distribution [38]. Finally, I o U is the most commonly used metric in evaluating a segmentation model that focuses on the overlapping areas between predicated maps and ground truth maps. It represents the ratio of the area of intersection over the total area of the ground truth and predicted segmentation maps.
a c c = T P + T N T P + T N + F P + F N
F 1 s c o r e = T P T P + 0.5 ( F P + F N )
I o U = T P + T N T P + F P + F N
The first step in building an optimal base U-Net model using semantic segmentation methodology is finding the optimized set of hyperparameters. A set of experiments was conducted using different sets of hyperparameters to observe their respective training accuracy and loss, as well as to evaluate the segmentation accuracy of the trained model on the test data. The optimal hyperparameter configurations used in this study are listed in Table 6. The selected optimizer was stochastic gradient descent (SGD). The number of epochs required for training convergence is different for each SPP module variant, and it is also dependent on the difficulty level of the dataset and the spatial relationship between features in the satellite images. Therefore, the optimum number of epochs for a certain model is determined by observing and ensuring that the training accuracy and loss converge at the end of the training process with satisfactory testing accuracy and loss.
Table 7 shows the performance of the proposed forest segmentation system at moderate and high levels of difficulty with and without the SPP module for both datasets. The forest segmentation system developed by the dataset with a moderate level of difficulty has an a c c , I o U , and F 1 s c o r e of 88.23%, 78.80%, and 87.02%, respectively. It can also be seen that the base U-Net performance is improved by all SPP variants, especially for the system embedded with SPP comprising four parallel paths with pooling kernel sizes of 2 × 2 , 4 × 4 , 6 × 6 , and 8 × 8 . This optimal SPP module successfully produces the highest a c c , I o U , and F 1 s c o r e of 90.81%, 83.17%, and 90.72%, respectively, with a performance improvement of 2.92%, 5.55%, and 4.25%, respectively. The optimal SPP module is made up of four pooling layers, which effectively preserves the spatial information of various scales, resulting in more robust segmentation mapping. The forest segmentation system produces the best performance with an SPP module comprising four parallel paths, followed by SPP modules with three and two parallel branches. Meanwhile, the experimental results also show that a combination of smaller pooling kernel sizes is able to detect smaller features in satellite images, hence allowing the more efficacious segmentation of multi-scale forest areas. This is the reason why the system integrated with an SPP module with two parallel branches has the highest performance with pooling kernel sizes of 2 × 2 and 4 × 4 , followed by 3 × 3 and 6 × 6 , and finally 4 × 4 and 8 × 8 . Coincidentally, the patterns are similar for the SPP module with three parallel paths. It is observable that the forest segmentation system would be more sensitive to small changes in forest areas by using a combination of smaller SPP module pooling kernel sizes.
The forest segmentation system developed using a dataset of high-level difficulty on the base U-Net architecture has an a c c , I o U , and F 1 s c o r e of 84.54%, 70.84%, and 76.92%, respectively. It performs worse than the system developed by the dataset with a moderate level of difficulty. In this case, all SPP module variants enhanced the system’s performance, with the exception of the SPP module composed of two parallel paths with pooling kernel sizes of 4 × 4 and 8 × 8 pixels. This variant only achieved an a c c of 83.90%, which is 0.75% lower than the system developed using the base U-Net model. This is likely caused by the large kernel sizes used in both pooling layers that neglect the smaller features in the feature maps and result in less accurate segmentation maps of forest and non-forest areas and lower the accuracy performance. As the drop in accuracy performance is very small, with observable improvements for the F 1 s c o r e and I o U , this SPP module is still considered the one that can enhance system performance in multi-scale segmentation problems.
Similar to the system developed with a moderate difficulty dataset, the optimal SPP module variant developed for a high-difficulty dataset comprises four parallel paths with pooling kernel sizes of 2 × 2 , 4 × 4 , 6 × 6 , and 8 × 8 pixels. The performance of the forest segmentation system optimized by this variant of the SPP module produces the highest a c c , I o U , and F 1 s c o r e of 86.71%, 75.59%, and 82.88%, respectively, with a performance improvement of 2.57%, 6.71%, and 7.75%, respectively. However, the performance of the forest segmentation system with two and three parallel paths is significantly different from the system developed with a moderate difficulty dataset. The SPP module with two parallel paths is better suited to the forest segmentation system for a set of high-difficulty datasets because it produces better performance for a c c , I o U , and F 1 s c o r e compared to the SPP module with three parallel paths.
Further experiments were also conducted to compare the performance of the proposed multi-scale model with the other deep semantic segmentation models. The tests were carried out using a high-difficulty dataset to test the performance limit of the tested models. There are four deep semantic segmentation models that were tested with the optimized individual set up, which are FCN [39], TernausNet [40], SegNet [29], and U-Net [37]. Table 8 shows the performance comparison between the models. FCN and TernausNet return the worst performance with a c c , I o U , and F 1 s c o r e of 38.39%, 19.19%, and 55.48%, respectively. Interestingly, both of these models use VGG network [41] as their encoder to extract the respective features of forest and non-forest areas. This encoder design that comprises 13 layers of CNN with ReLU activation function is not suitable for the forest segmentation task. Besides that, both SegNet and U-Net have performed relatively well compared to the FCN and TernausNet. SegNet returns the third best performance values of 84.54%, 70.84%, and 76.92% for a c c , I o U , and F 1 s c o r e , respectively, while U-Net returns the second best performance values of 84.54%, 70.84%, and 76.92% for a c c , I o U , and F 1 s c o r e , respectively. Furthermore, both SegNet and U-Net utilize a symmetric network architecture between their encoder and decoder. However, the best deep semantic segmentation model is the proposed method with the best performance values across all metrics. The proposed method also adopts symmetric design architecture because the SPP module is added at the bottleneck layer.

4.3. Training Performance: Accuracy and Loss

Training a c c describes how well the system performs in achieving correct segmentation for both forest and non-forest areas on training data, while training loss refers to the segmentation error of the corresponding model, which is also used as a variable to update the weights during the learning process. Figure 5a illustrates the training accuracy and loss of a forest segmentation system developed using the moderate difficulty dataset without an SPP module. The training process converged after 80 epochs, despite there being several spikes in the loss graph at certain epochs. The spikes in loss values are normal because they are used to update the new weights by the optimizer. Thus, training accuracy drops for every single epoch that experiences a surge of loss and then increases during subsequent learning epochs after the new weights are updated with a high loss value.
The addition of the optimal SPP module to the base U-Net architecture resulted in a higher training loss compared to the system without the SPP module, which converged faster after 50 epochs, as shown in Figure 5b. The training loss for this model reached 35.2393, which is 34.8725 higher than the base system without the SPP module (0.3368). This is most likely due to the batch normalization layers, which increased the number of untrainable parameters and contributed to an increase in the training loss. This small increment is still tolerable because the batch normalization layer is important in normalizing the input to speed up the training process.
As shown in Figure 6a,b, using a high-difficulty dataset with and without an SPP module, the training accuracy and loss of the forest monitoring system converge successfully after 70 and 80 epochs, respectively. If we scrutinize the results, the training accuracy for the system without the SPP module increases very slowly after the loss spike at the ninth epoch. This is because the learning rate used for the training process is very small, only 0.0001 to ensure that the learning update can be carried out at an optimal level. Despite the fact that the training loss is higher in the system with SPP due to the batch normalization layers, the training accuracy is still successfully increased by 1.7%. Therefore, the embedded multi-scale module has managed to improve the performance of the forest segmentation algorithm, which is a very important low-level function in a forest monitoring system. The usage of a multi-scale module can be extended to any problem that encounters the issue of varying sizes of input. For example, in eye disease screening applications [42], the multi-scale capability has further improved the detection rate of the disease by better analyzing affected signals. Besides that, a multi-scale approach has also been implemented for agriculture applications that allow the system to detect leaf diseases of various sizes [43]. Hence, a multi-scale module can be optimally embedded into a base segmentation network in order to improve the model’s capability to extract features of various scales.

4.4. Qualitative Discussion on the Segmentation Output

The impact of SPP module integration into the base U-Net model was also studied by comparing qualitatively the predicted output images to the ground truth maps. Figure 7 depicts several samples of raw satellite images, ground truth maps, and predicted output maps produced by the proposed forest segmentation system, with and without the SPP module, tested on a moderate-difficulty dataset. Generally, the base system without the integration of the SPP module has vague and unclear segmentation maps between forest and non-forest areas. This weakness is more obvious along the segmentation lines near the boundaries of both areas, which is the main cause of low segmentation accuracy. On the other hand, the output maps from the system with an optimal SPP module had successfully mitigated this weakness. The maps show more precise segmentation lines along the boundaries of both classes with minimal unwanted interference of white and black dots. In conclusion, the proposed forest segmentation system with an embedded SPP module is found to be more capable of detecting and segmenting forest and non-forest areas of varying scales.
Figure 8 illustrates the predicted segmentation output at locations D and H from 2016 to 2020. The changes in forest status were detected by observing the changes in white and black areas on the maps, which refer to the forest and non-forest areas, respectively. Figure 8a depicts the segmentation map of the satellite image at location D, taken from 2016, 2018, and 2020. The circled area in the upper right corner of the respective satellite image clearly shows the forest areas have shrunk from 2016 to 2020. In 2016, there were more forest areas than non-forest areas, as shown by the presence of more white pixels compared to black pixels. Later on, this area was exploited in 2018, and the proposed system has successfully recognized the reduction in forest areas as depicted by an increment in black-colored pixels. In 2020, it was detected that this particular area contained a larger proportion of forest areas again, mainly caused by the COVID-19 pandemic that halted deforestation activities.

4.5. Changes in the Forest Status

In order to track the changes in forest areas, post-processing of the image was carried out to stitch the smaller predicted maps from the size of 224 × 224 pixels to produce the original land parcel image of size 4704 × 2688 pixels. A total of 252 segmented maps will be stitched together to produce a single large segmentation map. In this case, the segmented output maps were taken from the optimized forest segmentation system, improved by the implementation of an optimal SPP module to enhance the segmentation performance.
Almost similar patterns can be observed in the land parcel at location H, as shown in Figure 8b. The circled area indicates that there are clear changes in the forest areas, which have decreased significantly, whereby the deteriorated situation has worsened year after year. Overall, these predicted forest maps have successfully demonstrated the performance of our forest segmentation system’s effectiveness in detecting the changes from 2016 to 2020. The addition of a multi-scale module has further improved segmentation performance, which enables the system to detect deforestation activities that may be caused by illegal logging.

5. Conclusions and Future Work

This study successfully achieved its initial objectives of developing a forest segmentation system based on remote sensing technology and an improved deep learning model through embedding multi-scale capability. Two sets of satellite image datasets, consisting of 6048 samples, with satisfactory image quality and resolution were successfully developed for training and testing purposes using Landsat-8 satellite images. The system was built on the base U-Net architecture to automate the segmentation of forest areas so that any changes in status could be detected at pixel level with a c c , I o U , F 1 s c o r e of 84.54%, 70.84%, and 76.92%, respectively.
The results reveal that all SPP variants managed to improve the system’s multi-scale capability in detecting changes in forest areas at varying scales, especially for the SPP module made up of four parallel paths with pooling kernel sizes of 2 × 2 , 4 × 4 , 6 × 6 , and 8 × 8 pixels. Since satellite images from high-difficulty datasets are deemed to be more reflective of real situations, the overall performance of the system was reported using this dataset, which produced the highest a c c , I o U , and F 1 s c o r e of 86.71%, 75.59%, and 82.88%, respectively with an improvement of 2.57%, 6.71%, and 7.75%, respectively. The forest segmentation system developed in this study can monitor changes in forest status at the pixel level through an automated segmentation process with low operating costs.
This study encountered an issue with Google Colab due to its limited random-access memory (RAM) and graphics processing unit (GPU) runtime, making the training process difficult. There is room for improvement to develop a more robust forest segmentation system in the future. A larger training dataset is proposed for future work so that the training process can be conducted more comprehensively to learn a greater variety of features. This study could also be improved by testing different base deep learning models with other multi-scale modules such as atrous spatial pyramid pooling and a waterfall version of the SPP.

Author Contributions

Conceptualization, F.X.R., M.A.Z.; software, F.X.R., M.A.Z.; formal analysis, F.X.R.; writing—original draft preparation, F.X.R., M.A.Z., S.R.A.; writing—review and editing, F.X.R., M.A.Z., S.R.A., M.S. All authors have read and agreed to the published version of the manuscript.

Funding

This research was funded by Ministry of Higher Education Malaysia under Fundamental Research Grant Scheme with grant number FRGS/1/2022/TK07/UKM/02/4 and Asia-Pacific Telecommunity under The Extra Budgetary Contribution from the Republic of Korea Fund with grant number KK-2022-026.

Institutional Review Board Statement

Not applicable.

Informed Consent Statement

Not applicable.

Data Availability Statement

The dataset can be personally requested from the corresponding author at [email protected].

Conflicts of Interest

The authors declare no conflict of interest.

Abbreviations

The following abbreviations are used in this manuscript:
CNNConvolutional Neural Networks
SGDStochastic Gradient Descent
SPPSpatial Pyramid Pooling
IoUIntersection over Union
ReLURectified Linear Unit
GIGOGarbage In, Garbage Out
MLMachine Learning
DLDeep Learning
IFLIntact Forest Landscape
GISGeographic Information System
VIVegetation Index
NDVINormalized Difference Vegetation Index
NDMINormalized Difference Moisture Index
NBRNormalized Burn Ratio

References

  1. Bohn, F.J.; Huth, A. The importance of forest structure to biodiversity–productivity relationships. R. Soc. Open Sci. 2017, 4, 160521. [Google Scholar] [CrossRef] [PubMed] [Green Version]
  2. Silva Junior, C.H.; Pessôa, A.C.; Carvalho, N.S.; Reis, J.B.; Anderson, L.O.; Aragão, L.E. The Brazilian Amazon deforestation rate in 2020 is the greatest of the decade. Nat. Ecol. Evol. 2021, 5, 144–145. [Google Scholar] [CrossRef] [PubMed]
  3. Watch, G.F. Global Primary Forest Loss. 2021. Available online: https://gfw.global/3JJS9Sm (accessed on 10 December 2021).
  4. Petrenko, C.; Paltseva, J.; Searle, S. Ecological Impacts of Palm Oil Expansion in Indonesia; International Council on Clean Transportation: Washington, DC, USA, 2016. [Google Scholar]
  5. Hartanto, H.; Prabhu, R.; Widayat, A.S.; Asdak, C. Factors affecting runoff and soil erosion: Plot-level soil loss monitoring for assessing sustainability of forest management. For. Ecol. Manag. 2003, 180, 361–374. [Google Scholar] [CrossRef]
  6. Lidestav, G.; Westin, K. The impact of Swedish forest owners’ values and objectives on management practices and forest policy accomplishment. Small Scale For. 2023, 1–22. [Google Scholar] [CrossRef]
  7. Koh, J.; Johari, S.; Shuib, A.; Siow, M.L.; Matthew, N.K. Malaysia’s forest pledges and the Bornean state of Sarawak: A policy perspective. Sustainability 2023, 15, 1385. [Google Scholar] [CrossRef]
  8. Abdani, S.R.; Zulkifley, M.A.; Siham, M.N.; Abiddin, N.Z.; Aziz, N.A.A. Paddy fields segmentation using fully convolutional network with pyramid pooling module. In Proceedings of the IEEE 5th International Symposium on Telecommunication Technologies, Virtual, 9–11 November 2020; pp. 30–34. [Google Scholar]
  9. de Araújo, M.; Andrade, E.; Machida, F. Performance analysis of machine learning-based systems for detecting deforestation. In Proceedings of the 2021 XI Brazilian Symposium on Computing Systems Engineering, Online, 22–25 November 2021; pp. 1–8. [Google Scholar]
  10. Kilkenny, M.F.; Robinson, K.M. Data quality: “Garbage in–garbage out”. Health Inf. Manag. J. 2018, 47, 103–105. [Google Scholar] [CrossRef] [Green Version]
  11. Abdani, S.R.; Zulkifley, M.A. Optimal selection of pyramid pooling components for convolutional neural network classifier. In Proceedings of the International Conference on Decision Aid Sciences and Application, Sakheer, Bahrain, 8–9 November 2020; pp. 586–591. [Google Scholar]
  12. Krasovskii, A.; Maus, V.; Yowargana, P.; Pietsch, S.; Rautiainen, M. Monitoring deforestation in rainforests using satellite data: A pilot study from Kalimantan, Indonesia. Forests 2018, 9, 389. [Google Scholar]
  13. Wyniawskyj, N.S.; Napiorkowska, M.; Petit, D.; Podder, P.; Marti, P. Forest monitoring in Guatemala using satellite imagery and deep learning. In Proceedings of the IEEE International Geoscience and Remote Sensing Symposium, Yokohama, Japan, 28 July–2 August 2019; pp. 6598–6601. [Google Scholar]
  14. Torres, D.L.; Turnes, J.N.; Soto Vega, P.J.; Feitosa, R.Q.; Silva, D.E.; Marcato Junior, J.; Almeida, C. Deforestation detection with fully convolutional networks in the Amazon forest from Landsat-8 and Sentinel-2 images. Remote. Sens. 2021, 13, 5084. [Google Scholar] [CrossRef]
  15. Liang, S.; Wang, J. Advanced Remote Sensing: Terrestrial Information Extraction and Applications; Academic Press: Cambridge, MA, USA, 2019. [Google Scholar]
  16. Vishwakarma, B.D.; Devaraju, B.; Sneeuw, N. What is the spatial resolution of GRACE satellite products for hydrology? Remote. Sens. 2018, 10, 852. [Google Scholar] [CrossRef] [Green Version]
  17. Lunetta, R.S.; Knight, J.F.; Ediriwickrema, J.; Lyon, J.G.; Worthy, L.D. Land-cover change detection using multi-temporal MODIS NDVI data. Remote. Sens. Environ. 2006, 105, 142–154. [Google Scholar] [CrossRef]
  18. Mutanga, O.; Kumar, L. Google Earth engine applications. Remote. Sens. 2019, 11, 591. [Google Scholar] [CrossRef] [Green Version]
  19. Singhal, A.; Goel, S. Spatio-temporal analysis of open waste dumping sites using GoogleEarth: A case study of Kharagpur City, India. In Spatial Modeling and Assessment of Environmental Contaminants; Springer: Berlin/Heidelberg, Germany, 2021; pp. 137–151. [Google Scholar]
  20. Science, N.L. Satellite Landsat Series. Available online: https://landsat.gsfc.nasa.gov/ (accessed on 20 December 2021).
  21. Agency, E.S. Sentinel-Online: Sentinel-1 and Sentinel-2. Available online: https://sentinel.esa.int/web/sentinel/missions/sentinel-2 (accessed on 25 December 2021).
  22. Terra, N. Terra Instruments: Moderate Resolution Imaging Spectroradiometer (MODIS). Available online: https://terra.nasa.gov/about/terra-instruments/modis (accessed on 25 December 2021).
  23. Margono, B.A.; Turubanova, S.; Zhuravleva, I.; Potapov, P.; Tyukavina, A.; Baccini, A.; Goetz, S.; Hansen, M.C. Mapping and monitoring deforestation and forest degradation in Sumatra (Indonesia) using Landsat time series data sets from 1990 to 2010. Environ. Res. Lett. 2012, 7, 034010. [Google Scholar] [CrossRef]
  24. Potapov, P.; Yaroshenko, A.; Turubanova, S.; Dubinin, M.; Laestadius, L.; Thies, C.; Aksenov, D.; Egorov, A.; Yesipova, Y.; Glushkov, I.; et al. Mapping the world’s intact forest landscapes by remote sensing. Ecol. Soc. 2008, 13, 51. [Google Scholar] [CrossRef] [Green Version]
  25. Souza Jr, C.M.; Siqueira, J.V.; Sales, M.H.; Fonseca, A.V.; Ribeiro, J.G.; Numata, I.; Cochrane, M.A.; Barber, C.P.; Roberts, D.A.; Barlow, J. Ten-year Landsat classification of deforestation and forest degradation in the Brazilian Amazon. Remote. Sens. 2013, 5, 5493–5513. [Google Scholar] [CrossRef] [Green Version]
  26. Schultz, M.; Clevers, J.G.; Carter, S.; Verbesselt, J.; Avitabile, V.; Quang, H.V.; Herold, M. Performance of vegetation indices from Landsat time series in deforestation monitoring. Int. J. Appl. Earth Obs. Geoinf. 2016, 52, 318–327. [Google Scholar] [CrossRef]
  27. Telkenaroglu, C.; Dikmen, M. Deforestation due to urbanization: A case study for Trabzon, Turkey. ISPRS Ann. Photogramm. Remote. Sens. Spat. Inf. Sci. 2017, 4, 379. [Google Scholar] [CrossRef] [Green Version]
  28. Othman, M.; Ash’Aari, Z.; Aris, A.; Ramli, M. Tropical deforestation monitoring using NDVI from MODIS satellite: A case study in Pahang, Malaysia. In Proceedings of the IOP Conference Series: Earth and Environmental Science; IOP Publishing: Bristol, UK, 2018; Volume 169, p. 012047. [Google Scholar]
  29. Badrinarayanan, V.; Kendall, A.; Cipolla, R. SegNet: A deep convolutional encoder-decoder architecture for image segmentation. IEEE Trans. Pattern Anal. Mach. Intell. 2017, 39, 2481–2495. [Google Scholar] [CrossRef]
  30. Syrris, V.; Hasenohr, P.; Delipetrev, B.; Kotsev, A.; Kempeneers, P.; Soille, P. Evaluation of the potential of convolutional neural networks and random forests for multi-class segmentation of Sentinel-2 imagery. Remote. Sens. 2019, 11, 907. [Google Scholar] [CrossRef] [Green Version]
  31. Lee, S.H.; Han, K.J.; Lee, K.; Lee, K.J.; Oh, K.Y.; Lee, M.J. Classification of landscape affected by deforestation using high-resolution remote sensing data and deep-learning techniques. Remote. Sens. 2020, 12, 3372. [Google Scholar] [CrossRef]
  32. Pashaei, M.; Kamangir, H.; Starek, M.J.; Tissot, P. Review and evaluation of deep learning architectures for efficient land cover mapping with UAS hyper-spatial imagery: A case study over a wetland. Remote. Sens. 2020, 12, 959. [Google Scholar] [CrossRef] [Green Version]
  33. Maretto, R.V.; Fonseca, L.M.; Jacobs, N.; Körting, T.S.; Bendini, H.N.; Parente, L.L. Spatio-temporal deep learning approach to map deforestation in amazon rainforest. IEEE Geosci. Remote. Sens. Lett. 2020, 18, 771–775. [Google Scholar] [CrossRef]
  34. Abdani, S.R.; Zulkifley, M.A.; Mamat, M. U-Net with spatial pyramid pooling module for segmenting oil palm plantations. In Proceedings of the IEEE 2nd International Conference on Artificial Intelligence in Engineering and Technology, Kota Kinabalu, Sabah, 26–27 September 2020; pp. 1–5. [Google Scholar]
  35. Liu, Y.; Gross, L.; Li, Z.; Li, X.; Fan, X.; Qi, W. Automatic building extraction on high-resolution remote sensing imagery using deep convolutional encoder-decoder with spatial pyramid pooling. IEEE Access 2019, 7, 128774–128786. [Google Scholar] [CrossRef]
  36. Zulkifley, M.A.; Mohamed, N.A.; Zulkifley, N.H. Squat angle assessment through tracking body movements. IEEE Access 2019, 7, 48635–48644. [Google Scholar] [CrossRef]
  37. Ronneberger, O.; Fischer, P.; Brox, T. U-Net: Convolutional networks for biomedical image segmentation. In Proceedings of the Medical Image Computing and Computer-Assisted Intervention; Navab, N., Hornegger, J., Wells, W.M., Frangi, A.F., Eds.; Springer International Publishing: Cham, Germany, 2015; pp. 234–241. [Google Scholar]
  38. Abdani, S.R.; Zulkifley, M.A.; Moubark, A.M. Pterygium tissues segmentation using densely connected DeepLab. In Proceedings of the IEEE 10th Symposium on Computer Applications Industrial Electronics, Penang, Malaysia, 18–19 April 2020; pp. 229–232. [Google Scholar]
  39. Long, J.; Shelhamer, E.; Darrell, T. Fully convolutional networks for semantic segmentation. In Proceedings of the IEEE Conference on Computer Vision and Pattern Recognition (CVPR), Boston, MA, USA, 7–12 June 2015; pp. 3431–3440. [Google Scholar] [CrossRef] [Green Version]
  40. Iglovikov, V.; Shvets, A. Ternausnet: U-Net with VGG11 encoder pre-trained on imagenet for image segmentation. arXiv 2018, arXiv:1801.05746. [Google Scholar]
  41. Simonyan, K.; Zisserman, A. Very Deep Convolutional Networks for Large-Scale Image Recognition; Technical report; University of Oxford: Oxford, UK, 2014. [Google Scholar]
  42. Araya-Arriagada, J.; Garay, S.; Rojas, C.; Duran-Aniotz, C.; Palacios, A.G.; Chacón, M.; Medina, L.E. Multiscale entropy analysis of retinal signals reveals reduced complexity in a mouse model of Alzheimer’s disease. Sci. Rep. 2022, 12, 8900. [Google Scholar] [CrossRef] [PubMed]
  43. Wang, D.; Cao, W.; Zhang, F.; Li, Z.; Xu, S.; Wu, X. A review of deep learning in multiscale agricultural sensing. Remote. Sens. 2022, 14, 559. [Google Scholar] [CrossRef]
Figure 1. Workflow of the proposed automatic forest monitoring system development.
Forests 14 00405 g001
Figure 2. U-Net with a multi-scale module embedded at the bottleneck layer.
Forests 14 00405 g002
Figure 3. Network architecture of a spatial pyramid pooling mechanism.
Forests 14 00405 g003
Figure 4. Satellite images from dataset of (a,b).
Forests 14 00405 g004
Figure 5. Training accuracy and loss of forest monitoring system using moderately difficult dataset.
Forests 14 00405 g005
Figure 6. Training accuracy and loss of forest monitoring system using high-difficulty dataset.
Forests 14 00405 g006
Figure 7. Predicted output images produced by forest monitoring system using dataset of (a,b).
Forests 14 00405 g007
Figure 8. Predicted output images at (a,b) from 2016 to 2020.
Forests 14 00405 g008
Table 2. Summary on automatic forest monitoring systems.
No.SourceDatasetDevelopment ApproachesStrengthsWeaknesses
1Margono et al. [23]Landsat-5, Landsat-7Intact Forest LandscapeFast developmentUnable to detect forest area less than 50,000 hectares
2Othman et al. [28]MODISVegetation Index (VI)Able to detect multi-class surface on EarthUnreliable handcrafted feature with low-spatial-resolution remote sensor
3Maretto et al. [33]Landsat-8U-NetSimple network architecture improved with early and late fusionRequires larger set of parameters but accuracy improvement is too small
4Lee et al. [31]KOMPSAT-3SegNetTransferring only pooling indices to expansion path requires less memory spaceSignificant information loss during pooling layers
5Syrris et al. [30]Sentinel-2Conventional CNNShort training and prediction timeModerate accuracy in segmentation due to its inability to capture spatially invariant features of the input images
6Pashaei et al. [32]UAS imageryU-NetSkip connection contributes to faster training and high accuracyNo improvements made to detect multi-scale forest areas
Table 3. SPP module variants.
No.Number of Parallel PathsPooling Kernel Sizes
12 2 × 2 , 4 × 4
2 3 × 3 , 6 × 6
3 4 × 4 , 8 × 8
43 2 × 2 , 4 × 4 , 6 × 6
5 3 × 3 , 6 × 6 , 9 × 9
64 2 × 2 , 4 × 4 , 6 × 6 , 8 × 8
Table 4. Landsat-8 satellite images dataset information.
DatasetLocationLatitudeLongitudeType of Data
Moderate level of difficultyA5°38 31.56 N117°6 45.39 ETraining data
B3°10 26.10 N101°58 7.99 ETraining data
C1°25 32.01 N117°12 46.65 ETraining data
D3°5 38.77 N98°4 11.72 ETesting data
High level of difficultyE2°7 49.52 N117°17’0.27 ETraining data
F0°47 49.27 S115°48 43.03 ETraining data
G2°38 28.69 N103°2 6.68 ETraining data
H3°54 34.15 N102°52 5.11 ETesting data
Table 5. Terminology of the confusion matrix.
TerminologyDescription
True positive ( T P )Detect correctly forest areas as forest areas
True negative ( T N )Detect correctly non-forest areas as non-forest areas
False positive ( F P )Detect non-forest areas as forest areas
False negative ( F N )Detect forest areas as non-forest areas
Table 6. Hyperparameter setting.
HyperparameterValue
Learning rate0.0001
Batch size8
Epoch100
Optimizer Momentum0.9
Table 7. Performance results of the U-Net with an embedded spatial pyramid pooling module.
DatasetNumber ofPoolingPerformance Metrics (%)Improvement (%)
Parallel PathsKernels acc IoU F 1 score acc IoU F 1 score
Moderate level ofOriginal U-Net-88.2378.8087.02---
difficulty2 2 × 2 , 4 × 4 89.5781.0488.851.522.842.10
3 × 3 , 6 × 6 89.5480.9888.711.492.771.94
4 × 4 , 8 × 8 89.3380.6488.541.252.341.75
3 2 × 2 , 4 × 4 , 6 × 6 90.7382.9990.242.835.323.71
3 × 3 , 6 × 6 , 9 × 9 89.8481.5289.321.823.452.64
4 2 × 2 , 4 × 4 , 6 × 6 , 8 × 8 90.8183.1790.722.925.554.25
High level ofOriginal U-Net-84.5470.8476.92---
difficulty2 2 × 2 , 4 × 4 86.4274.7681.642.225.536.14
3 × 3 , 6 × 6 86.1074.4281.621.855.056.11
4 × 4 , 8 × 8 83.9071.7380.85−0.751.265.11
3 2 × 2 , 4 × 4 , 6 × 6 85.2573.2380.870.843.375.14
3 × 3 , 6 × 6 , 9 × 9 84.8672.8180.880.382.785.15
4 2 × 2 , 4 × 4 , 6 × 6 , 8 × 8 86.7175.5982.882.576.717.75
Table 8. Performance comparison with the other deep semantic segmentation models.
MethodPerformance Metrics (%)
acc IoU F 1 score
FCN [39]38.3919.1955.48
TernausNet [40]38.3919.1955.48
SegNet [29]86.3875.5980.28
U-Net [37]84.5470.8476.92
Proposed method86.7175.5982.88
Disclaimer/Publisher’s Note: The statements, opinions and data contained in all publications are solely those of the individual author(s) and contributor(s) and not of MDPI and/or the editor(s). MDPI and/or the editor(s) disclaim responsibility for any injury to people or property resulting from any ideas, methods, instructions or products referred to in the content.

