Article

The Interactive Effects of Nitrogen Addition and Ozone Pollution on Cathay Poplar-Associated Phyllosphere Bacterial Communities

1
Research Center for Urban Forestry, Key Laboratory for Silviculture and Forest Ecosystem of State Forestry and Grassland Administration, The Key Laboratory for Silviculture and Conservation of Ministry of Education, Beijing Forestry University, Beijing 100083, China
2
State Key Laboratory of Urban and Regional Ecology, Research Center for Eco-Environmental Sciences, Chinese Academy of Sciences, Shuangqing Road 18, Haidian District, Beijing 100085, China
3
KQ GEO Technologies Co., Ltd., Jinghai 4th Road, Daxing District, Beijing 100176, China
*
Author to whom correspondence should be addressed.
Forests 2023, 14(3), 452; https://doi.org/10.3390/f14030452
Submission received: 11 January 2023 / Revised: 18 February 2023 / Accepted: 21 February 2023 / Published: 22 February 2023
(This article belongs to the Section Forest Ecophysiology and Biology)

Abstract

:
Ground-level ozone (O3) can adversely impact tree productivity and the service functions of forest ecosystems. The deposition of atmospheric nitrogen (N) can enhance nutrient availability and mitigate the O3-mediated impairment of plant–soil–microbe systems. Interactions between plants and associated microbial communities are integral to the ability of these plants to resist environmental stressors, yet studies examining the impact of increased O3 and N levels, alone or in combination, on these phyllosphere bacterial communities have been lacking to date. Accordingly, this study was conducted to examine the impact of O3 (charcoal-filtered air vs. non-filtered ambient air + 40 ppb of O3), N addition (0, 50, and 100 kg N ha−1 year−1), and a combination of these treatments on the phyllosphere bacterial communities associated with Cathay poplars. Higher O3 levels were found to significantly reduce the relative abundance of Gammaproteobacteria phyla while increasing the relative abundance of the dominant Alphaproteobacteria and Betaproteobacteria, with these effects being independent of N levels. Consistently, while marked differences in the composition of phyllosphere bacterial communities were observed as a function of O3 treatment conditions, they were largely similar across N treatments. Higher O3 levels contributed to significant reductions in α diversity, including both observed OTUs and phylogenetic diversity, when no N or low levels of N were added. α diversity was not affected by the N addition irrespective of O3 levels. A significant correlation was observed between photosynthesis rates and both α diversity and phyllosphere bacterial community composition, indicating a close relationship between photosynthetic activity and this microbial community. Together, these data offer new ecological insights regarding O3-induced changes in the makeup of bacterial communities present on plant surfaces, providing a foundation for efforts to formulate novel management strategies aimed at adapting environmental stressors under conditions of O3 pollution and in N-enriched environments.

1. Introduction

Rapid industrialization and urbanization over the last two decades have contributed to steadily rising ground-level ozone (O3) concentrations and anthropogenic reactive nitrogen (N) deposition rates [1,2]. In China, surface O3 concentrations have risen to ~50 ppb, exceeding both the Europe and USA levels [3,4]. These high O3 levels have the potential to impair normal forest growth and productivity and represent a serious threat to the biodiversity and multifunctionality of terrestrial ecosystems [5,6,7,8]. N deposition, in contrast, can drive the enhanced growth of plants and improved forest-based carbon (C) sequestration [9,10]. However, prior evidence has been inconsistent with respect to whether the addition of N to soil can exacerbate (e.g., [11]), mitigate (e.g., [12]), or fail to impact (e.g., [13,14]) the negative effects that O3 levels have on plant growth, physiological characteristics, and biomass production, or on the associated rhizosphere soil microbes associated with these plants.
Plant interactions with their commensal microbiota are integral to their ability to grow and to resist environmental stressors such as O3 pollution or N deposition [15]. To date, most studies on plant–microbe interactions have been centered around the rhizosphere soil communities but have further extended to the phyllosphere microbiome over the last 10 years [16,17]. Notably, terrestrial plant phyllosphere surfaces compose the largest biological surface in the world, with both environmental conditions and plant-specific characteristics ultimately shaping the composition of the ecologically important microbial communities present thereupon [16,18]. Phyllosphere microbes are present on all plants and are essential regulators of host plant health and growth, thereby shaping key ecosystem processes such as carbon and nitrogen metabolism and assimilation [17]. These microbes can reduce host susceptibility to biological stressors (including parasites, pests, and pathogens) as well as abiotic stressors (including pollutants, inconsistent nutrient or water availability, temperature fluctuations, and exposure to ultraviolet radiation) thanks to their ability to produce antibiotic compounds and growth regulators (such as auxin, and indole-3-acetic acid, IAA) or to fix atmospheric N2 [15,19,20,21,22,23]. Phyllosphere members of the Variovorax genus can also reduce atmospheric isoprene emissions through the degradation of this volatile organic compound, playing a negative feedback role in the context of O3 formation [17,24,25]. Epiphytic bacteria are the primary species present in phyllosphere microbial communities, and can have beneficial, detrimental, or neutral effects on colonized host plants [19,26,27,28]. These phyllosphere bacterial communities are generally very sensitive and responsive to changes in environmental conditions, given that leaf surfaces are readily exposed to meteorological changes and are the initial site of O3 damage [15,18].
A growing number of studies in recent years have experimentally examined the impact of increased O3 levels and/or N addition on the physiology and productivity of plants or the associated rhizosphere soil microbial communities [12,13,14,29,30], whereas the ways in which these environmental perturbations can impact the phyllosphere microbiome remain insufficiently studied. Indeed, knowledge of the responsivity of phyllosphere microbes to environmental stressors continues to lag behind similar knowledge regarding rhizosphere microorganisms [17]. Some recent articles have examined the impact of increased O3 levels on phyllospheric microorganisms associated with grasses or the leaves of crop plants including rice and wheat [31,32,33,34,35], whereas the ways that such O3 pollution impacts the diversity and composition of tree phyllosphere bacterial communities remain completely unknown. Sun et al. [34] determined that the phyllosphere microbiota was less diverse than the rhizosphere microbiota, with both the α- and β-diversity of phyllosphere microbes being associated with N fertilization resistance. Given the exposed nature of the phyllosphere, microorganisms associated with these plant surfaces can exhibit complex and spatiotemporally dynamic responses to environmental factors [19,28]. Soil N addition may influence phyllosphere microbial communities through changes in leaf morphology and alterations in rhizosphere microbial communities [17], but further research is necessary to definitively establish the responsivity of the phyllosphere microbiota to N fertilization [15].
In contrast with rhizosphere surfaces, the phyllosphere surfaces provide few nutrients to the bacteria present thereon such that most microbes growing on plant leaves may be faced with an oligotrophic environment that limits their metabolic activity and growth [19]. Soil N addition can profoundly impact soil microbes [36], which can then enter into the emerging roots or damaged root tissue such that they can be transferred through the xylem and phloem systems to phyllosphere surfaces [37,38]. Accordingly, this study was developed based on the hypothesis that soil N addition may improve plant host nutrient availability and alleviate the O3-induced impairment of photosynthetic activity while also reducing the nutrient limitations to bacteria present on the leaves of these host plants, thereby increasing the overall phyllosphere bacterial abundance and diversity.
Poplars are a fast-growing species that exhibit high N demands and pronounced O3 uptake owing to high levels of stomatal conductance [39]. Poplar plantations compose the largest planted area in the world, and the largest such plantations are present in northern China. As such, the present study was conducted with the goal of evaluating the impact of elevated O3 levels and N addition on the composition of phyllosphere bacterial communities associated with native Cathay poplars (Populus cathayana), which exhibit pronounced sensitivity to these anthropogenic environmental changes [40,41]. The goals of this study were (1) to establish the impact of O3 and N addition alone and in combination on the diversity and composition of the phyllospheric bacteria associated with these poplar trees, and (2) to clarify the primary ecological drivers associated with variations in the composition of these phyllosphere microbial communities. The data derived from this study will provide new insight into how epiphytic bacteria associated with the phyllosphere of trees respond to increased O3 exposure and N addition.

2. Materials and Methods

2.1. Experimental Treatments

The experimental site selected for this study was in the Seed Station Field of Changping (40°19′ N, 116°13′ E), located in a warm temperate region northwest of Beijing, China, that exhibits a semi-humid continental monsoon climate. This site exhibits a mean annual temperature of 11.8 °C and received 550 mm of precipitation per year on average. On 2 May 2015, rooted Cathay poplar (Populus cathayana) cuttings were planted in circular 20 L pots containing local sandy loam soil (0.95 g N kg−1, pH = 7.6). Ultimately, plants exhibiting a similar height (ca. 27 cm) and basal stem diameter (ca. 4.5 mm) were selected and pre-adapted to octagonal toughened glass open-top chambers (OTCs; height: 3.0 m; growth space: 2.5 m2) for 10 days prior to O3 fumigation. There were 15 plants in each OTC (five plants for each of three N levels). Study plants were manually irrigated with tap water to the maximum soil field capacity (36.8%, volume content of soil) every 1–2 days to protect them from adverse drought-related effects.
Two O3 treatment conditions were assigned at random to six OTCs (3 replicate OTCs/treatment): charcoal-filtered ambient air (CF) or non-filtered ambient air supplemented with O3 at 40 ppb (E-O3). For further details regarding this O3 fumigation process, see the study published previously by [39] and [42]. The experimental treatment period ran for 96 days from 5 June to 8 September. The daily O3 fumigation period was 10 h (from 8:00 to 18:00) at maximum, 7 days a week except on rainy, cloudy, and foggy days. On rainy days, plastic was used to cover the ground in these experimental pots to minimize the impact of rain. The average daily O3 levels over this duration in the CF and E-O3 groups were 34.3 ± 2.3 ppb and 80.3 ± 5.5 ppb, respectively. The corresponding AOT40 (accumulated O3 exposure over an hourly threshold of 40 ppb) values for these two treatment groups were 4.4 ± 0.5 and 38.7 ± 0.6 ppm h. The charcoal filtration efficiency was 98% at the exit of the fan (1.1 kW, 1080 Pa, 19 m3 min−1, CZR, Fengda, Wuhan, China), but about 40% at the canopy level due to the high O3 concentration of ambient air [42]. In addition, three nitrogen treatment conditions were established by adding 0, 50, or 100 kg N ha−1 year−1 of urea (N0, N50, and N100, respectively). N50 and N100 levels represented the suggested critical loads of 50 kg N ha−1 yr−1 for most planted forests including poplars in China [13] and the extremely higher levels forecast for high N deposition risk areas, respectively. Five plants were tested per N level, and N addition was conducted at 5 discrete time points (24 June, 12 July, 31 July, 20 August, and 5 September) by adding 100 mL of water containing 0 g (N0), 0.089 g (N50), or 0.178 g (N100) of dissolved urea as detailed previously by [41].

2.2. Leaf Trait Measurements

An open gas exchange system equipped with a modulated chlorophyll fluorescence chamber (LI-6400XT and LI-6400-40, LI-COR Inc., Lincoln, NE, USA) was used for simultaneous measurements of chlorophyll fluorescence parameters and leaf gas exchange. Briefly, on 2–4 September (at the late growth period), for each OTC and N treatment, two fully expanded mature leaves (6th–8th position from the apex) from two plants were selected at random, with measurements being made under the following regulated conditions: relative humidity = 50%–60%, saturating photosynthetic photon flux density = 1200 μmol m−2 s−1, block temperature = 30 °C, and ambient CO2 entering the leaves = 400 μmol mol−1. All measurements were made on sunny days from 9:00 to 11:30. Values downloaded from this instrument when analyses were complete included: light-saturated photosynthesis rate (Asat), stomatal conductance (gs), intercellular CO2 concentrations (Ci), transpiration rates (Tr), the actual photochemical efficiency of PSII under saturated light levels (Fv’/Fm’), the effective quantum yield of PSII (PhiPSII), and the photochemical quenching efficiency of PSII (qP).
When steady-state gas exchange and chlorophyll fluorescence had been achieved, photosynthetic responses to different concentrations of intercellular CO2 (A/Ci curves) were initiated. Briefly, a series of CO2 concentrations were applied within the chamber (380, 300, 200, 100, 50, 380, 575, 800, 1000, 1200, and 1500 μmol mol−1). Estimations of the maximum carboxylation efficiency (Vcmax) and maximum electron transport rate (Jmax) were performed by fitting the A/Ci response data to curves as detailed previously by [42].
After the fluorescence and gas exchange measurements were taken, TenaxTA glass tubes (Thermal Desorption Tubes, Mesh 60/80, Gerstel, Mülheim, Germany) were used to collect isoprene samples that were analyzed using a thermal desorption system (TDS3, Gerstel, Mülheim, Germany) and via GC/MS (GC 5890, MSD 5975; Agilent Technologies, Santa Clara, CA, USA). For further details regarding these analyses, see the study published by [41].
Once isoprene sample collection was complete, leaf disc sampling from these same leaves was performed for chlorophyll analyses. These discs were immersed for ~7 days in 95% ethanol at 4 °C, and were protected from light until completed faded, at which time chlorophyll (a + b) content was measured based on appropriate absorption coefficients (663 and 646 nm), as detailed previously by [43]. To measure leaf biomass, leaves were dried for 48 h at 65 °C to a constant weight.

2.3. Phyllosphere Micorbes Collection

When O3 fumigation was complete, phyllosphere microbes were harvested from all plants. To enable analyses of epiphytes, present on leaf surfaces rather than endophytes present within leaves [44], whole leaf tissue grinding was not performed and surface washing was instead conducted as follows: 10 g samples of fresh leaves were transferred from each plant to a sterile plastic bag containing 100 mL of TE buffer supplemented with detergent (10 mM Tris-HCl and 1 mM EDTA, pH 7.0 + 0.1% Tween 20) to enable the efficient harvesting of microbes from hydrophobic leaf surfaces. This bag was shaken in a sonicated bath (15 °C, 15 kHz) for 15 min, after which plant the debris was removed from the buffer solution by passing it through a 200 μm mesh surface. The solution was then centrifuged for 10 min at 3250× g at 4 °C, with pellets subsequently being resuspended in detergent-free TE buffer (1 mL per sample) followed by centrifugation for 5 min at 15,000× g at 4 °C. Pellets were then stored at −40 °C to await DNA extraction.

2.4. DNA Extraction and Sequencing

The FastDNA SPIN Kit (MP Biomedicals, Santa Ana, CA, USA) is used based on a modified version of the provided instructions to extract phyllosphere bacterial DNA, as discussed in a prior study published by [44]. After DNA had been isolated, the bacterial 16S rRNA V5–V7 hypervariable regions were amplified via PCR with the following primers 799F (5′-AACMGGATTAGATACCCKG-3′) and 1193R (5′-ACGTCATCCCCACCTTCC-3′). These primers enabled the minimization of any mitochondrial or chloroplast 16S rRNA contamination [45]. Each PCR reaction had a total volume of 50 μL, and thermocycler settings were as follows: 94 °C for 5 min; 30 cycles of 94 °C for 30 s, 55 °C for 30 s, and 72 °C for 45 s; and 72 °C for 10 min. The purification of triplicate barcoded PCR products for each sample was conducted with the QIAquick PCR Purification kit (Qiagen), followed by quantification with a NanoDrop ND-2000 instrument (ThermoFisher, Waltham, MA, USA). Samples were then pooled in equimolar amounts and paired-end sequencing was performed with an Illumina MiSeq instrument (Illumina, San Diego, CA, USA).
Raw MiSeq 16S rRNA data were processed with the Quantitative Insights Into Microbial Ecology (QIIME) v 1.9 pipeline. Briefly, FLASH was used to join paired-end sequences, which were then assigned to each sample based on the unique barcodes. Reads <200 bp in length with a quality score <25 were discarded, while the remaining sequences were binned into operational taxonomic units (OTUs) at a 97% identity threshold [46]. The most abundant sequence for each of these OTUs was chosen as a representative sequence for further analyses. Overall, 371,991 high-quality 16S rRNA gene sequences were obtained through this analysis, with a minimum of 3665 sequences per sample. Taxonomic assignments for OTUs were conducted with reference to the SILVA database (http://www.arb-silva.de/download/archive/qiime/, accessed on 1 January 2018). Samples were rarefied to 3500 sequences/sample for analyses of bacterial α and β diversity.

2.5. Statistical Analyses

The phyllosphere bacterial α diversity among samples was compared by assessing the Chao1 index [47], phylogenetic diversity (PD; [48]), and observed OTUs, while the β diversity for different treatment conditions was evaluated using calculated Bray–Curtis distance-based non-metric multidimensional scaling (NMDS) analyses, with significance being computed via permutational multivariate analysis of variance (PERMANOVA; p < 0.05, Table S1). Correlations between bacterial community composition and plant-specific variables were assessed using a partial Mantel test, while the percentage of the variation in the composition of phyllosphere microbial communities explained by plant-specific variables was determined via distance-based multivariate analysis for a linear model (DistLM), using a resemblance matrix generated based upon Bray–Curtis similarity for the absence or presence of OTUs in individual samples [49]. This analysis was performed using the DISTLM_forward 1.3 software [50].
Analyses of variance for individual variables were conducted using a linear mixed model incorporating levels of O3 and N, as well as the interactive effects between these two experimental manipulations as explanatory variables, whereas pot and OTC were included as random effects. The lowest Akaike information criterion was used to select the best-fit variance/covariance matrices for all parameters. Differences among treatment conditions were established with Tukey’s honestly significant difference (HSD) post hoc test (p < 0.05). Levene’s and Shapiro–Wilk tests were performed prior to these analyses to ensure that the data were normally distributed (p > 0.05). Linear regression analyses were used to examine the association between plant properties and bacterial diversity, while associations between the abundance of dominant microbes and plant characteristics were assessed with Pearson correlation analyses. The mean relative abundance of each specific genus was used to compute response ratios based on a subset of 3500 selected sequences in the experimental and control groups. The single OTC was defined as statistical unit after averaging the two plants for each N level in each OTC. All analyses were performed using R v3.5.3 and Predictive Analytics Suite Workstation (PASW) Statistics 18.0 (IBM Inc. Armonk, NY, USA).

3. Results

3.1. Changes in Phyllospheric Bacterial Abundance in Response to Elevated O3 and N Levels

The dominant bacteria across all samples included Betaproteobacteria (44.7%), Gammaproteobacteria (29.9%), Firmicutes (10.9%), and Alphaproteobacteria (8.9%), with these bacteria accounting for over 94.4% of all sequences (Figure 1). Other taxa including Acidobacteria, Actinobacteria, Bacteroidetes, Chloroflexi, Deltaproteobacteria, and Gemmatimonadetes were also detected in these samples, but their abundance was relatively limited (Figure 1). Response ratios were used to examine the responses of these dominant phyllospheric taxa to O3 and N treatment conditions (Figure 2). These analyses revealed that Deltaproteobacteria, Gammaproteobacteria, and Sphingobacteriia abundance decreased significantly in response to elevated O3 levels (p < 0.05), whereas the abundance of Actinobacteria, Alphaproteobacteria, and Betaproteobacteria was increased in samples from poplars exposed to elevated O3 at the N50 (Figure 2a) or N100 (Figure 2b) supplementation levels. While Acidobacteria, Cytophagia, and Thermoleophilia abundance was not altered under conditions of elevated O3 levels and N50 treatment, their abundance was significantly decreased under conditions of elevated O3 levels and N100 treatment (Figure 2).

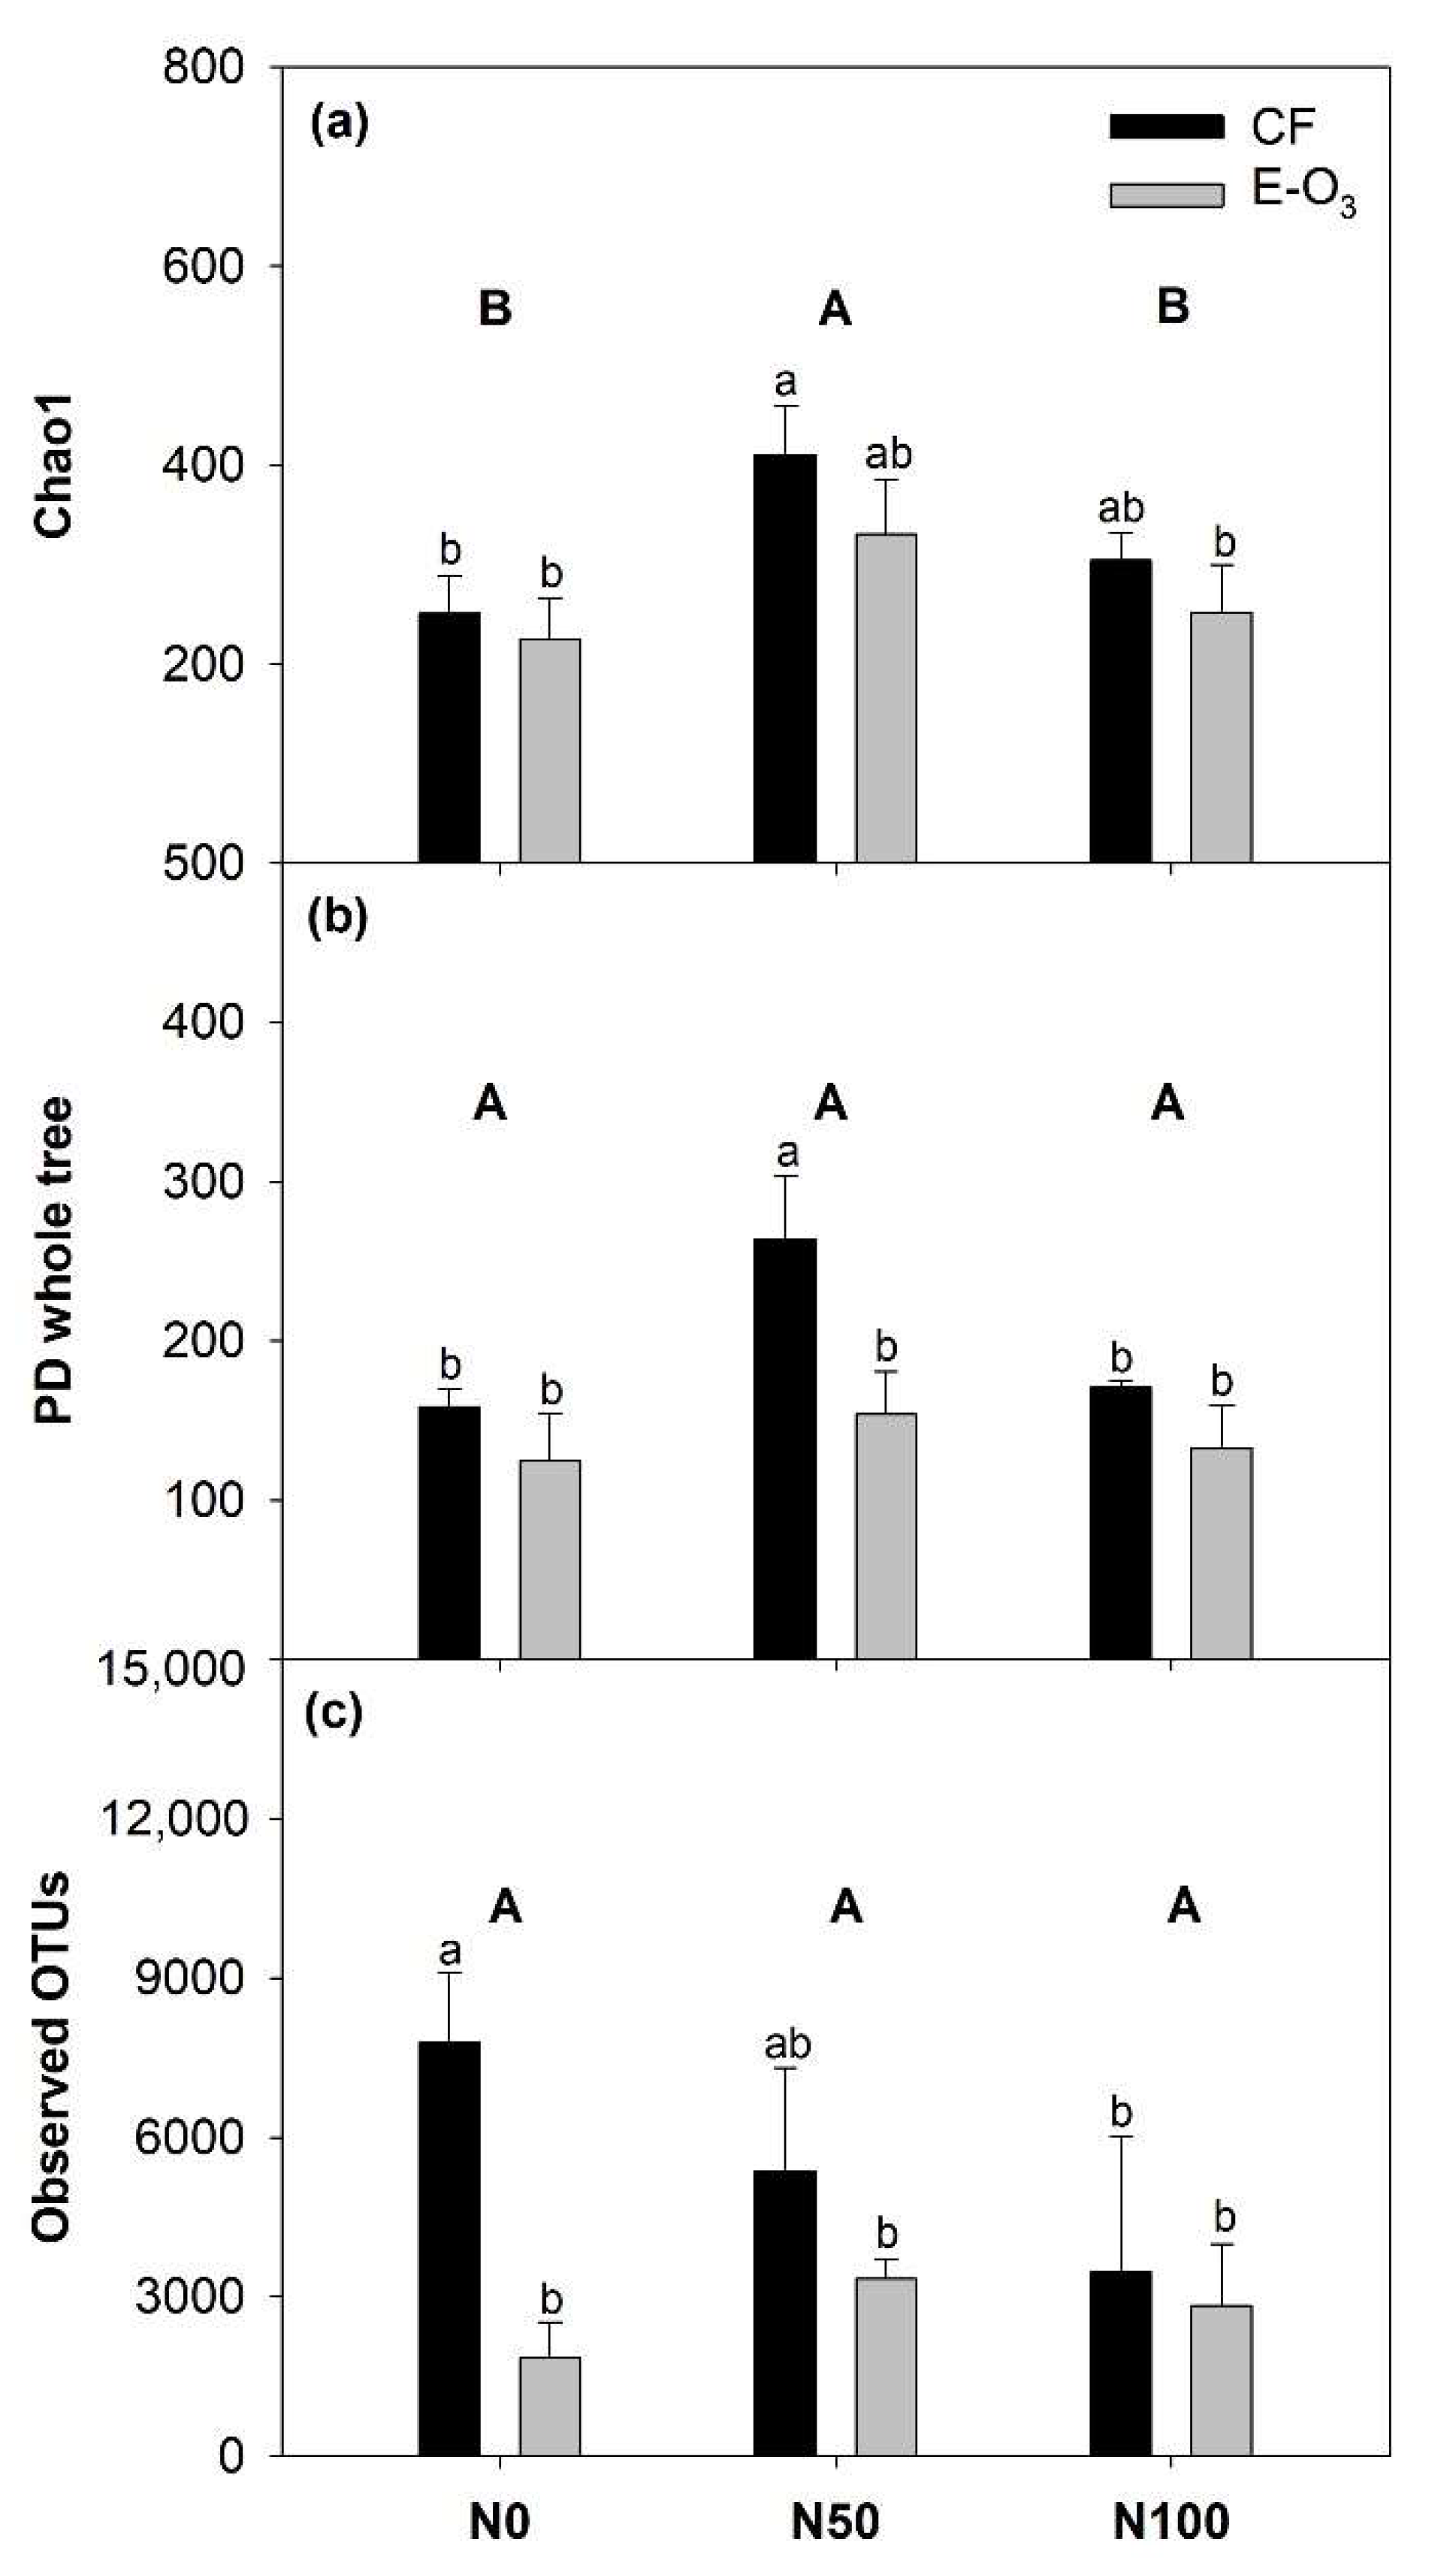
3.2. The Impact of Elevated O3 and N Levels on Phyllosphere Bacterial Community Alpha Diversity

Changes in the α diversity of phyllosphere bacterial communities in response to altered O3 and N exposure levels were assessed using the Chao1 index, phylogenetic diversity (PD), and observed OTUs (Figure 3). A significant increase in Chao1 index values was evident in the CF + N50 treatment condition, whereas it was unaffected by increased exposure to elevated O3 levels (Figure 3a). Significant decreases in observed OTUs and PD were observed under elevated O3 at the N0 and N50 levels, respectively (Figure 3b,c). However, N addition did not significantly affect these results. No significant interactive effects between O3 and N were observed for any of these α diversity indices (Figure 3).

3.3. Changes in Bacterial Community Composition in Response to Elevated O3 and N Levels

A shift in the composition of the phyllosphere bacterial community was observed in response to increases in O3 exposure, N addition, and a combination of these two environmental perturbations as detected through NMDS analysis based on Bray–Curtis distances (Figure 4). This analysis suggested that significant differences in OTU-based taxonomy were evident when comparing the CF and E-O3 groups (Figure 4), whereas community composition did not differ among N treatments or the combined O3 and N treatment conditions, as was additionally confirmed via PERMANOVA (Table S1).

3.4. The Relationship between Plant-Specific Variables and the Phyllospheric Bacterial Community

Of the plant-specific parameters analyzed in this study, only Asat (14.27%) was found to be significantly correlated with the composition of the phyllosphere bacterial community (Table 1). Both observed OTUs and PD were positively correlated with Asat, while a borderline positive correlation was observed between the Chao1 index and Asat (r = 0.445, p = 0.074; Figure 5a, Table S2). With respect to dominant bacterial phyla, Gammaproteobacteria and Betaproteobacteria were found to be positively and negatively correlated with Asat (Figure 5b), respectively. A significant positive correlation was also observed between Gammaproteobacteria and other plant-specific variables (gs, Chl, ISO, Fv’/Fm’, qP, Vcmax, Jmax, and biomass), whereas they were negatively correlated with Ci (Table S3, Figure S1).

4. Discussion

No prior studies have conducted analyses of the simultaneous impact of O3 and N on the composition and diversity of phyllosphere epiphytic bacterial communities. Here, changes in both leaf phyllosphere bacteria and leaf photosynthetic traits were observed in response to elevated O3 and N addition (Table S4). Functionally, phyllosphere bacteria can shape the health of host plants through the uptake of host-derived C compounds and N fixation [51,52]. The results of this study provide a foundation for further studies of phyllosphere ecology and the sensitivity of these microbial communities to O3- and N-induced changes, highlighting opportunities for the more effective development of management strategies for forests faced with O3 pollution and high levels of N enrichment. Xiang et al. [53] previously reported that, relative to the soil microbiota, the phyllosphere microbiota may exhibit reduced functional diversity such that it is more sensitive to anthropogenic disturbances, meaning that relatively limited changes in the makeup of these phyllosphere communities have the potential to dramatically impact ecosystem functions, given that the affected microbes may play diverse roles [17].
Data from this study suggested that Proteobacteria (beta-, gamma-, and alphaproteobacteria) and Firmicutes were the dominant microbes within phyllosphere communities, in line with prior results [16,18,54,55]. Kembel et al. [56] reported Alphaproteobacteria to be the dominant bacteria present in the phyllosphere of 57 different species of tree, with Gammaproteobacteria and Sphingobacteria being the next most dominant species. Imperato et al. [57] employed a shotgun sequencing approach which revealed the Carpinus betulus L. phyllosphere microbiota to be dominated by Gammaproteobacteria (71%; primarily Pseudomonas spp.), Actinobacteria, Alphaproteobacteria, Betaproteobacteria, and Firmicutes. Indeed, while host-specific phyllosphere community composition is evident, advances in PCR techniques and MLTreeMap analyses have generally revealed Proteobacteria, Actinobacteria, Bacteroidetes, and Firmicutes to be the predominant members of these communities [16,18,44,54,55,58] (with Proteobacteria generally accounting for >50% of phyllosphere bacteria across different host plants) [15,16,18]. In general, these abundance profiles are consistent with those observed in rhizosphere soil samples, with slightly higher Proteobacteria levels in the rhizosphere [44].
Exposure to elevated levels of O3 was associated with a significant drop in relative Gammaproteobacteria abundance and a concomitant increase in relative Actinobacteria, Alphaproteobacteria, and Betaproteobacteria abundance in the present study, independent of N addition. The majority of leaf phyllosphere bacteria are non-pathogenic commensal microbes [18]. However, certain phytopathogens are also found in these communities, including Pantoea, Pseudomonas, and Xanthomonas (in class Gammaproteobacteria), Clavibacter and Leifsonia (in class Actinobacteria), Agrobacterium, Methylobacterium, Sphingomonas (in class Alphaproteobacteria), and Burkholderia (in class Betaproteobacteria) [16,44,59]. While O3 exposure can kill phytopathogens present on leaf surfaces that are exposed to this gas, the resultant O3-induced reactive oxygen species (ROS) production can impair stomatal function, suppress photosynthetic activity, and drive more rapid programmed leaf cell death [29], contributing to higher levels of relative phytopathogen abundance while reducing relative commensal abundance. Additional studies, however, will be necessary to more fully characterize which poplar phyllosphere microbial community members are most responsive to O3 pollution and the implication of such responsivity.
Several prior analyses have explored factors that shape phyllospheric bacterial community structures [59,60,61]. When evaluating leaf bacterial communities, Laforest-Lapointe et al. [20] determined that host species identity, functional identity, and functional diversity were the primary factors shaping the diversity and structure of these communities. Moreover, leaf surface nutrient availability was reported to be an important regulator of the growth of epiphytic microorganisms [19]. However, the most important factors influencing phyllosphere bacterial community makeup remain poorly understood, limiting any efforts to understand how these communities adapt to environmental stressors or to manage these communities [17]. Epiphytic microbes experience direct interactions with the environment, including direct exposure to sunlight and indirect effects mediated by host plant photosynthetic activity [18]. Given their constant exposure to photosynthesis-derived oxygen and atmospheric O3, these microbes are highly susceptible to ROS-induced oxidative damage to lipids, proteins, and nucleic acids. Accordingly, these microbes generally either adopt a tolerance strategy that enables them to persist on leaf surfaces under low levels of nutrient ability in the presence of direct O3 exposure or they engage defensive strategies that enable them to enter into the apoplast and to trigger plant defense responses such as pigment production or the activation of photolyases and other DNA repair enzymes [19,62,63].
Here, both partial Mantel tests and DistLM models indicated that leaf photosynthesis was the primary factor associated with phyllospheric bacterial community composition. In addition, α diversity indices (Chao1, PD, and observed OTUs) and the levels of the most abundant phylum, Gammaproteobacteria, were positively correlated with rates of photosynthesis. The phyllosphere is a largely oligotrophic environment; the ability of microbes to take up, metabolize, and secret a range of bioactive compounds (such as siderophores and antimicrobial compounds) via photosynthesis may impact phyllosphere community assembly [64]. Leaf C availability is therefore the main factor that determines epiphytic colonization [19,65]. The main C sources on plants include sucrose, fructose, and glucose that are believed to come from the plant interior [19,66,67]). Carbohydrate availability influences bacterial community composition and, when pathogens are present, plants restrict monosaccharide levels in the apoplast to protect against phytopathogenic growth [68], suggesting that plants may conversely supply sugars to beneficial microbes such as anoxygenic phototrophic bacteria [69,70]. Stone et al. [21] determined that the the Alphaproteobacterial Rhodospirillaceae family primarily consists of purple non-sulfur bacteria that generate energy via photosynthesis. Extracellular polysaccharides are important mediators that protect plant-associated microbes from ROS-induced damage [19,71]. Photosynthesis may thus be an important force that shapes the composition of phyllosphere microbial communities, given that the phyllosphere is an oligotrophic environment where only limited and highly variable simple C sources are available [18,19]. The mechanisms involved in the variation of phyllosphere bacterial community composition need to be verified with further experiments.
Of the four most dominant phyllosphere phyla identified in this study, the only class that was correlated with leaf biomass or photosynthesis-related variables was Gammaproteobacteria (Table S3). This may suggest that the observed decreases in relative Gammaproteobacterial abundance under conditions of elevated O3 levels, even in the context of N fertilization, were directly caused by the O3-induced decline in the vitality of the Gammaproteobacterial population and indirectly attributable to the O3-mediated impairment of photosynthetic activity. Kim et al. [72] reported that plant-associated IAA producers include many different bacteria present within phyllospheric communities, including some that are phytopathogens and others that are beneficial to their hosts, such as the Gammaproteobacteria species Pseudomonas putida strain 1290, which was found to be capable of utilizing IAA as its only N, C, and energy source [72]. The production of IAA can enhance bacterial survival, potentially owing to the ability of these bacteria to effectively trick plants into redirecting nutrients produced through photosynthesis such as glucose, sucrose, and fructose to sites colonized by these microbes [19,72,73]. Pseudomonas syringae strains have been shown to be important in the context of aggregate development on leaf surfaces, and these microbes can produce bioactive compounds such as syringolin A and coronatine, which are capable of counteracting stomatal closure (triggered in response to pathogens, thus influencing apoplast entry) [74,75]. Several regulators of Pseudomonas stress responses have also been identified including catalase, DNA protection proteins, and stress response proteins [76]. Delmotte et al. [16] further determined that Pseudomonas species specifically express amino acid, sucrose, glucose, and maltose transport systems, consistent with the ability of these species to specialize in the utilization of monosaccharides and disaccharides and to take up amino acids. Pseudomonas are also suitably adapted to lifestyles entailing active nutrient acquisition [16], and the motility of epiphytic Pseudomonas species is an important attribute associated with their fitness in phyllospheric settings [76]. However, Pseudomonas species are not common or constant members of the plant microbiota and are instead transiently present and more likely to undergo changes in abundance [15,16].
Here, in addition to not impacting the diversity or composition of phyllosphere bacteria communities, N addition also failed to mitigate the negative impact of elevated O3 levels. This may be due to the fact that soil, rather than foliar, fertilization can weaken any effects of N supplementation on phyllospheric microbes. Consistently, Xiong et al. [77] found that host selection, rather than N addition, was more important as a determinant of phyllosphere community assembly and network complexity. Moreover, Sun et al. [34] reported no changes in the composition or diversity of phyllosphere protist communities in response to N fertilization. However, a current understanding of the mechanisms governing the assembly and functional roles of the phyllosphere microbiota under conditions of N fertilization remains limited [17], and the further study of this topic is necessary to draw definitive conclusions. In this study, the effects of O3 on phyllosphere bacterial communities were found to be independent of N addition, and the same has also been reported with respect to rhizosphere soil microbial communities [14], plant photosynthetic activity, growth, and biomass production [13]. As such, soil N addition is unlikely to be an efficacious means of mitigating the negative effects of high O3 levels on the traits of plants or the microbial communities associated therewith.

5. Conclusions

In summary, this study offers novel insight regarding the impact of increased O3 and N levels on the diversity of phyllosphere bacterial communities associated with poplar leaves, with a particular focus on the association between phyllosphere bacterial community α diversity and foliar photosynthesis. Increases in O3 exposure resulted in a marked shift in the makeup of these phyllosphere bacterial communities, whereas the addition of soil N failed to affect phyllosphere bacterial community composition or α diversity, either alone or in combination with elevated O3 levels. Photosynthetic activity was identified as a major cause of variation in the diversity and composition of these phyllosphere bacterial communities and was a particularly important determinant for the abundance of the dominant Gammaproteobacteria phylum. These findings provide new insight into the ecological relationships between plants and microbes in response to stressors, including O3 pollution and N-enriched environments. Additional research will be essential to more fully clarify the most important bacteria present within phyllosphere bacterial communities and to characterize how these communities respond to conditions of O3 pollution and N addition, with the interplay between photosynthetic processes and these microbial communities warranting detailed interrogation. Insights into how these complex interactions shape the assembly of phyllosphere microbiota and modulate their beneficial traits will have applications in the promotion of nutrient acquisition and plant health.

Supplementary Materials

The following supporting information can be downloaded at: https://www.mdpi.com/article/10.3390/f14030452/s1, Figure S1: The relative abundances of Gammaproteobacteria in relation to (a) stomatal conductance (gs), (b) intercellular CO2 concentration (Ci), (c) chlorophyll (a + b) content (Chl), (d) isoprene emission rate (ISO), (e) the excitation energy capture efficiency of PSII reaction center (Fv’/Fm’), (f) the coefficient of photochemical quenching (qP), (g) the maximum of carboxylation efficiency (Vcmax), (h) the maximum of electron transport (Jmax), and (i) biomass. Table S1: Significance tests of the effects of the phyllosphere bacterial community structure (based on Bray–Curtis distance) among treatments as determined by permutational multivariate analysis of variance (PERMANOVA). Table S2: Pearson correlations (r) between bacterial diversity (Chao1, PD, OTUs) and plant properties. Table S3: Pearson correlations (r) between the relative abundances of dominant bacterial groups and plant properties. Table S4: Summary of gas exchange (Asat, gs, Ci), chlorophyll (a + b) content (Chl), isoprene emission (ISO), chlorophyll a fluorescence parameter (Fv’/Fm’, qP), the maximum of carboxylation efficiency (Vcmax), the maximum of electron transport (Jmax), and biomass in three N treatments (N0, N50, and N100) and two O3 treatments (charcoal-filtered air, CF, and elevated [O3], E-O3).

Author Contributions

Conceptualization, P.L.; methodology, P.L.; validation, P.L.; formal analysis, P.L.; investigation, P.L. and F.G.; resources, P.L.; data curation, P.L.; writing—original draft preparation, P.L.; writing—review and editing, P.L., K.R. and F.G.; visualization, P.L.; supervision, P.L.; project administration, P.L.; funding acquisition, P.L. All authors have read and agreed to the published version of the manuscript.

Funding

This work was supported by the National Natural Science Foundation of China (32271673, 31870458).

Data Availability Statement

Research data are available on demand and can be requested from the authors.

Acknowledgments

The authors are grateful for contributions made by Jianwei Zhang and Youzhi Feng and Bo Shang.

Conflicts of Interest

The authors declare no conflict of interest.

References

  1. Cooper, O.R.; Parrish, D.D.; Ziemke, J.; Balashov, N.V.; Cupeiro, M.; Galbally, I.E.; Gilge, S.; Horowitz, L.; Jensen, N.R.; Lamarque, J.-F.; et al. Global distribution and trends of tropospheric ozone: An observation-based review. Elem.-Sci. Anthrop. 2014, 2, 000029. [Google Scholar] [CrossRef]
  2. Yu, G.R.; Jia, Y.L.; He, N.P.; Zhu, J.X.; Chen, Z.; Wang, Q.F.; Piao, S.L.; Liu, X.J.; He, H.L.; Guo, X.B.; et al. Stabilization of atmospheric nitrogen deposition in China over the past decades. Nat. Geosci. 2019, 12, 424–429. [Google Scholar] [CrossRef]
  3. Lu, X.; Hong, J.Y.; Zhang, L.; Cooper, O.W.; Schultz, M.G.; Xu, X.B.; Wang, T.; Gao, M.; Zhao, Y.H.; Zhang, Y.H. Severe surface ozone pollution in China: A global perspective. Environ. Sci. Tech. Lett. 2018, 5, 487–494. [Google Scholar] [CrossRef]
  4. Wang, T.; Xue, L.; Feng, Z.; Dai, J.; Zhang, Y.; Tan, Y. Ground-level ozone pollution in China: A synthesis of recent findings on influencing factors and impacts. Environ. Res. Lett. 2022, 17, 063003. [Google Scholar] [CrossRef]
  5. Feng, Z.Z.; De Marco, A.; Anav, A.; Gualtieri, M.; Sicard, P.; Tian, H.; Fornasier, F.; Tao, F.L.; Guo, A.H.; Paoletti, E. Economic losses due to ozone impacts on human health, forest productivity and crop yield across China. Environ. Int. 2019, 131, 104966. [Google Scholar] [CrossRef]
  6. Juráň, S.; Grace, J.; Urban, O. Temporal changes in ozone concentrations and their impact on vegetation. Atmosphere 2021, 12, 82. [Google Scholar] [CrossRef]
  7. Anav, A.; De Marco, A.; Collalti, A.; Emberson, L.; Feng, Z.; Lombardozzi, D.; Sicard, P.; Verbeke, T.; Viovy, N.; Vitale, M.; et al. Legislative and functional aspects of different metrics used for ozone risk assessment to forests. Environ. Pollut. 2022, 295, 118690. [Google Scholar] [CrossRef]
  8. De Marco, A.; Garcia-Gomez, H.; Collalti, A.; Khaniabadi, Y.O.; Feng, Z.; Proietti, C.; Sicard, P.; Vitale, M.; Anav, A.; Paoletti, E. Ozone modelling and mapping for risk assessment: An overview of different approaches for human and ecosystems health. Environ. Res. 2022, 211, 113048. [Google Scholar] [CrossRef]
  9. Xu, C.; Xu, X.; Ju, C.; Chen, H.Y.H.; Wilsey, B.J.; Luo, Y.; Fan, W. Long-term, amplified responses of soil organic carbon to nitrogen addition worldwide. Glob. Change Biol. 2020, 27, 1170–1180. [Google Scholar] [CrossRef]
  10. Lu, X.; Hou, E.; Guo, J.; Gilliam, F.S.; Li, J.; Tang, S.; Kuang, Y. Nitrogen addition stimulates soil aggregation and enhances carbon storage in terrestrial ecosystems of China: A meta-analysis. Glob. Change Biol. 2021, 27, 2780–2792. [Google Scholar] [CrossRef]
  11. Azuchi, F.; Kinose, Y.; Matsumura, T.; Kanomata, T.; Uehara, Y.; Kobayashi, A.; Yamaguchi, M.; Izuta, T. Modeling stomatal conductance and ozone uptake of Fagus crenata grown under different nitrogen loads. Environ. Pollut. 2014, 184, 481–487. [Google Scholar] [CrossRef] [PubMed]
  12. Mills, G.; Harmens, H.; Wagg, S.; Sharps, K.; Hayes, F.; Fowler, D.; Sutton, M.; Davies, B. Ozone impacts on vegetation in a nitrogen enriched and changing climate. Environ. Pollut. 2016, 208, 898–908. [Google Scholar] [CrossRef] [PubMed] [Green Version]
  13. Feng, Z.Z.; Shang, B.; Li, Z.Z.; Calatayud, V.; Agathokleous, E. Ozone will remain a threat for plants independently of nitrogen load. Funct. Ecol. 2019, 33, 1854–1870. [Google Scholar] [CrossRef]
  14. Li, P.; Yin, R.; Zhou, H.; Yuan, X.; Feng, Z. Soil pH drives poplar rhizosphere soil microbial community responses to ozone pollution and nitrogen addition. Eur. J. Soil Sci. 2022, 73, e13186. [Google Scholar] [CrossRef]
  15. Trivedi, P.; Leach, J.E.; Tringe, S.G.; Sa, T.; Singh, B.K. Plant-microbiome interactions: From community assembly to plant health. Nat. Rev. Microbiol. 2020, 18, 607–621. [Google Scholar] [CrossRef]
  16. Delmotte, N.; Knief, C.; Chaffron, S.; Innerebner, G.; Roschitzki, B.; Schlapbach, R.; von Mering, C.; Vorholt, J.A. Community proteogenomics reveals insights into the physiology of phyllosphere bacteria. Proc. Natl. Acad. Sci. USA 2009, 106, 16428–16433. [Google Scholar] [CrossRef] [Green Version]
  17. Zhu, Y.G.; Xiong, C.; Wei, Z.; Chen, Q.L.; Ma, B.; Zhou, S.Y.D.; Tan, J.Q.; Zhang, L.M.; Cui, H.L.; Duan, G.L. Impacts of global change on phyllosphere microbiome. New Phytol. 2022, 234, 1977–1986. [Google Scholar] [CrossRef]
  18. Vorholt, J.A. Microbial life in the phyllosphere. Nat. Rev. Microbiol. 2012, 10, 828–840. [Google Scholar] [CrossRef]
  19. Lindow, S.E.; Brandl, M.T. Microbiology of the phyllosphere. Appl. Environ. Microb. 2003, 69, 1875–1883. [Google Scholar] [CrossRef] [Green Version]
  20. Laforest-Lapointe, I.; Paquette, A.; Messier, C.; Kembel, S.W. Leaf bacterial diversity mediates plant diversity and ecosystem function relationships. Nature 2017, 546, 145–147. [Google Scholar] [CrossRef]
  21. Stone, B.; Weingarten, E.; Jackson, C. The role of the phyllosphere microbiome in plant health and function. In Annual Plant Reviews Online; Roberts, J.A., Ed.; John Wiley & Sons, Ltd.: Hoboken, NJ, USA, 2018. [Google Scholar]
  22. Acuña-Rodríguez, I.S.; Newsham, K.K.; Gundel, P.E.; Torres-Díaz, C.; Montenegro, M.A.M. Functional roles of microbial symbionts in plant cold tolerance. Ecol. Lett. 2020, 23, 1034–1048. [Google Scholar] [CrossRef] [PubMed] [Green Version]
  23. Chen, T.; Nomura, K.; Wang, X.; Sohrabi, R.; Xu, J.; Yao, L.; Paasch, B.C.; Ma, L.; Kremer, J.; Cheng, Y.; et al. A plant genetic network for preventing dysbiosis in the phyllosphere. Nature 2020, 580, 653–657. [Google Scholar] [CrossRef]
  24. Crombie, A.T.; Larke-Mejia, N.L.; Emery, H.; Dawson, R.; Pratscher, J.; Murphy, G.P.; McGenity, T.J.; Murrell, J.C. Poplar phyllosphere harbors disparate isoprenedegrading bacteria. Proc. Natl. Acad. Sci. USA 2018, 115, 13081–13086. [Google Scholar] [CrossRef] [PubMed] [Green Version]
  25. Farré-Armengol, G.; Filella, I.; Llusia, J.; Peňuelas, J. Bidirectional interaction between phyllospheric microbiotas and plant volatile emissions. Trends Plant Sci. 2016, 21, 854–860. [Google Scholar] [CrossRef] [PubMed] [Green Version]
  26. Andrews, J.H.; Harris, R.F. The ecology and biogeography of microorganisms of plant surfaces. Annu. Rev. Phytopathol. 2000, 38, 145–180. [Google Scholar] [CrossRef]
  27. Yang, C.H.; Crowley, D.E.; Borneman, J.; Keen, N.T. Microbial phyllosphere populations are more complex than previously realized. Proc. Natl. Acad. Sci. USA 2001, 98, 3889–3894. [Google Scholar] [CrossRef] [Green Version]
  28. Remus-Emsermann, M.N.P.; Schlechter, R.O. Phyllosphere microbiology: At the interface between microbial individuals and the plant host. New Phytol. 2018, 218, 1327–1333. [Google Scholar] [CrossRef] [Green Version]
  29. Agathokleous, E.; Feng, Z.; Oksanen, E.; Sicard, P.; Wang, Q.; Saitanis, C.J.; Araminiene, V.; Blande, J.D.; Hayes, F.; Calatayud, V.; et al. Ozone affects plant, insect, and soil microbial communities: A threat to terrestrial ecosystems and biodiversity. Sci. Adv. 2020, 6, eabc1176. [Google Scholar] [CrossRef]
  30. Li, P.; Yin, R.; Shang, B.; Agathokleous, E.; Zhou, H.; Feng, Z. Interactive effects of ozone exposure and nitrogen addition on tree root traits and biomass allocation pattern: An experimental case study and a literature meta-analysis. Sci. Total Environ. 2020, 710, 136379. [Google Scholar] [CrossRef]
  31. Gundel, P.E.; Sorzoli, N.; Ueno, A.C.; Ghersa, C.M.; Seal, C.E.; Bastías, D.A.; Martinez-Ghersa, M.A. Impact of ozone on the viability and antioxidant content of grass seeds is affected by a vertically transmitted symbiotic fungus. Environ. Exp. Bot. 2015, 113, 40–46. [Google Scholar] [CrossRef]
  32. Ueda, Y.; Frindte, K.; Knief, C.; Ashrafuzzaman, M.; Frei, M. Effects of elevated tropospheric ozone concentration on the bacterial community in the phyllosphere and rhizoplane of rice. PLoS ONE 2016, 11, e0163178. [Google Scholar] [CrossRef] [PubMed] [Green Version]
  33. Bustos, L.M.B.; Ueno, A.C.; Di Leo, T.D.; Crocco, C.D.; Martinez-Ghersa, M.A.; MolinaMontenegro, M.A.; Gundel, P.E. Maternal exposure to ozone modulates the endophyte-conferred resistance to aphids in Lolium multiflorum. Insects 2020, 11, 548. [Google Scholar] [CrossRef] [PubMed]
  34. Sun, A.; Jiao, X.Y.; Chen, Q.; Wu, A.L.; Zheng, Y.; Lin, Y.X.; He, J.Z.; Hu, H.W. Microbial communities in crop phyllosphere and root endosphere are more resistant than soil microbiota to fertilization. Soil Biol. Biochem. 2021, 153, 108–113. [Google Scholar] [CrossRef]
  35. Ueno, A.C.; Gundel, P.E.; Molina-Montenegro, M.A.; Ramos, P.; Ghersa, C.M.; MartínezGhersa, M.A. Getting ready for the ozone battle: Vertically transmitted fungal endophytes have transgenerational positive effects in plants. Plant Cell. Environ. 2021, 44, 2716–2718. [Google Scholar] [CrossRef]
  36. Tian, D.; Jiang, L.; Ma, S.H.; Fang, W.J.; Schmid, B.; Xu, L.C.; Zhu, J.X.; Li, P.; Losaapio, G.; Jing, X.; et al. Effects of nitrogen deposition on soil microbial communities in temperate and subtropical forests in China. Sci. Total Environ. 2017, 607, 1367–1375. [Google Scholar] [CrossRef] [Green Version]
  37. Singh, B.K.; Liu, H.W.; Trivedi, P. Eco-holobiont: A new concept to identify drivers of host-associated microorganisms. Environ. Microbiol. 2020, 22, 564–567. [Google Scholar] [CrossRef]
  38. Bell, J.K.; Helgason, B.; Siciliano, S.D. Brassica napus phyllosphere bacterial composition changes with growth stage. Plant Soil 2021, 464, 501–516. [Google Scholar] [CrossRef]
  39. Hu, E.; Gao, F.; Xin, Y.; Jia, H.; Li, K.; Hu, J.; Feng, Z. Concentration- and flux-based ozone dose-response relationships for five poplar clones grown in North China. Environ. Pollut. 2015, 207, 21–30. [Google Scholar] [CrossRef]
  40. Xin, Y.; Yuan, X.; Shang, B.; Manning, W.J.; Yang, A.; Wang, Y.; Feng, Z. Moderate drought did not affect the effectiveness of ethylenediurea (EDU) in protecting Populus cathayana from ambient ozone. Sci. Total Environ. 2016, 569, 1536–1544. [Google Scholar] [CrossRef]
  41. Yuan, X.; Shang, B.; Xu, Y.; Xin, Y.; Tian, Y.; Feng, Z.Z.; Paoletti, E. No significant interactions between nitrogen stimulation and ozone inhibition of isoprene emission in Cathay poplar. Sci. Total Environ. 2017, 601, 222–229. [Google Scholar] [CrossRef]
  42. Gao, F.; Catalayud, V.; Paoletti, E.; Hoshika, Y.; Feng, Z. Water stress mitigates the negative effects of ozone on photosynthesis and biomass in poplar plants. Environ. Pollut. 2017, 230, 268–279. [Google Scholar] [CrossRef] [PubMed]
  43. Lichtenthaler, H.K. Chlorophylls and carotenoids: Pigments of photosynthetic biomembranes. Methods Enzymol. 1989, 148, 350–382. [Google Scholar]
  44. Knief, C.; Delmotte, N.; Chaffron, S.; Stark, M.; Innerebner, G.; Wassmann, R.; Von Mering, C.; Vorholt, J.A. Metaproteogenomic analysis of microbial communities in the phyllosphere and rhizosphere of rice. ISME J. 2012, 6, 1378–1390. [Google Scholar] [CrossRef] [PubMed] [Green Version]
  45. Qiu, Z.; Wang, J.; Delgado-Baquerizo, M.; Trivedi, P.; Singh, B.K. Plant microbiomes: Do different preservation approaches and primer sets alter our capacity to assess microbial diversity and community composition? Front. Plant Sci. 2020, 11, 993. [Google Scholar] [CrossRef] [PubMed]
  46. Caporaso, J.G.; Lauber, C.L.; Walters, W.A.; Berg-Lyons, D.; Huntley, J.; Fierer, N.; Owens, S.M.; Betley, J.; Fraser, L.; Bauer, M.; et al. Ultra-high-throughput microbial community analysis on the Illumina HiSeq and MiSeq platforms. ISME J. 2012, 6, 1621–1624. [Google Scholar] [CrossRef] [PubMed] [Green Version]
  47. Chao, A. Nonparametric-estimation of the number of classes in a population. Scand. J. Stat. 1984, 11, 265–270. [Google Scholar]
  48. Faith, D.P. Conservation evaluation and phylogenetic diversity. Biol. Conserv. 1992, 61, 1–10. [Google Scholar] [CrossRef]
  49. McArdle, B.H.; Anderson, M.J. Fitting multivariate models to community data: A comment on distance-based redundancy analysis. Ecology 2001, 82, 290–297. [Google Scholar] [CrossRef]
  50. Anderson, M.J. DISTLM forward: A FORTRAN Computer Program to Calculate a Distance-Based Multivariate Analysis for a Linear Model Using forward Selection; University of Auckland: Auckland, New Zealand, 2003. [Google Scholar]
  51. Papen, H.; Gessler, A.; Zumbusch, E.; Rennenberg, H. Chemolithoautotrophic nitrifiers in the phyllosphere of a spruce ecosystem receiving high atmospheric nitrogen input. Curr. Microbiol. 2002, 44, 56–60. [Google Scholar] [CrossRef]
  52. Yan, K.; Han, W.H.; Zhu, Q.L.; Li, C.R.; Dong, Z.; Wang, Y.P. Leaf surface microtopography shaping the bacterial community in the phyllosphere: Evidence from 11 tree species. Microbiol. Res. 2022, 254, 126897. [Google Scholar] [CrossRef]
  53. Xiang, Q.; Chen, Q.L.; Zhu, D.; Yang, X.R.; Qiao, M.; Hu, H.W.; Zhu, Y.G. Microbial functional traits in phyllosphere are more sensitive to anthropogenic disturbance than in soil. Environ. Pollut. 2020, 265, 114954. [Google Scholar] [CrossRef] [PubMed]
  54. Durand, A.; Maillard, F.; Alvarez-Lopez, V.; Guinchard, S.; Bertheau, C.; Valot, B.; Blaudez, D.; Chalot, M. Bacterial diversity associated with poplar trees grown on a Hg-contaminated site: Community characterization and isolation of Hg-resistant plant growth promoting bacteria. Sci. Total Environ. 2018, 622, 1165–1177. [Google Scholar] [CrossRef] [PubMed] [Green Version]
  55. Thapa, S.; Prasanna, R. Prospecting the characteristics and significance of the phyllosphere microbiome. Ann. Microbiol. 2018, 68, 229–245. [Google Scholar] [CrossRef]
  56. Kembel, S.W.; O’Connor, T.K.; Arnold, H.K.; Hubbell, S.P.; Wright, S.J.; Green, J.L. Relationships between phyllosphere bacterial communities and plant functional traits in a neotropical forest. Proc. Natl. Acad. Sci. USA 2014, 111, 13715–13720. [Google Scholar] [CrossRef] [PubMed] [Green Version]
  57. Imperato, V.; Kowalkowski, L.; Portillo-Estrada, M.; Gawronski, S.W.; Vangronsveld, J.; Thijs, S. Characterisation of the Carpinus betulus L. phyllomicrobiome in urban and forest areas. Front. Microbiol. 2019, 10, 1110. [Google Scholar] [CrossRef] [Green Version]
  58. Stark, M.; Berger, S.A.; Stamatakis, A.; von Mering, C. MLTreeMap-accurate Maximum Likelihood placement of environmental DNA sequences into taxonomic and functional reference phylogenies. BMC Genom. 2010, 11, 461. [Google Scholar] [CrossRef] [Green Version]
  59. Knief, C.; Ramette, A.; Frances, L.; Alonso-Blanco, C.; Vorholt, J.A. Site and plant species are important determinants of the Methylobacterium community composition in the plant phyllosphere. ISME J. 2010, 4, 719–728. [Google Scholar] [CrossRef] [Green Version]
  60. Redford, A.J.; Bowers, R.M.; Knight, R.; Linhart, Y.; Fierer, N. The ecology of the phyllosphere: Geographic and phylogenetic variability in the distribution of bacteria on tree leaves. Environ. Microbiol. 2010, 12, 2885–2893. [Google Scholar] [CrossRef] [Green Version]
  61. Laforest-Lapointe, I.; Messier, C.; Kembel, S.W. Host species identity, site and time drive temperate tree phyllosphere bacterial community structure. Microbiome 2016, 4, 27. [Google Scholar] [CrossRef] [Green Version]
  62. Jacobs, J.L.; Carroll, T.L.; Sundin, G.W. The role of pigmentation, ultraviolet radiation tolerance, and leaf colonization strategies in the epiphytic survival of phyllosphere bacteria. Microb. Ecol. 2005, 49, 104–113. [Google Scholar] [CrossRef]
  63. Gunasekera, T.S.; Sundin, G.W. Role of nucleotide excision repair and photoreactivation in the solar UVB radiation survival of Pseudomonas syringae pv. syringae B728a. J. Appl. Microbiol. 2006, 100, 1073–1083. [Google Scholar] [CrossRef] [PubMed]
  64. Schlechter, R.O.; Miebach, M.; Remus-Emsermann, M.N.P. Driving factors of epiphytic bacterial communities: A review. J. Adv. Res. 2019, 19, 57–65. [Google Scholar] [CrossRef] [PubMed]
  65. Wilson, M.; Lindow, S.E. Coexistence among epiphytic bacterial populations mediated through nutritional resource partitioning. Appl. Envrion. Microbiol. 1994, 60, 4468–4477. [Google Scholar] [CrossRef] [PubMed] [Green Version]
  66. Mercier, J.; Lindow, S.E. Role of leaf surface sugars in colonization of plants by bacterial epiphytes. Appl. Environ. Microbiol. 2000, 66, 369–374. [Google Scholar] [CrossRef] [PubMed] [Green Version]
  67. Leveau, J.H.J.; Lindow, S.E. Appetite of an epiphyte: Quantitative monitoring of bacterial sugar consumption in the phyllosphere. Proc. Natl. Acad. Sci. USA 2001, 98, 3446–3453. [Google Scholar] [CrossRef] [Green Version]
  68. Yamada, K.; Saijo, Y.; Nakagami, H.; Takano, Y. Regulation of sugar transporter activity for antibacterial defense in Arabidopsis. Science 2016, 354, 1427–1430. [Google Scholar] [CrossRef] [Green Version]
  69. Chen, L.Q.; Hou, B.H.; Lalonde, S.; Takanaga, H.; Hartung, M.L.; Qu, X.Q.; Guo, W.J.; Kim, J.G.; Underwood, W.; Chaudhuri, B.; et al. Sugar transporters for intercellular exchange and nutrition of pathogens. Nature 2010, 468, 527–532. [Google Scholar] [CrossRef] [Green Version]
  70. Atamna-Ismaeel, N.; Finkel, O.; Glaser, F.; von Mering, C.; Vorholt, J.A.; Koblížek, M.; Belkin, S.; Béjà, O. Bacterial anoxygenic photosynthesis on plant leaf surfaces. Environ. Microbiol. Rep. 2012, 4, 209–216. [Google Scholar] [CrossRef]
  71. Kiraly, Z.; El-Zahaby, H.M.; Klement, Z. Role of extracellular polysaccharide (EPS) slime in plant pathogenic bacteria in protecting cells to reactive oxygen species. J. Phytopathol. 1997, 145, 59–68. [Google Scholar] [CrossRef]
  72. Kim, Y.C.; Leveau, J.; Gardener, B.B.M.; Pierson, E.; Pierson, L.S.; Ryu, C.M. The multifactorial basis for plant health promotion by plant-associated bacteria. Appl. Environ. Microbiol. 2011, 77, 1548–1555. [Google Scholar] [CrossRef] [Green Version]
  73. Spaepen, S.; Vanderleyden, J.; Remans, R. Indole-3-acetic acid in microbial and microorganism-plant signaling. FEMS Microbiol. Rev. 2007, 31, 425–448. [Google Scholar] [CrossRef] [PubMed] [Green Version]
  74. Melotto, M.; Underwood, W.; Koczan, J.; Nomura, K.; He, S.Y. Plant stomata function in innate immunity against bacterial invasion. Cell 2006, 126, 969–980. [Google Scholar] [CrossRef] [PubMed] [Green Version]
  75. Schellenberg, B.; Ramel, C.; Dudler, R. Pseudomonas syringae virulence factor syringolin A counteracts stomatal immunity by proteasome inhibition. Mol. Plant Microbe Interact. 2010, 23, 1287–1293. [Google Scholar] [CrossRef] [PubMed] [Green Version]
  76. Hirano, S.S.; Upper, C.D. Bacteria in the leaf ecosystem with emphasis on Pseudomonas syringae—A pathogen, ice nucleus, and epiphyte. Microbiol. Mol. Biol. Rev. 2000, 64, 624–653. [Google Scholar] [CrossRef] [Green Version]
  77. Xiong, C.; Zhu, Y.G.; Wang, J.T.; Singh, B.K.; Han, L.L.; Shen, J.P.; Li, P.P.; Wang, G.B.; Wu, C.F.; Ge, A.H.; et al. Host selection shapes crop microbiome assembly and network complexity. New Phytol. 2021, 229, 1091–1104. [Google Scholar] [CrossRef]
Figure 1. The relative abundance of dominant bacterial phyla in the phyllosphere microbiota was assessed across two O3 levels and three concentrations of N addition. Relative abundance was determined based on proportional frequencies as a fraction of all DNA sequences that were successfully classified at the phylum level. CF, charcoal-filtered ambient air; E-O3, non-filtered ambient air + 40 ppb O3; N0, no supplemental N addition; N50, 50 kg supplemental N ha−1 year−1, and N100, 100 kg supplemental N ha−1 year−1.
Forests 14 00452 g001
Figure 2. Significant shifts in the dominant bacterial genera present in the phyllosphere microbiome in response to increased O3 and (a) N50 and (b) N100 levels were assessed using response ratios (%) and analyzed at 95% confidence intervals (CIs). When the 95% CI range included zero, that particular genus was unaffected by these conditions, whereas significant positive or negative effects were denoted by a 95% CI range above or below zero, respectively.
Forests 14 00452 g002
Figure 3. The impact of O3 (CF and E-O3) and N (N0, N50, and N100) on the α-diversity of phyllosphere bacterial communities was examined based on (a) nonparametric estimates of the number of classes in this population (Chao1 index), (b) phylogenetic diversity (PD whole tree), and (c) the number of unique observed OTUs. These three diversity indices were calculated based on 3500 randomly selected sequences per sample and are reported as the mean with the standard deviation. Letters above error bars denote significant differences among treatments (Tukey’s HSD post hoc test, p < 0.05, N = 3). Bold uppercase letters above N groups further denote significant differences among N treatments when O3 treatments were pooled.
Forests 14 00452 g003
Figure 4. Non-metric multidimensional scaling (NMDS) analyses of phyllosphere bacterial community distributions across O3 (CF and E-O3) and N (N0, N50, and N100) treatments based upon Bray–Curtis distances. p-values correspond to significant differences as determined according to the dissimilarity observed among groups (Table S1), with p < 0.05 as the significance threshold.
Forests 14 00452 g004
Figure 5. The association between the light-saturated photosynthetic rate (Asat) and (a) phyllosphere bacterial α-diversity indices (Chao1, PD, and OTUs) or (b) the relative abundance of Gammaproteobacteria and Betaproteobacteria. Regression lines are shown in cases where a significant linear correlation was evident for pooled data from all O3 and N treatment conditions when ANCOVAs for different treatments yielded non-significant results (p > 0.05).
Forests 14 00452 g005
Table 1. (a) Partial Mantel test correlation coefficients (r) and significance values (P) for comparing the composition of the phyllosphere bacterial community and plant-specific parameters. (b) A DistLM analysis-based determination of plant-specific parameters that independently account for a significant proportion of the overall variance in the makeup of the phyllosphere bacterial community. Asat, light-saturated photosynthetic rate; gs, stomatal conductance; Ci, intercellular CO2 concentration; Chl, chlorophyll (a + b) content; ISO, isoprene emission rate; Fv’/Fm’, the excitation energy capture efficiency of the PSII reaction center; qP, the coefficient of photochemical quenching; Vcmax, the maximum of carboxylation efficiency; Jmax, the maximum of electron transport. SS, the sum of squares; %Var: percentage variance explained by that variable; Cum.%, the cumulative percentage of variance explained.
Variable(a) Partial Mantal Test(b) DistLM
rPSSFP% VarCum. (%)
Asat0.190.0244853.42.660.03914.2714.27
gs−0.140.677647.50.300.9141.9016.17
Ci0.090.117586.20.230.9521.7217.89
Chl−0.030.586495.20.210.9691.4619.35
ISO−0.170.1041897.31.040.3605.5824.93
Fv’/Fm’−0.140.610626.50.200.9451.8426.77
qP−0.100.8381135.90.610.6433.3430.11
Vcmax−0.020.817534.30.260.9361.5731.68
Jmax−0.030.568894.70.460.7692.6334.31
Biomass−0.090.776500.60.180.9601.4735.78
Disclaimer/Publisher’s Note: The statements, opinions and data contained in all publications are solely those of the individual author(s) and contributor(s) and not of MDPI and/or the editor(s). MDPI and/or the editor(s) disclaim responsibility for any injury to people or property resulting from any ideas, methods, instructions or products referred to in the content.

