Article

Escape Game: Responses of Northern White Cedar (Thuja occidentalis L.) to an Extreme Reduction in White-Tailed Deer (Odocoileus virginianus Zimmerman) Population

by
Frédéric Poirier
1,
Jean-Pierre Tremblay
2,
Olivier Villemaire-Côté
1 and
Jean-Claude Ruel
1,*
1
Department of Wood and Forest Sciences, Laval University, Québec, QC G1V 0A6, Canada
2
Department of Biology, Laval University, Québec, QC G1V 0A6, Canada
*
Author to whom correspondence should be addressed.
Forests 2023, 14(3), 455; https://doi.org/10.3390/f14030455
Submission received: 18 January 2023 / Revised: 13 February 2023 / Accepted: 15 February 2023 / Published: 22 February 2023
(This article belongs to the Special Issue Interactions between Ungulates and Forest Ecosystems)

Abstract

:
Northern white cedar (Thuja occidentalis L.) is a species of high ecological and economic value whose abundance has been declining since the pre-industrial period. It is an important element of white-tailed deer (Odocoileus virginianus Zimmerman) habitat, but its regeneration can be compromised by excessive browsing. This situation is especially critical in deeryards, where deer concentrate during winter. In 2018 and 2019, deer culling operations were carried out by the Ministry of Forests, Wildlife and Parks of Québec over 400 km2 in response to the occurrence of chronic wasting disease cases on a red deer farm. This operation offered an opportunity to look at how variations in deer pressure influence cedar regeneration and how cedar responds to a sudden reduction in browsing. We conducted regeneration surveys within and outside mapped deeryards both in the deer reduction zone and in a control zone. We performed dendrochronological analyses of cedar seedlings and saplings to quantify radial growth response to a reduction in browsing pressure. The results show that cedar basal area influences the abundance of small seedlings but that the effect of browsing becomes dominant for seedlings taller than 50 cm. Cedar growth responds to a reduction in browsing, but a two-year period was not sufficient to translate into changes in regeneration structure. The duration of the windows of opportunity at low browsing pressure required for cedar to reach a safe height remains to be determined. However, canopy openness had a significant influence on growth, suggesting that silvicultural measures could be taken to shorten the period of vulnerability to deer browsing.

1. Introduction

Northern white cedar (Thuja occidentalis L., hereafter cedar) is a species of high economic value occupying a set of niche markets [1]. It is a shade-tolerant species that can be present in a wide range of sites but is often dominant in extreme sites where competition by other species is limited [2]. Cedar regeneration can establish as seedlings or layers in the understory. It can survive with slow growth under low light levels and gain access to the main canopy when short-lived species die or partial canopy disturbance occurs [1]. Sapling growth can respond vigorously to increases in light levels [3,4]. Cedar has also shown a potential for compensatory growth after clipping, in contrast with many other softwood species [5,6].
For several decades, a decrease in cedar abundance has been observed over a large part of its range, compromising both economic and ecological benefits [5,7,8,9,10]. This decline has been associated with a lack of recruitment, in large part due to browsing by white-tailed deer (Odocoileus virginianus Zimmerman, hereafter deer) [5,11]. This issue has become more prevalent after the 1960s, when deer populations increased rapidly across eastern North America [12]. Selective browsing by ungulates can limit the diversity and heterogeneity of vegetation communities. In some cases, intensive browsing can lead to the establishment of a recalcitrant understory layer or to the development of alternative successional trajectories [13,14,15]. However, the potential for cedar compensatory growth could make deer–cedar interactions different from other plant–herbivore interactions.
Deer can browse seedling, saplings and tree branches up to a height of approximately 2 m [1]. In the shaded environment where cedar regeneration often develops, it could take up to 50 years to reach that height [5,9]. Deer impacts would be especially important in winter deeryards where cedar is used by deer as shelter and food source [5,16,17]. During winter, food sources for deer become limited and cedar becomes one of the best available sources [16,18]. Seedlings would remain partially protected by snow until they become apparent above the snow cover and accessible to deer. This has been suggested by the many studies that found a reduction in the abundance of cedar seedlings > 15 cm under high browsing pressure [5,19,20,21]. Cedar regeneration can be favored by natural gap formation [22] or by partial cuts [23]. However, this regeneration is likely to fail under high deer pressure [22,24]. Deer control measures would then be needed to enable cedar regeneration to escape deer reach, but we do not know how fast cedar can respond to a reduction in browsing pressure in natural conditions. In contrast with the slow growth in the understory, a height of 3 m has been reached in some plantations in as little as 9 years, leaving a third of tree height out of reach for deer [25].
In September 2018, 11 cases of chronic wasting disease (CWD) were found in a red deer (Cervus elaphus Linnaeus) farm in western Québec [26]. To prevent the spreading of the disease, the Ministry of Forests, Wildlife and Parks of Québec started a culling operation over a controlled intervention area covering 400 km2 around the deer farm. The operation was conducted by professionals, leading to the culling of 750 deer including 534 adults [26]. This is 7.65 times the 2017 harvest from sport hunting for this zone [27]. The following year, the controlled intervention area was integrated into an enhanced surveillance zone of 2200 km2, where hunting regulations were adjusted to maintain a higher pressure than usual on deer populations. At the completion of the 2019 hunting season, 1368 deer were harvested in the enhanced surveillance zone [28], a harvest 2.5 times higher than the 2017 hunting season [29]. This sudden reduction in browsing pressure could offer an opportunity for cedar regeneration to respond and eventually recruit to larger sizes.
A culling operation at this scale could hardly be conducted solely for research. We then took advantage of this situation to look at how cedar responds to such an extreme reduction in browsing pressure over a wide territory. Specific objectives were to: (1) characterize spatial variations in deer browsing pressure; (2) quantify the growth response of cedar to the reduction in browsing pressure; and (3) determine the effect of deer pressure and its reduction on the abundance and structure of cedar regeneration.

2. Materials and Methods

2.1. Study Sites

We conducted the study in southwestern Québec, Canada (45°43–46°07′ N, 74°38′–75°29′ W; Figure 1). The study area falls within the western sugar maple–yellow birch bioclimatic sub-domain (Sugar maple: Acer saccharum Marsh.; yellow birch: Betula alleghaniensis Britton; ecological region 3b). The mean temperature for this region varies between 2.5 and 5 °C and annual precipitations range from 900 to 1100 mm, a quarter of this total falling as snow [30].
The sampling for this study was conducted in 2020, during the second growing season after the start of the culling operation. We selected stands at least 70 years old with no silvicultural treatment over the previous 20 years, as identified from forest cover maps, distributed within or outside mapped deeryards. The study area covered two administrative regions where available forest cover maps differed. Therefore, we applied minimum cedar basal area thresholds accordingly, selecting stands with >10% basal area in cedar for the western part, and >25% for the eastern part [31].
To control for pre-treatment deer browsing pressure, the treated and the control zones had comparable deer harvest and vehicle collision numbers before the culling operation. The treated zone included the initial controlled intervention area, integrated later into the enhanced surveillance zone. The control zone was located outside the zone impacted by the deer population control measures but still within the same ecological sub-domain (Figure 1).
Given the limitations of maps derived from photointerpretation and some access limitations, the final choice of stands was made after field validation and additional prospection directly in the field. A total of 33 stands were retained, 16 within the treated zone (10 in mapped deeryards [32], 6 outside deeryards) and 17 in the control zone (9 in deeryards, 8 outside deeryards). A random point was placed in the selected stands. It was retained as plot centre if two merchantable cedar trees (diameter at breast height (DBH) ≥ 9.1 cm) were present in a 11.28 m radius and if the stand was sufficiently large to establish a 45 m transect for regeneration survey. When these conditions were not met, the closest portion of the stand where cedar was present was identified and a random point was selected in that direction, with a minimum distance of 50 m from the initial point. The procedure was repeated until the conditions were met.
The main canopy species were northern white cedar, balsam fir (Abies balsamea [L.] Mill.), red maple (Acer rubrum L.), sugar maple and yellow birch. The shrub layer was mainly composed of mountain maple (Acer spicatum Lam.), speckled alder (Alnus incana rugosa DuRoi), beaked hazelnut (Corylus cornuta Marshall) and hobblebush (Viburnum lantanoides Michx.).

2.2. Sampling Methods

On each site, merchantable trees were tallied by species in a randomly located 400 m2 circular plot. Saplings (1.1 ≤ DBH < 9.1 cm) were tallied in a 100 m2 plot centered within the larger plot. Regeneration from ligneous species was inventoried in 10 circular microplots (4 m2), centered every 5 m along a north–south transect. This meant that some microplots were outside the 400 m2 circular plot but still within the same stand. Seedlings were counted by height class (5–15 cm, 16–30 cm, 31–60 cm, 61–100 cm, 101–200 cm, 201 cm up to 1 cm DBH), except for cedar, for which height was measured for seedlings taller than 5 cm.
To characterize the browsing pressure at each site, we used the growth forms proposed by Keigley [33]. Growth forms were chosen as a browsing pressure proxy because no single species was present in sufficient numbers across sites to calculate an index based on the proportion of browsed twigs. The selected approach uses four growth forms that ligneous species can develop depending on historical browsing pressure (Table 1). They enable contrasting the normal seedling development in a low browsing pressure context to forms that develop when seedlings are heavily browsed at different stages of development. Individuals of ligneous species having the potential to reach a height of 2.5 m were characterized for growth forms in three 100 m2 plots centered on microplots at each end and in the middle of the transect.
To analyze the potential radial growth response to the deer control treatment, the tallest cedar between 15 and 200 cm located within 5 m from each microplot center was collected. This range of height was selected to focus on individuals that would be accessible for winter browsing and could, therefore, benefit from reductions in deer browsing pressure. For each of these, total height, root collar diameter, growth form and current year height growth were determined. Yearly growth was not completed at the time of measurement, but all measurements were taken over 9 days during the second half of August, so a potential effect of time of measurement was deemed inconsequential. For each seedling, a hemispherical photograph was taken at 1.3 m height with a camera equipped with a fisheye lens (Nikon Coolpix 950 with fisheye converter FC-E8). These photographs were then analyzed to derive percent canopy openness [34]. Root collar radial growth was measured within 0.02µm using a Velmex micrometer and compiled with Dendro2019 software [35].

2.3. Statistical Analyses

A principal component analysis (PCA) using growth forms was conducted to derive an index of browsing pressure. The frequency of the various types was compiled at the stand level and converted into relative frequency. Frequencies were then transformed as logit log p 1 p   to linearize values and increase the precision around values of 0 or 1 [36]. The analysis was conducted on the correlation matrix of input variables, as suggested by Jolliffe and Cadima [37]. The evaluation of component significance used the randomization of eigenvalues [38]. We extracted the weights associated with each variable and calculated the proportion of the variance explained for each of the principal components. The score of each site on the first principal component (PC1) was extracted to produce a new variable corresponding to an index of the browsing pressure.
Larouche and Ruel [20] observed that deer pressure had no impact on the abundance of regeneration smaller than 15 cm but was determinant for the abundance of regeneration taller than 60 cm. Therefore, we tested the effect of the deer control treatment for three height classes: 5–15 cm, taller than 15 cm and taller than 50 cm. Generalized linear mixed models of seedling abundance at the microplot level were built for each height class using a negative binomial distribution. Fixed variables included the location of the site within or outside the treated zone, the natural logarithm of cedar basal area (m2/ha), the location of the site within or outside a deeryard and the index of browsing pressure. Site was included as a random effect.
The before–after control–impact (BACI) [39,40] approach was selected to evaluate the impact of the deer control treatment on cedar radial growth. Following this approach, two additional binary variables were added to the dataset: a BA variable and a CI variable. The BA identified years before (before) or after (after) the year of the deer culling operation, whereas the CI identified sites that were either in the control zone (control) or the treated zone (impact). The BA*CI interaction was included in a linear mixed model (LMM) with the natural logarithm of annual radial growth (µm) as the dependent variable. Growth from 2014 to 2018 was used for the period before the intervention and 2019 to 2020 for growth after the intervention. Canopy openness, browsing index and root collar diameter (mm) were used as fixed effects and seedling ID nested within site was included as a random effect. In order to see how a diameter growth response would translate into a height growth response, a linear mixed model relating current diameter and height growth was calculated.
All statistical analysis was conducted in R v4.1.3 [41]. The PCA and the selection of significant components used the Stats package [41]. GLMMs were generated with the lme4 package [42]. Model assumptions were checked with the DHARMa package [43]. Collinearity was analyzed with the performance package [44] using a variance inflation factor threshold of 3 [45]. Results are presented as means with their standard deviations (SD), except for cedar abundance by site, for which the mean is shown with its 95% confidence interval calculated with an accelerated bootstrap method with bias (BCa) [46]. The package emmeans [47] was used to calculate the estimated marginal means (least-squares means) of annual radial growth for periods and zones.

3. Results

3.1. Characterization of Browsing Pressure

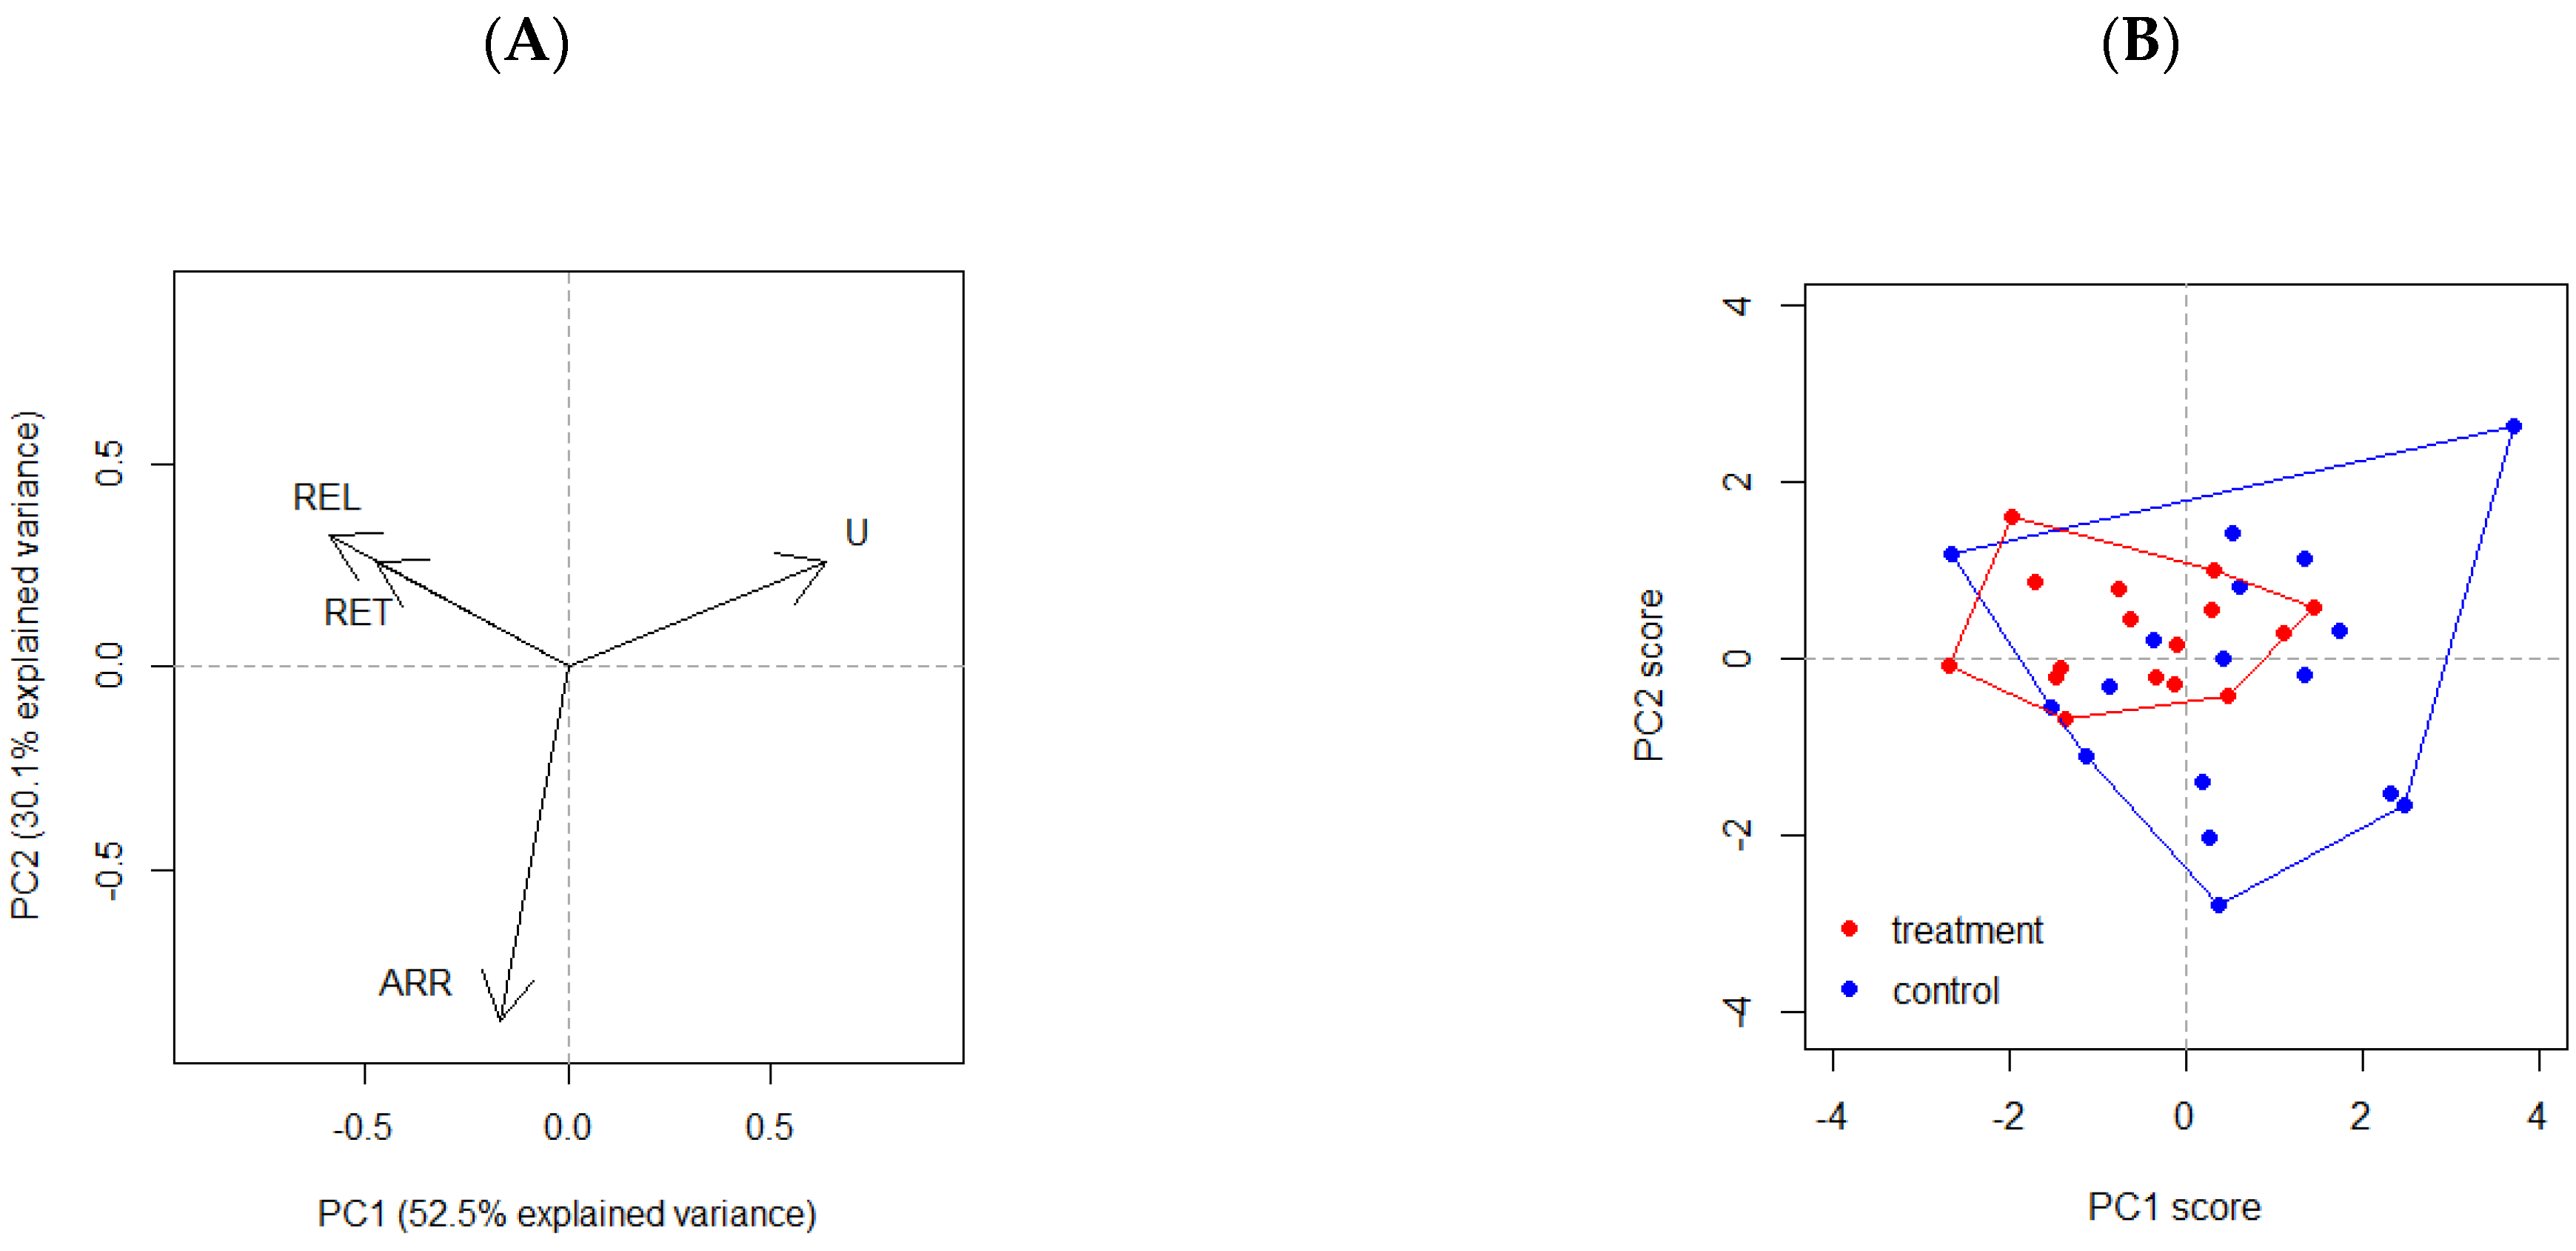
The dimensionality of the variables associated with browsing was reduced using principal component analysis (PCA). The weights associated with each variable and the proportion of the variance explained for each of the principal components are presented in Table 2. According to the eigenvalue randomization method [38], only the first PCA component was significant. The score of each site for this component (PC1) was used to describe the browsing pressure at each site in the rest of the analysis. To facilitate the presentation of the weights (loadings) of the variables for PC1, we nevertheless present he eigenvectors of the first two principal components in a biplot (Figure 2A). The released, retrogressed and arrested growth forms had negative scores and differed from the uninterrupted growth form, which was the only variable with a positive score. Sites with large proportions of altered forms therefore had negative scores, while sites with a high proportion of normal individuals had positive scores. The mean score for the treated sites was −0.55 ± 1.2, while it was 0.52 ± 1.6 (t[22.29] = −2.23, p = 0.033) for the control sites. The control sector had a greater range of scores than the treated sector, with a few sites having scores of more than 2 (Figure 2B).

3.2. Radial Growth of Cedar Seedlings

Using dendrochronological analyses, the radial growth at root collar of 306 seedlings was measured retroactively from 2020 to their first year of growth. Of these, 154 seedlings had their first year of growth before 2010, including 56 before 2000 and 6 before 1980. However, since some sites had no or very few seedlings aged at least one year before 2014, 2014 was considered as the first year of the pre-intervention period (B) in the BACI design. At that time, there were 288 seedlings spread across the 33 sites and it is only from 2017 that 306 seedlings are included in the analysis. For the pre-intervention period (B) from 2014 to 2018, 1507 growth rings are included in the analysis and for the post-intervention period (A) from 2019 to 2020, 612 growth rings are included. There were 145 seedlings from the control sector (C) for a total of 1010 growth rings and 161 seedlings from the treated sector (I) for a total of 1109 growth rings.
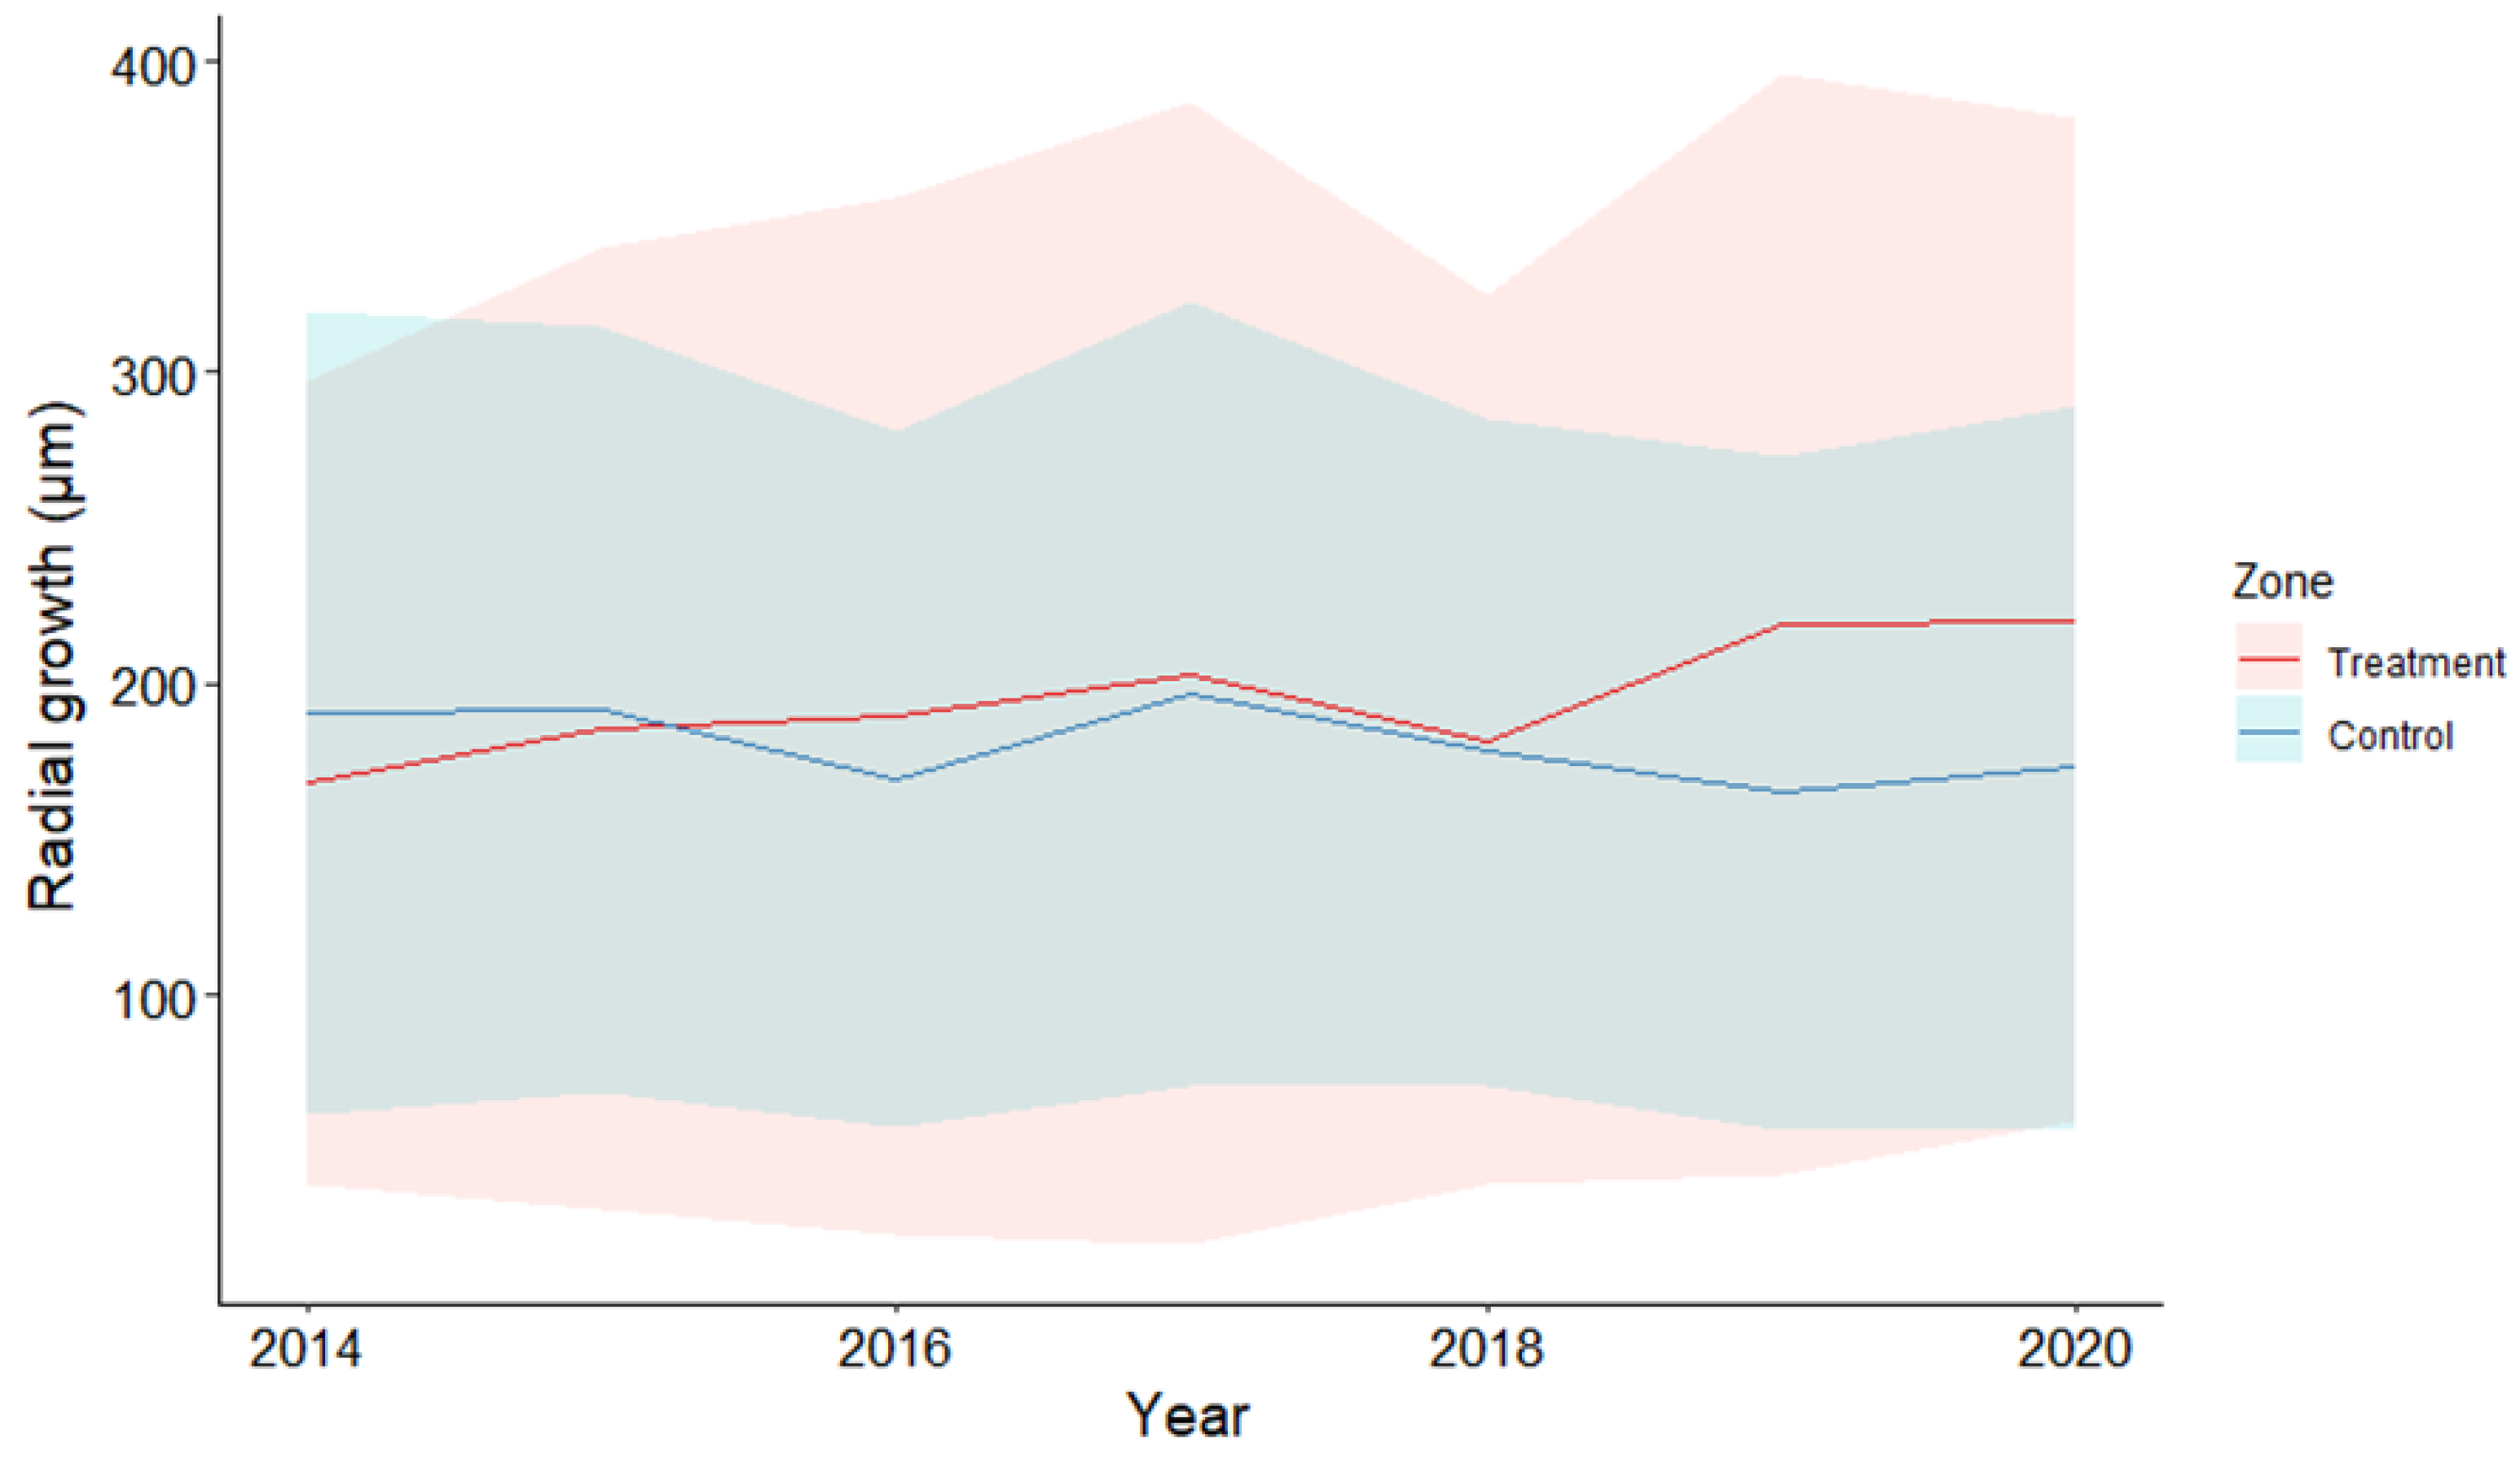
From 2014 to 2018, the average annual radial growth was quite similar between the treated and control sectors, with slight annual variations. Both sectors had the best pre-intervention growth in 2017, followed by a decline in 2018. However, for the post-intervention period from 2019 to 2020, the growth of the treated sector appears to have increased, while the growth of the control sector appears to have remained stable (Figure 3).
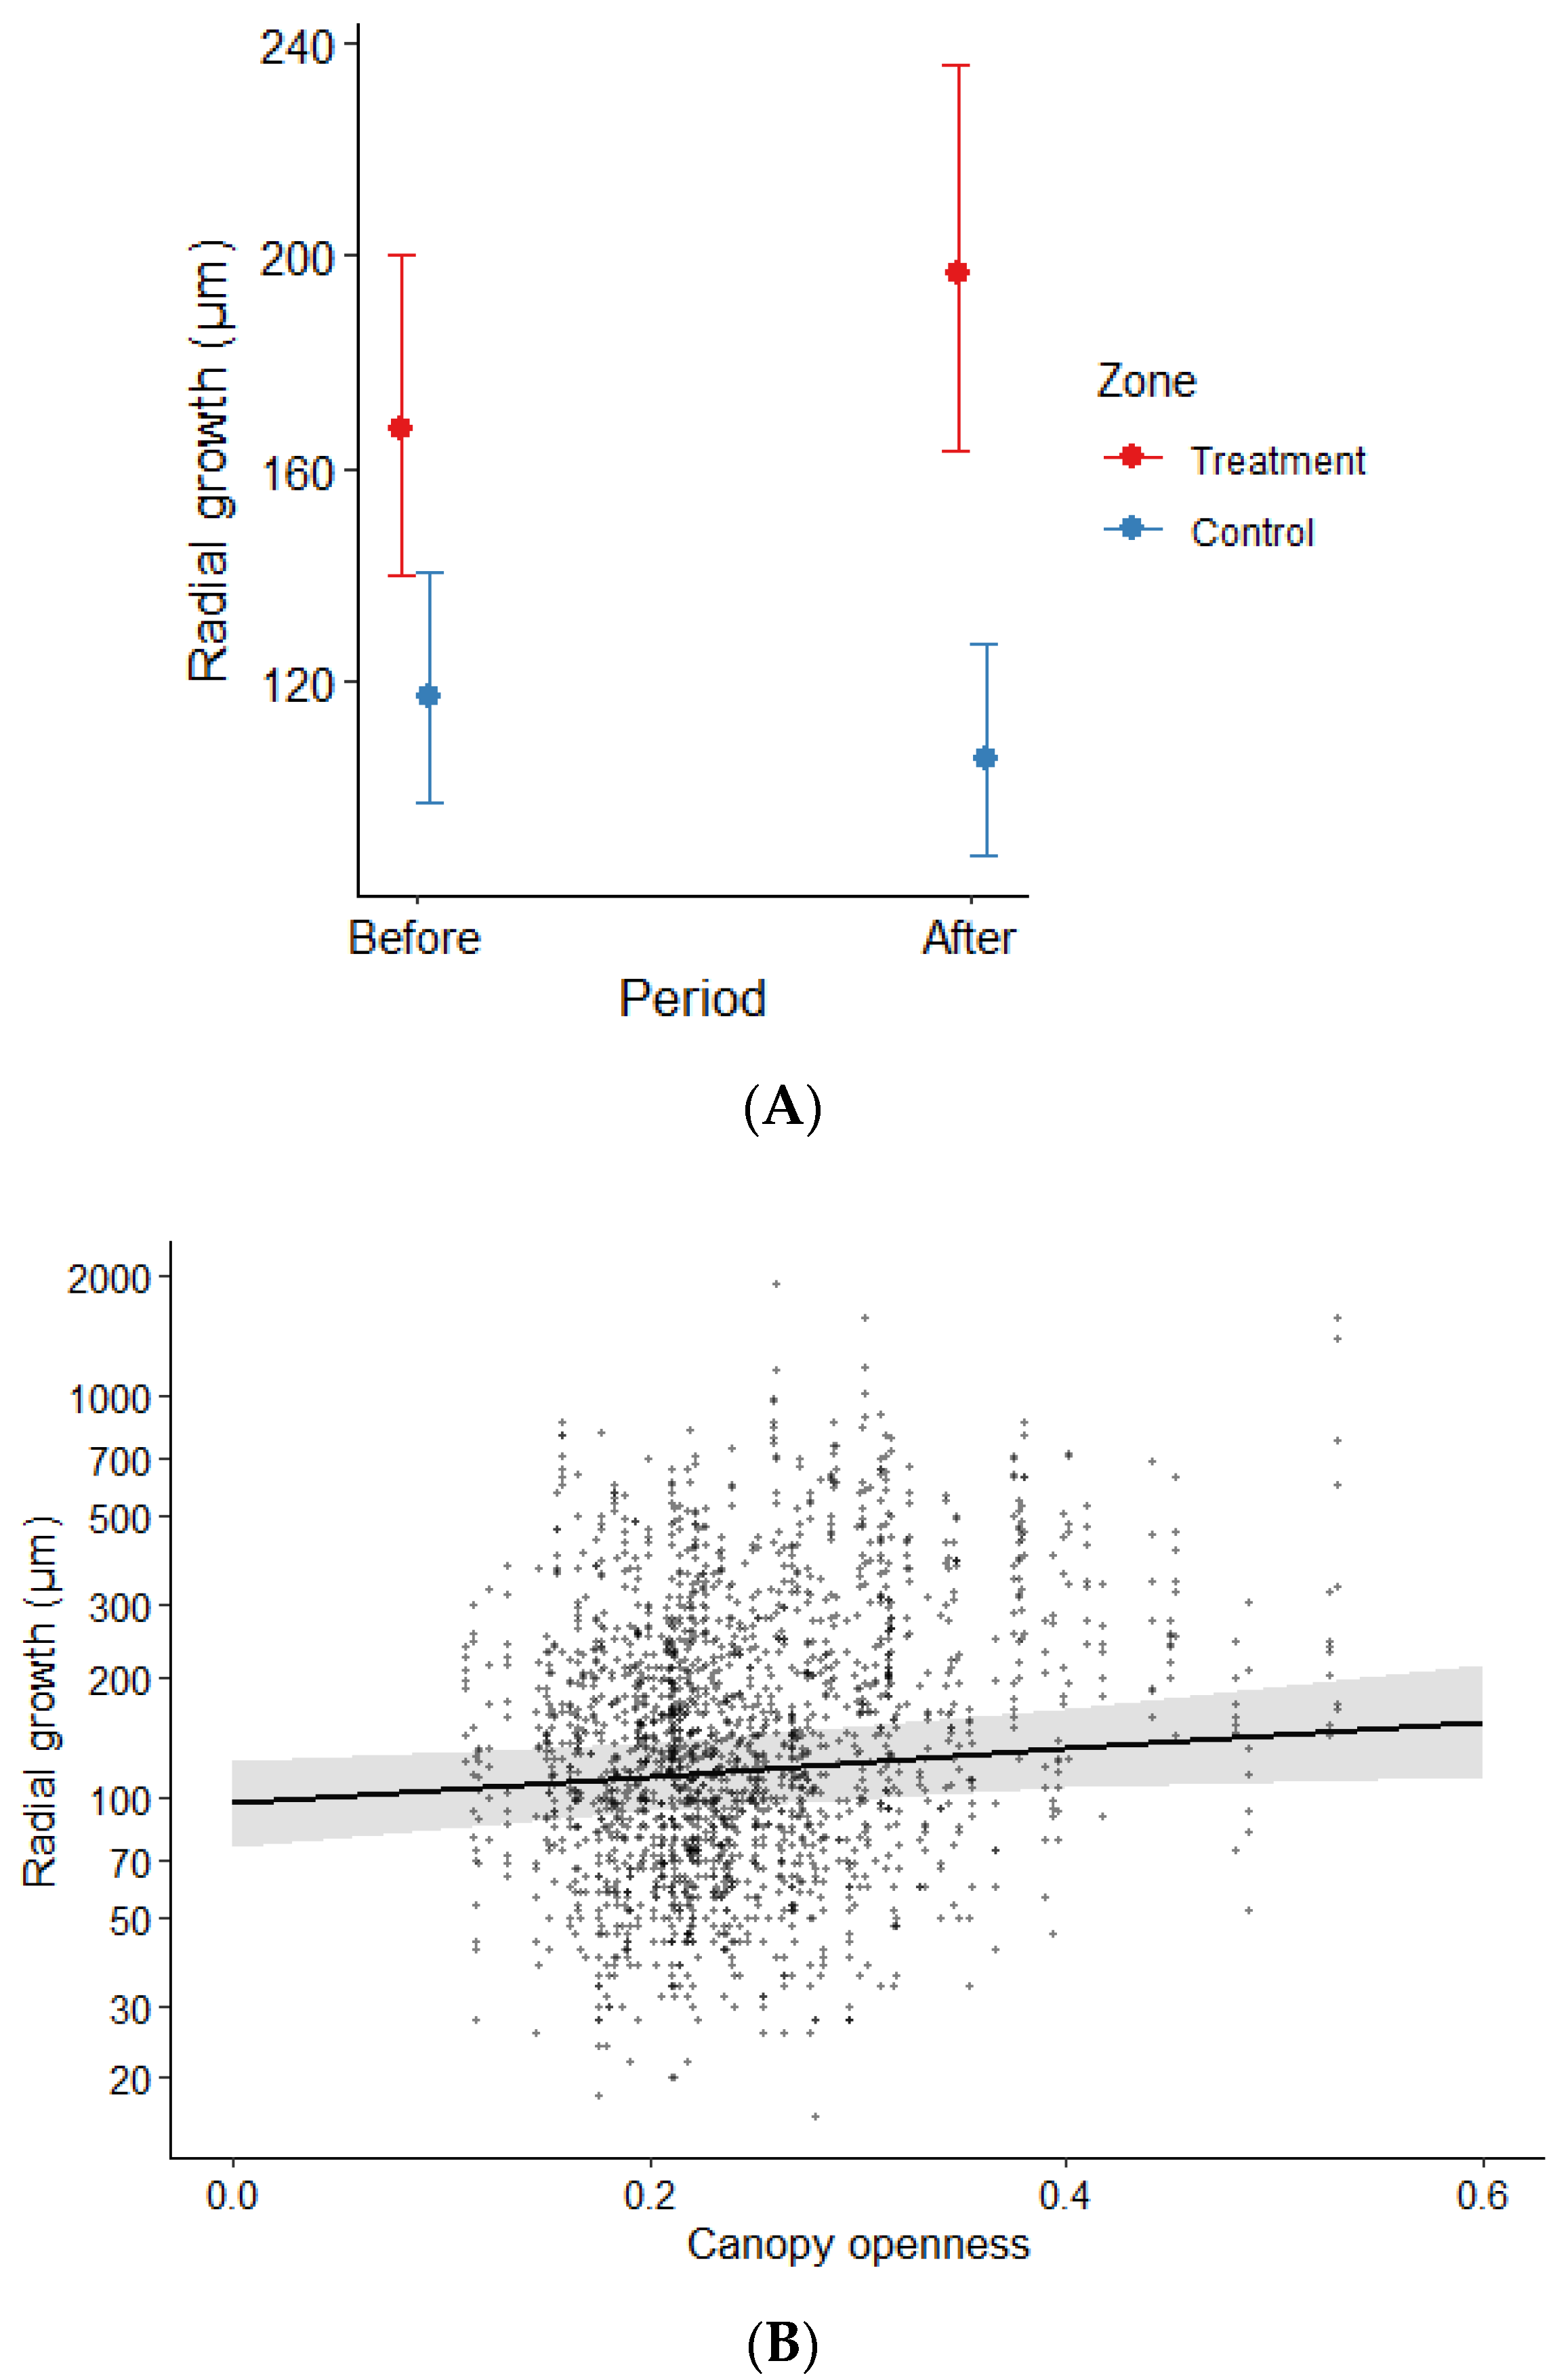
The annual radial growth model showed that all parameters had a positive effect on growth, except for the browsing index (PC1), for which no effect was detected (Table 3). The interaction between period and sector showed a positive effect of the deer control treatment (Figure 4A). The predicted radial increment before culling operations was 117.1 μm ± 10.9 for the control sector, while it was 167.3 μm ± 15.3 for the treated area. After the start of the treatment, the average increment was 105.7 μm ± 10.1 for the control sector and 196.4 μm ± 18.3 for the treated sector. Canopy openness also had a positive effect on radial growth. For all the seedlings studied, the average canopy openness was 24.5%, with a range of values from 11.2 to 52.9% (Figure 4B). Using current growth data in a mixed model with the collar diameter as a covariate, we found a significant relationship between radial growth and height growth (conditional R2 = 0.371; marginal R2 = 0.142).

3.3. Abundance of Cedar Regeneration

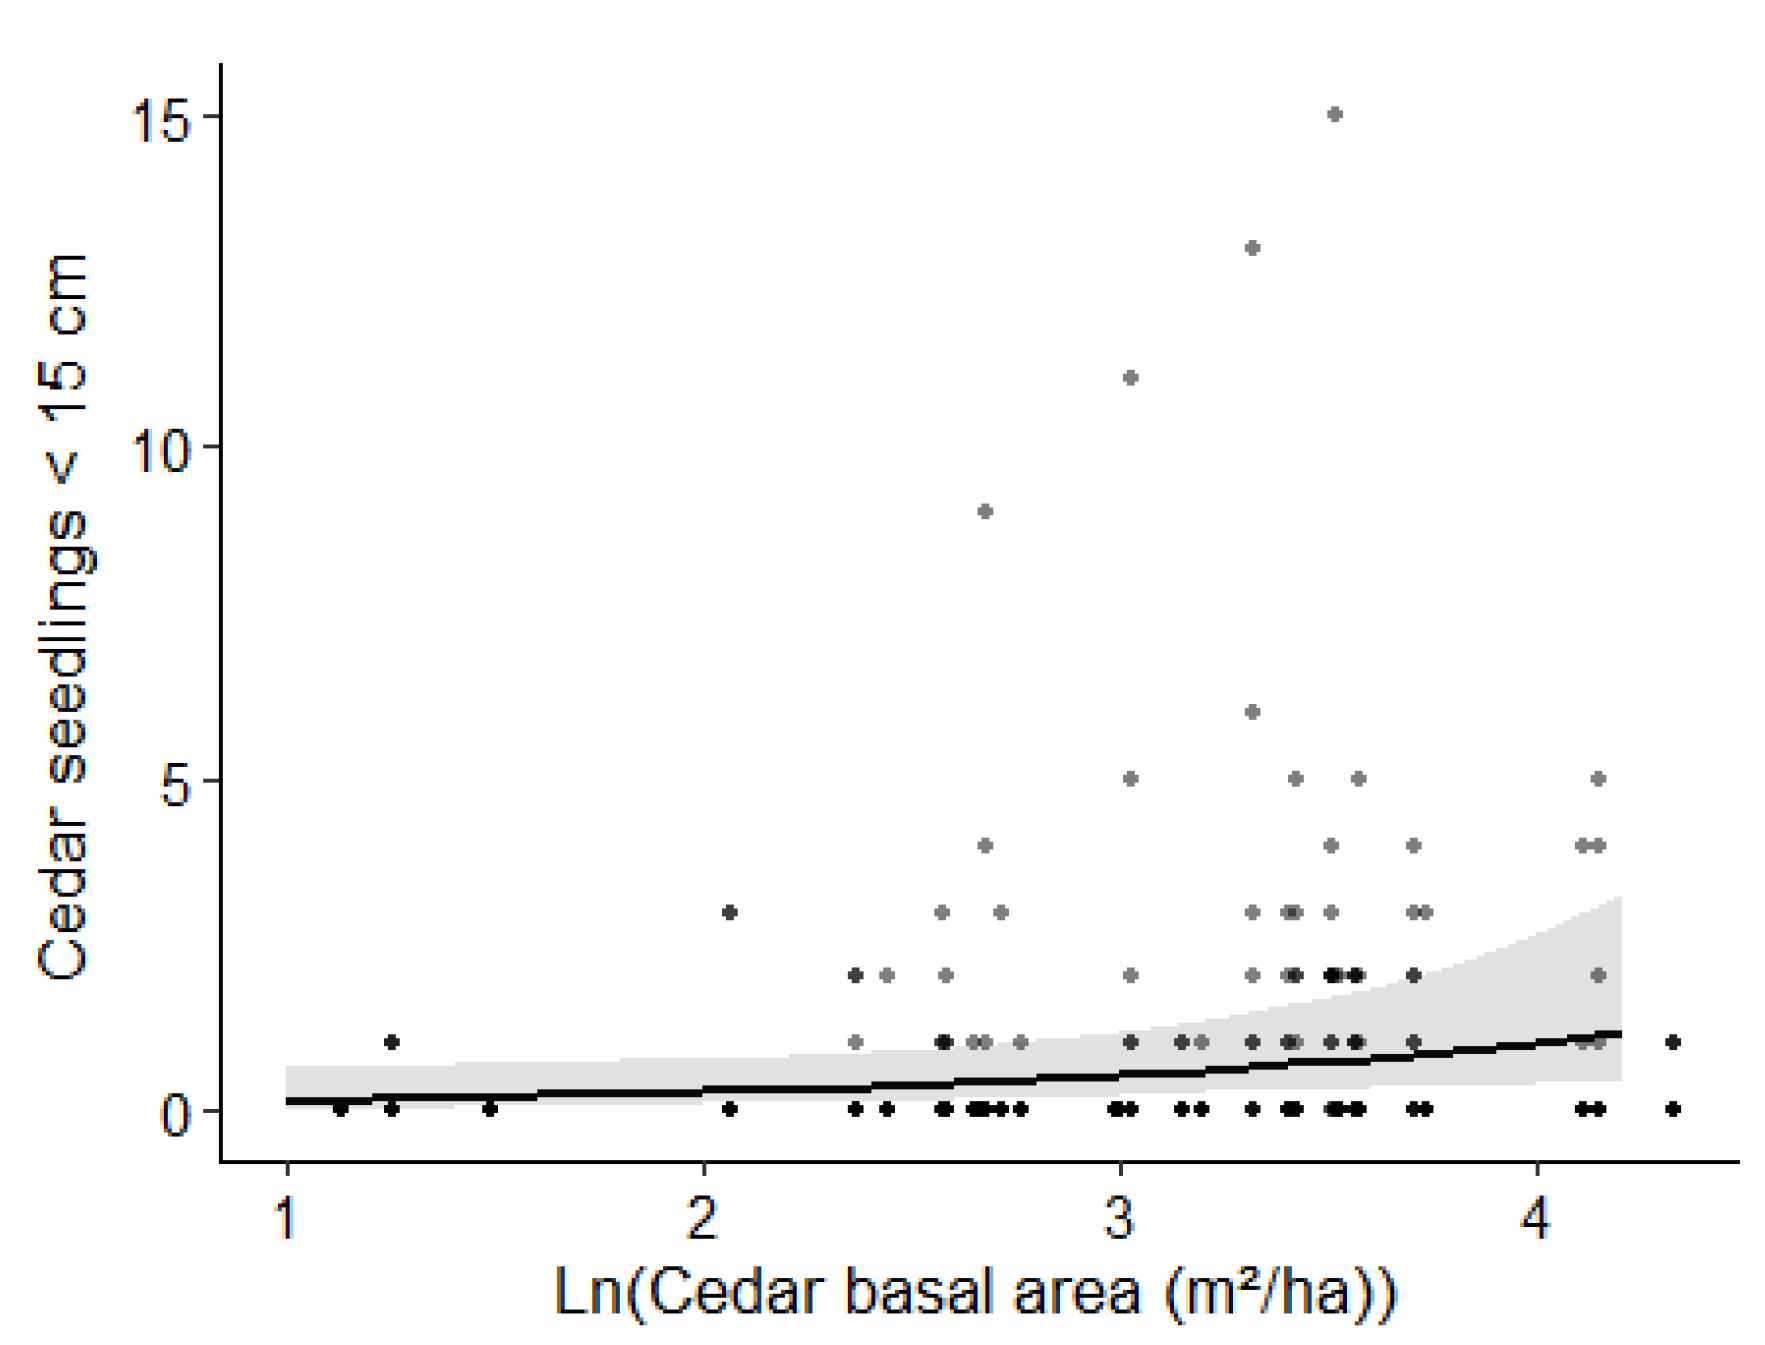
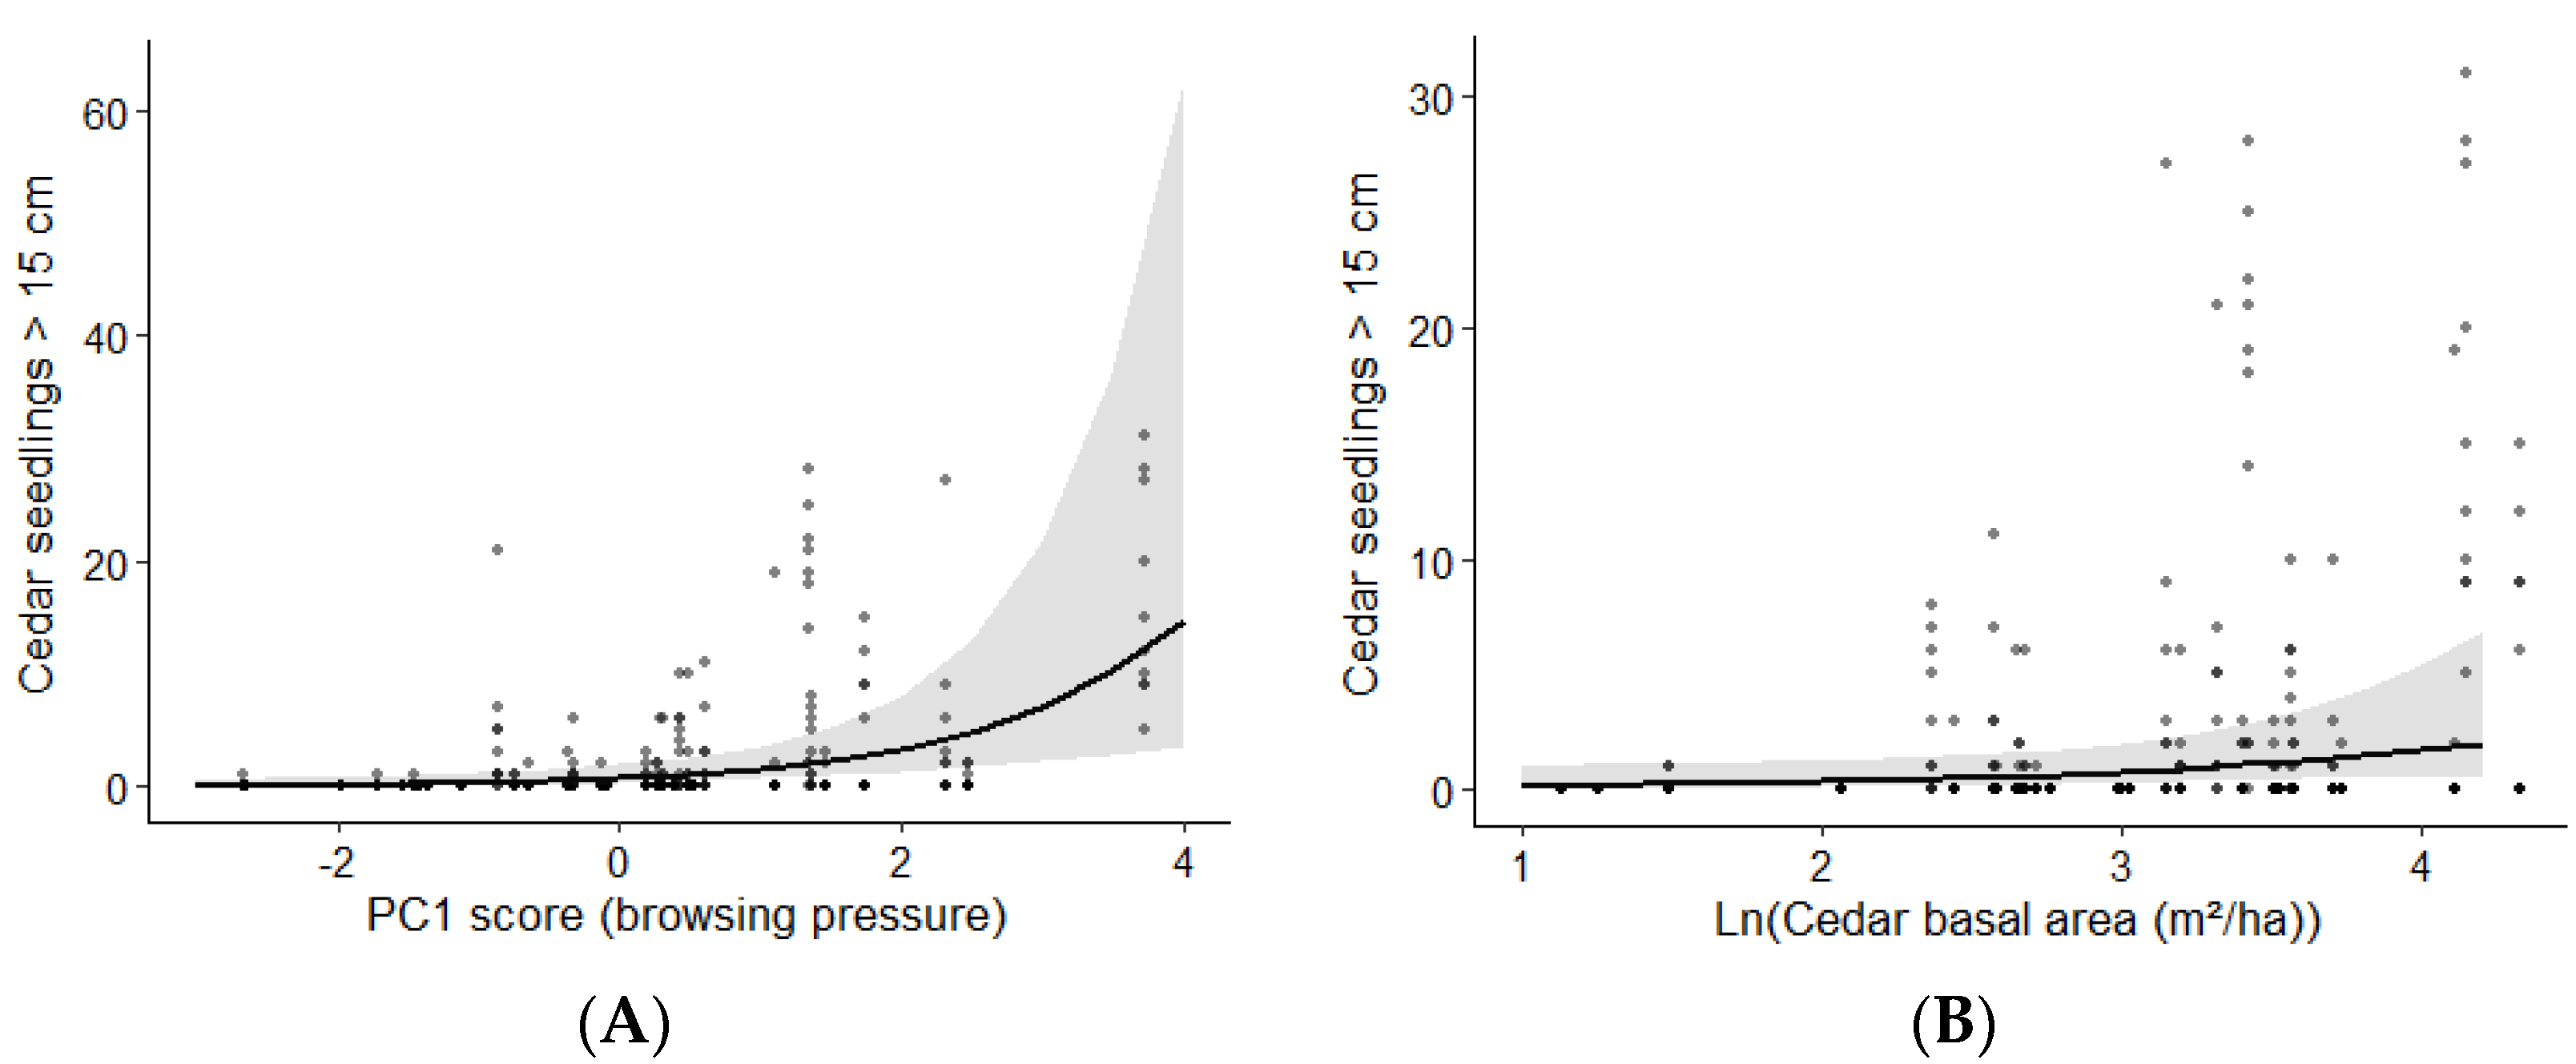
According to the results of our abundance model for cedar stems between 5 and 15 cm, only the natural log of cedar basal area had a positive effect on cedar abundance (Table 4, Figure 5). However, in the abundance model of cedar stems > 15 cm, the browsing index (PC1) and the natural log of cedar basal area had a positive effect on cedar abundance (Table 4). The 17 sites with a positive PC1 score (low browsing pressure) had higher abundances and the site with the highest score (3.72) had no microplots without cedar seedlings > 15 cm (Figure 6A). Conversely, the nine sites with scores lower than −1, therefore having a strong browsing pressure, had a cumulative total of four seedlings, including five sites without seedlings. For cedar basal area, the range of values for all sites was 3.1 to 75.3 m2/ha (1.1 to 4.3 on a logarithmic scale) and the median was 20 m2/ha (3 on a logarithmic scale) (Figure 6B).
According to the results of our model of cedar abundance > 50 cm, the browsing index (PC1) had a positive effect on cedar abundance, whereas the treated zone had a negative effect (Table 4, Figure 7). Cedar basal area had no effect on this height class. The 17 sites with a positive PC1 score (low browsing pressure) contained 227 of the 233 cedars > 50 cm counted in total and the 8 sites with a score greater than 1 contained 218, or approximately 93% of the total. Among the 25 sites with a score less than or equal to 1, only 4 had at least 1 cedar > 50 cm for a total of 15 seedlings. In the sites in the control sector, there were a total of 229 seedlings > 50 cm and an average of 13.5 (CI: 4.8 to 29.9) per site. In the sites in the treated sector, there was a total of four seedlings > 50 cm and an average of 0.25 (CI: 0 to 0.8) per site. In the control sector, 9 of the 17 sites had at least one cedar > 50 cm, while only 2 sites out of 16 in the treated sector had them.

4. Discussion

This study evaluated how cedar regeneration benefited from a major deer culling operation. The growth architecture of cedar [48] and its ability to compensate for some degree of browsing [6] make deer–cedar interactions different from many conifer–herbivore interactions. In fact, this specific functional trait of cedar is what makes it possible to use the species for hedges.
Our results confirm that deer browsing constrains the abundance of tall regeneration. They also show that cedar growth can respond rapidly to a decrease in browsing pressure but that this effect is not sufficient to translate into an increase in tall regeneration within two years. Short-term reductions in browsing pressure seemingly do not influence the establishment of small cedar regeneration (5–15 cm) but can play a role in its recruitment to larger sizes.

4.1. Characterization of Browsing Pressure

The index of browsing pressure derived from a principal component analysis run on the growth form of ligneous seedlings and saplings varied a lot within sectors, especially in the control zone. Such variability is consistent with the large scale of the study and reflects the fact that, even though we sought sites with comparable pre-treatment browsing pressures, our selection data described large-scale patterns, and a lot of variation can be expected at finer scales. Deer make decisions at multiple spatial scales, from landscape- to plant-level [49,50], and inconsistencies could, therefore, have appeared, for instance, between the site-level browsing index and the landscape-level deer density estimates (treatment zones). There was also a lot of overlap in browsing index values between the control and the treated zone, which is consistent with the fact that we attempted to sample sites with similar past browsing pressures. In fact, 75% of the sites in the control zone fall within the range of values of the treated zone. This can also indicate that two years of deer population control were not sufficient to induce a change in the distribution of the growth forms. Reductions in browsing pressure in the treated zones should logically have led to an increase in the proportion of reiterated forms; while this was impossible to measure given the absence of data prior to culling, our results could also indicate that two years of population control was not sufficient to induce sufficient growth reactions.
Growth forms, like all browsing metrics, have their limits. A major one in this case is that by simplifying browsing to its effect on tree architecture, the actual cause behind interrupted growth forms was not considered. For instance, although deer browsing is likely the largest contributor in this study area, other herbivores such as snowshoe hare (Lepus americanus Ersleben) or moose (Alces alces Gray) could also have played a role [22,25,51]. This short-term deer population control was, however, unlikely to have caused noticeable changes in hare and moose populations. Local moose population is limited [52], and other factors such as hunting pressure and increases in winter tick (Dermacentor albipictus Packard) abundance contribute to maintaining low moose numbers [53]. With regard to hare, competition with deer has been observed in some contexts [54]. Based on our knowledge of the study area, however, we expect an absence of correlation between the two herbivores, as observed in the Great Lakes in the case of eastern hemlock (Tsuga canadensis (L.)) [55], a species facing regeneration challenges very similar to those of cedar.

4.2. Growth Response of Cedar to a Reduction in Browsing Pressure

Growth forms and the capacity of cedar to escape from deer are directly related to its height growth. However, reconstructing height growth for cedar would have required a detailed destructive longitudinal analysis, since cedar height growth leaves little distinct signs on the stem [48] and growth can be quite slow in the understory. Since we observed a significant relationship between height and radial growth, a response in radial growth should translate into a response in height growth. Therefore, we concentrated on radial growth.
A positive growth response to the deer control treatment was identified through the BACI analysis. After the deer control operation, the mean radial growth decreased by 9.5% in the control zone, whereas it increased by 17.4% in the treated zone. The growth response to treatment observed in 2019 persisted in 2020. Radial growth in 2020 is possibly underestimated, since the growth may not have been fully completed at the end of August when the seedlings were harvested [51].
Cedar radial growth increased with canopy openness and root collar diameter. In a study of regeneration treatments, Larouche et al. [23] observed the best growth in 625 m2 gaps, while the slowest growth was observed in untreated stands. According to Logan [56], optimum growth would occur at a canopy openness of around 50%, and the maximum canopy openness observed in our study was 52.9% (average 24.5% ± 6.2 SD). Therefore, the vast majority of the sampled individuals were growing in sub-optimal conditions (Figure 4). These low light levels are typical of cedar regeneration strategy, since a seedling bank establishes in the understory, surviving with slow growth, and gains access to the canopy through successive suppression–release episodes [3,4,57].
The browsing index did not influence cedar growth. This could be explained by several factors. First, growth forms were only inventoried in 2020, whereas growth from 2014 to 2020 was included in the BACI analysis. The growth forms integrate browsing over an unknown time period which may differ from the one included in the BACI analysis. More importantly, growth forms are a cumulative browsing index, and the 2-year time period was likely insufficient to cause measurable changes in growth forms. This lack of effect could also include a selection bias. In this study, we selected the tallest seedling within a radius of 5 m, which could, for instance, be taller due to lower browsing than its neighbors. Finally, our index of browsing represents browsing at the stand scale, and browsing at the seedling level can differ since seedlings can be locally protected by obstacles such as slash or neighboring vegetation.

4.3. Abundance of Cedar Regeneration

This study showed that the variables influencing the abundance of cedar regeneration differ between height classes. Short seedlings were not affected by deer browsing, which suggests that they are protected by snow during winter, when browsing on cedar can become more intense. The abundance of short seedlings was rather influenced by the basal area of the cedar. Previous studies have suggested that this variable could reflect the abundance of seed trees, with the seed rain, particularly in mixed stands, being a critical variable for regeneration establishment [21,23,58]. Silvicultural methods aiming to regenerate cedar should then favor the retention of seed trees until seedlings are established in sufficient numbers. Cedar basal area also influenced the abundance of regeneration from 15 to 200 cm, but an effect of browsing became apparent. Above 50 cm, browsing became the sole significant factor. Similar effects of deer browsing on tall cedar regeneration have also been observed in previous studies [5,19,20,21,22]. The same impact of basal area on the abundance of smaller but not on taller cedar regeneration was observed by Rooney et al. [21].
Even though the browsing index revealed a major role of browsing in the recruitment of cedar regeneration to larger sizes, the deer control operation has not led to changes in the abundance of the different size categories of cedar regeneration. The only case where treatment zones differed was for the greater abundance of seedlings taller than 50 cm in the control zone. We attribute this to an artifact related to the greater variability of the control zone that includes the sites with lower browsing pressures. Among the seven sites with the lowest browsing pressures, six were located within the control zone, reflecting a lower longer-term browsing, regardless of the culling operation. Other studies in northeastern North America have found that deer control operations were successful in reducing browsing and enhancing the regeneration of browsed species [59,60,61,62]. In the case of Stout et al. [62], some species that were absent before the deer control operation became present after the operation. Our study involved only two years of deer control, and cedar growth can be slow in the understory of untreated stands, such as those included here, which means that browsing should be controlled for more than two years to have an effect. Jenkins et al. [60] suggested that the hunting pressure should be maintained for more than 15 years in their case, since, at that time, the presence of selected hardwood species taller than 2 m was not increased.
Another tested variable related to deer pressure was the location within or outside winter deeryards. Even though deeryards can have a major impact on cedar regeneration [16,17], no effect of that variable was identified here. Using the distance to deeryard in the model still showed no effect. Bombardier-Cauffopé [63] noticed an interaction between distance to deeryard and seedling size, showing an effect of distance to deeryard only for regeneration taller than 15 cm. In another study covering two provinces of eastern Canada, Capolla [64] also found an effect of distance to deeryard on sapling recruitment. Part of the explanation may lie in limitations of deeryard maps. Deer use of winter habitat can vary over time and, given the costs associated with deeryard mapping, maps cannot be updated every year. It then becomes possible that certain zones mapped as winter deeryards are not used anymore. This is consistent with observations from Villemaire-Côté et al. [25] that some cedar plantations developed well and remained unbrowsed, even within deeryards. Several factors such as deer density, the availability of food and the feeding of deer near urban areas can lead to changes in the winter use of deeryards and push deer to abandon their natural tendency to return to the same deeryard [65,66].

5. Conclusions and Management Implications

Our study has shown that cedar can respond quickly to a sudden reduction in deer pressure by increasing in diameter, which should translate into increased height growth. However, two years after the beginning of the deer culling operation, there was still no detectable impact on cedar regeneration structure. A two-year period is rather short to expect an increase in tall regeneration abundance, especially for a species with slow height growth in the understory, such as cedar [3]. A longer observation period might have allowed the detection of an effect, but the efforts to regulate deer population in the treated zone had stopped since our measurements and deer populations can recover quickly when hunting efforts are reduced [67].
It is currently difficult to know how long the hunting pressure should be maintained to ensure that cedar regeneration is able to grow outside the reach of deer. In a natural gap study, a steady increase in cedar regeneration was observed within the first 30 years after the deer population naturally receded [22]. Depending on light availability and site fertility, it could take from 20 to 50 years for cedar to reach a height of 2 m in the absence of browsing and understory competition [5,9,17,20], and 75 years may be required to reach 3 m [57]. However, in cedar plantations exposed to a low browsing pressure, a height of 3 m can be reached within 13 years and this time can even be reduced to 9 years if competing vegetation is controlled [25]. This opens possibilities to reduce the length of time for which deer control operations would need to be maintained. In any case, regenerating cedar in high deer density areas requires a joint forest and deer management approach [68]. Partial cutting and competition control could be used to shorten the period when cedar seedlings and saplings remain vulnerable to deer browsing. Periods of lower deer densities following harsh winters could be targeted for such interventions. Tall seedlings planted in gaps when deer populations drop would provide a height advantage over newly established seedlings, and rapid growth of planted seedlings in gaps has been observed in the absence of deer browsing [23]. Deer population management or local deer exclusion will, however, likely be necessary in high deer density areas to promote cedar recruitment. In a context of sustainable forest management, regenerating harvested species is a must. Unless efficient management approaches are implemented, the lack of cedar recruitment will impact the forest biodiversity that depends on cedar and the cedar wood industry, and compromise the long-term future of deeryards.

Author Contributions

Conceptualization, J.-P.T., O.V.-C. and J.-C.R.; methodology, J.-P.T., J.-C.R., O.V.-C. and F.P.; validation, F.P., O.V.-C., J.-P.T. and J.-C.R.; formal analysis, F.P.; investigation, F.P.; resources, J.-C.R. and J.-P.T.; data curation, F.P.; writing—original draft preparation, F.P. and J.-C.R.; writing—review and editing, J.-C.R., O.V.-C., J.-P.T. and F.P.; visualization, F.P.; supervision, J.-P.T. and J.-C.R.; project administration, J.-C.R.; funding acquisition, J.-P.T. and J.-C.R. All authors have read and agreed to the published version of the manuscript.

Funding

The project was funded by a NSERC Collaborative Research and Development Grant (CRDPJ 514192–17). Industrial partners for this project were: Acadian Timber Corporation, Gestion Solifor Inc., J.D. Irving Ltd., and Maibec Inc.

Data Availability Statement

The data presented in this study are available on request from the corresponding author. The data are not publicly available due to research agreements with study partners.

Acknowledgments

The authors would like to acknowledge the help of Joëlle Boutin during field work and Ann Delwaide for dendrochronological analyses. André Dumont from the Québec Ministry of the Environment, Fight against climate change, Wildlife and Parks was very helpful in understanding the local dynamics of deer. This paper also benefited from the statistical advice of François Rousseu and Stéphane Daigle from the Centre for Forest Research.

Conflicts of Interest

The authors declare no conflict of interest. The funders had no role in the design of the study, in the collection, analyses, or interpretation of data, in the writing of the manuscript, or in the decision to publish the results.

References

  1. Boulfroy, E.; Forget, É.; Hofmeyer, P.V.; Kenefic, L.S.; Larouche, C.; Lessard, G.; Lussier, J.-M.; Pinto, F.; Ruel, J.-C.; Weiskittel, A. Guide Pour la Sylviculture du Thuya Occidental; Ressources Naturelles Canada, Centre Canadien sur la Fibre de Bois: Ottawa, ON, Canada, 2012; p. 84. [Google Scholar]
  2. Johnston, W.F. Thuja occidentalis L.—Northern white-cedar. In Silvics of North America; U.S. Department of Agriculture, Forest Service: Washington, DC, USA, 1990; pp. 580–589. [Google Scholar]
  3. Ruel, J.-C.; Lussier, J.-M.; Morissette, S.; Ricodeau, N. Growth response of northern white-cedar (Thuja occidentalis) to natural disturbances and partial cuts in mixed wood stands of Quebec, Canada. Forests 2014, 5, 1194–1211. [Google Scholar] [CrossRef]
  4. Fraver, S.; Kenefic, L.; Cutko, A.; White, A.S. Natural disturbance and stand structure in old-growth Thuja occidentalis forests of northern Maine. For. Ecol. Manag. 2020, 456, 117680. [Google Scholar] [CrossRef]
  5. Cornett, M.W.; Frelich, L.E.; Puettmann, K.J.; Reich, P.B. Conservation implications of browsing by Odocoileus virginianus in remnant upland Thuja occidentalis forests. Biol. Conserv. 2000, 93, 359–369. [Google Scholar] [CrossRef]
  6. Villemaire-Côté, O. Dynamiques de Régénération après Perturbation chez une Espèce Sensible au Broutement—Le cas du Thuya occidental. Ph.D. Thesis, Université Laval, Québec, QC, Canada, 2023. [Google Scholar]
  7. Danneyrolles, V.; Dupuis, S.; Arseneault, D.; Terrail, R.; Leroyer, M.; de Römer, A.; Fortin, G.; Boucher, Y.; Ruel, J.-C. Eastern white cedar long-term dynamics in eastern Canada: Implications for restoration in the context of ecosystem-based management. For. Ecol. Manag. 2017, 400, 502–510. [Google Scholar] [CrossRef]
  8. Etheridge, D.A.; Maclean, D.A.; Wagner, R.G.; Wilson, J.S. Changes in landscape composition and stand structure from 1945–2002 on an industrial forest in New Brunswick, Canada. Can. J. For. Res. 2011, 35, 1965–1977. [Google Scholar] [CrossRef]
  9. Heitzman, E.; Pregitzer, K.S.; Miller, R.O.; Lanasa, M.; Zuidema, M. Establishment and development of northern white-cedar following strip clearcutting. For. Ecol. Manag. 1999, 123, 97–104. [Google Scholar] [CrossRef]
  10. Dupuis, S.; Arseneault, D.; Sirois, L. Change from pre-settlement to present-day forest composition reconstructed from early land survey records in eastern Québec, Canada: Change from pre-settlement to present-day forest composition. J. Veg. Sci. 2011, 22, 564–575. [Google Scholar] [CrossRef]
  11. White, M.A. Long-term effects of deer browsing: Composition, structure and productivity in a northeastern Minnesota old-growth forest. For. Ecol. Manag. 2012, 269, 222–228. [Google Scholar] [CrossRef]
  12. Côté, S.D.; Rooney, T.P.; Tremblay, J.-P.; Dussault, C.; Waller, D.M. Ecological impacts of deer overabundance. Annu. Rev. Ecol. Evol. Syst. 2004, 35, 113–147. [Google Scholar] [CrossRef]
  13. Horsley, S.B.; Stout, S.L.; De Calesta, D.S. White-tailed deer impact on the vegetation dynamics of a northern hardwood forest. Ecol. Appl. 2003, 13, 98–118. [Google Scholar] [CrossRef]
  14. Royo, A.A.; Carson, W.P. On the formation of dense understory layers in forests worldwide: Consequences and implications for forest dynamics, biodiversity, and succession. Can. J. For. Res. 2006, 36, 1345–1362. [Google Scholar] [CrossRef]
  15. Royo, A.A.; Carson, W.P. Stasis in forest regeneration following deer exclusion and understory gap creation: A 10-year experiment. Ecol. Appl. 2022, 32, e2569. [Google Scholar] [CrossRef]
  16. Morrison, S.F.; Forbes, G.J.; Young, S.J.; Lusk, S. Within-yard habitat use by white-tailed deer at varying winter severity. For. Ecol. Manag. 2003, 172, 173–182. [Google Scholar] [CrossRef]
  17. Verme, L.J.; Johnston, W.F. Regeneration of northern white cedar deeryards in upper Michigan. J. Wildl. Manag. 1986, 50, 307. [Google Scholar] [CrossRef]
  18. Dumont, A.; Ouellet, J.-P.; Crête, M.; Huot, J. Winter foraging strategy of white-tailed deer at the northern limit of its range. Écoscience 2005, 12, 476–484. [Google Scholar] [CrossRef]
  19. Larouche, C.; Kenefic, L.S.; Ruel, J.-C. Northern white-cedar regeneration dynamics on the Penobscot experimental forest in Maine: 40-year results. North. J. Appl. For. 2010, 27, 5–12. [Google Scholar] [CrossRef]
  20. Larouche, C.; Ruel, J.-C. Development of northern white-cedar regeneration following partial cutting, with and without deer browsing. Forests 2015, 6, 344–359. [Google Scholar] [CrossRef]
  21. Rooney, T.P.; Solheim, S.L.; Waller, D.M. Factors affecting the regeneration of northern white cedar in lowland forests of the Upper Great Lakes region, USA. For. Ecol. Manag. 2002, 163, 119–130. [Google Scholar] [CrossRef]
  22. Villemaire-Côté, O.; Ruel, J.-C.; Tremblay, J.-P. Reduction in local white-tailed deer abundance allows the positive response of northern white cedar regeneration to gap dynamics. Can. J. For. Res. 2022, 52, 1383–1397. [Google Scholar] [CrossRef]
  23. Larouche, C.; Ruel, J.-C.; Lussier, J.-M. Factors affecting northern white-cedar (Thuja occidentalis) seedling establishment and early growth in mixedwood stands. Can. J. For. Res. 2011, 41, 568–582. [Google Scholar] [CrossRef]
  24. Kern, C.C.; Reich, P.B.; Montgomery, R.A.; Strong, T.F. Do deer and shrubs override canopy gap size effects on growth and survival of yellow birch, northern red oak, eastern white pine, and eastern hemlock seedlings? For. Ecol. Manag. 2012, 267, 134–143. [Google Scholar] [CrossRef]
  25. Villemaire-Côté, O.; Ruel, J.-C.; Sirois, L. Development of northern white-cedar (Thuja occidentalis L.) plantations within and outside deer yards. Forests 2017, 8, 326. [Google Scholar] [CrossRef]
  26. MFFP. Bilan des Opérations de Détection et de Contrôle de la Maladie Débilitante Chronique des Cervidés 2018; Ministère des Forêts, de la Faune et des Parcs: Québec, QC, Canada, 2018. Available online: https://cdn-contenu.quebec.ca/cdn-contenu/faune/documents/BI_MDC-Bilan-2018_mffp_fr.pdf?1620076642 (accessed on 15 February 2022).
  27. MFFP. Données D’abattage pour le cerf de Virginie dans la Zone D’intervention Contrôlée (ZIC) en 2018; Ministère des Forêts, de la Faune et des Parcs, Direction de la Gestion de la Faune de l’Outaouais: Québec, QC, Canada, 2020.
  28. MFFP. Bilan des Opérations de Détection et de Contrôle de la Maladie Débilitante Chronique des Cervidés 2019; Ministère des Forêts, de la Faune et des Parcs: Québec, QC, Canada, 2019. Available online: https://cdn-contenu.quebec.ca/cdn-contenu/faune/documents/BI_MDC-Bilan-2019_mffp_fr.pdf?1620076639 (accessed on 3 December 2021).
  29. MFFP. Données D’abattage et de Collision pour le cerf de Virginie de l’Outaouais et des Laurentides (2017 et 2018); Ministère des Forêts, de la Faune et des Parcs, Direction de la Gestion de la Faune de l’Outaouais: Québec, QC, Canada, 2020.
  30. Gosselin, J. Guide de Reconnaissance des Types Écologiques des Régions Écologiques 3a—Collines de l’Outaouais et du Témiscamingue et 3b—Collines du lac Nominingue; Ministère des Ressources Naturelles du Québec, Direction des Inventaires Forestiers, Division de la Classification Écologique et de la Productivité des Stations: Québec, QC, Canada, 2002; p. 188. [Google Scholar]
  31. MFFP. Norme de Stratification Écoforestière: Quatrième Inventaire Écoforestier du Québec Méridional; Ministère des Forêts, de la Faune et des Parcs, Secteur des Forêts, Direction des Inventaires Forestiers: Québec, QC, Canada, 2015; p. 111. Available online: http://collections.banq.qc.ca/ark:/52327/2748275 (accessed on 21 November 2021).
  32. MFFP. Aires de Confinement du cerf de Virginie pour les Régions de l’Outaouais et des Laurentides; Ministère des Forêts, de la Faune et des Parcs, Direction de la Gestion de la Faune de l’Outaouais: Québec, QC, Canada, 2020.
  33. Keigley, R.B. A growth form method for describing browse condition. Rangelands 1997, 19, 26–29. [Google Scholar]
  34. Steege, H.T. Hemiphot.R: Free R Scripts to Analyse Hemispherical Photographs for Canopy Openness, Leaf Area Index and Photosynthetic Active Radiation under Forest Canopies; Naturalis Biodiversity Center: Leiden, The Netherlands, 2018. [Google Scholar]
  35. Centre D’études Nordiques. Dendro2019; Centre D’études Nordiques: Québec, QC, Canada, 2019. [Google Scholar]
  36. Stevens, S.; Valderas, J.M.; Doran, T.; Perera, R.; Kontopantelis, E. Analysing indicators of performance, satisfaction, or safety using empirical logit transformation. BMJ 2016, 352, i1114. [Google Scholar] [CrossRef]
  37. Jolliffe, I.T.; Cadima, J. Principal component analysis: A review and recent developments. Philos. Trans. R. Soc. A Math. Phys. Eng. Sci. 2016, 374, 20150202. [Google Scholar] [CrossRef]
  38. Peres-Neto, P.R.; Jackson, D.A.; Somers, K.M. How many principal components? Stopping rules for determining the number of non-trivial axes revisited. Comput. Stat. Data Anal. 2005, 49, 974–997. [Google Scholar] [CrossRef]
  39. Stewart-Oaten, A.; Bence, J.R. Temporal and spatial variation in environmental impact assessment. Ecol. Monogr. 2001, 71, 305–339. [Google Scholar] [CrossRef]
  40. Underwood, A.J. On beyond BACI: Sampling designs that might reliably detect environmental disturbances. Ecol. Appl. 1994, 4, 3–15. [Google Scholar] [CrossRef]
  41. R Core Team. R: A Language and Environment for Statistical Computing; R Foundation for Statistical Computing: Vienna, Austria, 2021; Available online: https://www.r-project.org/ (accessed on 14 September 2021).
  42. Bates, D.; Mächler, M.; Bolker, B.; Walker, S. Fitting linear mixed-effects models using lme4. J. Stat. Softw. 2015, 67, 48. [Google Scholar] [CrossRef]
  43. Hartig, F. DHARMa: Residual Diagnostics for Hierarchical (Multi-Level/Mixed) Regression Models; R Package Version 0.4.3; R Foundation for Statistical Computing: Vienna, Austria, 2021; Available online: https://cran.r-project.org/package=DHARMa (accessed on 14 September 2021).
  44. Lüdecke, D.; Ben-Shachar, M.S.; Patil, I.; Waggoner, P.; Makowski, D. Assessment, testing and comparison of statistical models using R. J. Open Source Softw. 2021, 6, 3139. [Google Scholar] [CrossRef]
  45. Zuur, A.F.; Ieno, E.N.; Walker, N.J.; Saveliev, A.A.; Smith, G.M. Mixed Effects Models and Extensions in Ecology with R; Springer: New York, NY, USA, 2011; p. 574. [Google Scholar]
  46. Efron, B. Better bootstrap confidence intervals. J. Am. Stat. Assoc. 1987, 82, 171–185. [Google Scholar] [CrossRef]
  47. Lenth, R.V. Emmeans: Estimated Marginal Means, aka Least-Squares Means, R package version 1.5. 5–1; R Foundation for Statistical Computing: Vienna, Austria, 2021. [Google Scholar]
  48. Briand, C.H.; Posluszny, U.; Larson, D.W. Differential axis architecture in Thuja occidentalis (eastern white cedar). Can. J. Bot. 1992, 70, 340–348. [Google Scholar] [CrossRef]
  49. Johnson, D.H. The comparison of usage and availability measurements for evaluating resource preference. Ecology 1980, 61, 65–71. [Google Scholar] [CrossRef]
  50. Senft, R.L.; Coughenour, M.B.; Bailey, D.W.; Rittenhouse, L.R.; Sala, O.E.; Swift, D.M. Large herbivore foraging and ecological hierarchies. BioScience 1987, 37, 789–799. [Google Scholar] [CrossRef]
  51. Johnston, W.F. Balsam fir Dominant Species under Rethinned Northern White-Cedar; Research Note NC-133; U.S. Department of Agriculture, Forest Service, North Central Forest Experiment Station: St. Paul, MN, USA, 1972. [Google Scholar]
  52. Messier, F.; Crête, M. Moose-wolf dynamics and the natural regulation of moose populations. Oecologia 1985, 65, 503–512. [Google Scholar] [CrossRef]
  53. Jones, H.; Pekins, P.; Kantar, L.; Sidor, I.; Ellingwood, A.; Lichtenwalner, A.; O’Neal, M. Mortality assessment of moose (Alces alces) calves during successive years of winter tick (Dermacentor albipictus) epizootics in New Hampshire and Maine (USA). Can. J. Zool. 2018, 97, 22–30. [Google Scholar] [CrossRef]
  54. Hulbert, I.A.; Andersen, R. Food competition between a large ruminant and a small hindgut fermentor: The case of the roe deer and mountain hare. Oecologia 2001, 128, 499–508. [Google Scholar] [CrossRef]
  55. Alverson, W.S.; Lea, M.V.; Waller, D.M. A 20-year experiment on the effects of deer and hare on eastern hemlock regeneration. Can. J. For. Res. 2019, 49, 1329–1338. [Google Scholar] [CrossRef]
  56. Logan, K.T. Growth of Tree Seedlings as Affected by Light Intensity. IV Black Spruce, White Spruce, Balsam Fir and Eastern White Cedar; Report No. 1256; Department of Fisheries and Forestry, Canadian Forestry Service: Ottawa, ON, Canada, 1969. [Google Scholar]
  57. Hofmeyer, P.V.; Kenefic, L.S.; Seymour, R.S. Historical stem development of northern white-cedar (Thuja occidentalis L.) in Maine. North. J. Appl. For. 2010, 27, 92–96. [Google Scholar] [CrossRef]
  58. Cornett, M.W.; Reich, P.B.; Puettmann, K.J. Canopy feedbacks and microtopography regulate conifer seedling distribution in two Minnesota conifer-deciduous forests. Écoscience 1997, 4, 353–364. [Google Scholar] [CrossRef]
  59. De la Cretaz, A.L.; Kelty, M.J. Development of tree regeneration in fern-dominated forest understories after reduction of deer browsing. Restor. Ecol. 2002, 10, 416–426. [Google Scholar] [CrossRef]
  60. Jenkins, L.H.; Murray, B.D.; Jenkins, M.A.; Webster, C.R. Woody regeneration response to over a decade of deer population reductions in Indiana state parks. J. Torrey Bot. Soc. 2015, 142, 205–219. [Google Scholar] [CrossRef]
  61. Sage, R.W.; Porter, W.F.; Underwood, H.B. Windows of opportunity: White-tailed deer and the dynamics of northern hardwood forests of the northeastern US. J. Nat. Conserv. 2003, 10, 213–220. [Google Scholar] [CrossRef]
  62. Stout, S.L.; Royo, A.A.; De Calesta, D.S.; McAleese, K.; Finley, J.C. The Kinzua quality deer cooperative: Can adaptive management and local stakeholder engagement sustain reduced impact of ungulate browsers in forest systems? Boreal Environ. Res. 2013, 18 (Suppl. A), 50–64. [Google Scholar]
  63. Bombardier-Cauffopé, C. Dynamique de Régénération du Thuya occidental (Thuja occidentalis L.) dans les vieilles forêts mixtes sur sol mésique. M.Sc. Thesis, Laval University, Québec, QC, Canada, 2018. [Google Scholar]
  64. Capolla, B. Contribution du Cerf de Virginie aux Variations Spatio-Temporelles de la Régénération du Thuya Occidental au Québec et au Nouveau-Brunswick. Master’s Thesis, Laval University, Québec, QC, Canada, 2022. [Google Scholar]
  65. Hurst, J.E.; Porter, W.F. Evaluation of shifts in white-tailed deer winter yards in the Adirondack region of New York. J. Wildl. Manag. 2008, 72, 367–375. [Google Scholar] [CrossRef]
  66. Lesage, L.; Crête, M.; Huot, J.; Dumont, A.; Ouellet, J.-P. Seasonal home range size and philopatry in two northern white-tailed deer populations. Can. J. Zool. 2000, 78, 1930–1940. [Google Scholar] [CrossRef]
  67. Fryxell, J.M.; Hussell, D.J.T.; Lambert, A.B.; Smith, P.C. Time lags and population fluctuations in white-tailed deer. J. Wildl. Manag. 1991, 55, 377. [Google Scholar] [CrossRef]
  68. Beguin, J.; Tremblay, J.; Thiffault, N.; Pothier, D.; Côté, S.D. Management of forest regeneration in boreal and temperate deer–forest systems: Challenges, guidelines, and research gaps. Ecosphere 2016, 7, e01488. [Google Scholar] [CrossRef]
Figure 1. Location of the study sites within and outside white-tailed deeryards and a controlled intervention area where white-tailed deer were intensively culled. The study area is located in southern Québec, Canada.
Forests 14 00455 g001
Figure 2. (A) Eigenvectors of the browsing growth forms (REL: released, RET: retrogressed, ARR: arrested, U: uninterrupted) for the first two principal components (PC) of a principal component analysis. (B) Distribution of sites by zone according to their scores. Note that only PC1 is significant.
Forests 14 00455 g002
Figure 3. Mean annual radial growth (µm) and standard deviation of the cedar seedlings for the treatment and control zones over the study period (2014 to 2020). The deer control treatment started in the fall of 2018.
Forests 14 00455 g003
Figure 4. Predicted annual radial growth and 95% confidence intervals of white cedar seedlings (A) for the treatment and control zones for the periods before and after the culling operation, and (B) as a function of canopy openness, with datapoints representing raw data. Darker points represent overlapping datapoints.
Forests 14 00455 g004
Figure 5. Predicted abundance and 95% confidence interval of white cedar between 5 and 15 cm per 4 m2 microplot as a function of the natural log of the white cedar basal area in m2/ha. Datapoints represent raw data. Darker points represent overlapping datapoints.
Forests 14 00455 g005
Figure 6. Predicted abundance and 95% confidence interval of cedar > 15 cm per microplot of 4 m2 as a function of (A) PC1 score, representing a browsing pressure index, and (B) as a function of the natural log of white cedar basal area in m2/ha. Datapoints represent raw data. Darker points represent overlapping datapoints.
Forests 14 00455 g006
Figure 7. Predicted abundance and 95% confidence interval of cedar >50 cm per 4 m2 microplot as a function of (A) PC1 score representing a browsing pressure index, and (B) abundance of white cedar >50 cm per 4 m2 microplot in the treated and control zones. Datapoints represent raw data. Darker points represent overlapping datapoints.
Forests 14 00455 g007
Table 1. Browsing growth forms proposed by Keigley [33].
TypeDescriptionBrowse Intensity
UninterruptedThe terminal leader has never been browsed and grows each year from the terminal leader of the previous yearLight to moderate
ArrestedThe terminal leader and lateral shoots are repeatedly browsed, and the tree never exceeds the snowpack height (arrest height)Intense
RetrogressedThe terminal leader and lateral shoots had grown taller than arrest height but an increase in browsing intensity caused a retrogression of the living height Change from light–moderate to intense
ReleasedTree showing past signs of arrest or retrogression of which one lateral shoot has become a new terminal leader that grows each year from the terminal leader of the previous yearChange from intense to light–moderate
Table 2. Loadings of the browsing growth forms for each principal component (PC) and proportion of explained variance. PC1 (in bold) is the only significant PC.
PC1PC2PC3PC4
Uninterrupted (U)0.630.260.250.68
Released (REL)−0.590.33−0.460.59
Retrogressed (RET)−0.470.260.84--
Arrested (ARR)−0.17−0.870.150.43
Proportion of explained variance0.530.300.160.02
Cumulative explained variance0.530.830.981.00
Table 3. Anova table of fixed effects of the BACI model on the radial growth of selected seedlings. Parameters in bold are significant at p = 0.05. The seedling ID nested with the site ID is the random effect of the model (n = 2119) (conditional R2 = 0.724; marginal R2 = 0.398).
ParameterSum SqNumDFDenDFF ValuePr (>F)
PC1 score0.01133.770.040.84
Period * Zone7.4611812.1240.930.00
Canopy openness0.911286.455.000.03
Ln (root collar diameter)38.391301.35210.590.00
Table 4. Generalized linear mixed model results on the abundance of cedar seedlings 5–15 cm (conditional R2 = 0.339; marginal R2 = 0.139), >15 cm (conditional R2 = 0.678; marginal R2 = 0.484) and >50 cm (conditional R2 = 0.630; marginal R2 = 0.466). Bold parameters exclude 0 from their 95% confidence interval. n = 330.
ParametersEstimate2.5% Confidence Interval97.5% Confidence Interval
Seedlings 5–15 cmIntercept−2.50−4.46−0.50
PC1 score0.07−0.280.41
Ln(white cedar basal area)0.640.061.22
Zone−0.14−0.970.70
Deeryard−0.40−1.290.48
Seedlings > 15 cmIntercept−2.6−5.1−0.1
PC1 score0.70.31.1
Ln(white cedar basal area)0.80.01.5
Zone−0.6−1.60.5
Deeryard−0.6−1.60.5
Seedlings > 50 cmIntercept−4.5−9.80.8
PC1 score0.90.01.7
Ln(white cedar basal area)0.9−0.62.5
Zone2.75.00.4
Deeryard−1.8−4.00.5
Disclaimer/Publisher’s Note: The statements, opinions and data contained in all publications are solely those of the individual author(s) and contributor(s) and not of MDPI and/or the editor(s). MDPI and/or the editor(s) disclaim responsibility for any injury to people or property resulting from any ideas, methods, instructions or products referred to in the content.