Article

Radial Growth Response of Siberian Pines to Climate Warming in the Sayan Mountains, Southern Siberia, Russian Federation

1
State Key Laboratory of Biocontrol, Department of Ecology, School of Life Sciences, Sun Yat-sen University, Guangzhou 510275, China
2
Key Laboratory of Vegetation Restoration and Management of Degraded Ecosystems, South China Botanical Garden, Chinese Academy of Sciences, 723 Xingke Road, Tianhe District, Guangzhou 510650, China
3
Key Laboratory of Ecological Restoration of Loess Plateau, Institute of Loess Plateau, Shanxi University, Taiyuan 030006, China
4
Guangzhou Institute of Forestry and Landscape Architecture, Guangzhou 510405, China
5
National Institute of Natural Hazards, Beijing 100085, China
6
Mathematical Methods and IT Department, Siberian Federal University, Krasnoyarsk 660075, Russia
7
Key Laboratory of Conservation Biology for Endangered Wildlife of the Ministry of Education, College of Life Sciences, Zhejiang University, Hangzhou 310058, China
*
Author to whom correspondence should be addressed.
Forests 2023, 14(3), 463; https://doi.org/10.3390/f14030463
Submission received: 19 January 2023 / Revised: 18 February 2023 / Accepted: 21 February 2023 / Published: 24 February 2023
(This article belongs to the Section Forest Meteorology and Climate Change)

Abstract

:
Climate warming and subsequent drought are predicted to alter local forest production and carbon budgets, the sensitivity of which may be site- and species-specific. Although a warmer and drier climate often constrains tree growth, whether trees grown in cool, wet regions across the Siberian forest can in turn be promoted remains unknown. Here, we aimed to investigate the historical growth tendency of Siberian forests in the Sayan Mountain areas and to explore how climate interacts to regulate their growth. We used ring-width data from Siberian pine (Pinus sibirica Du Tour) sampled from three sites in this area to establish a regional chronology and calculate percentage growth change (%GC) over the past 250 years. Bootstrapped correlation analysis between the regional ring-width chronology and climatic factors indicates the mean air temperature, though not precipitation, is more often positively linked to the radial growth of Siberian pines. The %GC series shows that, from 1966 to 2006, the rising temperatures in May resulted in a significant increase in the radial-growth rate of Siberian pines (r = 0.47, p < 0.05). Our study suggests that the positive growth rate anomaly is more likely to occur as temperatures rise in Southern Siberia.

1. Introduction

Carbon dioxide (CO2) emissions have substantially increased since the beginning of the Industrial Era, with consequent feedback on the global climate [1]. As a major component of global carbon cycles and budgets, forests play a vital role in reducing atmospheric CO2 concentration and mitigating global warming [2,3,4]. In particular, trees can durably sequester 15% of anthropogenic CO2 emissions annually [5,6]. Trees absorb CO2 from the atmosphere via photosynthesis to form radial wood [5,7]. Therefore, changes in tree radial growth have a considerable impact on the rate of carbon sequestration by trees [5,8].
In recent decades, tree growth declines have been widely reported all over the world, typically due to drought exacerbated by global warming [9,10]. For example, in Amazonia, drought caused a decrease in the radial-growth rate of tropical trees [11]. In Alaska, drought has led to a decrease in the growth rate and productivity of boreal trees [white spruce (Picea glauca (Moench) Voss) and black spruce (Picea mariana (Mill.) BSP)] [12]. In Southeast Australia, decreases in the radial growth of urban trees were exacerbated by a warmer and drier climate [13]. The growth decline in trembling aspen (Populus tremuloides Michx.) is significantly related to climate warming-induced drought [10]. However, boosted tree growth resulting from global warming has also been observed in some regions. For example, in Ontario, Canada, the radial-growth rate of boreal trees [sugar maple (Acer saccharum Marsh.), white spruce (Picea glauca (Moench) Voss), and balsam fir (Abies balsamea (L.) Mill.)] has increased, driven by warmer temperatures [14]. The radial growth of four dominant boreal tree species [paper birch (Betula papyrifera Marsh.), jack pine (Pinus banksiana Lamb.), black spruce (Picea mariana (Mill.) BSP), and trembling aspen (Populus tremuloides Michx.)] might benefit from future climate warming in western Quebec, Canada [15]. The rise in summer air temperature has induced higher radial-growth rates of larch (Larix gmelinii Rupr.) in Northcentral Siberia [16]. Overall, factors driving tree growth vary significantly across different regions, and more studies are necessary to understand tree radial-growth rates in specific areas.
The Siberian forest in Russia accounts for 13% of the world’s forest carbon; as such, it has the potential to significantly influence the global carbon budget [4,17,18]. Meteorological observations in Southern Siberia have shown increasing trends in temperature and precipitation over the past decades [19]. Against this background, many studies have investigated the relationship between tree growth and climate in this area. For example, Kharuk, Im, and Petrov [20] indicated that the growth increment of Siberian pine (Pinus sibirica Du Tour) positively correlated to June temperatures and negatively correlated to May–August precipitation at high elevations (1700 m a.s.l.) in the Altai-Sayan Region. Zhirnova et al. [21] suggested the radial growth of Siberian pine (Pinus sibirica Du Tour) positively related to the previous July–August to the current August temperature (except April) and negatively correlated to the previous July–September to December precipitation in the Western Sayan Mountains. Petrov et al. [22] found positive correlations between the radial-growth rate of cedar (Pinus sibirica Du Tour) and November–March and May–June temperatures in Southern Siberia. However, given the short meteorological record, the effects of climate on the radial-growth rate of Siberian pine in a long history background still need to be verified.
Tree rings are ideal for studying the growth dynamic of trees, as trees live for a long period, occur worldwide, and provide annually-resolved data about their local conditions [23,24]. Most studies conducted in the past decades in Siberia have focused on the development of ring-width chronologies to reconstruct the past climate [16,25,26]. Calculating tree radial-growth rates in Siberia, which capture the full range of growth change in trees [24], is still lacking. Thus, it is urgent to calculate the tree radial-growth rate and to understand how climate affects tree growth dynamics in Siberia. This information is needed to predict future tree dynamics in the region under climate change [27].
In this study, we aimed to examine historical tree growth in the Sayan Mountain region in Southern Siberia and analyze the influence of climate on tree growth. As the temperature is the main limiting factor of tree growth in Siberia [28,29], we expect an overall positive feedback between temperature and tree radial-growth rate in this area.

2. Materials and Methods

2.1. Study Area

Field sampling was conducted in 2018. The three sampling sites (site 1, site 2, and site 3) are located in the Sayan Mountains, Southern Siberia, Russia (Figure 1). The latitude, longitude, and elevation of the sampling sites range from 52° to 53° N, from 93° to 95° E, and from 1200 to 1600 m a.s.l. (Table 1), respectively. At each of the sampling sites, Siberian pine (Pinus sibirica Du Tour) is the dominant species, with a few Siberian firs (Abies sibirica Ledeb.) and silver birches (Betula pendula Roth) mixed in.

2.2. Tree Ring Data

All of the sampled trees are Siberian pine. Using an increment borer (5.12 mm inner diameter), we sampled 20 trees at each site without obvious diseases and pests, taking two samples from each tree at breast height (1.3 m; parallel to the slope of the sampling sites) for a total of 120 cores. The cores were brought to the laboratory and fixed in grooved wooden bars with glue. After drying, sandpaper was used to polish the cores until the tree rings were visible. The width of every tree ring was measured using a Lintab system interfaced with the Time Series Analysis Program (TSAP; Rinntech, Heidelberg, Germany). The results of cross dating were validated using COFECHA [30].
The tree-ring width or BAI (basal increment area) is used for studying tree radial-growth rates when the sampling trees have large variability in tree size and have relatively small diameters [24]. However, here, the sampling trees have small variability in tree size and have large diameters. Therefore, tree-ring width should be used in this study for calculating the tree radial-growth rate. The ARSTAN program [31] was used to establish site-specific chronologies from the cross-dated ring-width data [24]. To remove age-related growth trends and avoid the so called “end effect” [32,33], the ring-width data were fitted with smoothing splines with a fixed 128 cut off to obtain residual chronologies.
To ensure that the sample sizes were sufficient to build the ring-width chronologies, we calculated the subsample signal strength (SSS; usually uses 0.85 as the threshold) of the samples to determine the year in which each chronology became stable [34]. For sites 1, 2, and 3, the SSS exceeded 0.85 in 1762, 1725, and 1719, respectively. So, the common period analyses were conducted for the period from 1762 to 2018. Rbar (mean correlation coefficients between the cores), EPS (expressed population signal), and SNR (signal-to-noise ratio) were employed to evaluate the quality of the chronologies. Rbar and SNR indicate the strength of the common signal among chronologies within sites [35,36]. EPS quantifies how well the established chronologies reflect the hypothetical chronologies [34]. The correlation coefficients between the site-specific chronologies for the common period from 1762 to 2018 were 0.66 (p < 0.05; site 1 and site 2), 0.65 (p < 0.05; site 1 and site 3), and 0.62 (p < 0.05; site 2 and site 3), respectively, which indicates some common influences among the three sampling sites. Therefore, we used the mean of the residual chronologies of the three sites to establish a regional chronology for the following analysis.

2.3. Climatic Data

The Minusinsk weather station (53°43′ N, 91°42′ E) is the nearest weather station to the sampling sites and has a continuous climatic record. We, therefore, used monthly mean air temperature and monthly precipitation from this weather station for the period from 1966 to 2018 to analyze chronology–climate relationships. Climatic data were downloaded from the All-Russian Research Institute of Hydrometeorological Information, World Data Center (RIHMI-WDC; http://meteo.ru, accessed on 12 December 2022).
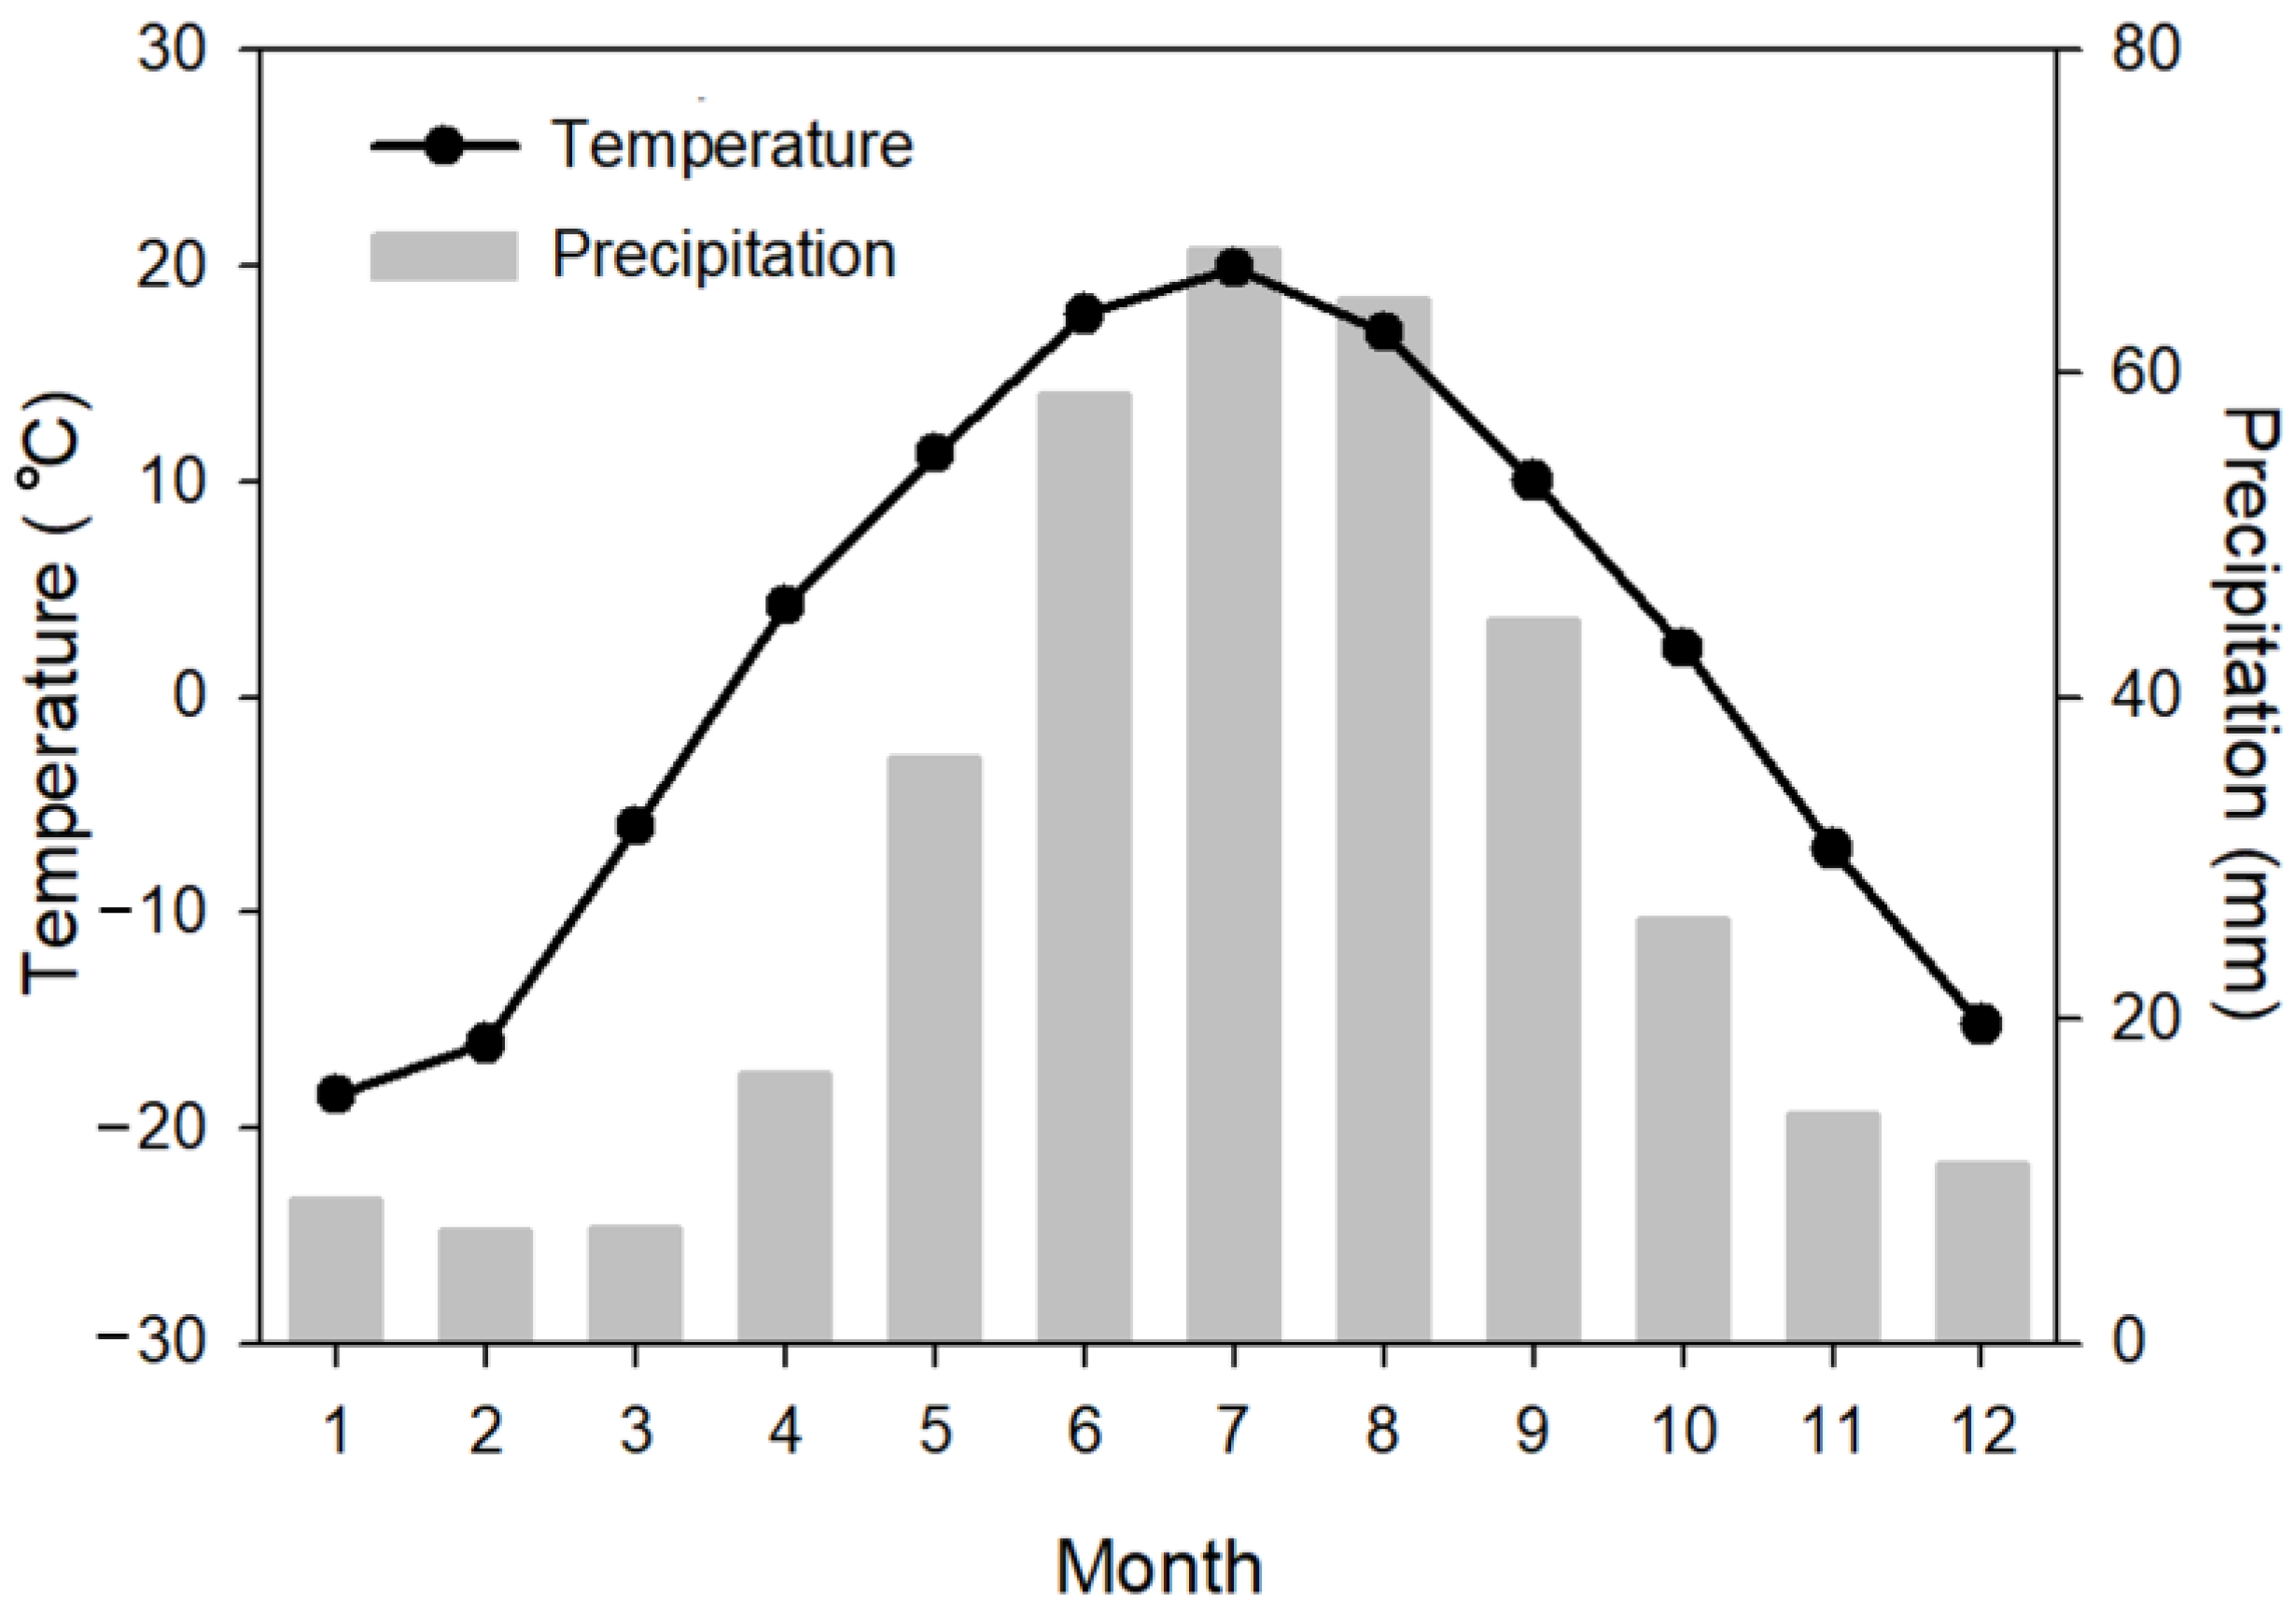
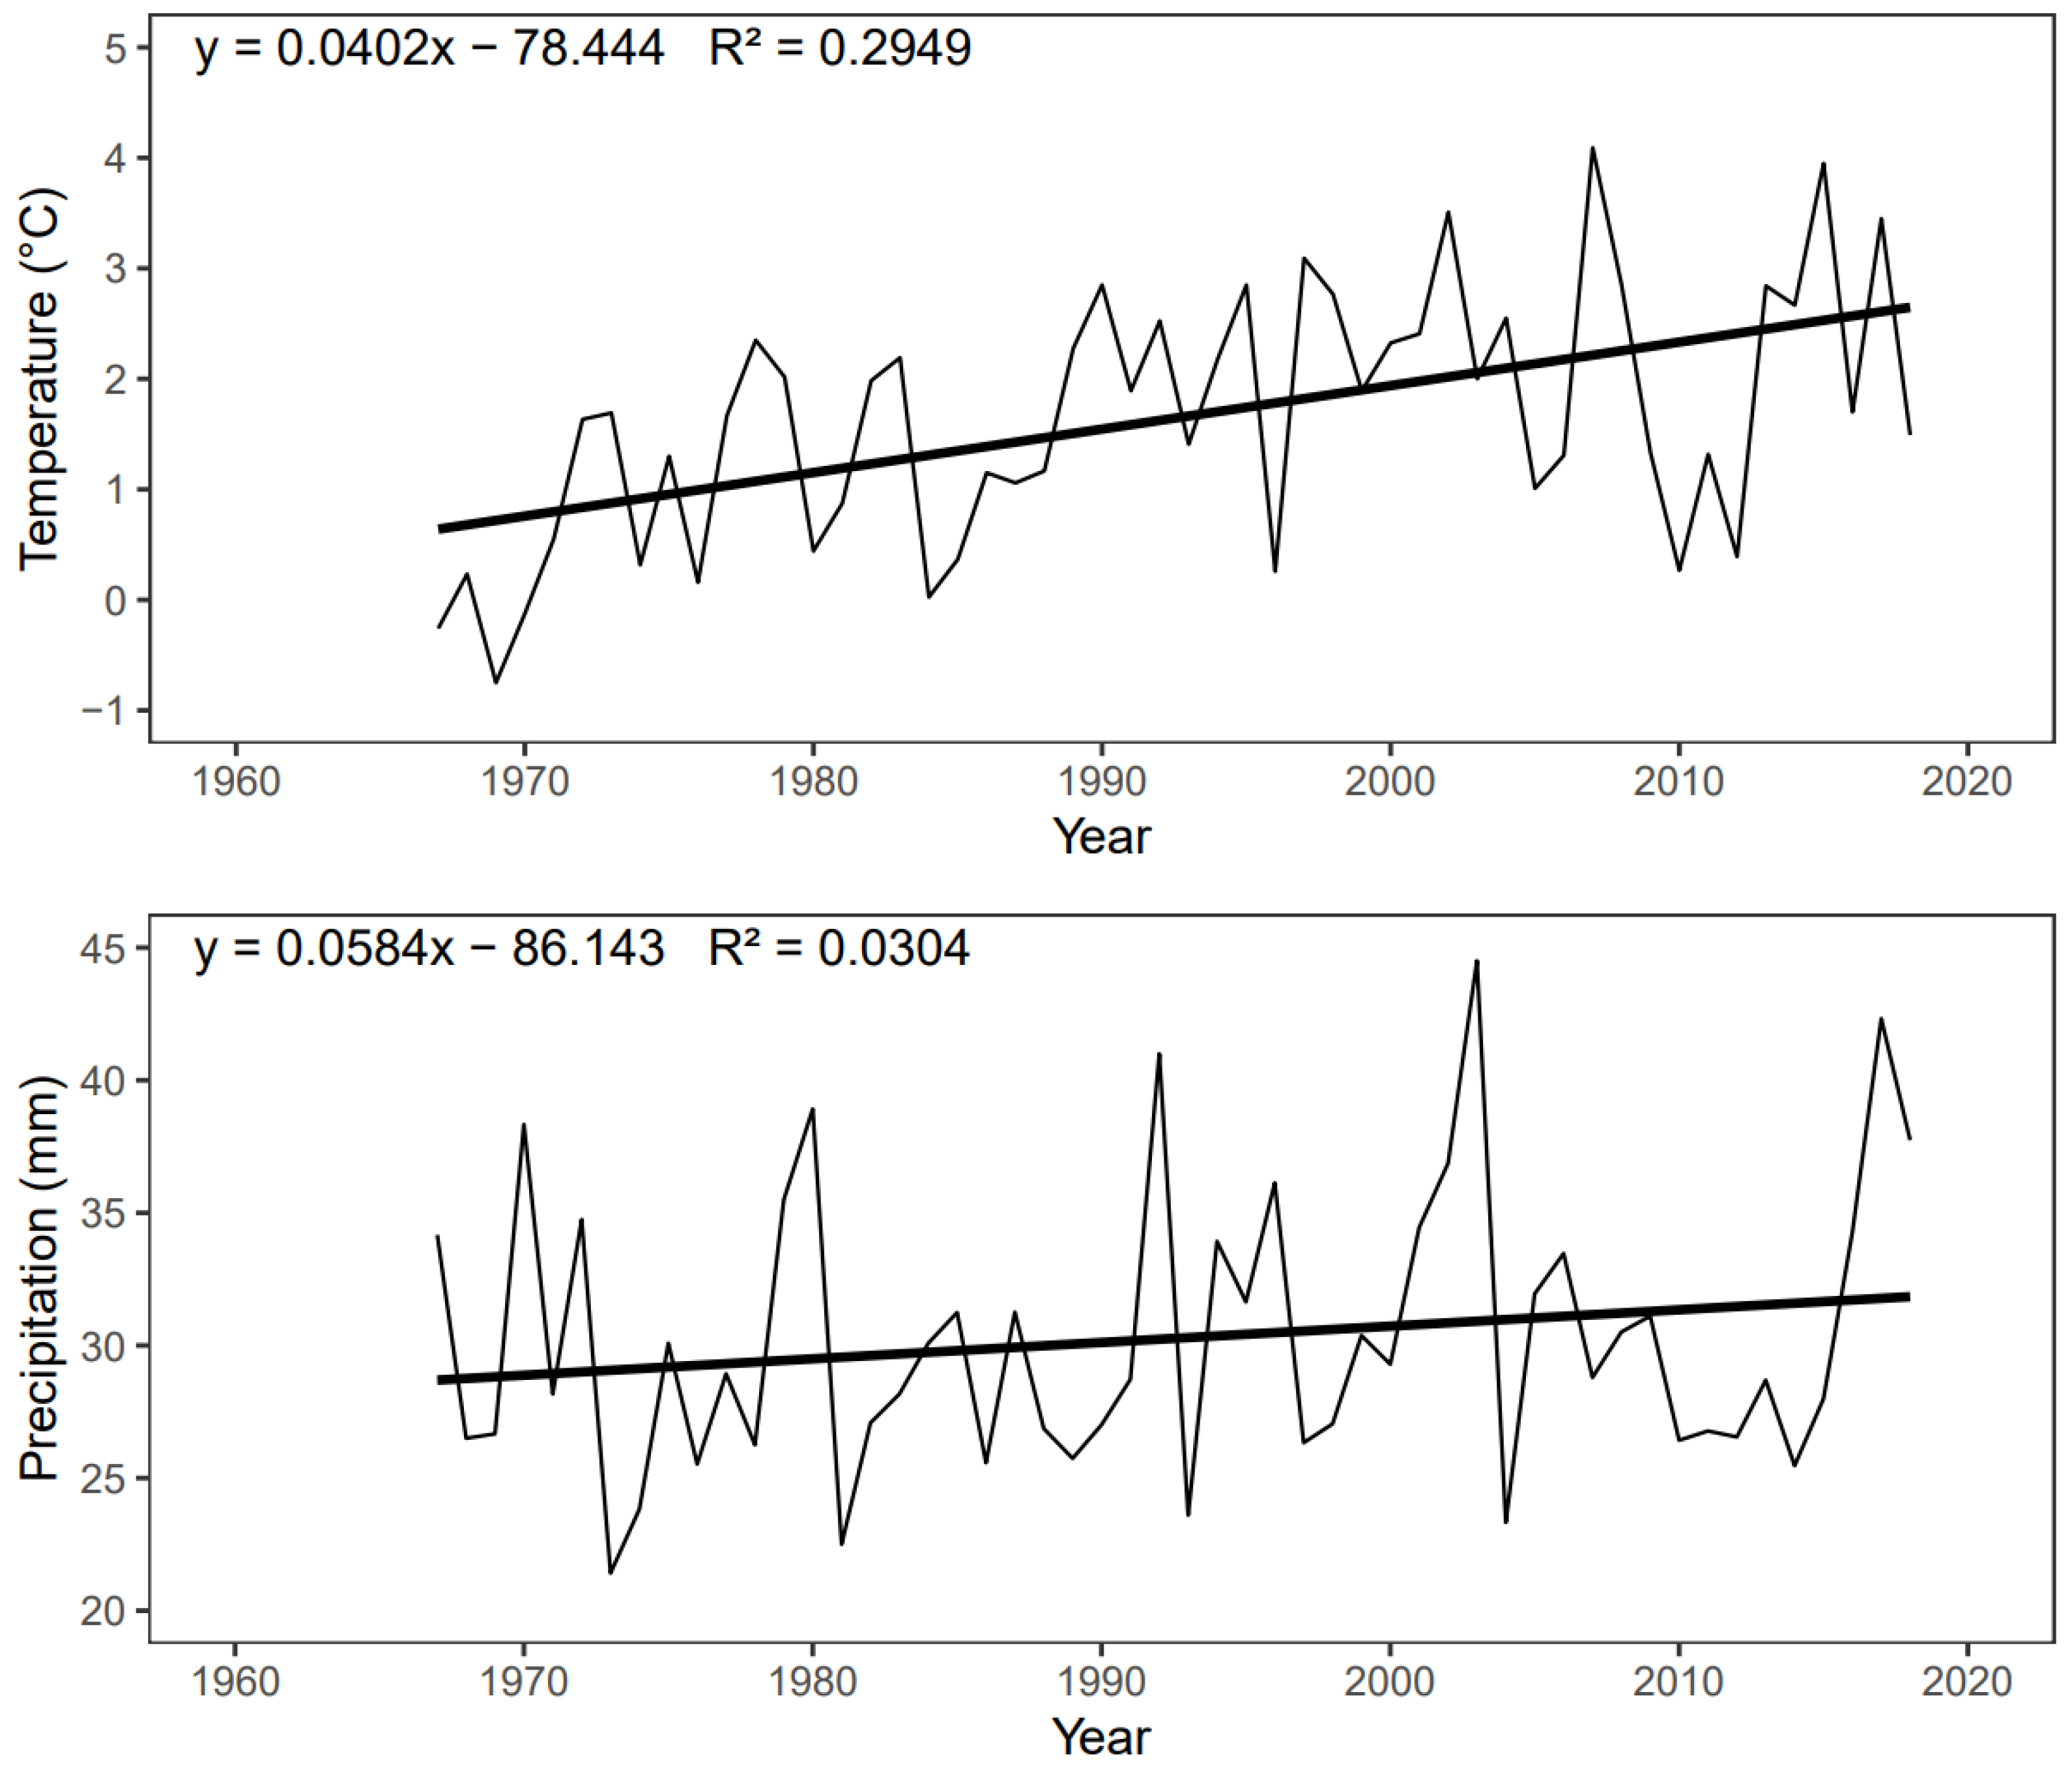
Based on the downloaded climatic data (Figure 2), the annual mean air temperature is −1.6 °C, with a monthly mean minimum of −18.5 °C in January and a monthly mean maximum of 19.9 °C in July. The mean temperature is below 0 °C for a total of five months of the year. The annual mean total precipitation is 363.2 mm, with a monthly mean minimum of 7.0 mm in February and a monthly mean maximum of 67.7 mm in July. The climate is cold and dry in winter and relatively warm and moist in summer. The trends of annual mean temperature and annual precipitation from 1966 to 2018 are shown in Figure 3. Annually, the mean temperature has significantly increased, and annual precipitation has been relatively stable since 1966.

2.4. Quantify Tree Radial-Growth Rate

Here the radial-growth averaging method (calculation of percentage growth change) is used to examine the tree growth rate. This method may enhance the detection of abrupt and sustained changes in the radial-growth rate and may effectively neutralize the short-term trends in tree-ring data to maximize low-frequency climatic signals [23], and also it was commonly employed in various trees worldwide [37,38]. By this method, the percentage growth change (%GC) of the tree is calculated by
%GC = (M2 − M1)/M1 × 100%
where M1 is the preceding 10-year mean tree-ring index (containing the current year of the calculation) and M2 is the subsequent 10-year mean tree-ring index [23]. In the radial-growth averaging method, the values of three parameters including the M1 and M2 window length, %GC moving average, and growth thresholds can be modified for specific species in specific trees [24]. According to a sensitivity analysis of this method, a large window length, a low moving average, and low thresholds can be used to emphasize the periods of positive and negative growth rate anomalies and the impact of climate on tree growth [24]. Based on empirical evidence, we used a ± 10-year window to calculate the %GC, smoothed with a 5-year moving average [23,24,38]. The minimum and maximum thresholds used to qualify the positive growth rate anomaly and negative growth rate anomaly were the mean plus one standard deviation and the mean minus one standard deviation, respectively [38]. That is, if the %GC for a given period is greater than the mean plus one standard deviation, it is considered a positive growth rate anomaly. If the %GC is less than the mean minus one standard deviation, it is considered a negative growth rate anomaly. If only one year of the %GC exceeds the threshold, it is not considered to be a positive or negative growth rate anomaly, but rather a short-term growth anomaly [23].

2.5. Radial Growth Climate Analyses

The software DendroClim2002 [39], including the bootstrapped correlation analysis, [40] was used to explore radial growth climate relationships and to detect the causes of growth increase and decrease. To remove the influence of the rising trends in both climate and tree growth on the causality, we conducted a bootstrapped correlation analysis (1000 iterations) between the regional chronology established by the mean of the chronologies at three sites, monthly mean air temperature, and monthly precipitation. The regional chronologies established by mixed tree-ring data at three sites and the first component (PC1) of the principal component analysis (PCA) of the chronologies at three sites were also used in the analyses to confirm the radial growth–climate relationship. The correlation analysis was conducted for the period from 1966 to 2018 (the common period of the regional chronology and climatic data) from the previous-year September to the current-year December.

3. Results

3.1. Identify Positive and Negative Growth Rate Anomalies

Table 1 shows the results of the common period analyses of the site chronologies covering 1762–2018, indicating the high quality of the chronologies.
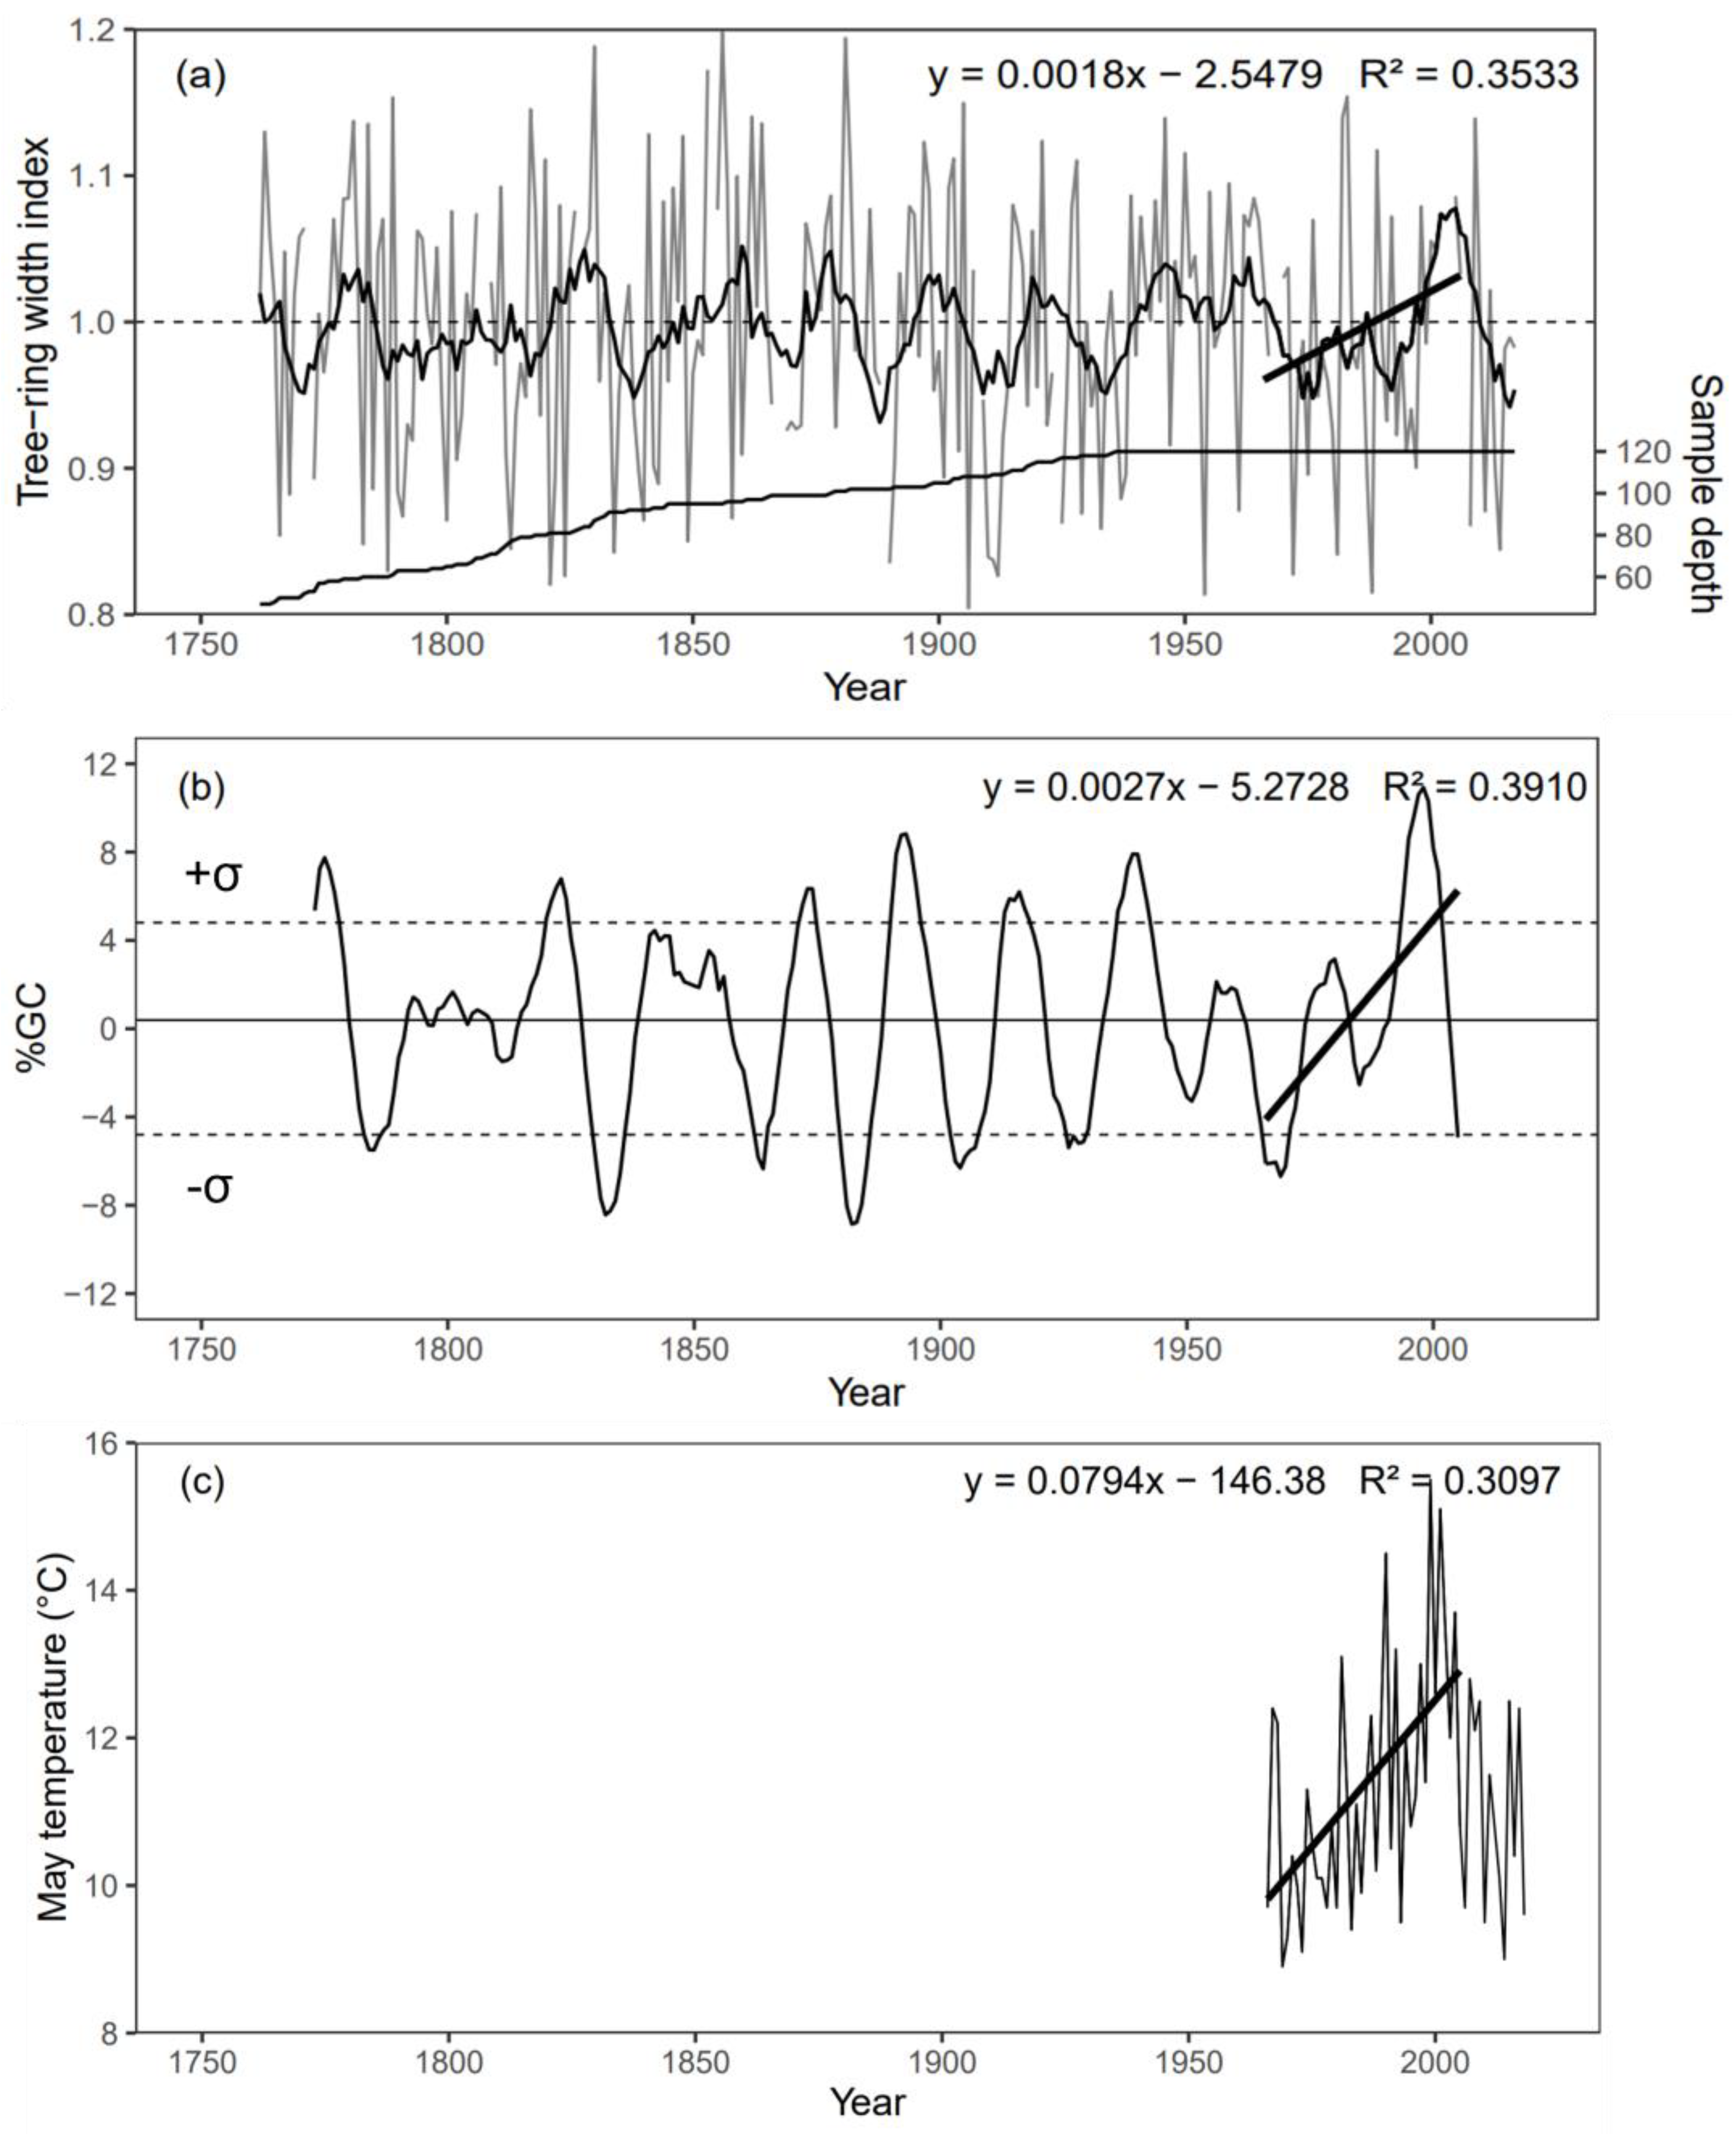
The %GC calculated by the regional chronology is illustrated in Figure 4. A comparison of the %GC with the regional chronology reveals that %GC reflects the radial-growth rate of Siberian pines in the study area. The periods of relatively high and low %GC mostly align with the periods of increase and decrease in the regional chronology. Both the regional chronology and the %GC have experienced periods of increase (r = 0.59, p < 0.05; r = 0.63, p < 0.05) since 1966, when the climatic data in this area are available, indicating that the increase in %GC has driven the radial growth of Siberian pines in this area. In addition, the specific periods, appearances, and total durations of positive and negative growth rate anomalies are summarized in Table 2. The numbers of occurrences of positive growth rate anomalies and negative growth rate anomalies are equal. However, the total duration of positive growth rate anomalies is longer than that of negative growth rate anomalies.

3.2. Radial Growth–Climate Relationships

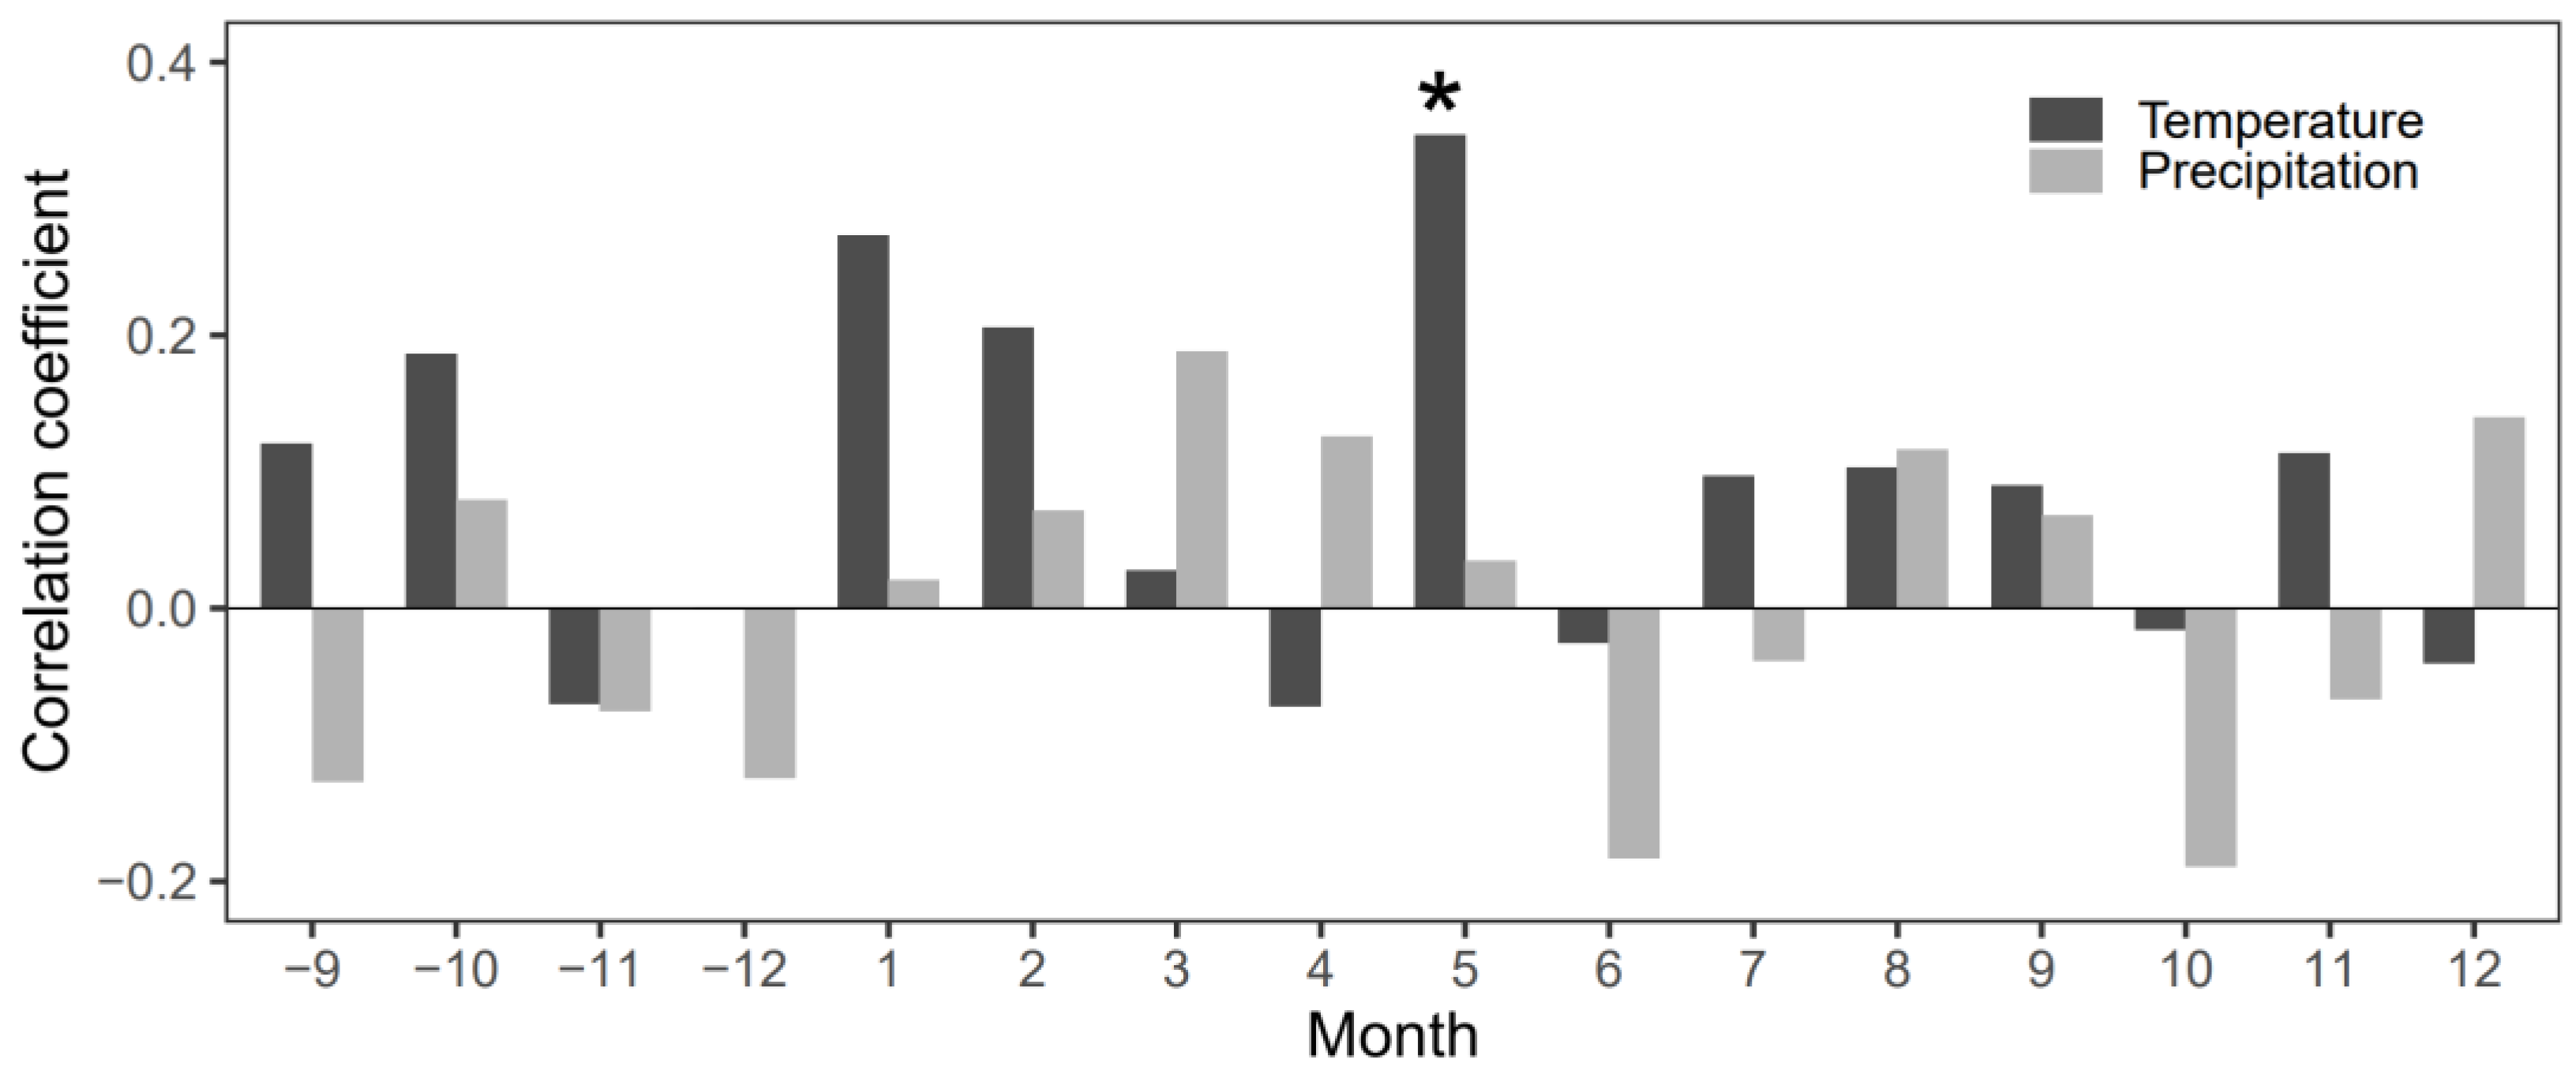
According to the bootstrapped correlation coefficients of the regional chronologies and with the climatic factors (Figure 5, Appendix A), tree radial growth and temperature are strongly related, while there is no significant correlation between tree radial growth and precipitation. Specifically, the results show significant positive correlations between the regional chronology and the mean air temperature in May (r = 0.35, p < 0.05).

3.3. Growth Rate-Temperature Relationships

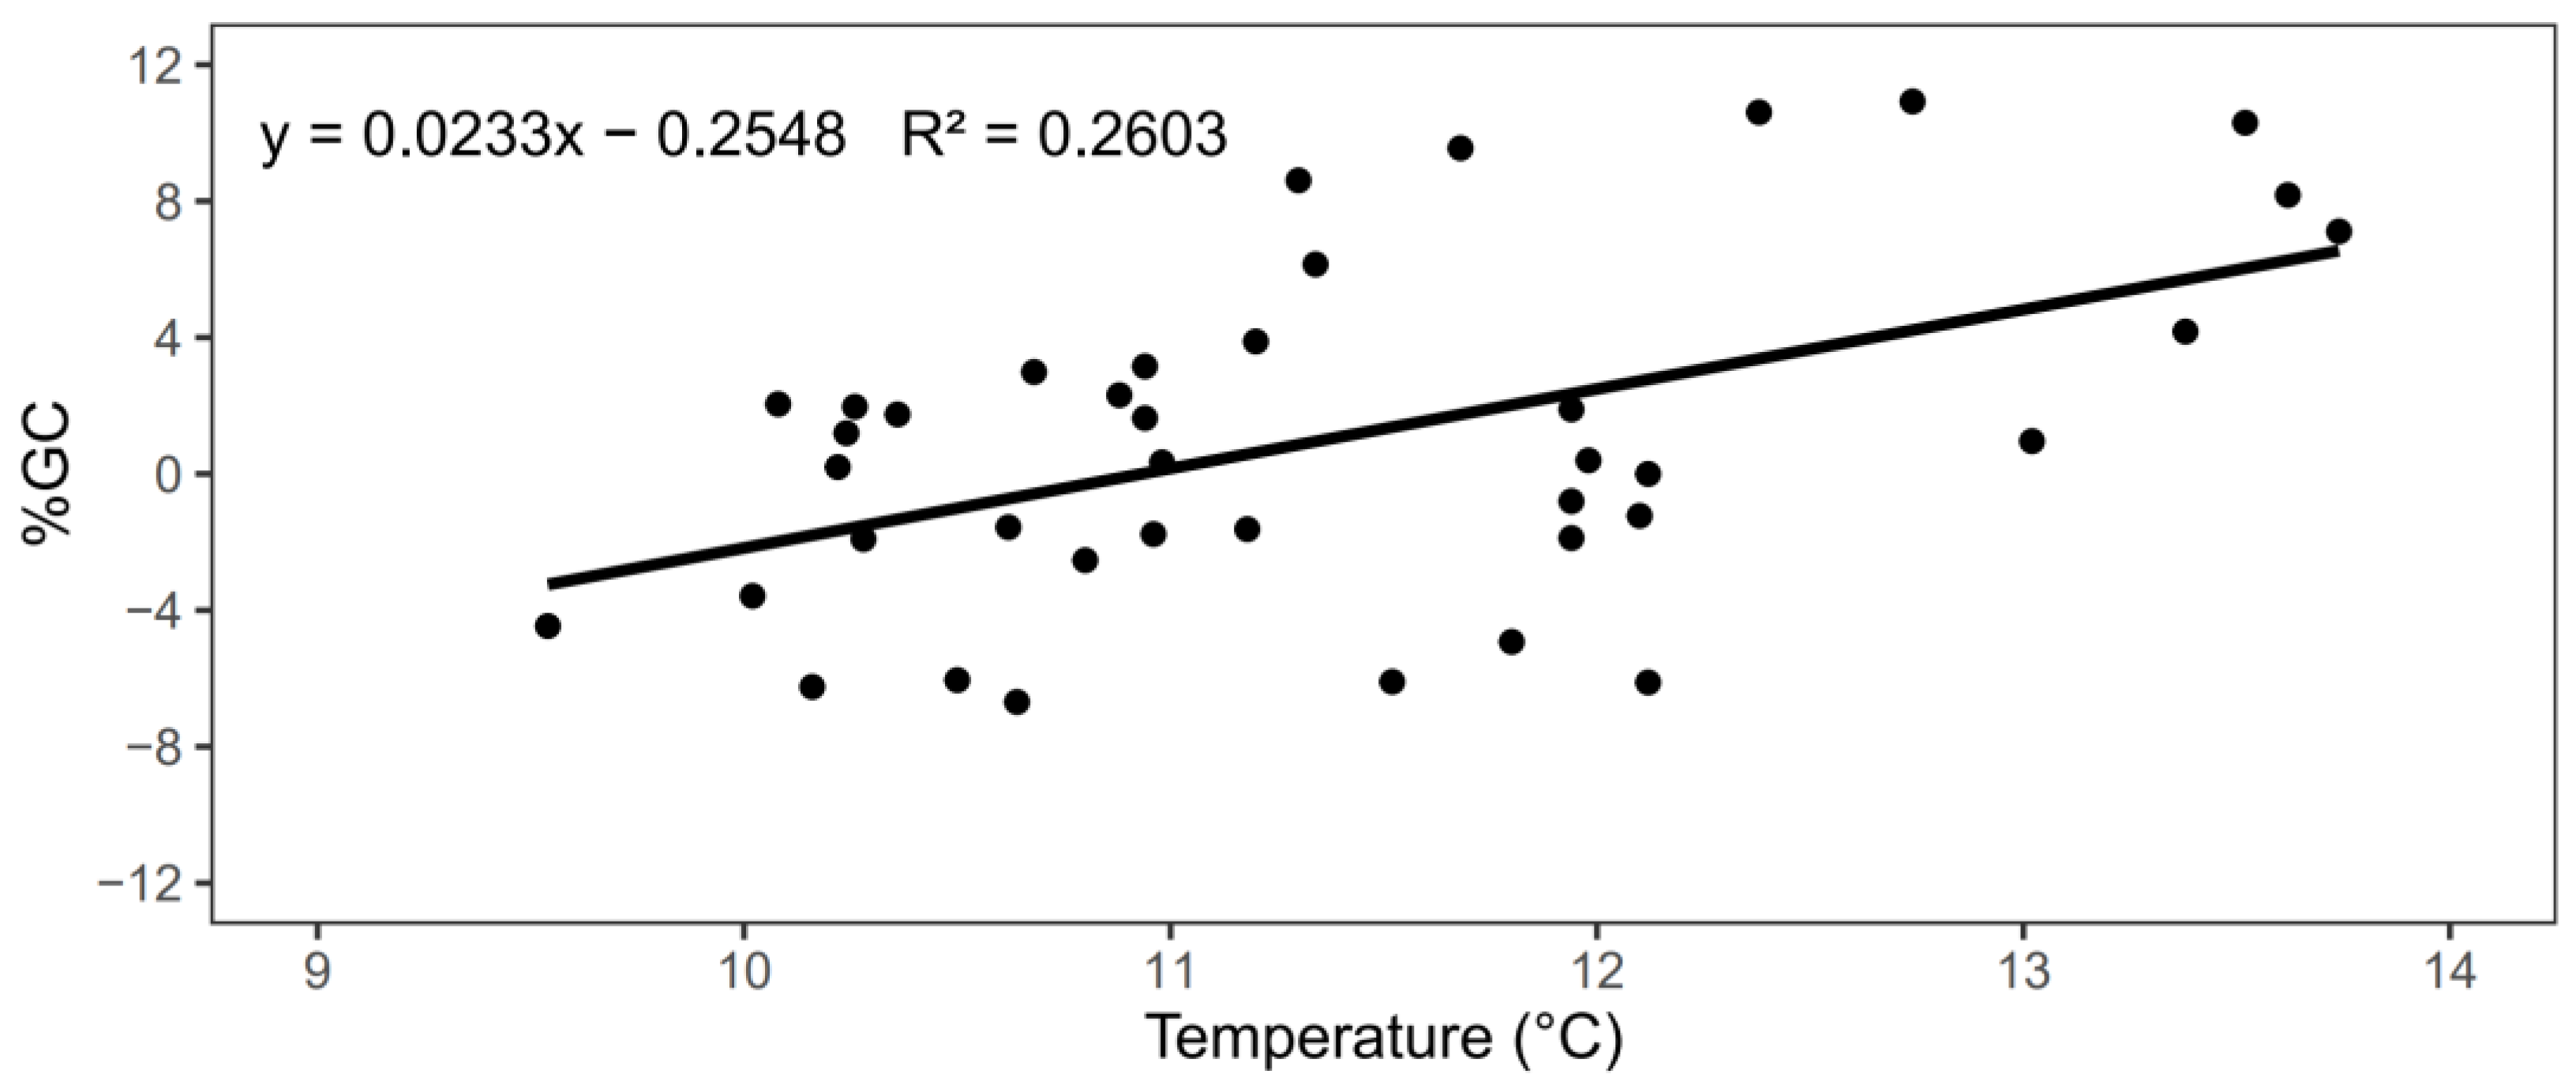
Based on the results of the correlation analysis (Figure 5), there is a significant positive association between tree radial growth in the study area and the mean air temperature in May. To further investigate the relationship between temperature and tree radial-growth rate, a linear regression was conducted between the five-year moving-average air temperature in May and the regional %GC (Figure 6). The analysis indicates that the regional %GC is positively correlated with the five-year moving-average mean air temperature in May (r = 0.47, p < 0.05).
Figure 4c illustrates the May temperature from 1966 to 2018, showing a rising trend that corresponds to the increasing trend in the regional chronology and %GC from 1966 to 2006.
To investigate the relationship between tree radial-growth rate and temperature prior to the availability of climatic data from weather stations in 1966, we compared our results with reconstructed temperatures from the surrounding region (Figure 7). Specifically, we compared the regional %GC with the temperature reconstructed by the ring-width chronology of the Siberian larch (Larix sibirica) in the Northern Urals [41] and the temperature reconstructed by the cell dimension chronology of the larch (Larix cajanderi Mayr.) in Siberia [42]. The periods of positive and negative growth rate anomalies mostly match the relatively warm and cool periods or the processes of warming and cooling of those reconstructed temperatures in this study area, respectively.

4. Discussion

Previous studies have suggested that tree growth declines are increasingly widespread in many regions of the world due to drier conditions caused by climate warming [10,12,13,43]. However, our study results indicate that, in the Sayan Mountain areas, the radial-growth rate of Siberian pines increased with the rising temperature in May during 1966–2006. The growing season of trees generally begins at temperatures above 5 °C [21], and the mean temperature in May in this area is 11.3 °C (Figure 2), making it suitable for the onset of tree growth in this area. The warmer May temperatures may favor the onset of wood formation in conifers in the Northern Hemisphere [44] and the onset of flowering (the first phenophase) of boreal forest, including Siberian pine in Southern Siberia [45], resulting in better growth during an extended growing season [46]. Warmer temperatures in May can also accelerate soil thawing to provide water for photosynthesis [46] and prevent the damage of the late spring frost to tree growth at high elevations [47]. Precipitation has a much weaker effect on the growth of Siberian pine in this area than temperature, supporting that temperature is the primary limiting factor for tree growth [20,48,49,50] and local water supply is currently sufficient for tree growth.
It is worth noting that there has been a decline in both the radial growth and radial growth rate (%GC) of Siberian pines in this area in recent years, likely attributed to the decreasing May temperatures (Figure 4) which have a significant positive correlation with radial growth. Despite warming temperatures in this study area, May temperatures have an inconsistent effect on the radial growth of Siberian pines due to their oscillation.
The positive effects of temperature on the radial growth of Siberian pines have also been reported by other studies in Southern Siberia. For example, Petrov et al. [22] found that the radial-growth rate of conifers including Siberian pine has significantly increased in recent decades as May temperatures were significantly positively correlated with tree growth in Southern Siberia. Petrov et al. [51] indicated that only the temperature in May has a significantly positive effect on the radial growth of Siberian pines in the Sayan Mountains.
The trends in %GC are mostly consistent with the trends in two reconstructed temperatures (Figure 6), specifically during the 1860s–1900s and 1920s–1960s. During these periods, the trends of %GC match those of the reconstructed temperatures, indicating that the radial-growth rate of Siberian pines is positively associated with temperature. This agrees with the findings of Briffa et al. [28], who reported a strong positive correlation between the growth of conifers in central Asia and temperature during the 1870s–1900s and 1920s–1980s.
Additionally, the periods of positive and negative growth rate anomalies are compared with the periods of some special climate events. For example, the negative growth rate anomaly in 1830–1835 and the positive growth rate anomaly in 1994–2001 are likely the results of 19th-century cooling and 20th-century warming, respectively; these periods are also identified for Northern Mongolia [52]. The severe growth declines observed in this study in 1784–1786, 1883–1885, and 1903–1907 are likely caused by the massive eruptions of Laki in Iceland (1783), Krakatau in Indonesia (1883), and Santa Maria in Guatemala (1902), respectively. These volcanic eruptions induced periods of abnormally low temperatures [53], which have been reflected in tree-ring studies worldwide [54,55,56]. For instance, the tree rings of white spruce (Picea glauca) indicated that 1783 was the coolest year in Northwestern Alaska [55]. The ring-width chronology of the Siberian juniper (Juniperus sibirica Burgsd.) and Siberian larch (Larix sibrica Ledeb.) in Siberia suggested that 1783 and 1883 experienced extremely cold weather [54]. Overall, these findings confirm our hypothesis that the radial-growth rate of Siberian pines in this study area is positively correlated with temperature.

5. Conclusions

Our results show that the radial-growth rate of Siberian pines in the Sayan Mountain areas of Southern Siberia has significantly increased as a result of warming temperatures in May during the period from 1966 to 2006 and is positively associated with temperatures over the past 250 years. However, recent unsustainable trends in May temperatures have caused a decrease in the radial-growth rate of Siberian pine. Additionally, the radial growth of trees under warming temperatures can be influenced by a range of factors, such as drought, soil quality, slope direction, diseases, and pests. As a result, it is essential to conduct further long-term research to explore the complex impact of temperature and other factors on tree radial growth.

Author Contributions

Conceptualization, F.Y., H.L. and J.H.; methodology, F.Y., H.L., Y.Y. and J.H.; investigation, J.K., S.J. and P.Z.; writing—original draft preparation, F.Y. and H.L.; writing—review and editing, M.W., Z.W., V.V.S., Y.Z. and J.H.; supervision, M.W. and J.H. All authors have read and agreed to the published version of the manuscript.

Funding

This study was funded by the National Natural Science Foundation of China (grant numbers 41661144007, 41861124001, 41701047, 32271653, and 32001138); the Ningxia Hui Autonomous Region Key Research and Development Project (2018BFG02015). V.V.S. appreciates the support of Russian Science Foundation (project# 22-14-00048).

Data Availability Statement

Not applicable.

Conflicts of Interest

The authors declare no conflict of interest.

Appendix A

Figure A1. Correlation coefficients between (a) the regional chronology established by the mixed tree-ring data at three sites and (b) the regional chronology established by the first component (PC1; explained 76% of the total variance) of the principal component analysis (PCA) of the chronologies at three sites and the climatic data during 1966–2018. Asterisk denotes that the correlation between the two variables is significant at the 95% confidence level (p < 0.05).
Forests 14 00463 g0a1

References

  1. AR5 Climate Change 2013: The Physical Science Basis—IPCC. Available online: https://www.ipcc.ch/report/ar5/wg1/ (accessed on 6 November 2022).
  2. Canadell, J.G.; Raupach, M.R. Managing Forests for Climate Change Mitigation. Science 2008, 320, 1456–1457. [Google Scholar] [CrossRef] [PubMed] [Green Version]
  3. Special Report on Climate Change and Land—IPCC Site. Available online: https://www.ipcc.ch/srccl/ (accessed on 6 November 2022).
  4. Harris, N.L.; Gibbs, D.A.; Baccini, A.; Birdsey, R.A.; de Bruin, S.; Farina, M.; Fatoyinbo, L.; Hansen, M.C.; Herold, M.; Houghton, R.A.; et al. Global Maps of Twenty-First Century Forest Carbon Fluxes. Nat. Clim. Chang. 2021, 11, 234–240. [Google Scholar] [CrossRef]
  5. Cuny, H.E.; Rathgeber, C.B.K.; Frank, D.; Fonti, P.; Mäkinens, H.; Prislan, P.; Rossi, S.; del Castillo, E.M.; Campelo, F.; Vavrčík, H.; et al. Woody Biomass Production Lags Stem-Girth Increase by over One Month in Coniferous Forests. Nature Plants 2015, 1, 15160. [Google Scholar] [CrossRef] [PubMed]
  6. Pan, Y.; Birdsey, R.A.; Fang, J.; Houghton, R.; Kauppi, P.E.; Kurz, W.A.; Phillips, O.L.; Shvidenko, A.; Lewis, S.L.; Canadell, J.G.; et al. A Large and Persistent Carbon Sink in the World’s Forests. Science 2011, 333, 988–993. [Google Scholar] [CrossRef] [Green Version]
  7. Huang, J.-G.; Ma, Q.; Rossi, S.; Biondi, F.; Deslauriers, A.; Fonti, P.; Liang, E.; Mäkinen, H.; Oberhuber, W.; Rathgeber, C.B.K.; et al. Photoperiod and Temperature as Dominant Environmental Drivers Triggering Secondary Growth Resumption in Northern Hemisphere Conifers. Proc. Natl. Acad. Sci. USA 2020, 117, 20645–20652. [Google Scholar] [CrossRef]
  8. Jacoby, G.C.; D’Arrigo, R.D. Tree Rings, Carbon Dioxide, and Climatic Change. Proc. Natl. Acad. Sci. USA 1997, 94, 8350–8353. [Google Scholar] [CrossRef] [Green Version]
  9. Cohen, W.B.; Yang, Z.; Stehman, S.V.; Schroeder, T.A.; Bell, D.M.; Masek, J.G.; Huang, C.; Meigs, G.W. Forest Disturbance across the Conterminous United States from 1985–2012: The Emerging Dominance of Forest Decline. For. Ecol. Manag. 2016, 360, 242–252. [Google Scholar] [CrossRef]
  10. Chen, L.; Huang, J.-G.; Alam, S.A.; Zhai, L.; Dawson, A.; Stadt, K.J.; Comeau, P.G. Drought Causes Reduced Growth of Trembling Aspen in Western Canada. Glob. Chang. Biol. 2017, 23, 2887–2902. [Google Scholar] [CrossRef]
  11. Phillips, O.L.; Aragão, L.E.O.C.; Lewis, S.L.; Fisher, J.B.; Lloyd, J.; López-González, G.; Malhi, Y.; Monteagudo, A.; Peacock, J.; Quesada, C.A.; et al. Drought Sensitivity of the Amazon Rainforest. Science 2009, 323, 1344–1347. [Google Scholar] [CrossRef] [Green Version]
  12. Beck, P.S.A.; Juday, G.P.; Alix, C.; Barber, V.A.; Winslow, S.E.; Sousa, E.E.; Heiser, P.; Herriges, J.D.; Goetz, S.J. Changes in Forest Productivity across Alaska Consistent with Biome Shift: Changes in Forest Productivity across Alaska. Ecology Lett. 2011, 14, 373–379. [Google Scholar] [CrossRef]
  13. Nitschke, C.R.; Nichols, S.; Allen, K.; Dobbs, C.; Livesley, S.J.; Baker, P.J.; Lynch, Y. The Influence of Climate and Drought on Urban Tree Growth in Southeast Australia and the Implications for Future Growth under Climate Change. Landsc. Urban Plan. 2017, 167, 275–287. [Google Scholar] [CrossRef]
  14. Goldblum, D.; Rigg, L.S. Tree Growth Response to Climate Change at the Deciduous–Boreal Forest Ecotone, Ontario, Canada. Can. J. For. Res. 2005, 35, 11. [Google Scholar] [CrossRef]
  15. Huang, J.-G.; Bergeron, Y.; Berninger, F.; Zhai, L.; Tardif, J.C.; Denneler, B. Impact of Future Climate on Radial Growth of Four Major Boreal Tree Species in the Eastern Canadian Boreal Forest. PLoS ONE 2013, 8, e56758. [Google Scholar] [CrossRef] [PubMed] [Green Version]
  16. Sidorova, O.V.; Vaganov, E.A.; Naurzbaev, M.M.; Shishov, V.V.; Hughes, M.K. Regional Features of the Radial Growth of Larch in North Central Siberia According to Millennial Tree-Ring Chronologies. Russ. J. Ecol. 2007, 38, 90–93. [Google Scholar] [CrossRef]
  17. Dixon, R.K.; Brown, S.; Houghton, R.A.; Solomon, A.M.; Trexler, M.C.; Wisniewski, J. Carbon Pools and Flux of Global Forest Ecosystems. Sci. New Ser. 1994, 263, 185–190. [Google Scholar] [CrossRef]
  18. Shepashenko, D.; Shvidenko, A.; Nilsson, S. Phytomass (Live Biomass) and Carbon of Siberian Forests. Biomass Bioenergy 1998, 14, 21–31. [Google Scholar] [CrossRef]
  19. Kharlamova, N.; Sukhova, M.; Chlachula, J. Present Climate Development in Southern Siberia: A 55-Year Weather Observations Record. IOP Conf. Ser. Earth Environ. Sci. 2019, 395, 012027. [Google Scholar] [CrossRef] [Green Version]
  20. Kharuk, V.I.; Im, S.T.; Petrov, I.A. Warming Hiatus and Evergreen Conifers in Altay-Sayan Region, Siberia. J. Mt. Sci. 2018, 15, 2579–2589. [Google Scholar] [CrossRef]
  21. Zhirnova, D.F.; Belokopytova, L.V.; Krutovsky, K.V.; Kholdaenko, Y.A.; Babushkina, E.A.; Vaganov, E.A. Spatial-Coherent Dynamics and Climatic Signals in the Radial Growth of Siberian Stone Pine (Pinus Sibirica Du Tour) in Subalpine Stands along the Western Sayan Mountains. Forests 2022, 13, 1994. [Google Scholar] [CrossRef]
  22. Petrov, I.A.; Kharuk, V.I.; Dvinskaya, M.L.; Im, S.T. Reaction of Coniferous Trees in the Kuznetsk Alatau Alpine Forest-Tundra Ecotone to Climate Change. Contemp. Probl. Ecol. 2015, 8, 423–430. [Google Scholar] [CrossRef]
  23. Nowacki, G.J.; Abrams, M.D. Radial-Growth Averaging Criteria for Reconstructing Disturbance Histories from Presettlement-Origin Oaks. Ecol. Monogr. 1997, 67, 225–249. [Google Scholar] [CrossRef]
  24. Stan, A.B.; Daniels, L.D. Calibrating the Radial-Growth Averaging Method for Detecting Releases in Old-Growth Forests of Coastal British Columbia, Canada. Dendrochronologia 2010, 28, 135–147. [Google Scholar] [CrossRef]
  25. Kharuk, V.I.; Ranson, K.J.; Im, S.T.; Dvinskaya, M.L. Response of Pinus Sibirica and Larix Sibirica to Climate Change in Southern Siberian Alpine Forest–Tundra Ecotone. Scand. J. For. Res. 2009, 24, 130–139. [Google Scholar] [CrossRef]
  26. Myglan, V.S.; Oidupaa, O.C.; Vaganov, E.A. A 2367-Year Tree-Ring Chronology for the Altai–Sayan Region (Mongun-Taiga Mountain Massif). Archaeol. Ethnol. Anthropol. Eurasia 2012, 40, 76–83. [Google Scholar] [CrossRef]
  27. Daniels, L.D.; Maertens, T.B.; Stan, A.B.; McCloskey, S.P.J.; Cochrane, J.D.; Gray, R.W. Direct and Indirect Impacts of Climate Change on Forests: Three Case Studies from British Columbia. Can. J. Plant Pathol. 2011, 33, 108–116. [Google Scholar] [CrossRef]
  28. Briffa, K.R.; Osborn, T.J.; Schweingruber, F.H.; Jones, P.D.; Shiyatov, S.G.; Vaganov, E.A. Tree-Ring Width and Density Data around the Northern Hemisphere: Part 1, Local and Regional Climate Signals. Holocene 2002, 12, 737–757. [Google Scholar] [CrossRef]
  29. Hellmann, L.; Agafonov, L.; Ljungqvist, F.C.; Churakova (Sidorova), O.; Düthorn, E.; Esper, J.; Hülsmann, L.; Kirdyanov, A.V.; Moiseev, P.; Myglan, V.S.; et al. Diverse Growth Trends and Climate Responses across Eurasia’s Boreal Forest. Environ. Res. Lett. 2016, 11, 074021. [Google Scholar] [CrossRef]
  30. Holmes, R.L. Computer-assisted quality control in tree-ring dating and measurement. Tree-Ring Bull. 1983, 43, 69–78. [Google Scholar]
  31. Cook, E.R.; Holmes, R.L. Users Manual for Program ARSTAN; Laboratory of Tree-Ring Research, University of Arizona: Tucson, AZ, USA, 1986. [Google Scholar]
  32. Cook, E.R.; Peters, K. Calculating Unbiased Tree-Ring Indices for the Study of Climatic and Environmental Change. Holocene 1997, 7, 361–370. [Google Scholar] [CrossRef]
  33. Melvin, T.M.; Briffa, K.R. A “Signal-Free” Approach to Dendroclimatic Standardisation. Dendrochronologia 2008, 26, 71–86. [Google Scholar] [CrossRef]
  34. Wigley, T.M.L.; Briffa, K.R.; Jones, P.D. On the Average Value of Correlated Time Series with Applications in Dendroclimatology and Hydrometeorology. J. Clim. Appl. Meteorol. 1984, 23, 201–213. [Google Scholar] [CrossRef]
  35. Cook, E.R.; Cole, J. On Predicting the Response of Forests in Eastern North America to Future Climatic Change. Clim. Chang. 1991, 19, 271–282. [Google Scholar] [CrossRef]
  36. García-Suárez, A.M.; Butler, C.J.; Baillie, M.G.L. Climate Signal in Tree-Ring Chronologies in a Temperate Climate: A Multi-Species Approach. Dendrochronologia 2009, 27, 183–198. [Google Scholar] [CrossRef] [Green Version]
  37. Rubino, D.L.; McCarthyz, B.C. Comparative Analysis of Dendroecological Methods Used to Assess Disturbance Events. Dendrochronologia 2004, 21, 97–115. [Google Scholar] [CrossRef]
  38. Altman, J. Tree-Ring-Based Disturbance Reconstruction in Interdisciplinary Research: Current State and Future Directions. Dendrochronologia 2020, 63, 125733. [Google Scholar] [CrossRef]
  39. Biondi, F.; Waikul, K. DENDROCLIM2002: A C++ Program for Statistical Calibration of Climate Signals in Tree-Ring Chronologies. Comput. Geosci. 2004, 30, 303–311. [Google Scholar] [CrossRef]
  40. Guiot, J. The Bootstrapped Response Function. Tree-Ring Bull. 1991, 51, 39–41. [Google Scholar]
  41. Briffa, K.R.; Jones, P.D.; Schweingruber, F.H.; Shiyatov, S.G.; Cook, E.R. Unusual Twentieth-Century Summer Warmth in a 1000-Year Temperature Record from Siberia. Nature 1995, 376, 156–159. [Google Scholar] [CrossRef]
  42. Panyushkina, I.P.; Hughes, M.K.; Vaganov, E.A.; Munro, M.A.R. Summer Temperature in Northeastern Siberia since 1642 Reconstructed from Tracheid Dimensions and Cell Numbers of Larix Cajanderi. Can. J. For. Res. 2003, 33, 11. [Google Scholar] [CrossRef]
  43. Allen, C.D.; Macalady, A.K.; Chenchouni, H.; Bachelet, D.; McDowell, N.; Vennetier, M.; Kitzberger, T.; Rigling, A.; Breshears, D.D.; Hogg, E.H.; et al. A Global Overview of Drought and Heat-Induced Tree Mortality Reveals Emerging Climate Change Risks for Forests. For. Ecol. Manag. 2010, 259, 660–684. [Google Scholar] [CrossRef] [Green Version]
  44. Rossi, S.; Anfodillo, T.; Cufar, K.; Cuny, H.; Deslauriers, A.; Fonti, P.; Frank, D.; Gricar, J.; Gruber, A.; Huang, J.-G.; et al. Pattern of Xylem Phenology in Conifers of Cold Ecosystems at the Northern Hemisphere. Glob. Chang. Biol. 2017, 22, 3804–3813. [Google Scholar] [CrossRef] [PubMed] [Green Version]
  45. Rosbakh, S.; Hartig, F.; Sandanov, D.V.; Bukharova, E.V.; Miller, T.K.; Primack, R.B. Siberian Plants Shift Their Phenology in Response to Climate Change. Glob. Chang. Biol. 2021, 27, 4435–4448. [Google Scholar] [CrossRef] [PubMed]
  46. Huang, J.; Tardif, J.C.; Bergeron, Y.; Denneler, B.; Berninger, F.; Girardin, M.P. Radial Growth Response of Four Dominant Boreal Tree Species to Climate along a Latitudinal Gradient in the Eastern Canadian Boreal Forest. Glob. Chang. Biol. 2010, 16, 711–731. [Google Scholar] [CrossRef]
  47. Piovesan, G.; Bernabei, M.; Di Filippo, A.; Romagnoli, M.; Schirone, B. A Long-Term Tree Ring Beech Chronology from a High-Elevation Old-Growth Forest of Central Italy. Dendrochronologia 2003, 21, 13–22. [Google Scholar] [CrossRef]
  48. Kirdyanov, A.; Hughes, M.; Vaganov, E.; Schweingruber, F.; Silkin, P. The Importance of Early Summer Temperature and Date of Snow Melt for Tree Growth in the Siberian Subarctic. Trees 2003, 17, 61–69. [Google Scholar] [CrossRef]
  49. Briffa, K.R.; Shishov, V.V.; Melvin, T.M.; Vaganov, E.A.; Grudd, H.; Hantemirov, R.M.; Eronen, M.; Naurzbaev, M.M. Trends in Recent Temperature and Radial Tree Growth Spanning 2000 Years across Northwest Eurasia. Phil. Trans. R. Soc. B 2008, 363, 2269–2282. [Google Scholar] [CrossRef]
  50. Kharuk, V.I.; Ranson, K.J.; Petrov, I.A.; Dvinskaya, M.L.; Im, S.T.; Golyukov, A.S. Larch (Larix Dahurica Turcz) Growth Response to Climate Change in the Siberian Permafrost Zone. Reg. Environ. Chang. 2019, 19, 233–243. [Google Scholar] [CrossRef] [Green Version]
  51. Petrov, I.A.; Shushpanov, A.S.; Golyukov, A.S.; Dvinskaya, M.L.; Kharuk, V.I. Dynamics of Tree and Shrub Vegetation in the Eastern Sayan Mountain Tundra. Russ. J. Ecol. 2021, 52, 399–405. [Google Scholar] [CrossRef]
  52. D’Arrigo, R.; Jacoby, G.; Frank, D.; Pederson, N.; Cook, E.; Buckley, B.; Nachin, B.; Mijiddorj, R.; Dugarjav, C. 1738 Years of Mongolian Temperature Variability Inferred from a Tree-Ring Width Chronology of Siberian Pine. Geophys. Res. Lett. 2001, 28, 543–546. [Google Scholar] [CrossRef] [Green Version]
  53. Robock, A. Volcanic Eruptions and Climate. Rev. Geophys. 2000, 38, 191–219. [Google Scholar] [CrossRef]
  54. Hantemirov, R.M.; Gorlanova, L.A.; Shiyatov, S.G. Extreme Temperature Events in Summer in Northwest Siberia since AD 742 Inferred from Tree Rings. Palaeogeogr. Palaeoclimatol. Palaeoecol. 2004, 209, 155–164. [Google Scholar] [CrossRef]
  55. Jacoby, G.C.; Workman, K.W.; D’Arrigo, R.D. Laki Eruption of 1783, Tree Rings, and Disaster for Northwest Alaska Inuit. Quat. Sci. Rev. 1999, 18, 1365–1371. [Google Scholar] [CrossRef]
  56. Stothers, R.B. Major Optical Depth Perturbations to the Stratosphere from Volcanic Eruptions: Pyrheliometric Period, 1881–1960. J. Geophys. Res. Atmos. 1996, 101, 3901–3920. [Google Scholar] [CrossRef]
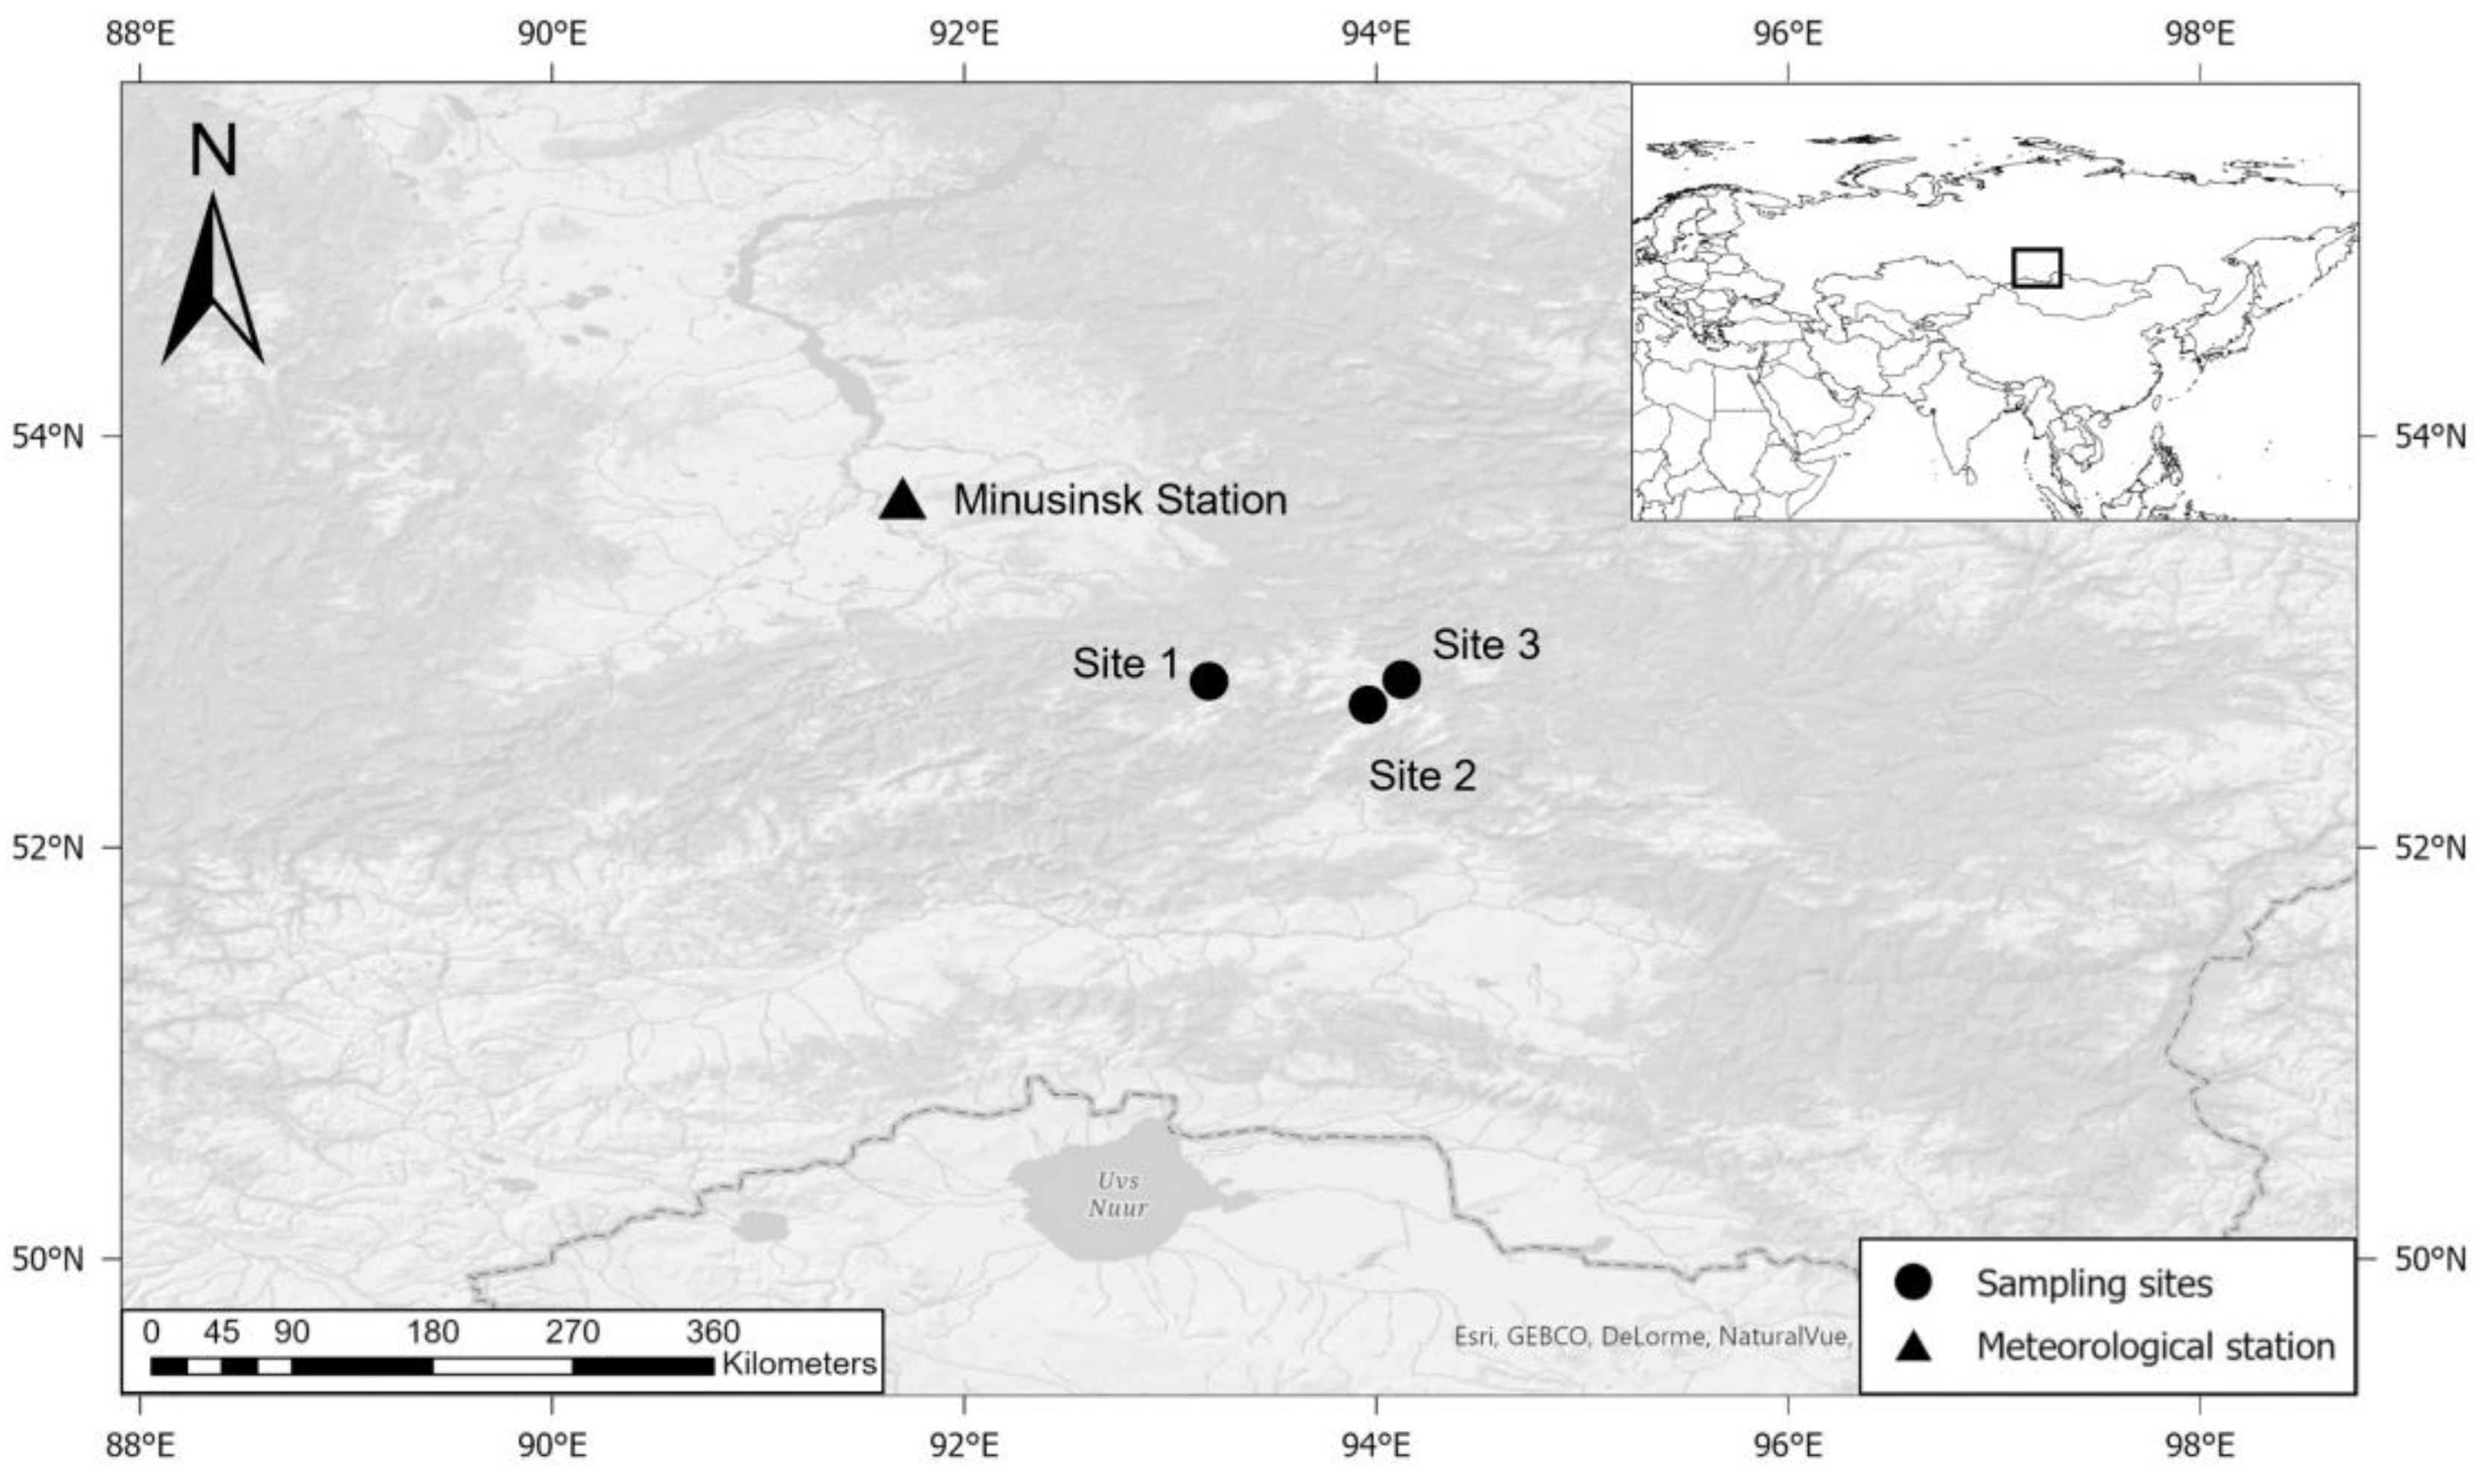
Figure 1. Locations of the sampling sites in the Sayan Mountains, Southern Siberia, Russia, and the nearest meteorological station, Minusinsk Station.
Forests 14 00463 g001
Figure 2. Monthly mean air temperature and monthly precipitation from the Minusinsk weather station from 1966 to 2018.
Forests 14 00463 g002
Figure 3. Annual mean temperature and annual precipitation from the Minusinsk weather station from 1966 to 2018.
Forests 14 00463 g003
Figure 4. (a) Regional chronology (grey line) and its 11-year moving average with a trendline from 1966 to 2006 and sample depth. (b) Percentage growth change (%GC) for the regional chronology based on a 5-year moving average with a trendline from 1966 to 2006 (the common period of %GC and climatic data). Dashed lines indicate the thresholds (mean ± 1 standard deviation), and periods above and below these lines are qualified as positive and negative growth rate anomalies, respectively. (c) May temperature with a trendline from 1966 to 2006.
Forests 14 00463 g004
Figure 5. Bootstrapped correlation coefficients of the regional chronology were established by the mean of the chronologies at three sites with monthly mean air temperature and monthly precipitation, respectively, from September of the previous year (−9) to December of the current year (12) from 1966 to 2018. Asterisk denotes that the correlation between the two variables is significant at the 95% confidence level (p < 0.05).
Forests 14 00463 g005
Figure 6. Linear regression between the regional %GC and the 5-year moving-average air temperature in May from 1966 to 2006.
Forests 14 00463 g006
Figure 7. Comparison of (a) the regional %GC, (b) 10-year moving-average reconstructed summer temperature in the Northern Urals [41], and (c) 10-year moving-average reconstructed summer temperature in Siberia [42]. Light-grey and dark-grey shaded areas highlight the periods of positive and negative growth rate anomalies in this study matching the relatively warm and cool periods of those reconstructed temperatures.
Forests 14 00463 g007
Table 1. Site information and results of the common period analysis (1762–2018).
SiteLatitudeLongitudeElevation (m a.s.l.)Cores/TreesTime SpanRbarEPSSNR
152°48′30.79″ N93°11′20.31″ E128740/201713–20180.3730.93915.475
252°41′38.70″ N93°57′32.30″ E126540/201632–20180.3680.94316.683
352°48′53.51″ N94°7′26.46″ E158240/201581–20180.4230.93915.477
Rbar, mean correlation coefficients between the cores; EPS, expressed population signal; SNR, signal-to-noise ratio.
Table 2. Summary of the positive and negative growth rate anomalies.
Positive Growth Rate AnomalyNegative Growth Rate Anomaly
PeriodAppearance (Times)/Total Duration (Years)PeriodAppearance (Times)/Total Duration (Years)
1773–1777, 1820–1824, 1872–1874, 1890–1895, 1913–1918, 1936–1942, 1994–20017/401784–1786, 1830–1835, 1863–1864, 1880–1885, 1903–1907, 1926–1929, 1966–19707/33
Disclaimer/Publisher’s Note: The statements, opinions and data contained in all publications are solely those of the individual author(s) and contributor(s) and not of MDPI and/or the editor(s). MDPI and/or the editor(s) disclaim responsibility for any injury to people or property resulting from any ideas, methods, instructions or products referred to in the content.