Article

Effects of Pruning on Vegetation Growth and Soil Properties in Poplar Plantations

1
Co-Innovation Center for Sustainable Forestry in Southern China, College of Forestry, Nanjing Forestry University, Nanjing 210037, China
2
School of Forestry and Landscape Architecture, Anhui Agricultural University, Hefei 230036, China
*
Author to whom correspondence should be addressed.
Forests 2023, 14(3), 501; https://doi.org/10.3390/f14030501
Submission received: 16 February 2023 / Revised: 24 February 2023 / Accepted: 28 February 2023 / Published: 3 March 2023

Abstract

:
Artificial pruning is an important silvicultural practice that can produce clear wood in poplar plantations. This study focused on the growth of poplar, understory vegetation diversity and soil properties in response to different pruning intensities in poplar plantations. We implemented three different pruning treatments based on the height-to-crown base (HCB) to tree height (H) ratio in Populus deltoides ‘Nanlin 3804′ plantations: CK (no pruning), a 1/3 pruning treatment and a 1/2 pruning treatment. The poplar growth conditions, understory vegetation biodiversity and soil properties were investigated for one year after pruning. Compared with CK, the 1/2 pruning treatment significantly decreased the increment of diameter at breast height (DBHi) and stem volume increment (Vi) by 16.4% and 12.8%, respectively. Meanwhile, pruning significantly promoted understory vegetation biomass and increased the Shannon–Weiner diversity index of understory vegetation, and these variables were positively correlated with pruning intensity. The 1/2 pruning treatment significantly reduced the contents of soil nitrate nitrogen (NO3-N), total inorganic nitrogen (IN) and microbial biomass nitrogen (MBN) by 21.9%, 13.9% and 22.4%, respectively. However, the 1/3 pruning treatment had no significant influence. Pruning mainlyaffectedthe soil enzyme activity in the surface (0–10 cm) layer. The 1/3 and 1/2 pruning treatments significantly decreased soil urease activity by 20.1% and 15.0%, respectively. Furthermore, nonmetric multidimensional scaling analysis showed that the seasonal variation in soil properties was significant, and significant differences among pruning treatments were mainly observed in July and October. Redundancy analysis showed that the growth of aboveground vegetation was significantly correlated with soil properties, particularly soil IN content and urease activity. Therefore, the results highlighted that pruning could promote the growth of understory vegetation and accelerate the transformation of soil nutrients. The 1/2 pruning treatment significantly inhibited the growth of poplar in terms of DBH and V, while the 1/3 pruning treatment promoted the growth of poplar in the short term. Overall, we think that the 1/3 pruning intensity is more suitable for pruning practice.

1. Introduction

Poplar is an important economic and ecological tree species in China because of its fast growth, abundant biomass and strong regeneration capacity [1]. Due to the rapid urbanization and economic development in China, the demand for wood is growing [2]. Establishing fast-growing poplar plantations is regarded as the main tool for producing more wood under reduced land area [3]. As a basic management measure in plantations, pruning plays an important role in improving trunk shape, but it is often overlooked in practice. Due to the lack of timely and correct pruning, the side branches of poplar have a greater inhibitory effect on the trunk with increasing tree height, which seriously reduces the timber quality of poplar [4].
Branches are regarded as the main components of the crown, and their growth and distribution affect the structure and functions of the crown [5]. Artificial pruning is recognized as a basic silvicultural practice that can effectively promote wood quality [6,7,8]. However, there are still contradictory conclusions about the effect of pruning on tree growth. Some researchershave reported that canopy loss could lead to a reduction in the leaf area of trees and a reduction in photosynthetic capacity, thereby inhibiting the growth of trees [3,9]. Other researchers reported that although pruning reduced leaf area, itcould improve the light andwateruse efficiency per unit area of leaves; the photosynthetic efficiency per unit area of leaves was improved, which could help trees maintain normal growth [1,10,11,12]. Trees can produce compensatory physiological responses to pruning, such as increased water use efficiency and leaf nutrient contents. These changes are dependent on species and are generally thought to be closely related to pruning intensity [13]. In plantation ecosystems, pruning can change the forest microclimate, understory vegetation and surface microenvironment, and in turn lead to changes in soil characteristics, such as changes in the soil organic matter mineralization rate and soil enzyme activities [14,15]. Tetemke et al. [16] found that pruning could change the competition between understory vegetation for light, water and other resources. On the other hand, changes in understory vegetation structure and diversity have a strong potential to alter soil nutrients and thus the growth of upper trees. Therefore, there is a tradeoff between tree growth and understory competition under different pruning intensities.
Most previous studies have mainly focused on the effects of pruning on the growth and quality of poplar [17]. However, there is little information regarding the change in soil properties after pruning and the relationship between the growth of understory vegetation and soil properties in poplar plantations. In addition, considering the complex effects of pruning on the growth of understory vegetation and soil properties, there are many contradictory conclusions from previous studies. Therefore, we focused on the growth of poplar, understory vegetation diversity and soil properties in response to different pruning intensities in poplar plantations. We hypothesized that (1) 1/3 pruning intensity would promote the growth of poplars by removing the lower branches of tree crowns that receive less light, while the 1/2 pruning treatment would inhibit the growth of poplars, and (2) 1/2 pruning intensity would promote the growth of understory vegetation by providing more resources needed for survival, accelerating soil nutrient consumption and reducing soil nutrient content. The findings could improve the comprehensive understanding of the effect of pruning intensities on the vegetation growth and soil properties, and could also provide a scientific basis for the successful management of poplar plantations.

2. Materials and Methods

2.1. StudyArea

This study was conducted at Linchaichang Forestry Farm (118°32′48″ E, 33°39′15″ N), which is located in Suqian City, Jiangsu Province, China. This area is located in a plain area and belongs to the warm temperate monsoon climate zone, with an average annual air temperature of 14.2 °C, an average annual precipitation of 910 mm, and a total annual sunshine duration of 2291 h. The soil is developed fromlacustrine sediments, and the mineral soil of this area is with a clay texture (pH 7.8–8.5). We selected Populus deltoides ‘Nanlin 3804′ as the research material, which is a male clone and was certified as a national genetically improved tree variety in 2010. The poplar (Populus deltoides ‘Nanlin 3804′) plantation was established in the spring of 2014 by using 1-year-old seedlings with 6 m × 8 m row spacing (6 m plant spacing in the south–north direction and 8 m row spacing in the east–west direction). More than 95% of the trees were conserved before the experimental design. In the first year (2014) and second year (2015) after afforestation, wheat was interplanted in this field. Thereafter, no management was applied in the plantation, supporting its transition to a natural state.

2.2. Experimental Design

In this study, three different pruning treatments (CK, no pruning; 1/3 pruning treatment; 1/2 pruning treatment) were implemented in poplar plantations based on the height-to-crown base (HCB) to tree height (H) ratio after pruning. A completely randomized design with three replicates was applied in the field experiment, resulting in a total of 9 plots. The area of each plot was 2500 m2 (50 m × 50 m), with 8 m buffer zones between adjacent plots to avoid edge effects, and the number of trees was more than 50 in each plot. We used a pole pruning saw to apply the pruning treatment in March 2018. Before pruning, the mean H was 16.90 m, the mean DBH was 21.20 cm, the mean crown diameter (CD) was 4.85 m, the mean HCB was 2.49 m and the canopy closure was 0.5.

2.3. Field Investigation

2.3.1. Growth Characteristic Investigation

In March 2018 and January 2019, H, DBH, CD and HCB were measured for each tree in each plot. Nine standard plots were set to investigate the growth characteristics of understory vegetation in October 2018. In each of the standard plots, two 1 m × 1 m subplots were set at 2 m, 4 m and 6 m on the west side of the tree row, for a total of 54 subplots. The species, quantity and coverage of understory vegetation were investigated in each subplot and used to calculate the Shannon–Weiner diversity index (H’), Menhinick’s richness index (Dm) and Pielou’s evenness index (Jsw). After the understory vegetation diversity survey, all aboveground parts of the understory vegetation were harvested and weighed in each subplot. The fresh plant samples were sealed and brought back to the laboratory, dried in an oven at 105 °C for 30 min and baked to a constant weight at 65 °C, and then the dry–fresh ratio of the understory vegetation was calculated. The biomass of understory vegetation under different treatments was calculated according to the dry–fresh ratio.
Descriptions of the investigated site are provided in Table 1 and Table 2.

2.3.2. Soil Sampling and Laboratory Analysis

In March 2018 (spring), July 2018 (summer), October 2018 (autumn) and January 2019 (winter), soil samples were obtained from the 0–10 cm, 10–20 cm and 20–50 cm soil layers at 10 points in an “S” shape in each standard plot by using a soil auger (with a diameter of 5 cm). Soil samples at each depth from each plot were mixed to create a composite sample. A total of 108 composite samples were collected. After removing the plant residues, these soil samples were transported to the laboratory for soil property analysis. Each sample was divided into two portions: one portion of the fresh samples was sieved through a 2 mm mesh for the determination of microbial biomass and inorganic nitrogen content; the second portion was air-dried and sieved through a 0.25 mm mesh for the determination of soil enzyme activities.
Soil water content (SWC) was assessed by oven drying to constant mass at 105 ℃. Soil ammonium nitrogen (NH4-N) and nitrate nitrogen (NO3-N) contents were determined in 2 mol/L KCl extracts (1:10 soil to solution ratio) using a continuous flow analyzer (Bran Luebbe Inc., AA3, Norderstedt, Germany). The soil total inorganic nitrogen (IN) content was the sum of the ammonium nitrogen (NH4-N) content and nitrate nitrogen (NO3-N) content. The soil microbial biomass in fresh soil samples was fumigated by chloroform and extracted by 0.5 mol/L K2SO4 (1:4 soil to solution ratio) [18]. The microbial biomass carbon (MBC) content in the solution was measured using a carbon analyzer (Shimadzu Inc., TOC-VCPN, Kyoto, Japan). The microbial biomass nitrogen (MBN) content was determined using a continuous flow analyzer (Bran Luebbe Inc., AA3, Norderstedt, Germany).
Soil catalase activity was expressed as the volume of 0.02 mol/L KMnO4 consumed by 1 g of soil within 20 min. Soil urease activity was expressed as the mass of ammonium nitrogen produced by consuming urea in 1 g of soil over 1 h. Soil saccharase activity was expressed as the mass of glucose produced by 1 g of soil within 24 h [19,20].

2.4. Data Calculations and Statistical Analysis

2.4.1. Data Calculations

Stem volume was calculated from the following equation [21]:
V = 0.0000267 × (H + 3) × DBH2
where V is the stem volume of the tree (m3), DBH is the diameter at breast height of the tree (cm) and H is the tree height (m).
The annual growth of trees (Hi, DBHi, CDi and Vi) was the difference between the growth indicators (H, DBH, CD and V) investigated in March 2018 and January 2019.
Understory vegetation diversity was calculated by the following equation [22]:
The   Shannon Weiner   diversity   index   ( H ) : H = i = 1 S P i ln P i Menhinick s   richness   index   ( D m ) : D m = S / N Pielou s   evenness   index   ( J s w ) : J s w = H / ln S
where Pi is the proportion of species i in each subplot, S is the total number of species in each subplot and N is the total number of vegetation species i in each subplot.

2.4.2. Statistical Analysis

In this study, one-way ANOVA (SPSS 22, IBM-SPSS Inc., Chicago, IL, USA) was used to analyze the differences in poplar growth indexes and understory vegetation biodiversity indexes among different pruning treatments, and Duncan’s method was used to test for significance of the differences. A repeated measures ANOVA was conducted to analyze the interaction effects of pruning treatment, sampling season and soil depth on the soil properties. Nonmetric multidimensional scaling (NMDS) plots from the software CANOCO 5.0 (Microcomputer Power, Ithaca, NY, USA) were used to show clusters based on soil properties and enzyme activities under different pruning treatments during four seasons. Pearson correlation coefficients (Pearson’s R) and linear fit analysis were used to reveal the relationships between soil properties and soil enzyme activities using SPSS 22.0 software. Moreover, redundancy analysis (RDA) was used to identify the relationships among the poplar growth index, understory vegetation diversity and soil properties using CANOCO 5.0 software.

3. Results

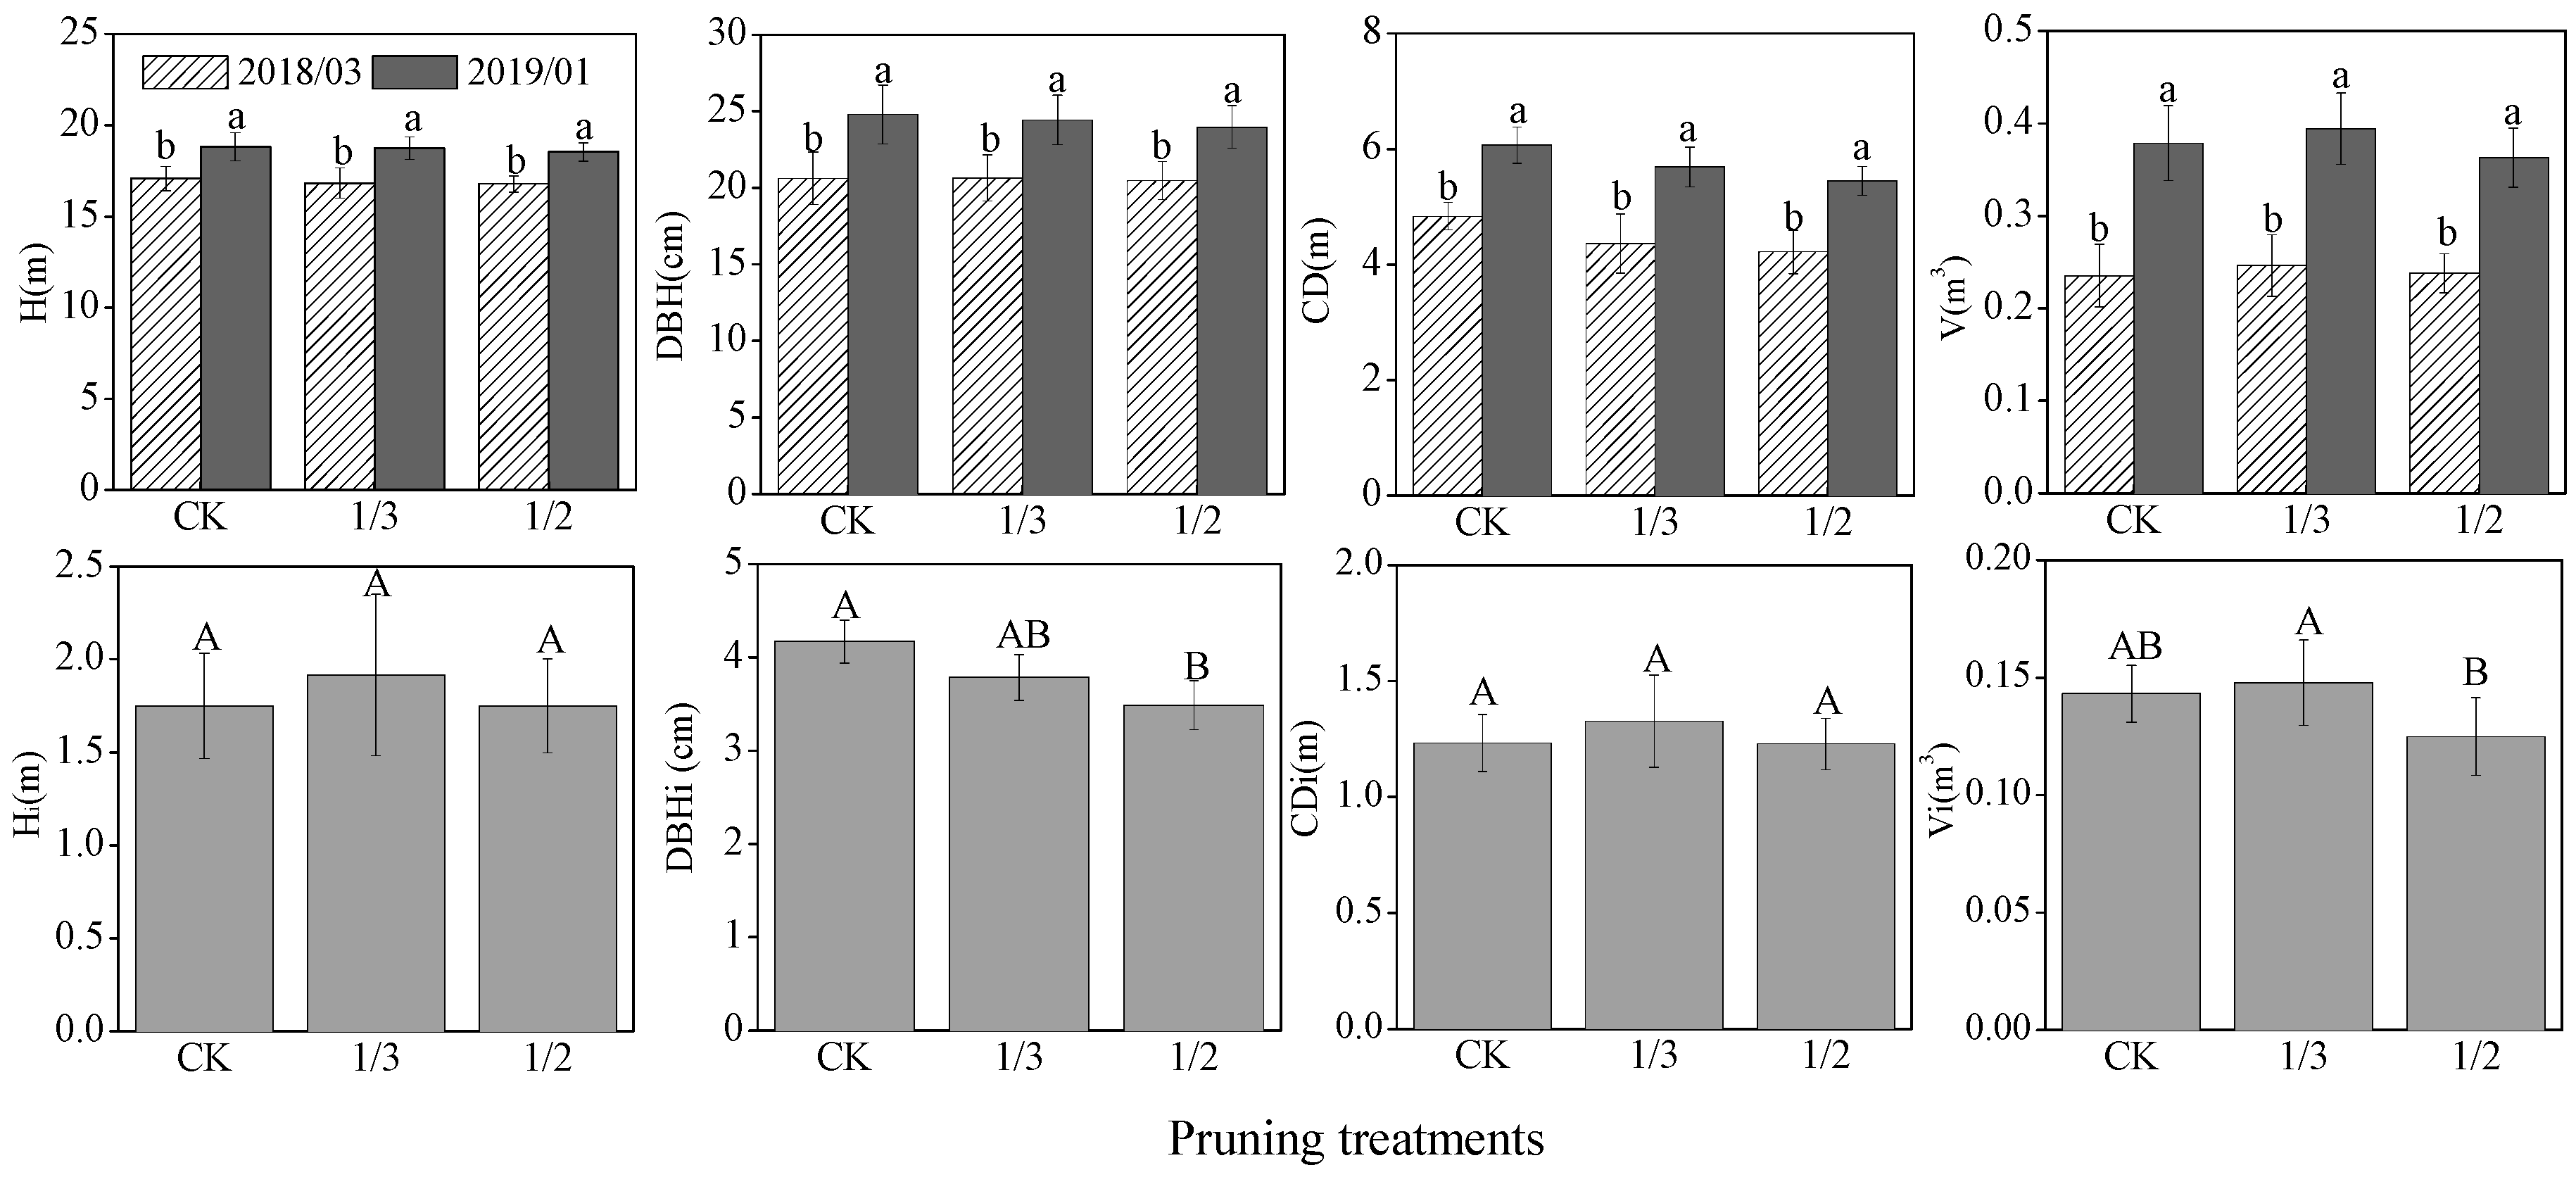
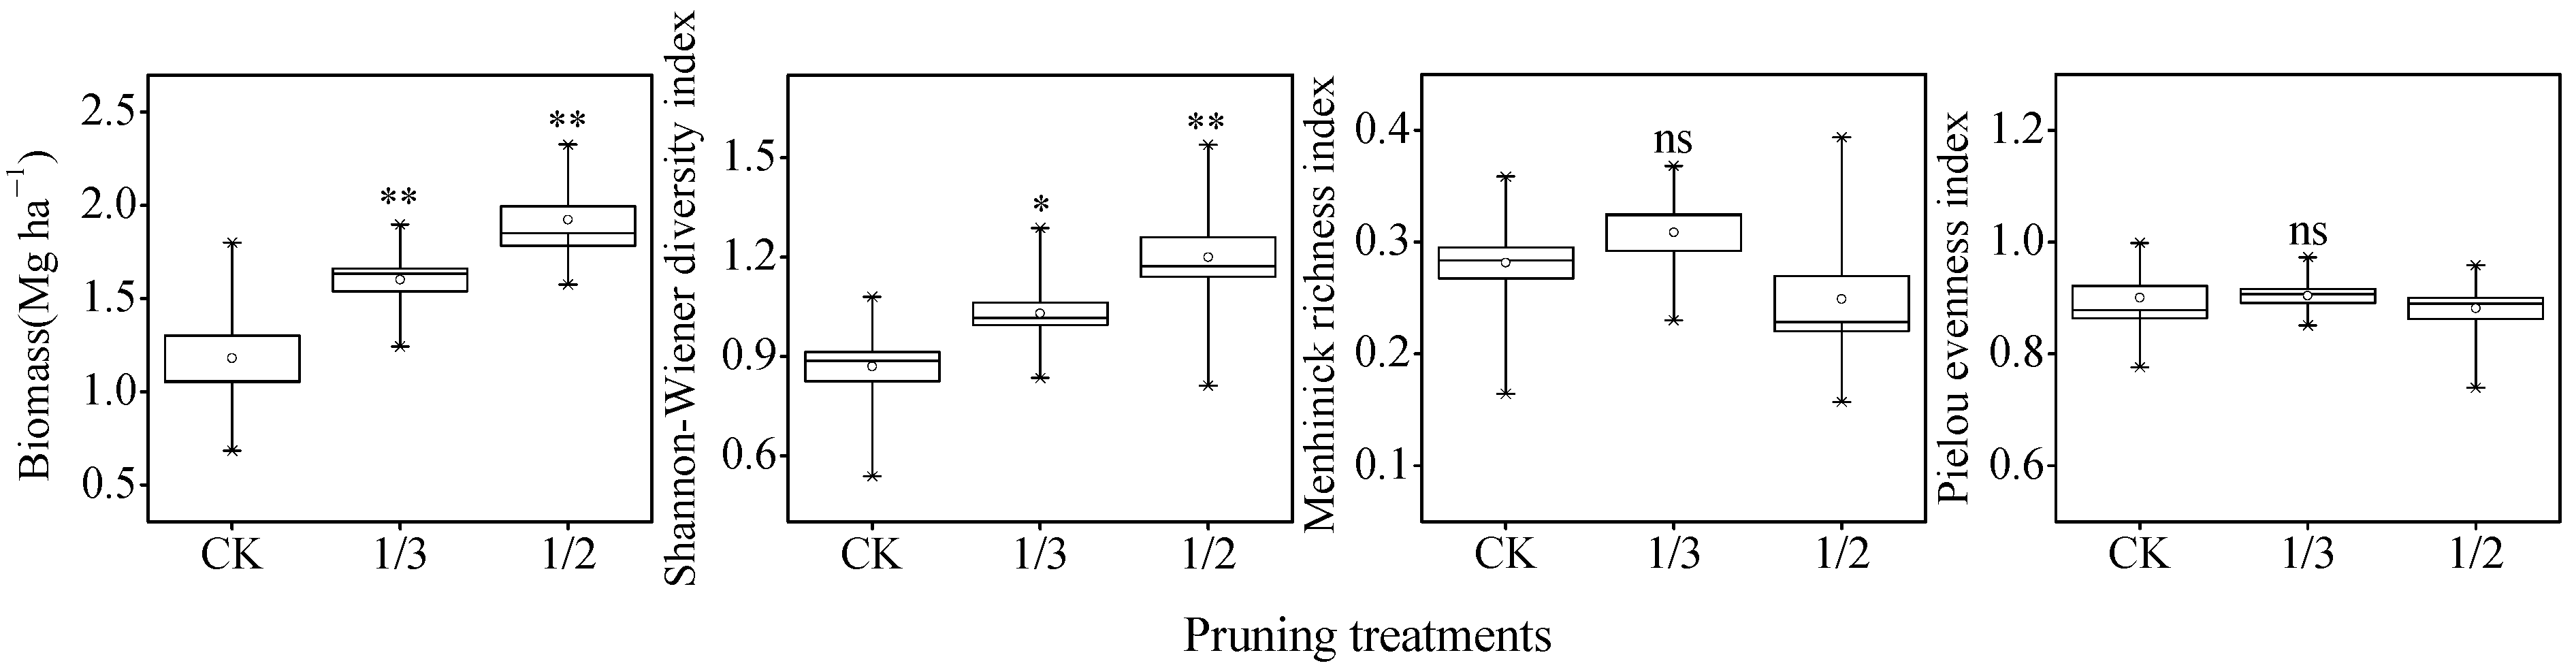
3.1. Growth of Poplar and Understory Vegetation Diversity

As shown in Figure 1, the Hi and CDi of poplar showed no significant responses to pruning treatments (p > 0.05). Compared with those in the CK treatment, the Hi and CDi of poplar in the 1/3 pruning treatment increased by 9.5% and 9.4%, respectively, but these differences were not significant (p > 0.05). The Hi and CDi of poplar in the 1/2 pruning treatment were almost the same as those in CK. In contrast, there were significant differences in the DBHi of poplar among pruning treatments. Compared with CK, the 1/2 pruning treatment significantly reduced the DBHi of poplar by 16.4% (p < 0.05). The DBHi of poplar in the 1/3 pruning treatment was lower than that in CK by 9.1%, but the difference was not significant (p > 0.05). The 1/2 pruning treatment significantly reduced the Vi of poplar by 12.8% (p < 0.05) compared with that in CK. However, the 1/3 pruning treatment increased the Vi of poplar by 3.2%, which was not a significant change (p > 0.05).
In addition, the pruning treatments significantly increased the understory vegetation biomass (Figure 2). Compared with CK, the 1/3 and 1/2 pruning treatments increased the understory vegetation biomass by 35.7% and 63.0%, respectively (p < 0.01). In contrast, pruning had weaker effects on understory vegetation diversity within one year after pruning, and only the Shannon–Weiner diversity index (H’) was significantly increased after pruning (p < 0.01). The effect of the 1/2 pruning treatment was greater than that of the 1/3 pruning treatment (p < 0.05). There were no significant differences in Menhinick’s richness indexes (Dm) or Pielou’s evenness indexes (Jsw) among the different pruning treatments.

3.2. Soil Properties

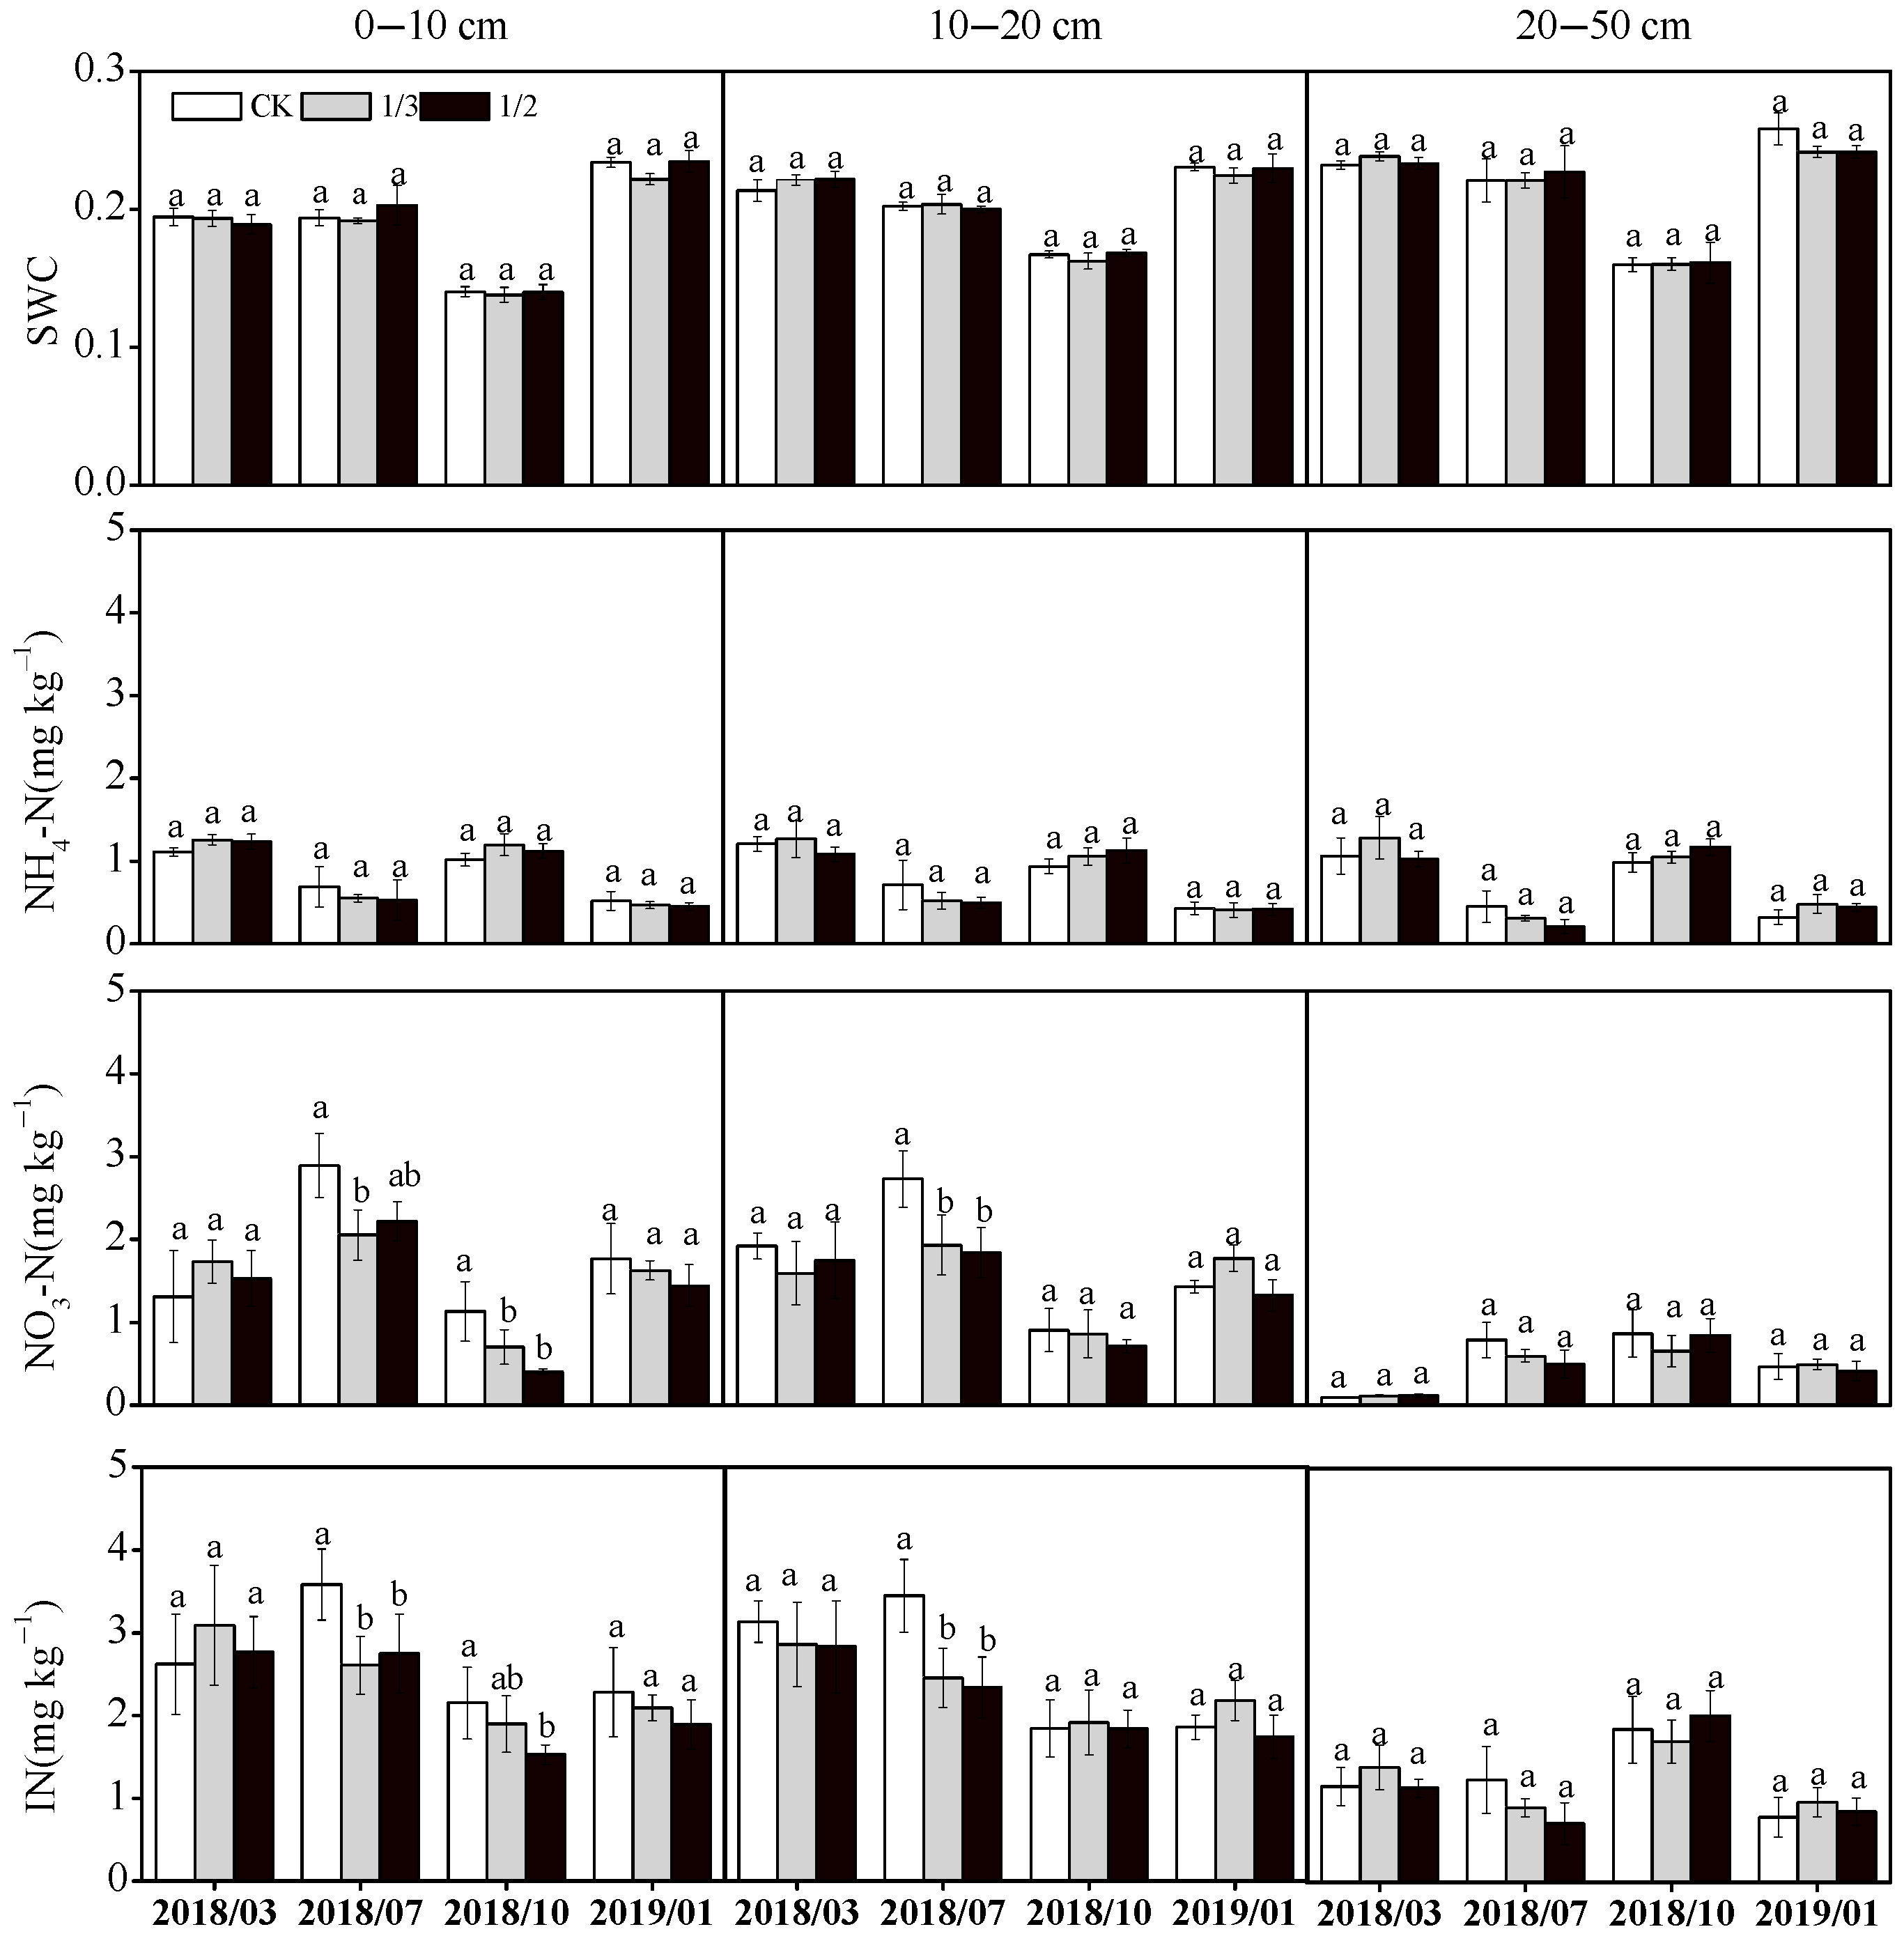
3.2.1. Soil Water and Inorganic Nitrogen Contents

The SWC and NH4-N contents showed obvious seasonal changes (p < 0.05), but there were no significant differences among the different pruning treatments (Figure 3). The contents of NO3-N and IN in the 1/3 pruning treatment and 1/2 pruning treatment were lower than those in CK, especially in July and October 2018. Compared with CK, the two pruning treatments significantly reduced the contents of NO3-N and IN in the topsoil layer (0–10 cm). The contents of NO3-N and IN under the 1/2 pruning treatment were lower by 21.9% and 13.9%, respectively (p < 0.01), than those in CK. However, the NO3-N and IN contents of the 10–20 cm soil layer under the two pruning treatments were significantly lower than those in CK in July 2018 (p < 0.01). The repeated measures ANOVA showed significant effects of the interaction between pruning treatments and sampling seasons onNH4-N, NO3-N and IN (Table 3).

3.2.2. Soil Microbial Biomass

As shown in Figure 4, the pruning treatment significantly affected the MBC content (p < 0.05). In the 0–10 cm soil layer, the MBC content under the 1/3 pruning treatment was significantly lower than that under the CK and 1/2 pruning treatments (p < 0.01). However, there was no significant difference in the MBC content among the three treatments in the 10–20 cm and 20–50 cm soil layers. In the 0–10 cm soil layer, the two pruning treatments showed significantly lower MBN contents than CK in July 2018, while the content of MBN in the 1/3 pruning treatment was significantly lower than that in CK only in October 2018, with a change of 15.8%–29.1% (p < 0.05). In the 10–20 cm soil layer, compared with CK, the 1/2 pruning treatment significantly reduced the MBN content (p < 0.05). However, there was no significant difference in the MBN content among the three pruning treatments in the 20–50 cm soil layer (p > 0.05). The interaction effects of pruning treatment and sampling season on MBC and MBN were not significant (Table 3).

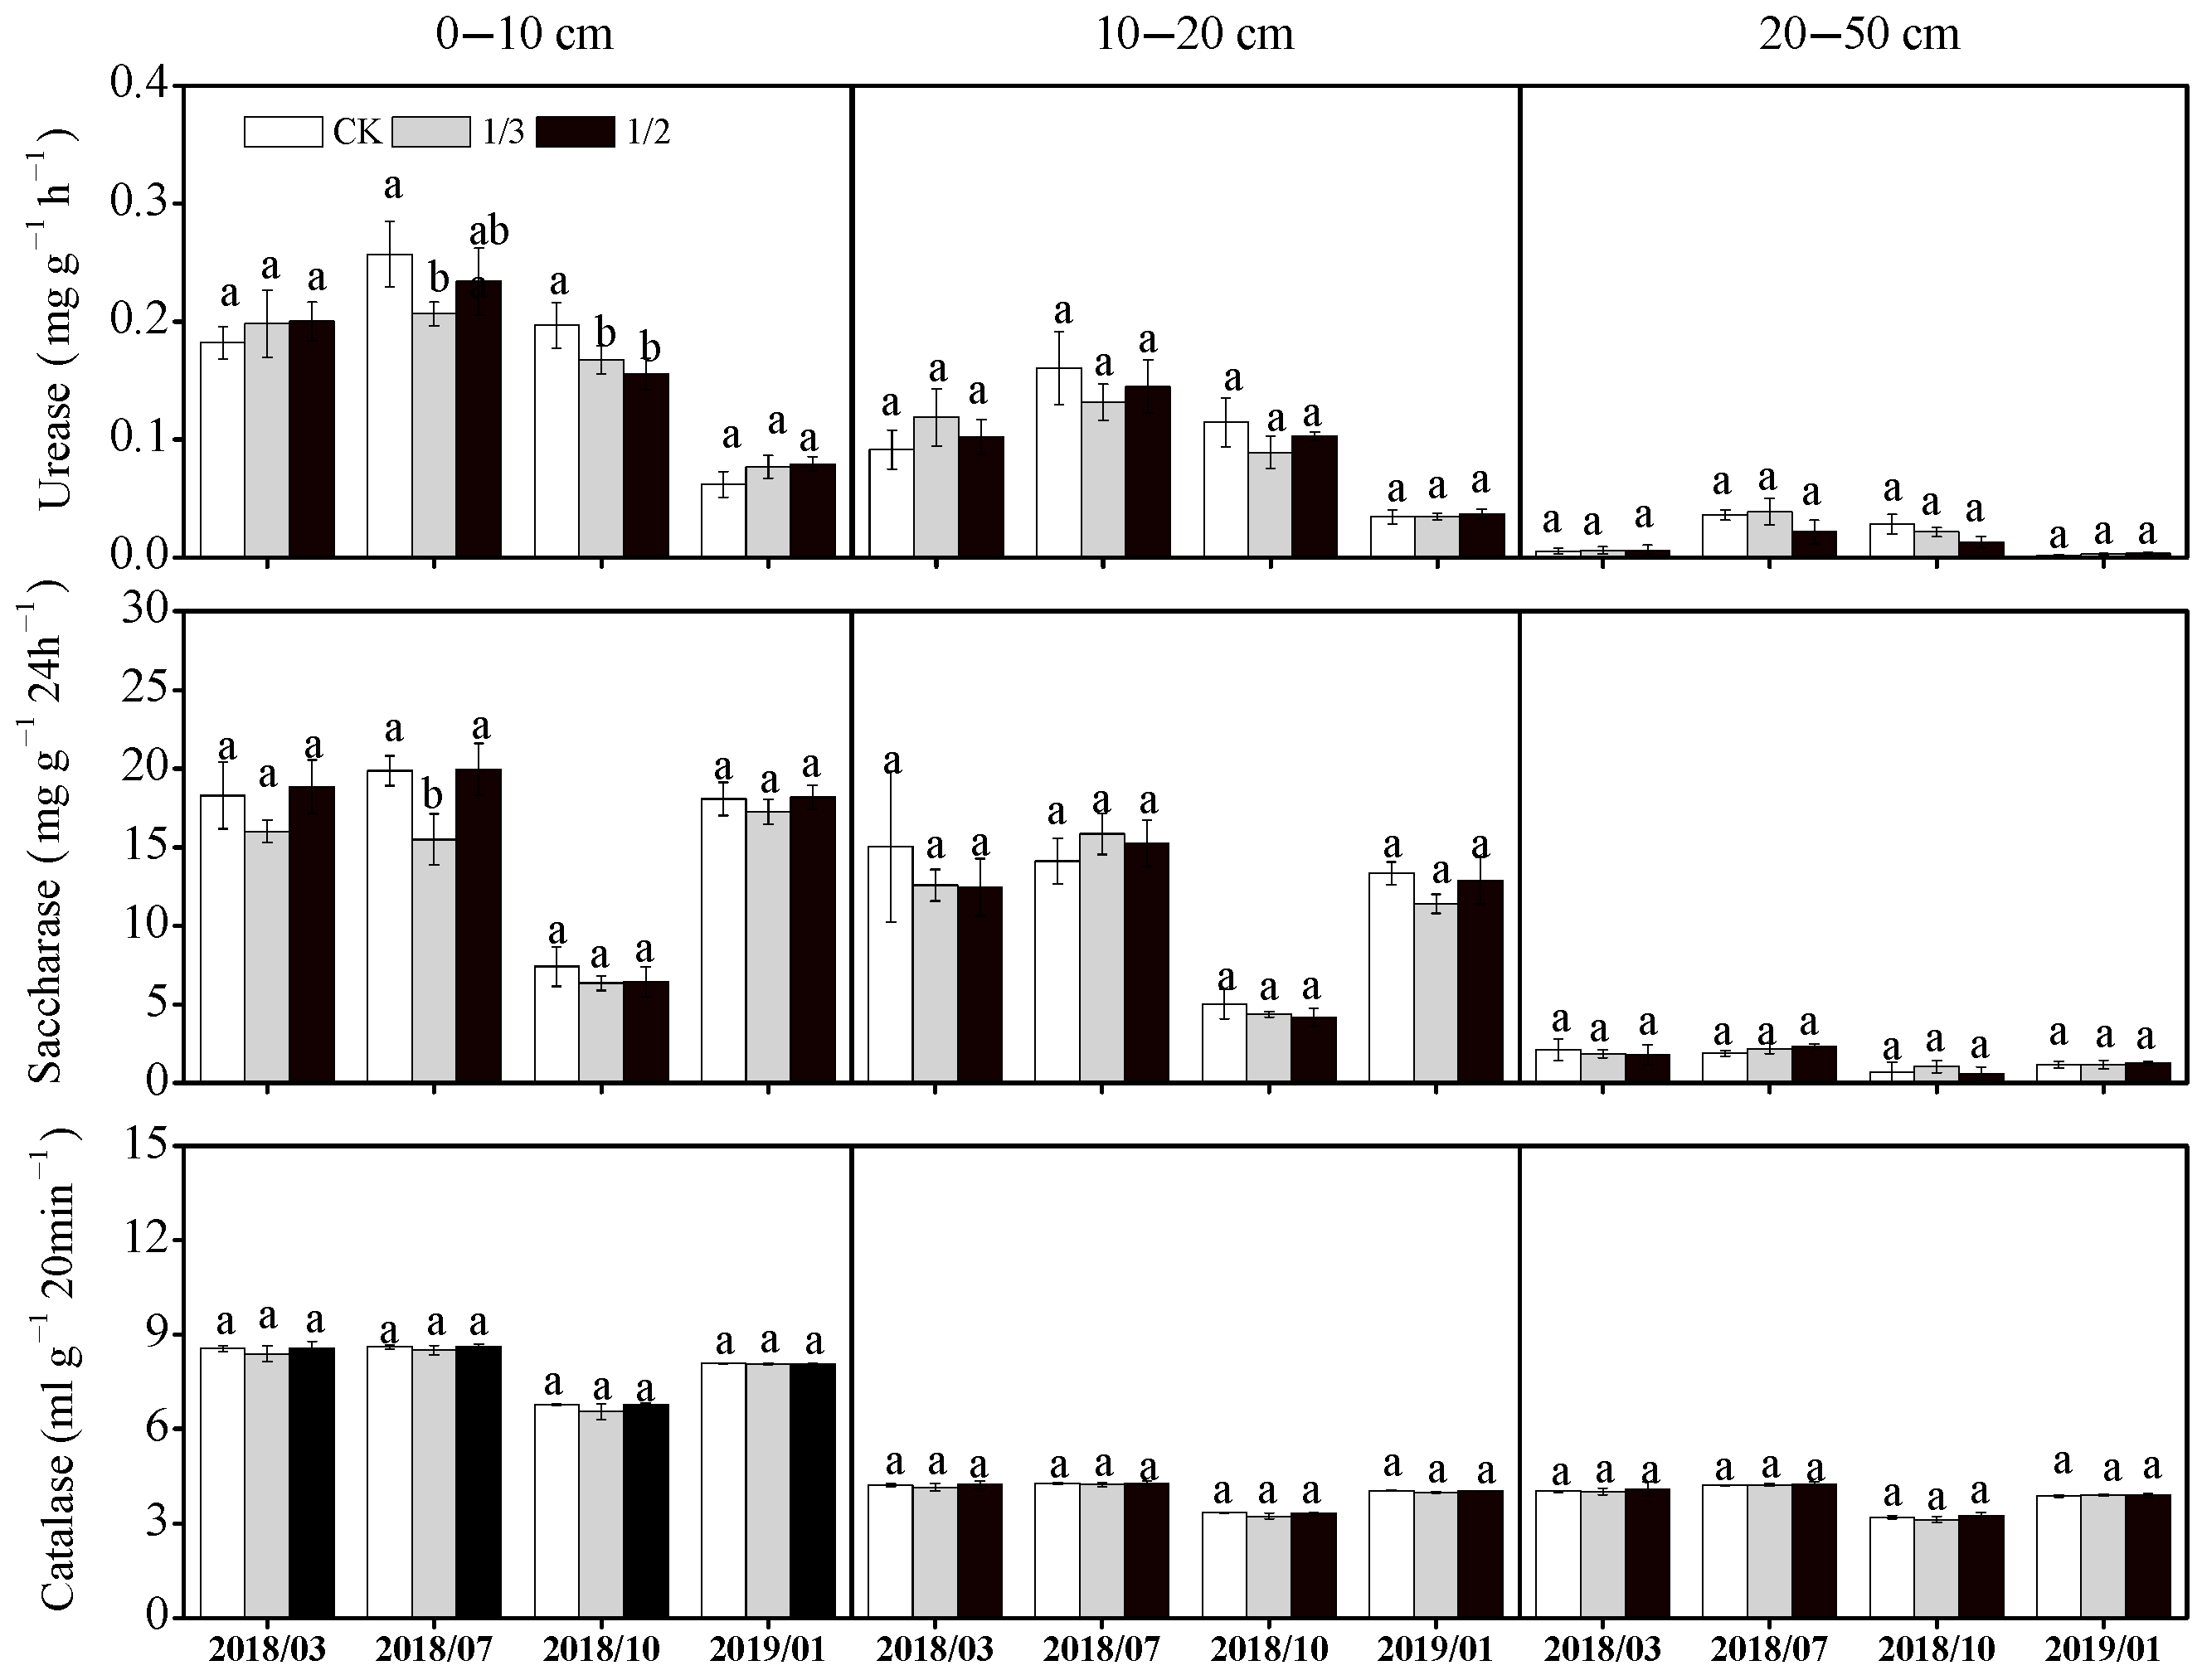
3.2.3. Soil Enzyme Activities

As shown in Figure 5, the activities of three soil enzymes responded differently to the changes in pruning treatment, of which soil urease activity had the most significant response to pruning intensity. In July 2018 and October 2018, compared with CK, pruning significantly decreased the average soil urease activity, and the soil urease activities in the 0–10 cm soil layer under the 1/3 and 1/2 pruning treatments decreased by 20.1% and 15.0%, respectively (p < 0.05). The responses of soil saccharase activity to pruning were mainly concentrated in the 0–10 cm soillayer, and the average activity of the 1/3 pruning treatment during the four seasons decreased by 13.3% compared with that in CK. After July 2018, there were no significant differences in soil saccharase activities among the three treatments. In addition, no significant impact was observed for soil catalase activities among the different treatments. The pruning treatments and sampling seasons showed significant interaction effects on various soil enzyme activities, except for saccharase activities (Table 3).

3.2.4. Nonmetric Multidimensional Scaling Analysis of Soil Properties and Enzyme Activities

Nonmetric multidimensional scaling (NMDS) analysis was used to show the response of soil properties and enzyme activities in the 0–50 cm soil layer to the three pruning treatments during four seasons. As the dispersion of different points shows in Figure 6, soil properties and enzyme activities clustered more strongly on the basis of temporal variation than on the basis of pruning treatment. However, the cluster of sample points for CK was distant from those for the 1/3 and 1/2 pruning treatments in October 2018.

3.3. Relationship between Soil Properties and Soil Enzyme Activities

The linear fitting and Pearson correlation coefficient (Pearson’s R) results revealed an overall significant correlation between soil properties and soil enzyme activities in the poplar plantation after pruning treatments. As shown in Figure 7, the linear relationships between SWC (p < 0.05) and IN (p < 0.01) and catalase activities were significant and positive, and the other enzyme activities (saccharase and urease) were significantly correlated with soil properties (p < 0.01), except for saccharase and SWC. Additionally, the Pearson correlation coefficients between SWC and IN and the three soil enzyme activities were higher than those between the MBC and MBN contents and soil enzyme activities, which implied that the three enzymes were more sensitive to changes in SWC and IN.

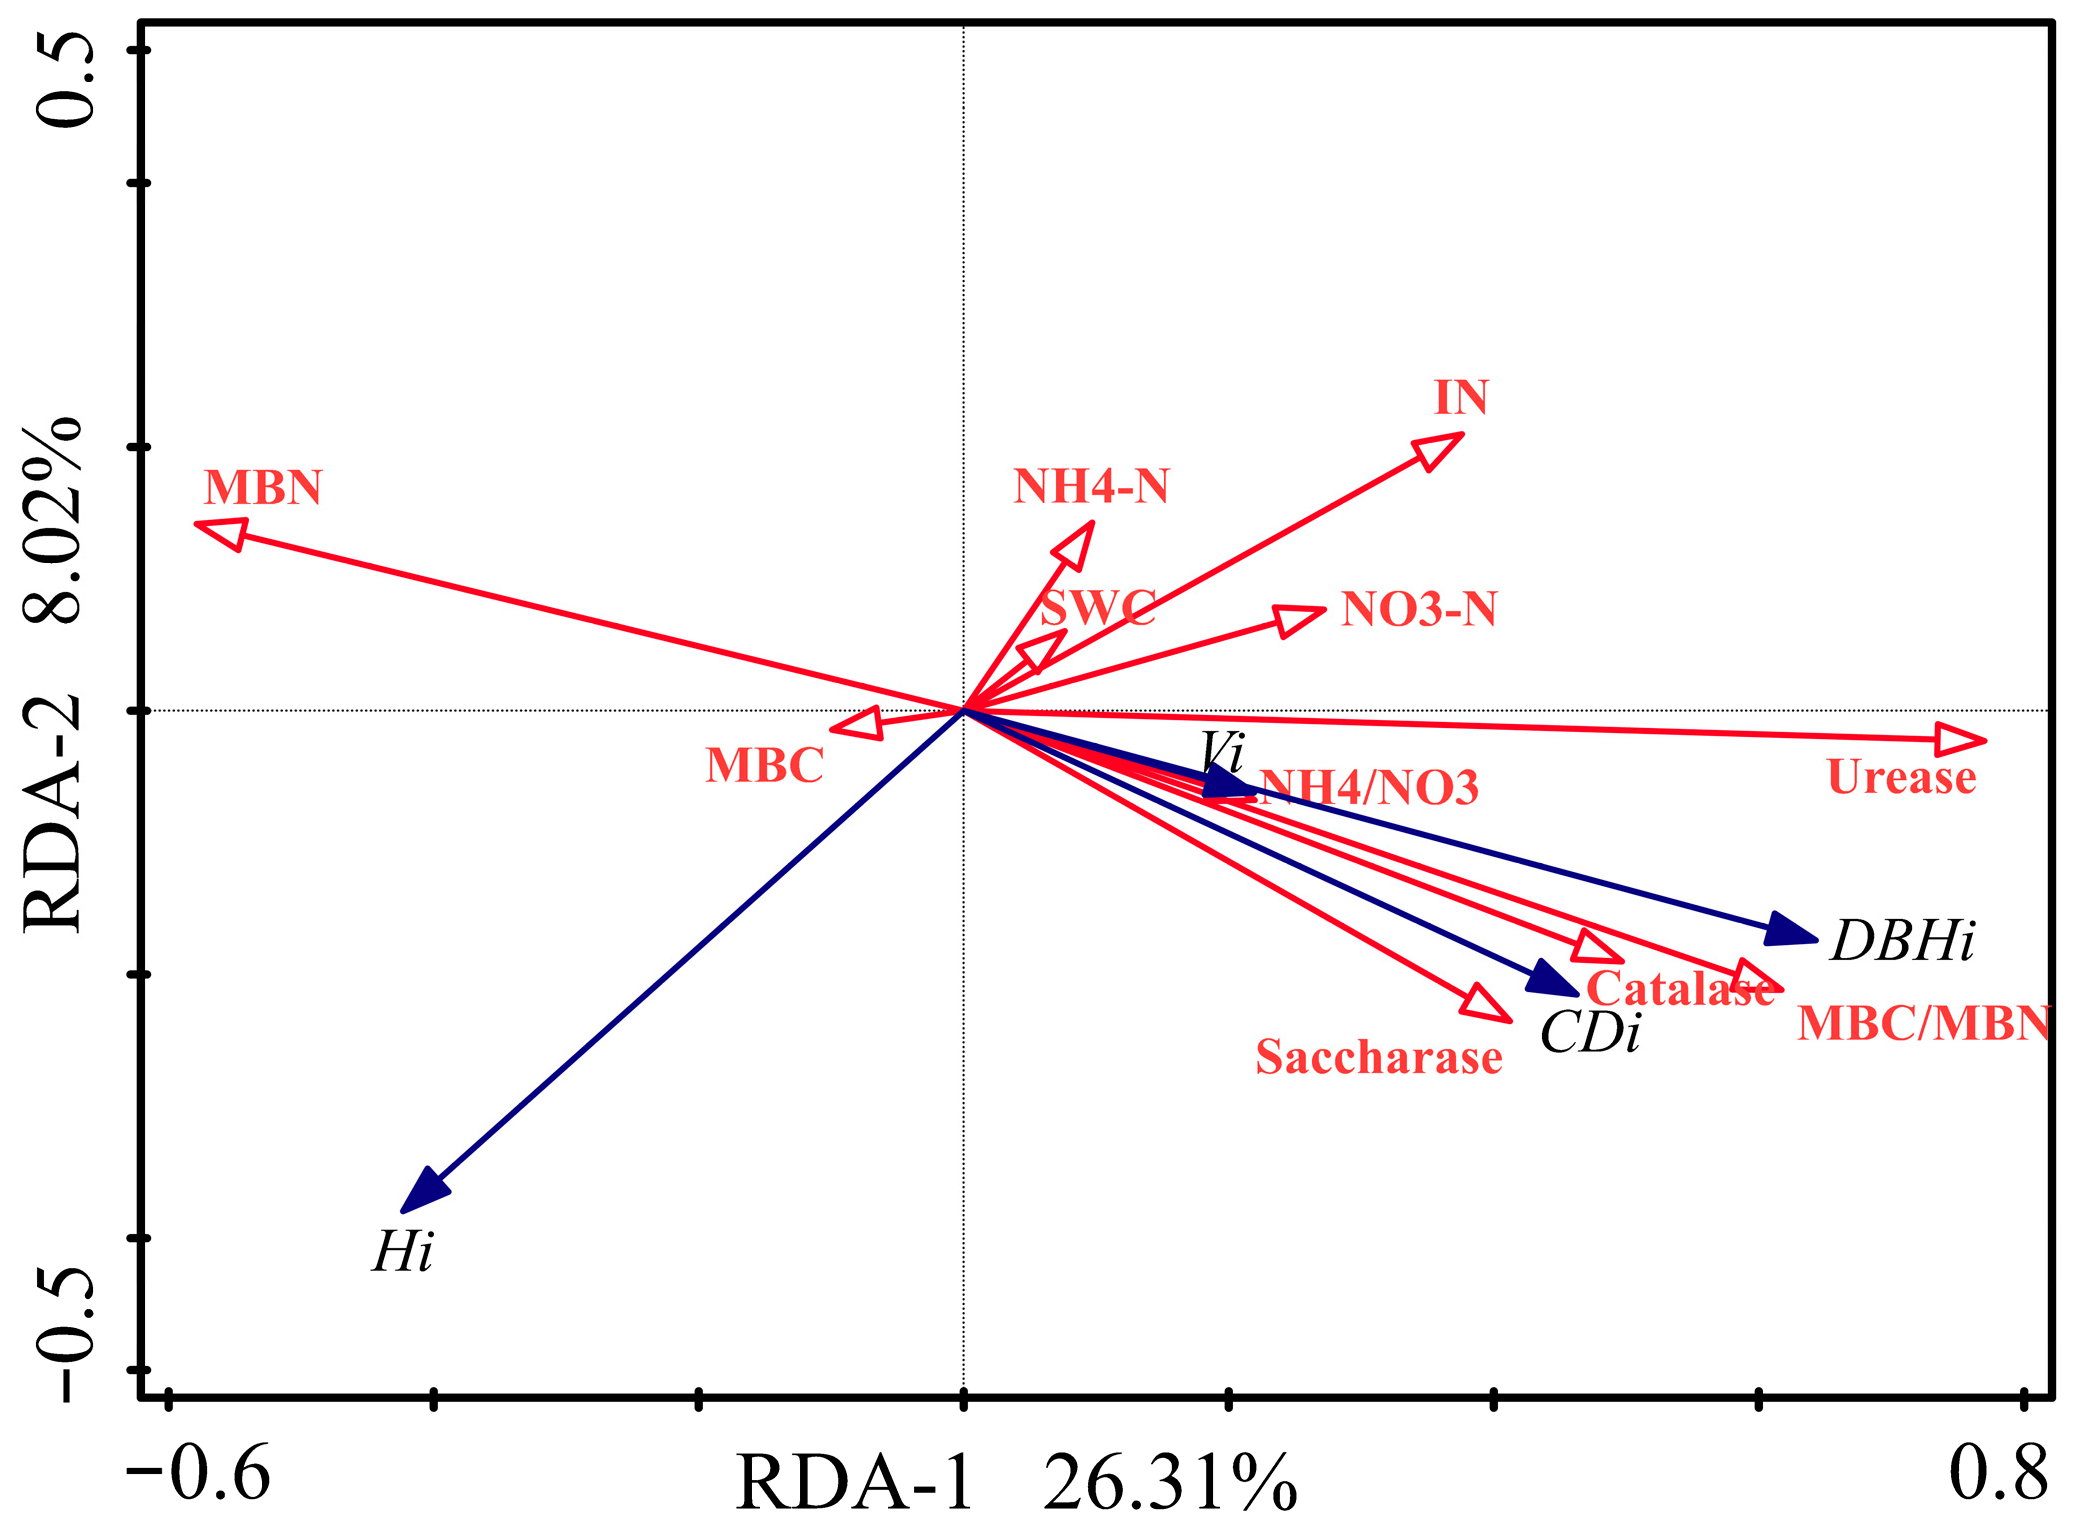
3.4. Relationships among Poplar Growth, Understory Vegetation Characteristics and Soil Properties

The RDA results in Figure 8 indicated that Hi, CDi and DBHi were significantly affected by soil properties. CDi had a negative correlation with MBN (p < 0.05); in contrast, CDi had a positive correlation with IN (p < 0.05). There was a positive correlation between DBHi and soil properties, particularly for IN (p < 0.05). Moreover, urease activities had the greatest influence on the growth of poplar, followed by catalase, among the three soil enzyme activities (p < 0.05). Among the soil available nutrients, MBN and IN had a large influence on the growth of poplar.
Figure 9 shows that there was a significant negative correlation between understory vegetation biomass and soil available nutrients such as NH4-N, NO3-N and IN (p < 0.01). On the basis of soil enzyme activities, catalase was the only soil enzyme that had a significant positive correlation with understory vegetation biomass (p < 0.05). The Shannon–Weiner diversity index and Menhinick’s richness index of understory vegetation had a significant negative correlation with NH4-N, NO3-N, IN and catalase (p < 0.05), and the Shannon–Weiner diversity index had a significant positive correlation with catalase (p < 0.05). Pielou’s evenness index was positively correlated with catalase (p < 0.01) but significantly negatively correlated with NH4-N, IN and NH4/NO3 (p < 0.05). Generally, SWC, MBN, saccharase and urease were not significantly correlated with understory vegetation.

4. Discussion

4.1. Effects of Pruning Intensity on Poplar Growthand Understory Vegetation

Tree growth mainly relies on leaf photosynthesis to produce and accumulate carbohydrates, and pruning is recognized as a basic silvicultural practice that plays an important role in improving stem shape and timber quality [23]. Previous studies have suggested that pruning reduces the height and diameter growth of trees [24,25,26,27,28]. However, we found that the 1/3 pruning treatment had a certain negative effect on the DBHi of poplar and had a positive influence on the height increment (Hi), crown diameter (CDi) and volume (Vi) growth of poplar. The 1/2 pruning treatment significantly reduced the DBHi and Vi of poplar (Figure 1). These results are consistent with those of some previous studies [9,29,30]. It is likely that pruning reduced the leaf area and transpiration of trees, but the light use efficiency, water use efficiency and CO2 assimilation rate of leaves per unit area might be improved correspondingly [31,32,33], further maintaining the growth of trees at a normal level [10,12,13]. Maurin and DesRochers [3] found that pruning increased the N content of leaves and improved the net photosynthesis of the remaining leaves in hybrid poplar. In our study, the intensity of the 1/3 pruning treatment was relatively low, mainly with the pruning of the lower branches of the tree crown. These branches might have a poor net photosynthetic rate due to weak light [34]. Therefore, the Hi, CDi and Vi of poplar after the 1/3 pruning treatment were higher than those of the CK. However, apart from pruning the branches with a negative net photosynthetic rate, the 1/2 treatment with a relatively high pruning intensity also included pruning the other branches that had a high net photosynthetic rate, resulting in a reduction in the total photosynthetic products in leaves and seriously affecting the DBHi and Vi of poplar [13].
Pruning changes the understory microclimate, such as light, temperature and humidity, by changing the canopy structure and increasing understory environmental heterogeneity, resulting in differences in the quantity and composition of understory vegetation and thus further affecting understory vegetation species diversity [35,36,37,38]. We found that the understory vegetation biomass increased with increasing pruning intensity within one year after pruning. This may have been caused by the accumulation of photosynthetic products, with canopy pruning improving understory light intensity and photosynthetically active radiation [39,40]. There were weaker effects of pruning on the understory vegetation diversity within one year after pruning, and only the Shannon–Weiner diversity index increased with increasing pruning intensity. It is possible that pruning greatly impacts native shade-tolerant plants, while invasive light-loving plants are not fully established in a short period, which implies a time hysteresis effect in the response of understory vegetation diversity to changes in the understory environment [41,42]. It also indicated that the Shannon–Weiner diversity index is sensitive to changes in the understory environment.

4.2. Effects of Pruning Intensity on Soil Properties in Poplar Plantations

Soil properties were greatly affected by the aboveground plants and the understory microenvironment. Our results showed significant differences in soil properties between different pruning treatments (Figure 6). These were also reported in previous experiments [43,44]. On the one hand, canopy pruning could change the understory microclimate, promote the growth of understory vegetation and increase water consumption (Figure 2). On the other hand, branch and leaf loss could decrease water consumption by leaf transpiration and thus decrease the water requirement of trees [45]. The difference in SWC between pruning intensities was also reduced, coupled with the buffering effect of understory vegetation cover. As shown in our results, there was no significant difference in SWC between the different pruning treatments (Figure 3). The content of soil inorganic nitrogen basically depends on the balance among soil nitrogen mineralization, absorption and fixation by plant roots and soil microorganisms [46]. In our study, from July 2018 to the period after pruning, the contents of soil nitrate nitrogen (NO3-N) and total inorganic nitrogen (IN) under the pruning treatments were significantly lower than those in CK (no pruning). It is likely that pruning promoted the growth of understory vegetation (Figure 2) and led to a corresponding increase in the consumption of soil inorganic nitrogen. However, other researchers reported that pruning could reduce the input of litter and thus reduce soil fertility [47]. Overall, canopy pruning significantly decreased the soil NO3-N and IN contents in the poplar plantation, but no significant difference in NH4-N content was found between pruning treatments, thus indicating that NO3-N was sensitive to environmental changes.
Understory vegetation changes affect the distribution and utilization of soil water and nutrients, thus affecting soil biological activities such as soil enzyme activities and microbial biomass [48]. Pruning improved the understory microenvironment, promoted the growth of understory vegetation and resulted in a corresponding increase in the nutrient absorption of understory vegetation from soil. In turn, this led to a decrease in soil microbial biomass and enzyme activity by decreasing soil nutrients [49]. In our study, we found that low pruning intensity (1/3 pruning treatment) significantly reduced the MBC content in the 0–10 cm soil layer, while high pruning intensity (1/2 pruning treatment) had no significant effect on the MBC content. From another perspective, high pruning intensity can be regarded as a stress to plants. Pramanik et al. [50] found that pruning stress could promote an increase in root exudates and increase the content of MBC in rhizosphere soil. However, the total consumption of MBC by tree and understory vegetation also greatly increased, causing nonsignificant changes in soil MBC. In addition, other researchers indicated that low IN content could inhibit the production of MBN in soil [51]. Our study revealed that pruning significantly decreased the soil MBN content compared with that in CK (no pruning) during the growing season (Jul 2018–Oct 2018). A possible reason for this observation is that MBN could be transformed with soil IN; therefore, soil MBN contents decreased with the high consumption of soil IN in the growing season [52].
The activities of the three soil enzymes (catalase, urease and saccharase) showed a significant change with seasonal variation and responded differently to pruning treatments (Figure 5). Starting in July 2018, soil urease activities were significantly decreased by pruning in poplar plantations compared with CK, as were the variation trends of soil IN and MBN (Figure 6 and Figure 7). This is consistent with the findings of Deng et al. [53] and Li et al. [54]—that a decrease in the soil available N pool reduced soil urease activities. Soil catalase activities showed significant seasonal changes and were positively correlated with SWC (Figure 7). However, soil catalase activities were not significantly affected by pruning and microbial biomass, which could be because of the higher pH (7.8–8.5) in our study area [55].

4.3. Relationships between Soil Properties and the Growth of Poplar Trees and Understory Vegetation

Soil nutrients are closely related to the growth of aboveground vegetation. Most of the water and nutrients required for tree growth are absorbed from the soil and dispersed through tree transpiration [56,57,58]. Numerous studies have confirmed that the biomass and diversity of understory vegetation can reflect soil nutrient quality [59,60]. We found that pruning increased the understory vegetation biomass and diversity index in poplar plantations (Figure 2). Our previous study suggested that pruning increased the understory light intensity, promoted the photosynthesis of understory vegetation and increased the absorption of soil nutrients and water by plants [61]. At the same time, the growth of aboveground vegetation also promoted the decomposition of litter and root exudates to feed back to the soil, thereby affecting soil microorganism and enzyme activities. In addition, RDA revealed that DBHi and Hi were significantly correlated with soil properties, especially soil urease and IN. Understory vegetation biomass was negatively correlated with soil NO3-N and NH4-N. The Shannon–Weiner diversity index and Menhinick’s richness index of understory vegetation were negatively correlated with soil NO3-N, NH4-N and catalase activities. The results of RDA combined with previous conclusions [62,63,64] further confirm our conclusions.
In conclusion, our short-term study demonstrates that pruning can affect the growth of aboveground vegetation and thus change soil properties in a poplar plantation. IN is the most sensitive to changes in aboveground vegetation, and the activity of soil urease displays significantly stronger responses to aboveground vegetation than other enzymes. Further research is needed to verify the long-term effects of pruning intensity on vegetation growth and soil properties.

5. Conclusions

This study concluded that low pruning intensity (1/3 pruning treatment) could promote the growth of poplar, while high pruning intensity (1/2 pruning treatment) could reduce the DBH and V growth of poplar. Pruning could improve understory vegetation biomass and the Shannon–Weiner diversity. At the same time, high pruning intensity (1/2 pruning treatment) reduced the contents of soil nitrate nitrogen (NO3-N), total inorganic nitrogen (IN) and microbial biomass nitrogen (MBN). In addition, pruning decreased soil urease activities, while there were no significant changes in soil saccharase and catalase activities after pruning. In conclusion, pruning could promote the growth of understory vegetation and change the soil inorganic nitrogen content and enzyme activity in the short term. Low pruning intensity can promote the height and volume growth of poplar, while high pruning intensity could inhibit the DBH and volume growth of poplar. The results of this study have practical significance for plantation management and provide an effective theoretical basis for the scientific management of plantations.

Author Contributions

K.H.: Methodology, Investigation, Data curation, Formal analysis, Visualization, Writing—Original draft. C.X., Z.Q. and K.Z.: Formal analysis, Methodology, Investigation, Writing—Review and editing. L.T.: Conceptualization, Funding acquisition, Methodology, Project administration, Supervision, Writing—Review and editing. All authors have read and agreed to the published version of the manuscript.

Funding

This work was funded by The National Key Research and Development Program of China (grant number 2021YFD2201202).

Data Availability Statement

Not applicable.

Conflicts of Interest

The authors declare no conflict of interest.

References

  1. Zhang, J.; Liu, L.Q. Effects of pruning intensity on nonstructural carbohydrates of Populus alba × P. talassica in the arid desert region of Northwest China. J. For. Res. 2021, 32, 823–830. [Google Scholar] [CrossRef]
  2. Arnold, R.J.; Xie, Y.J.; Luo, J.Z.; Wang, H.R.; Midgley, S.J. A tale of two genera: Exotic Eucalyptus and Acacia species in China. 2. Plantation resource development. Int. Forest. Rev. 2020, 22, 153–168. [Google Scholar] [CrossRef]
  3. Maurin, V.; DesRochers, A. Physiological and growth responses to pruning season and intensity of hybrid poplar. For. Ecol. Manag. 2013, 304, 399–406. [Google Scholar] [CrossRef]
  4. Desrochers, A.; Maurin, V.; Tarroux, E. Production and role of epicormic shoots in pruned hybrid poplar: Effects of clone, pruning season and intensity. Ann. For. Sci. 2015, 72, 425–434. [Google Scholar] [CrossRef]
  5. Ishii, H.; Clement, J.P.; Shaw, D.C. Branch growth and crown form in old coastal Douglas-fir. For. Ecol. Manag. 2000, 131, 81–91. [Google Scholar] [CrossRef]
  6. Dănescu, A.; Ehring, A.; Bauhus, J.; Albrecht, A.; Hein, S. Modelling discoloration and duration of branch occlusion following green pruning in Acer pseudoplatanus and Fraxinus excelsior. For. Ecol. Manag. 2015, 335, 87–98. [Google Scholar] [CrossRef]
  7. Wang, C.S.; Hein, S.; Zhao, Z.G.; Guo, J.J.; Zeng, J. Branch occlusion and discoloration of Betula alnoides under artificial and natural pruning. For. Ecol. Manag. 2016, 375, 200–210. [Google Scholar] [CrossRef]
  8. York, R.A. Long-term taper and growth reductions following pruning intensity treatments in giant sequoia (Sequoiadendron giganteum). Can. J. For. Res. 2019, 49, 1189–1197. [Google Scholar] [CrossRef] [Green Version]
  9. Li, R.S.; Han, J.M.; Guan, X.; Chi, Y.G.; Zhang, W.D.; Chen, L.C.; Wang, Q.K.; Xu, M.; Yang, Q.P.; Wang, S.L. Crown pruning and understory removal did not change the tree growth rate in a Chinese fir (Cunninghamia lanceolata) plantation. For. Ecol. Manag. 2020, 464, 118056. [Google Scholar] [CrossRef]
  10. Binkley, D.; Laclau, J.P.; Sterba, H. Why one tree grows faster than another: Patterns of light use and light use efficiency at the scale of individual trees and stands. For. Ecol. Manag. 2013, 288, 1–4. [Google Scholar] [CrossRef]
  11. Chen, D.Y.; Wang, Y.K.; Wang, X.; Nie, Z.Y.; Gao, Z.Y.; Zhang, L.L. Effects of branch removal on water use of rain-fed jujube (Ziziphus jujuba Mill.) plantations in Chinese semiarid Loess Plateau region. Agric. Water Manag. 2016, 178, 258–270. [Google Scholar] [CrossRef]
  12. Ortega-Vargas, E.; Burgueño-Ferreira, J.A.; Ávila-Reséndiz, C.; Campbell, W.B.; Jarillo-Rodríguez, J.; López-Ortiz, S. Morphological and physiological responses of Guazuma ulmifolia Lam. to different pruning dates. Agroforest. Syst. 2019, 93, 461–470. [Google Scholar] [CrossRef]
  13. Alcorn, P.J.; Bauhus, J.; Thomas, D.S.; James, R.N.; Smith, R.G.B.; Nicotra, A.B. Photosynthetic response to green crown pruning in young plantation-grown Eucalyptus pilularis and E. cloeziana. For. Ecol. Manag. 2008, 255, 3827–3838. [Google Scholar] [CrossRef]
  14. Ge, X.M.; Tian, Y.; Tang, L.Z. Nutrient distribution indicated whole-tree harvesting as a possible factor restricting the sustainable productivity of a poplar plantation system in China. PLoS ONE 2015, 10, e0125303. [Google Scholar] [CrossRef] [PubMed]
  15. Zhao, Y.; Li, M.; Deng, J.Y.; Wang, B.T. Afforestation affects soil seed banks by altering soil properties and understory plants on the eastern Loess Plateau, China. Ecol. Indic. 2021, 126, 107670. [Google Scholar] [CrossRef]
  16. Tetemke, B.A.; Birhane, E.; Rannestad, M.M.; Eid, T. Species diversity and stand structural diversity of woody plants predominantly determine aboveground carbon stock of a dry Afromontane forest in Northern Ethiopia. For. Ecol. Manag. 2021, 500, 119634. [Google Scholar] [CrossRef]
  17. Danilović, M.; Sarić, R.; Cirović, V.; Pudja, V. The impact of pruning on tree development in poplar Populus × canadensis “I-214” plantations. iForest 2022, 15, 33–37. [Google Scholar] [CrossRef]
  18. Brookes, P.C.; Landman, A.; Pruden, G.; Jenkinson, D.S. Chloroform fumigation and the release of soil nitrogen: A rapid direct extraction method to measure microbial biomass nitrogen in soil. Soil Biol. Biochem. 1985, 17, 837–842. [Google Scholar] [CrossRef]
  19. Singh, D.K.; Kumar, S. Nitrate reductase, arginine deaminase, urease and dehydrogenase activities in natural soil (ridges with forest) and in cotton soil after acetamiprid treatments. Chemosphere 2008, 71, 412–418. [Google Scholar] [CrossRef] [PubMed]
  20. Zhang, C.; Liu, G.B.; Xue, S.; Song, Z.L. Rhizosphere soil microbial activity under different vegetation types on the Loess Plateau, China. Geoderma 2011, 161, 115–125. [Google Scholar] [CrossRef]
  21. Tang, L.Z.; Wu, L.; Ge, X.M.; Tian, Y.; Dun, X.J.; Liu, D.; Fang, S.Z. Comparative studies on the growth of different poplar clones on beach land of Yangtse River. For. Res. 2013, 26, 123–128. [Google Scholar] [CrossRef]
  22. Shaheen, H.; Ullah, Z.; Khan, S.M.; Harper, D.M. Species composition and community structure of western Himalayan moist temperate forests in Kashmir. For. Ecol. Manag. 2012, 278, 138–145. [Google Scholar] [CrossRef]
  23. Ares, A.; Brauer, D. Aboveground biomass partitioning in loblolly pine silvopastoral stands: Spatial configuration and pruning effects. For. Ecol. Manag. 2005, 219, 176–184. [Google Scholar] [CrossRef]
  24. Neilsen, W.A.; Pinkard, E.A. Effects of green pruning on growth of Pinus radiata. Can. J. For. Res. 2003, 33, 2067–2073. [Google Scholar] [CrossRef]
  25. Pinkard, E.A. Effects of pattern and severity of pruning on growth and branch development of pre-canopy closure Eucalyptus nitens. For. Ecol. Manag. 2002, 157, 217–230. [Google Scholar] [CrossRef]
  26. Pinkard, E.A. Physiological and growth responses related to pattern and severity of green pruning in young Eucalyptus globulus. For. Ecol. Manag. 2003, 182, 231–245. [Google Scholar] [CrossRef]
  27. Víquez, E.; Pérez, D. Effect of pruning on tree growth, yield, and wood properties of Tectona grandis plantations in Costa Rica. Silva Fenn. 2005, 39, 381–390. [Google Scholar] [CrossRef]
  28. Zeng, B. Aboveground biomass partitioning and leaf development of Chinese subtropical trees following pruning. For. Ecol. Manag. 2003, 173, 135–144. [Google Scholar] [CrossRef]
  29. Hevia, A.; Álvarez-González, J.G.; Majada, J. Comparison of pruning effects on tree growth, productivity and dominance of two major timber conifer species. For. Ecol. Manag. 2016, 374, 82–92. [Google Scholar] [CrossRef]
  30. Springmann, S.; Rogers, R.; Spiecker, H. Impact of artificial pruning on growth and secondary shoot development of wild cherry (Prunus avium L.). For. Ecol. Manag. 2011, 261, 764–769. [Google Scholar] [CrossRef]
  31. Forrester, D.I.; Collopy, J.J.; Beadle, C.L.; Warren, C.R.; Baker, T.G. Effect of thinning, pruning and nitrogen fertiliser application on transpiration, photosynthesis and water-use efficiency in a young Eucalyptus nitens plantation. For. Ecol. Manag. 2012, 266, 286–300. [Google Scholar] [CrossRef]
  32. Forrester, D.I.; Collopy, J.J.; Beadle, C.L.; Baker, T.G. Effect of thinning, pruning and nitrogen fertiliser application on light interception and light-use efficiency in a young Eucalyptus nitens plantation. For. Ecol. Manag. 2013, 288, 21–30. [Google Scholar] [CrossRef]
  33. Lisboa, M.; Acuña, E.; Cancino, J.; Chao, F.; Muñoz, F.; Rodríguez, R.; Volker, P. Physiological response to pruning severity in Eucalyptus regnans plantations. New Forests 2014, 45, 753–764. [Google Scholar] [CrossRef]
  34. Beadle, C.; Barry, K.; Hardiyanto, E.; Irianto, R.; Junarto; Mohammed, C.; Rimbawanto, A. Effect of pruning Acacia mangium on growth, form and heart rot. For. Ecol. Manag. 2007, 238, 261–267. [Google Scholar] [CrossRef]
  35. Berrill, J.P.; Dagley, C.M.; Coppeto, S.A.; Gross, S.E. Curtailing succession: Removing conifers enhances understory light and growth of young aspen in mixed stands around Lake Tahoe, California and Nevada, USA. For. Ecol. Manag. 2017, 400, 511–522. [Google Scholar] [CrossRef]
  36. Schmidt, T.L.; Wardle, T.D. Impact of pruning eastern redcedar (Juniperus virginiana). West. J Appl. For. 2002, 17, 189–193. [Google Scholar] [CrossRef] [Green Version]
  37. Torras, O.; Saura, S. Effects of silvicultural treatments on forest biodiversity indicators in the Mediterranean. For. Ecol. Manag. 2008, 255, 3322–3330. [Google Scholar] [CrossRef]
  38. Zhao, N.X.; Xu, Y.J.; Chen, L.P.; Jiang, M.; Dong, K.; Wang, J.L.; Gao, Y.B. Species identities impact the responses of intensity and importance of competition to the soil fertility changes. Glob. Ecol. Conserv. 2021, 27, e01519. [Google Scholar] [CrossRef]
  39. Ares, A.; Louis, D.S.; Brauer, D. Trends in tree growth and understory yield in silvopastoral practices with southern pines. Agroforest. Syst. 2003, 59, 27–33. [Google Scholar] [CrossRef]
  40. Brockerhoff, E.G.; Ecroyd, C.E.; Leckie, A.C.; Kimberley, M.O. Diversity and succession of adventive and indigenous vascular understorey plants in Pinus radiata plantation forests in New Zealand. For. Ecol. Manag. 2003, 185, 307–326. [Google Scholar] [CrossRef]
  41. Halpern, C.B.; Halaj, J.; Evans, S.A.; Dovčiak, M. Level and pattern of overstory retention interact to shape long-term responses of understories to timber harvest. Ecol. Appl. 2012, 22, 2049–2064. [Google Scholar] [CrossRef]
  42. Roberts, M.W.; D’Amato, A.W.; Kern, C.C.; Palik, B.J. Long-term impacts of variable retention harvesting on ground-layer plant communities in Pinus resinosa forests. J. Appl. Ecol. 2016, 53, 1106–1116. [Google Scholar] [CrossRef] [Green Version]
  43. Lull, C.; Bautista, I.; Lidón, A.; del Campo, A.D.; González-Sanchis, M.; García-Prats, A. Temporal effects of thinning on soil organic carbon pools, basal respiration and enzyme activities in a Mediterranean Holm oak forest. For. Ecol. Manag. 2020, 464, 118088. [Google Scholar] [CrossRef]
  44. Ren, C.J.; Kang, D.; Wu, J.P.; Zhao, F.Z.; Yang, G.H.; Han, X.H.; Feng, Y.Z.; Ren, G.X. Temporal variation in soil enzyme activities after afforestation in the Loess Plateau, China. Geoderma 2016, 282, 103–111. [Google Scholar] [CrossRef]
  45. Jin, S.S.; Wang, Y.K.; Wang, X.; Bai, Y.H.; Shi, L.G. Effect of pruning intensity on soil moisture and water use efficiency in jujube (Ziziphus jujube Mill.) plantations in the hilly Loess Plateau Region, China. J. Arid Land. 2019, 11, 446–460. [Google Scholar] [CrossRef] [Green Version]
  46. Gallardo, A. Effect of tree canopy on the spatial distribution of soil nutrients in a Mediterranean Dehesa. Pedobiologia 2003, 47, 117–125. [Google Scholar] [CrossRef]
  47. Andivia, E.; Vázquez-Piqué, J.; Fernández, M.; Alejano, R. Litter production in holm oak trees subjected to different pruning intensities in Mediterranean dehesas. Agroforest. Syst. 2013, 87, 657–666. [Google Scholar] [CrossRef]
  48. Ou, Z.Y.; Pang, S.L.; He, Q.F.; Peng, Y.H.; Huang, X.R.; Shen, W.H. Effects of vegetation restoration and environmental factors on understory vascular plants in a typical karst ecosystem in southern China. Sci. Rep. 2020, 10, 12011. [Google Scholar] [CrossRef]
  49. Jennings, T.N.; Smith, J.E.; Cromack, K.; Sulzman, E.W.; McKay, D.; Caldwell, B.A.; Beldin, S.I. Impact of postfire logging on soil bacterial and fungal communities and soil biogeochemistry in a mixed-conifer forest in central Oregon. Plant Soil. 2012, 350, 393–411. [Google Scholar] [CrossRef]
  50. Pramanik, P.; Phukan, M.; Ghosh, S.; Goswami, A.J. Pruned tea bushes secrete more root exudates to influence microbiological properties in soil. Arch. Agron. Soil Sci. 2018, 64, 1172–1180. [Google Scholar] [CrossRef]
  51. Yang, Y.; Zhang, X.Y.; Zhang, C.; Wang, H.M.; Fu, X.L.; Chen, F.S.; Wan, S.Z.; Sun, X.M.; Wen, X.F.; Wang, J.F. Understory vegetation plays the key role in sustaining soil microbial biomass and extracellular enzyme activities. Biogeosciences 2018, 15, 4481–4494. [Google Scholar] [CrossRef] [Green Version]
  52. Chen, X.L.; Wang, D.; Chen, X.; Wang, J.; Diao, J.J.; Zhang, J.Y.; Guan, Q.W. Soil microbial functional diversity and biomass as affected by different thinning intensities in a Chinese fir plantation. Appl. Soil Ecol. 2015, 92, 35–44. [Google Scholar] [CrossRef]
  53. Deng, J.; Chong, Y.J.; Zhang, D.; Ren, C.J.; Zhao, F.Z.; Zhang, X.X.; Han, X.H.; Yang, G.H. Temporal variations in soil enzyme activities and responses to land use change in the Loess Plateau, China. Appl. Sci. 2019, 9, 3129. [Google Scholar] [CrossRef] [Green Version]
  54. Li, X.F.; Zhang, Y.; Ding, C.X.; Liu, Y.; Wu, K.X.; Jiang, F.Z.; Su, D.R. Water addition promotes vegetation recovery of degraded alpine meadows by regulating soil enzyme activity and nutrients in the Qinghai–Tibetan Plateau. Ecol. Eng. 2020, 158, 106047. [Google Scholar] [CrossRef]
  55. Li, J.; Zhao, B.Q.; Li, X.Y.; Jiang, R.B.; So, H.B. Effects of long-term combined application of organic and mineral fertilizers on microbial biomass, soil enzyme activities and soil fertility. Agric. Sci. China 2008, 7, 336–343. [Google Scholar] [CrossRef]
  56. Rivaie, A.A. The effects of understory vegetation on P availability in Pinus radiata forest stands: A review. J. For. Res. 2014, 25, 489–500. [Google Scholar] [CrossRef]
  57. Su, X.P.; Wang, M.H.; Huang, Z.Q.; Fu, S.L.; Chen, H.Y.H. Forest understorey vegetation: Colonization and the availability and heterogeneity of resources. Forests 2019, 10, 944. [Google Scholar] [CrossRef] [Green Version]
  58. Yu, J.T.; Zhang, X.N.; Xu, C.Y.; Hao, M.H.; Choe, C.; He, H.J. Thinning can increase shrub diversity and decrease herb diversity by regulating light and soil environments. Front. Plant Sci. 2022, 13, 948648. [Google Scholar] [CrossRef] [PubMed]
  59. Pohl, M.; Alig, D.; Körner, C.; Rixen, C. Higher plant diversity enhances soil stability in disturbed alpine ecosystems. Plant Soil. 2009, 324, 91–102. [Google Scholar] [CrossRef] [Green Version]
  60. Siefert, A.; Ravenscroft, C.; Althoff, D.; Alvarez-Yépiz, J.C.; Carter, B.E.; Glennon, K.L.; Heberling, J.M.; Jo, I.S.; Pontes, A.; Sauer, A.; et al. Scale dependence of vegetation–environment relationships: A meta-analysis of multivariate data. J. Veg. Sci. 2012, 23, 942–951. [Google Scholar] [CrossRef]
  61. Zhang, K.; Huang, K.D.; Zhao, X.J.; She, J.W.; Zheng, X.; Tang, L.Z. Effects of pruning on microclimate and understory vegetation in a poplar plantation. Ecol. Environ. Sci. 2019, 28, 1548–1556. [Google Scholar] [CrossRef]
  62. Choe, C.H.; Kim, J.H.; Xu, C.Y.; Choe, J.S.; Man, H.S.; Jo, S.M. Effect of soil nutrient spatial heterogeneity by cutting disturbance on understory plant diversity in broadleaved-Korean pine forest in Changbai Mountain, China. Eur. J. For. Res. 2021, 140, 603–613. [Google Scholar] [CrossRef]
  63. Chytrý, M.; Tichý, L.; Roleček, J. Local and regional patterns of species richness in Central European vegetation types along the pH/calcium gradient. Folia Geobot. 2003, 38, 429–442. [Google Scholar] [CrossRef]
  64. Weiher, E.; Forbes, S.; Schauwecker, T.; Grace, J.B. Multivariate control of plant species richness and community biomass in blackland prairie. Oikos 2004, 106, 151–157. [Google Scholar] [CrossRef]
Figure 1. Growth characteristics of poplar after pruning treatments. Note: H represents tree height, Hi represents the tree height increment; DBH represents diameter at breast height, DBHi represents the increment of diameter at breast height; CD represents crown diameter, CDi represents the increment of crown diameter; V represents stem volume, Vi represents the stem volume increment. Different lowercase letters indicate significant differences between different sampling times in the same treatment (p < 0.05); different capital letters indicate significant differences between different pruning treatments during the same period (p < 0.05). The error bars are the standard errors.
Forests 14 00501 g001
Figure 2. Effects of pruning on understory vegetation biomass, the Shannon–Weiner diversity index (H’), Menhinick’s richness index (Dm) and Pielou’s evenness index (Jsw) in October 2018. Note: The box represents ± SE, the whiskers show the minimum and maximum, the small circle is the mean, and the horizontal line is the median. Statistically significant differences between pruning treatments and CK are indicated by symbols: ** p < 0.01, * p < 0.05 and ns—no significant difference.
Forests 14 00501 g002
Figure 3. Dynamic changes in soil water and inorganic nitrogen contents in the poplar plantation after pruning treatments. Note: The same lowercase letter over two columns indicates no significant difference between pruning treatments at the same time point (p > 0.05), while different lowercase letters indicate significant differences between pruning treatments at the same time point (p < 0.05). Soil properties include soil water content (SWC), soil ammonium nitrogen (NH4-N), soil nitrate nitrogen (NO3-N) and soil total inorganic nitrogen (IN); 2018/03, 2018/07, 2018/10 and 2019/01 represent the sampling time year/month; 0–10 cm, 10–20 cm and 20–50 cm represent different soil sampling depths. This is the same below.
Forests 14 00501 g003
Figure 4. Dynamic changes in soil microbial biomass carbon (MBC) and nitrogen (MBN) in the poplar after pruning treatments. Note: The same lowercase letter over two columns indicates no significant difference between pruning treatments at the same time point (p > 0.05), while different lowercase letters indicate significant differences between pruning treatments at the same time point (p < 0.05).
Forests 14 00501 g004
Figure 5. Dynamic change in soil enzyme activities in the poplar plantation after pruning treatments. Note: The same lowercase letter over two columns indicates no significant difference between pruning treatments at the same time point (p > 0.05), while different lowercase letters indicate significant differences between pruning treatments at the same time point (p < 0.05).
Forests 14 00501 g005
Figure 6. Nonmetric multidimensional scaling analysis (NMDS) of soil properties and enzyme activities under different pruning treatments during four periods.
Forests 14 00501 g006
Figure 7. Linear fitting and Pearson correlation coefficients (Pearson’s R) between soil properties and soil enzyme activities in the poplar plantation after pruning treatments. Note: Statistically significant values are indicated by symbols: ** p < 0.01; * p < 0.05.
Forests 14 00501 g007
Figure 8. RDA between the poplar growth characteristics (blue arrows) and soil properties (red arrows) under different pruning treatments during four periods. Note: the results of RDA are used to identify the relationships between the poplar growth and soil properties; n (36) = three pruning treatments × four periods × three replications. The percentages on the x-axis and y-axis reflect the response rate of the soil properties to the changes in poplar growth characteristics in different dimensions. NH4/NO3 represents the ratio of soil ammonium nitrogen (NH4-N) to nitrate nitrogen (NO3-N); the same applies below.
Forests 14 00501 g008
Figure 9. RDA between the understory vegetation characteristics (blue arrows) and soil properties (red arrows) under different pruning treatments. Note: the results of RDA are used to identify the relationships between the understory vegetation characteristics and soil properties; n (27) = three pruning treatments× nine replications. The percentages on the x-axis and y-axis reflect the response rate of the soil properties to the changes in understory vegetation characteristics in different dimensions.
Forests 14 00501 g009
Table 1. Main stand characteristics (mean ± standard error) of the poplar plantation before pruning.
TDBH (cm)H (m)HCB (m)CD (m)
EWNS
CK20.89 ± 0.75a17.08 ± 0.39a2.35 ± 0.16a4.94 ± 0.18a4.73 ± 0.18a
1/321.52 ± 0.68a16.83 ± 0.48a2.58 ± 0.17a5.06 ± 0.36a4.87 ± 0.17a
1/221.20 ± 0.48a16.79 ± 0.26a2.50 ± 0.17a4.74 ± 0.19a4.73 ± 0.21a
Mean21.20 ± 0.2516.90 ± 0.132.49 ± 0.104.91 ± 0.134.78 ± 0.06
Note: T represents the pruning treatment; DBH represents diameter at breast height; H represents tree height; HCB represents height-to-crown base; CD represents crown diameter; EW represents east–west direction; NS represents north–south direction.
Table 2. Soil physicochemical properties (mean ± standard error) of the poplar plantation before pruning.
TDBD (g·cm−3)P (%)TN (g·kg−1)TP (g·kg−1)TK (g·kg−1)OM (g·kg−1)
CK0–10 cm1.23 ± 0.08Aa54.50 ± 1.73Aa0.90 ± 0.14Aa0.88 ± 0.05Aa16.24 ± 0.79Aa28.61 ± 2.09Aa
10–20 cm1.31 ± 0.01Aa49.88 ± 2.64Aa0.55 ± 0.06Ba0.74 ± 0.03Ba15.69 ± 0.35Aa19.89 ± 0.99Ba
20–50 cm--0.22 ± 0.02Ca0.59 ± 0.02Ca13.22 ± 0.39Ba7.00 ± 0.64Ca
1/30–10 cm1.13 ± 0.08Aa57.15 ± 1.75Aa0.81 ± 0.19Aa0.87 ± 0.11Aa16.63 ± 0.29Aa29.04 ± 1.52Aa
10–20 cm1.29 ± 0.06Aa51.59 ± 5.77Aa0.50 ± 0.10Aa0.72 ± 0.04Aa16.56 ± 0.53Aa18.71 ± 1.41Ba
20–50 cm--0.24 ± 0.06Ba0.55 ± 0.03Ba13.49 ± 0.69Ba10.02 ± 1.60Ca
1/20–10 cm1.18 ± 0.12Aa55.39 ± 2.31Aa0.92 ± 0.15Aa0.91 ± 0.03Aa15.86 ± 0.45Aa31.27 ± 1.41Aa
10–20 cm1.30 ± 0.07Aa50.94 ± 1.94Aa0.64 ± 0.04Ba0.77 ± 0.05Ba15.71 ± 0.54ABa20.72 ± 2.15Ba
20–50 cm0.28 ± 0.06Ca0.57 ± 0.02Ca14.14 ± 1.03Ba6.68 ± 1.24Ca
Note: T represents the pruning treatment; D represents soil depth; BD represents soil bulk density; P represents soil porosity; TN represents total nitrogen content; TP represents total phosphorus content; TK represents total potassium content; OM represents organic matter content. Different lowercase letters indicate significant differences between different pruning treatmentsat the same soil depth (p < 0.05); different capital letters indicate significant differences between different soil depths in the same treatment (p < 0.05). The error bars are the standard errors.
Table 3. F and p values for the effects of pruning treatments (T), sampling seasons (S) and soil depths (D) on the soil properties from repeated measures ANOVA.
SourceF(p) Value
SWC
NH4-NNO3-NINMBCMBNCatalaseSaccharaseUrease
T0.629
(0.536)
4.665
(0.012)
9.247
(<0.001)
8.053
(0.001)
5.805
(0.005)
6.730
(0.003)
17.002
(<0.001)
10.822
(<0.001)
9.382
(<0.001)
S248.398
(<0.001)
307.926
(<0.001)
41.898
(<0.001)
19.866
(<0.001)
4.702
(0.005)
65.714
(<0.001)
2414.374
(<0.001)
429.663
(<0.001)
242.015
(<0.001)
D51.448
(<0.001)
14.178
(<0.001)
130.396
(<0.001)
127.363
(<0.001)
78.109
(<0.001)
236.031
(<0.001)
90.699
(<0.001)
2193.513
(<0.001)
1152.01
(<0.001)
T × S0.939
(0.473)
8.245
(<0.001)
2.307
(0.043)
4.382
(0.001)
0.744
(0.616)
1.499
(0.191)
2.504
(0.029)
1.895
(0.094)
3.14
(0.009)
T × D0.224
(0.924)
1.256
(0.295)
1.444
(0.228)
1.32
(0.271)
3.21
(0.018)
0.478
(0.752)
1.606
(0.182)
6.98
(<0.001)
2.069
(0.094)
S × D5.762
(<0.001)
3.313
(0.006)
16.377
(<0.001)
16.278
(<0.001)
1.293
(0.271)
25.984
(<0.001)
4.975
(<0.001)
83.914
(<0.001)
40.196
(<0.001)
T × S × D0.389
(0.963)
1.235
(0.277)
1.321
(0.226)
1.656
(0.095)
0.623
(0.815)
0.722
(0.725)
0.244
(0.955)
3.288
(<0.001)
2.364
(0.013)
Disclaimer/Publisher’s Note: The statements, opinions and data contained in all publications are solely those of the individual author(s) and contributor(s) and not of MDPI and/or the editor(s). MDPI and/or the editor(s) disclaim responsibility for any injury to people or property resulting from any ideas, methods, instructions or products referred to in the content.

