Article

Seeds’ Early Traits as Predictors of Performance in Direct Seeding Restoration

by
Ivonir Piotrowski
1,*,
Harvey Marin Paladines
1,
Lausanne Soraya de Almeida
2,
Alex Mauri Tello López
1,
Felipe Bueno Dutra
1,
Bruno Santos Francisco
1,
José Mauro Santana da Silva
1 and
Fatima C. Márquez Piña-Rodrigues
1
1
Graduate Program in Planning and Use of Renewable Resources, Department of Environmental Sciences, Federal University of São Carlos, Campus Sorocaba, São Paulo 18052-780, Brazil
2
Department of Forest Engineering, Federal University of Viçosa, Campus Viçosa, Viçosa 36570-900, Brazil
*
Author to whom correspondence should be addressed.
Forests 2023, 14(3), 547; https://doi.org/10.3390/f14030547
Submission received: 24 January 2023 / Revised: 19 February 2023 / Accepted: 22 February 2023 / Published: 10 March 2023
(This article belongs to the Section Forest Ecology and Management)

Abstract

:
Direct seeding is a promising and low-cost restoration technique. To avoid wasting seeds, the selection of species with high field performance in their establishment can increase efficiency. We aimed to identify groups of forest species with the ability for direct seeding in a seasonal forest, investigate taxonomic similarity effects on species behavior regarding seeds’ and seedlings’ early functional traits, and classify species based on their probability of success by direct seeding. A planting system of 38 seasonal forest species was implemented at a density of 250,000 seeds ha−1. The emergence was monitored over 720 days, and all individuals were identified, tagged, counted, and measured for height (H) and diameter at collar height (DCH). We evaluated early traits of seed vigor (field seed emergence), seedling performance, probability of success, and species autoecology. Species’ ability for direct seeding was more related to the level of species phylogeny than to their family. Pioneer and non-pioneer species demonstrated similar abilities for direct seeding associated with field emergence, seedling abundance, and persistence. Field seed emergence traits influenced species’ ability for direct seeding more than seedling survival or growth. Species’ ability for direct seeding was related to early seed vigor traits expressed by field seed emergence and was independent of their density.

1. Introduction

In tropical forests, adaptations to seasonal drought, high light gradients, and evaporative demand can drive community assembly and seedling establishment [1]. Seed emergence and seedling establishment are directly niche-related processes and play a special role in community assembly [2]. This approach has a highly predictive value [3], since the germination niche is narrower in communities with stronger environmental filters such as drought and light [4], which can lead to community assembly.
Predicting environmental factors and species performance, which drive the community assembly for restoring ecological processes, is a key issue for ecologists and restoration practitioners. Nevertheless, plant assembly depends on environmental requirements such as preparing the regeneration niche for its successful establishment [1], inducing seed emergence, survival, and the initial growth of seedlings. Therefore, soil preparation, weed management, and pest control of a restored area must be carried out to promote plant establishment and ecological processes [5].
Active restoration by seedlings is the most employed method; however, high cost, resources, and effort are involved to promote its efficiency [6]. Direct sowing has stood out for its low cost [7]; fast assessment, since the density of seedlings can be estimated a few months after planting [8]; and higher density in comparison with planting seedlings [9,10,11]. Species selection can cut down restoration costs [12] because seed performance in the field can be reduced by species with high mortality or low performance in adverse climatic conditions or even susceptibility to herbivory or diseases [13]. The species selection may be based on their commercial availability [14] and adaptation to local soil and climatic conditions [15].
The production of native seeds for restoration is below the Brazilian targets [16], and it is necessary to expand the installed capacity at least 350 times [17,18]. On the other hand, direct sowing practices use 200,000 to 400,000 seeds [19] per hectare and 45 to 60 species [11], with low successful emergence and establishment [20], wasting harvesting efforts and many native seeds. Based on this background, we proposed that early functional traits such as seed vigor expressed by field seed emergence, survival, and initial seedling density and establishment can be used to filter species with the ability for direct seeding in a seasonal forest. Initial filtering of species for direct seeding can be an easy, low-cost, and fast method to improve the efficiency of seed use, reducing seed waste in restoration.
This study aimed (a) to identify groups of forest species with a similar ability for direct sowing in a seasonal forest, (b) analyze the contribution of taxonomic similarity and seed traits (size, dispersion syndrome, vigor, and emergence) for the establishment and survival of species, and (c) filter and classify species according to their probability of success and ability for direct seeding, contributing to reducing seed waste and improving direct seeding efficiency.

2. Materials and Methods

2.1. Study Area

This research was conducted in a study area located at São Paulo, Brazil (Sorocaba, 23°35′07.77″ S–47°31′05.90″ W) with Cambissoil [21] with a landscape surrounded by remnants of seasonal semideciduous forest in the intermediate stage of succession [22], bordered by pastures of Urocloa decumbens (Stapf) RD Webster, with natural regeneration of Baccharis dracunculifolia DC. The climate is subtropical with dry winter and a historical mean annual precipitation of 1355 mm, with drier months from April to September and mean temperature of 20.8 °C [23]. The maximum and minimum mean temperatures in 2018 and 2019 were 28.1 °C and 29.0 °C and 16.7 °C and 17.3 °C, respectively, with the hottest months from December to March and the coldest months from May to August [24]. The wet period was from December to March, with maximum precipitation in January 2018 (176.8 mm) and February 2019 (192.2 mm). The driest period was recorded from March to September, with precipitation lower than 15 mm month−1, in 2018, and total precipitation was 947.4 mm to 1233 mm in 2019.

2.2. Species Selection and Seed Preparation

Species that survived and established themselves by direct seeding were pre-selected in the literature and in a dry-zone network of five areas of direct seeding, as well as in an active restoration [20,25].
The species selection was based on their functions such as short-cycle fauna attraction species (zoochoric pioneers), fertilizers (N2-fixing legumes and interactions with microorganisms), biomass input (senescent species), and equilibrium between pioneer and non-pioneer species and dispersal syndromes [26].
From the list, we selected potential species pondering their availability in forest seed suppliers, resulting in a total of 38 species. Seed lots were composed of different matrices and provenances, so we considered them representative of the selected species. We assessed seed quality by germination analysis (G%) under controlled conditions, according to Brazil [27] and by vigor evaluated using field seed emergence and expressed as a percentage of germinability (Gd%) [28].
Native seeds were separated into size classes, with 80% being small (10,000 < S ≤ 100,000 seeds kg−1) and extremely small seeds (SS < 100,000 seeds kg−1), and 20% being medium (1000 ≤ M ≤ 10,000 seeds kg−1) and large seeds (L < 1000 seeds kg−1). This proportion was considered because medium–large seeds represent 50–70% of the costs of the small ones. We established a density of 250,000 seeds ha−1 and distributed a mixture of 50 seeds per linear meter at 2 cm depth. Direct seeding was carried out in December 2017. Species with dormant seeds were prepared according to the literature [27,29]. The seeding beds were manually prepared (see Section 2.3), and seeds were carefully placed on their surface and covered by a homogeneous layer of soil of two centimeters.

2.3. Species Selection and Seed Preparation

Soil preparation and weed control followed the protocol proposed by Piotrowski et al. 2020 [30]. The use of herbicides was carried out only on the bushes of Urochloa decumbens (Stapf) R.D.Webster with directional application using a foam nozzle to avoid damage to the sown seeds and their seedlings. We prepared linear groups consisting of three rows spaced 1.5 m apart with each group placed 3 m apart, equivalent to a sowing area of 5000 linear meters ha−1. The sowing lines were prepared by subsoiling 0.50 m deep. The total area of the experiment (1920 m2) was divided into five blocks of 24 × 16 m (384 m2), with 32 plots of 3 × 1 m systematically demarcated for each block right after sowing, totaling 160 sampled plots (480 linear meters ha−1). More details about soil, seed preparation, sowing and sampling are found in the Supplementary Materials.
Over 720 days, we performed 15 sampled monitoring periods. Each individual was numbered, tagged, and identified, and we collected data on seedling height (H, cm) and diameter at collar height (DCH, mm). Seed emergence and seedling survival were recorded over the 720 days.

2.4. Data Analysis

We calculated emergence (E), germinability (Gd%), and survival (S%), by the following equations: (a) emergence (E) =  i j e , in which e is the number of newly emerged seeds per monitoring period (i to j) [10]; (b) germinability Gd (%) = E30–720/NTS × 100, in which germinability represents in percentage the ratio between the number of seeds emerged in the field and the total number of seeds sown; E30–720 = total number of seeds that emerged and produced seedlings from 30 to 720 days, and NTS = total number of seeds sown in the plots; and (c) survival S (%) = (NP/E) ×100, in which NP is the number of surviving plants on the 720th day and E is the emergence. The mortality was estimated by the number of dead seedlings in each monitoring period. The probability of success of each species was adapted from Ceccon et al. [20] as follows:
PBS =  E N T S S 100 ,    a relation among E (emergence), NTS (number of sowed seeds), and survival (S%).
Species assemblage and diversity were evaluated by number of species (S), abundance (number of individuals), and density (number of plants ha−1), calculating Shannon diversity (H’) and Pielou (J) equitability indexes according to Magurran [31]. Pearson’s correlation analysis between species for the variables of germinability, emergence, survival, number of seeds kg−1, and probability of success was classified as high (r > 0.80), medium (0.50 < r ≤ 0, 80), and low (r < 0.50). Afterward, a general linear model (GLM) analysis was carried out to verify the significance of these relationships and their graphic expression, generating the significant representative equation of the relationships. The influence of seed size on germinability was analyzed by the F test and boxplot. The significance of differences in abundance between ecological groups and biotic–abiotic dispersal syndromes was estimated by the t and F tests, respectively. The Kruskal–Wallis test was used to evaluate the effect of dispersal syndrome on germinability and seedling density.
The trajectory of the species assemblage over time was analyzed using the number of emerged seedlings and mortality of individuals using a polynomial trend curve of abundance throughout 720 days after sowing. The mortality along the trajectory of direct seeding was assessed through repeated-measure analysis of variance, applying the t-test to compare mortality between ecological groups and evaluate the correlation between mortality and abundance. Afterward, the taxonomic diversity (∆) and taxonomic distinctiveness (∆*) indexes were used to investigate the phylogenetic influence in the family and species level in relation to early seed traits. The taxonomic distinctiveness index (∆*) is a measure of the taxonomic relationship and represents the average taxonomic distance between two individuals, with the restriction that they are from different species [32]. Thus, as the distance between species increases within the phylogenetic tree, the value increases, regardless of sampling effort [33] and species richness [31].
To evaluate species’ ability, a linear regression model was built to express the significant association between seed traits (germinability, emergence, survival, and probability of success—PBS). The stepwise technique was used, applying the step-by-step iterative construction [34]. The complete linear regression model of the independent variable (PBS) was defined as the starting point. Then, steps were taken to eliminate non-significant variables using backward stepwise selection, meeting the F test requirement, since in Linear Regression models, it is assumed that there is a linear relationship between the dependent variable (probability of success) and the independent variables (germinability, emergence, and survival rate). The parsimonious model, used to describe the probability of success, was identified by using the accuracy of adjustments by the Akaike’s Information Criterion (AIC) and the adjusted coefficient of determination (R2aj), considering that the higher the value of R2aj, the better the model, and by plotting the residues based on the statistics of the Shapiro–Wilk test for normality, with a significance level of 5%. All analyses were performed in the R statistical environment [35] and the function avPlots of the CAR package [36].
To assess how functional traits were associated with the species assemblage, a principal component analysis (PCA) was performed in the R environment [37] to convert the correlated variables into linearly uncorrelated variables, referred to as principal components [38]. Before performing PCA, the normality of data distribution was tested, and Pearson’s correlation (r) was used to identify collinearity and highly correlated variables (r > 0.80). The dataset used in the PCA consisted of 23 observations (species) from 8 variables: germinability, emergence, seed size expressed as the number of seeds per kilogram, survival, seedling height, diameter at collar height, probability of success, and ecological groups. The PCA was applied to transform the original dataset into a lower-dimensional dataset [38]. The “prcomp” command from the Stats package was used to derive principal components. Then, data visualization based on the first two principal components was performed, using the “factoextra” version (1.0.7) package [39].”

3. Results

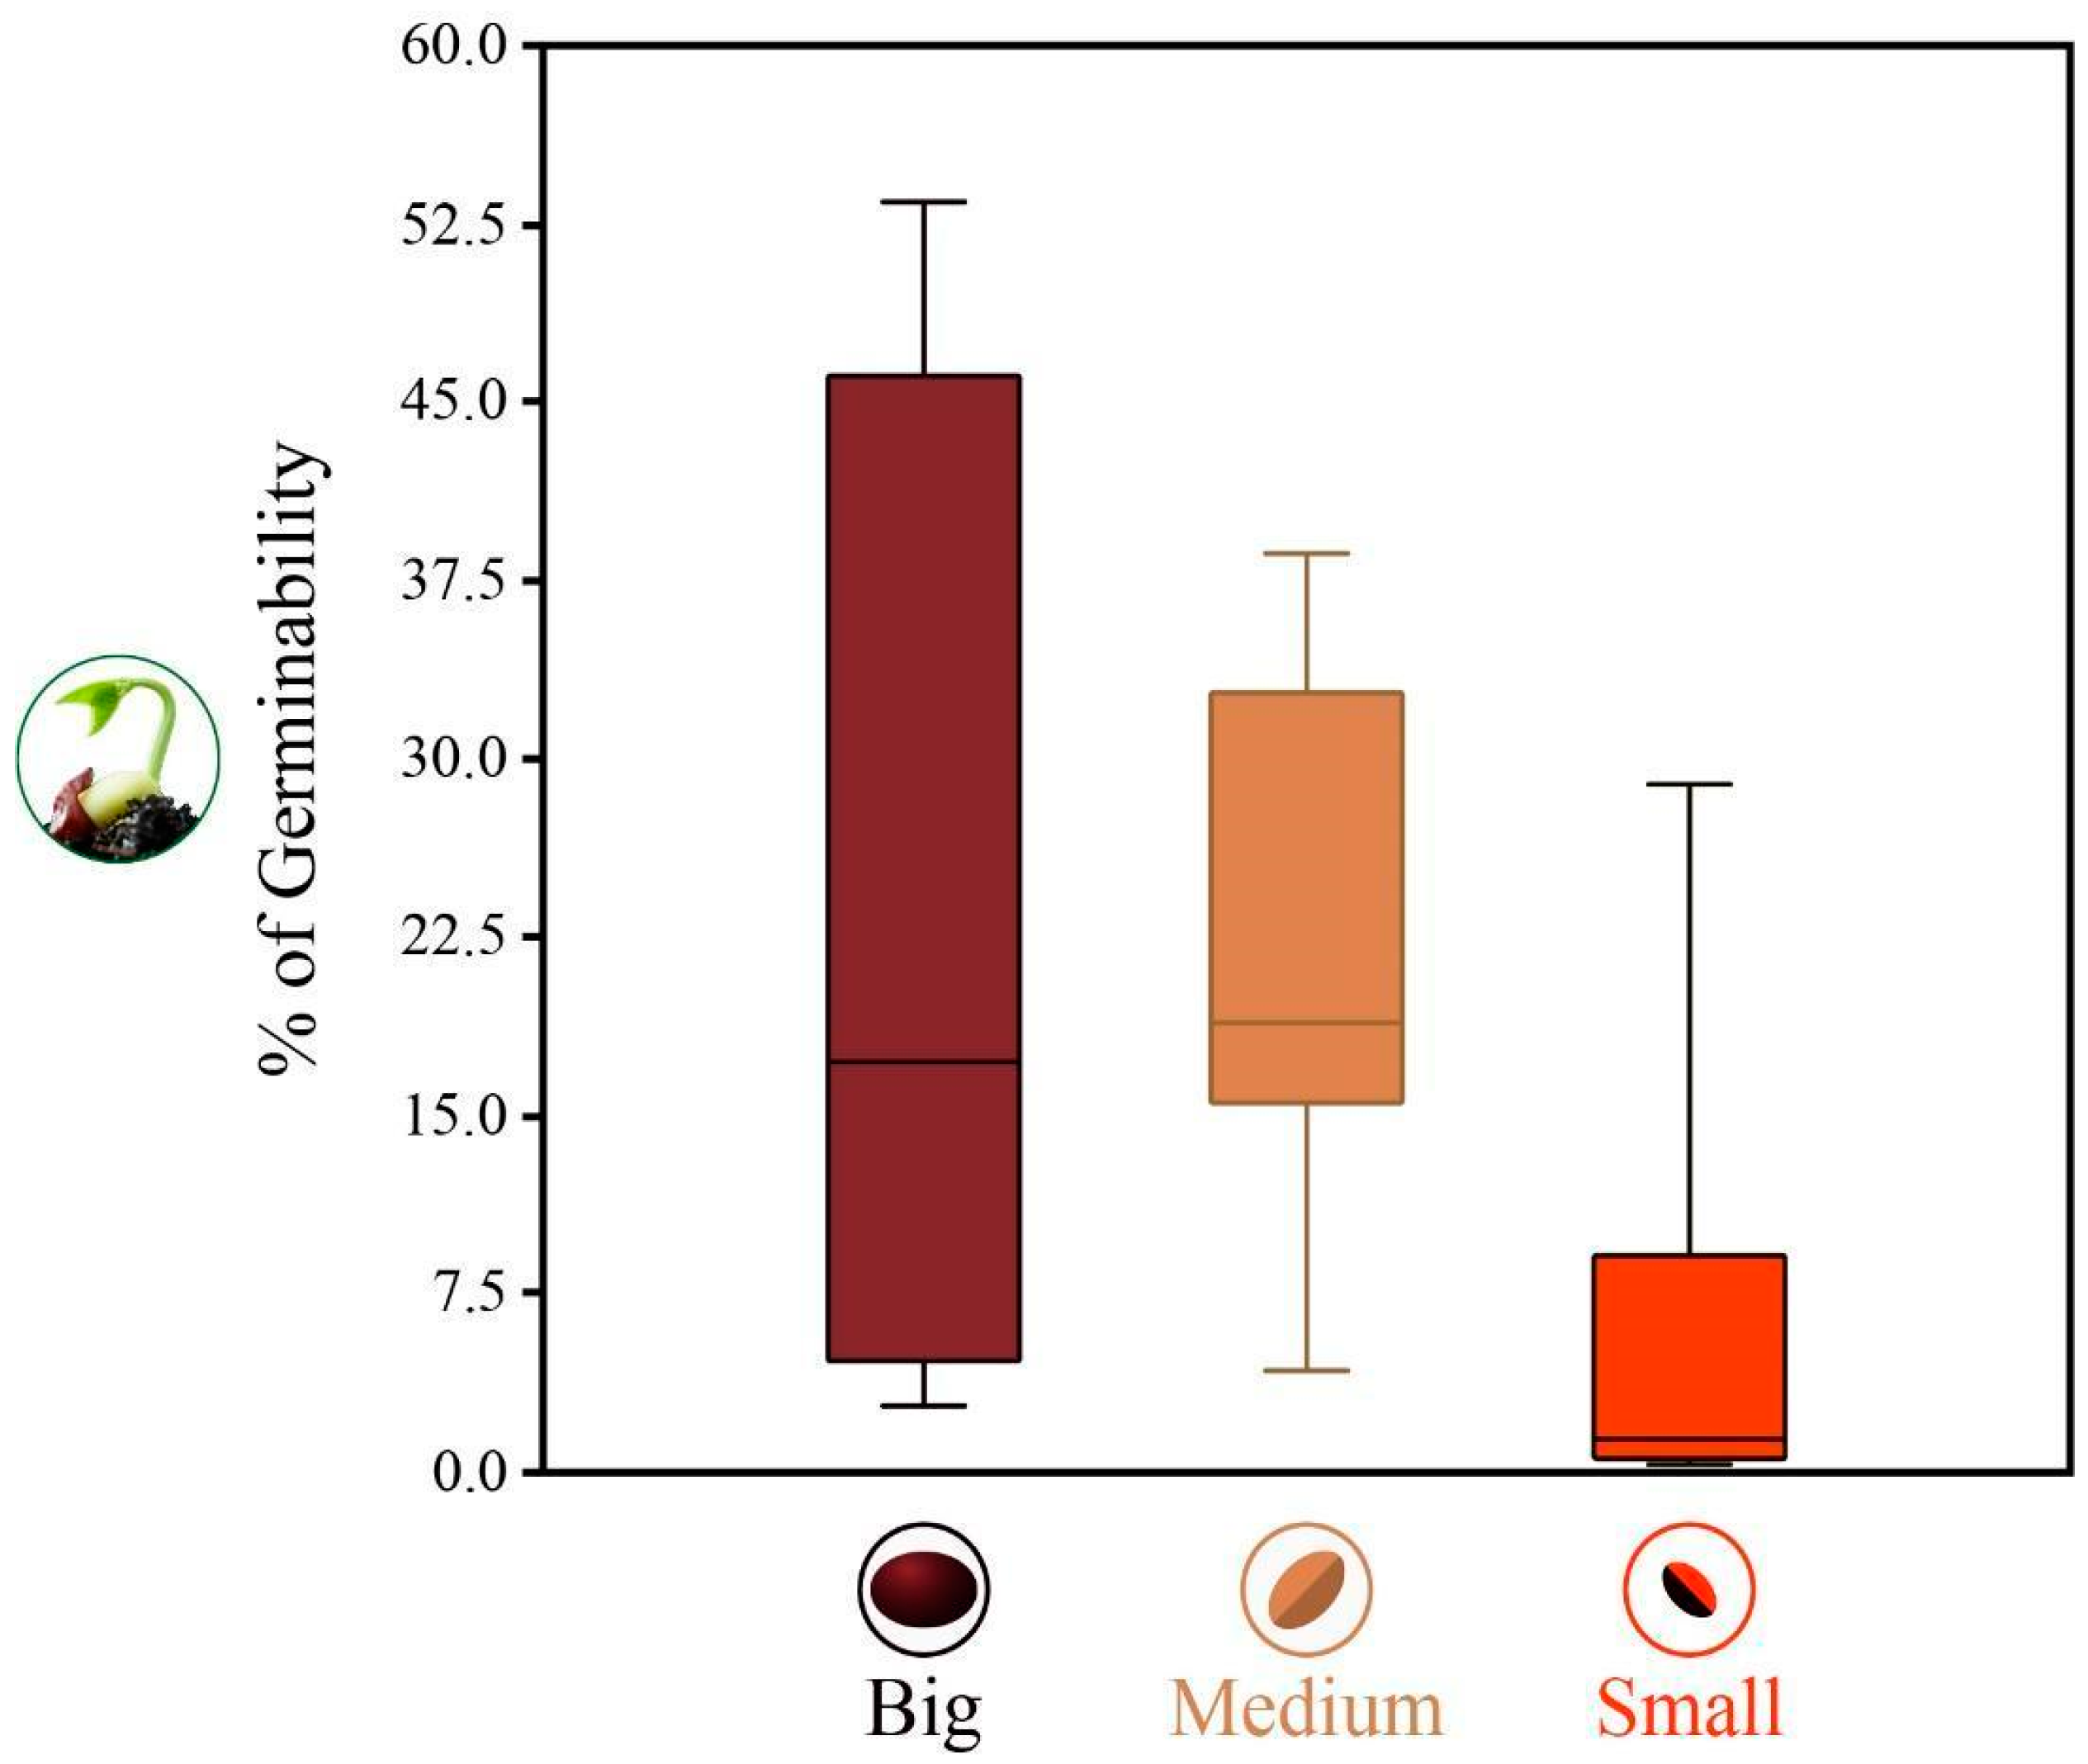
3.1. Species Assemblage, Germinability, and Emergence

A total of 38 species from 16 families were tested. Fabaceae had the highest number of species observed in field (n = 15 species; 39.5%), followed by Bignoniaceae, Euphorbiaceae, Malvaceae (three species each; 7.9%), Anacardiaceae, Myrtaceae (two species each; 3%), and 10 families, represented by only one species (see Table 1).
On the 30th day after direct seeding, 32 individuals died before identification, and on the 720th day, 23 species (n = 38; 60.5%) from 10 families emerged, with a dominance of Fabaceae (n = 12 species) with 9636 ind ha−1 (59.6%), and Bignoniaceae (n = 3 species) with 2583 ind ha−1 (16%). Moraceae, Phytolaccaceae, Primulaceae, Sapindaceae, and Urticaceae each accounted for only one species, and Myrtaceae (two species) did not emerge.
After 720 days, from the 23 emerging species, the following values were obtained: diversity (H’) of 2.712, equitability (J) of 0.8648, abundance of 1552 individuals in the plots, and density of 16,167 ind ha−1. Senegalia polyphylla (2510 ind ha−1), Platypodium elegans (1813 ind ha−1), Handroanthus heptaphyllus (1417 ind ha−1), Mabea fistulifera (1313 ind ha−1), and Copaifera langsdorffii (1125 ind ha−1) represented 50.6% of the individuals, and 19 other species accounted for more than 100 ind ha−1.
The germinability was 8.9 ± 13.4%, with a ratio of one seedling for every 18 seeds sowed (1:18). The amplitude in the emergence of species assemblage ranged from 0 to 241 individuals, and 15 species (n = 38; 39.5%) did not emerge. From the emerged species (n = 23), a mean germinability of 14.6 ± 14.5% was obtained, with a range from 0.4 to 53.4% (see Table 1). The highest germinability values were recorded for the Fabaceae species Platypodium elegans (53%), Copaifera langsdorffii (33%), Poecilanthe parviflora (32%), Senegalia polyphylla (29%), Hymenaea courbaril (24%), and Pterocarpus violaceus (21%). On the other hand, the Fabaceae species Albizia niopoides, Myroxylon peruiferum, and Senna multijuga did not emerge, despite having germinated in controlled conditions. Only the Euphorbiaceae species M. fistulifera had a germinability (38.7%) similar to the Fabaceae, and all the other species had germinability below 20%.
Regarding seed size, 17.4% of emerged species were large-seeded species, 34.8% were medium, and 47.8% were small-seeded species. While all large-seeded species emerged (n = 4 species; 296 ind.; 3023 ind ha−1; 19.1% of individuals), 80% of the medium-seeded and 55.7% of the small-seeded species emerged (n = 11 species; 563 ind.; 5865 ind ha−1; 36.3% of individuals), there was no emergence of extremely small seeds (n = 5 species).
We observed a significant difference (F = 6.6691; p < 0.01) in germinability only between large (22.7 ± 14.0%) and small (6.2 ± 8.9%) seeds, with greater germinability variation in large seeds than in the small ones (see Figure 1). The medium-seed species had germinability (22.2 ± 10.6%) similar to the species with large ones. Eight of the ten medium-seed species emerged and produced 42.6% of the individuals (n = 661; 6886 ind ha−1), whereas only C. vernalis and M. peruiferum did not emerge. Unidentified seedlings (n = 32) represented 2.1% of the total individuals that emerged in the field.
Among the listed species (n = 38), 17 were pioneers and 21 were non-pioneers, from which 8 pioneers (35.3% of individuals) and 15 non-pioneers (62.6% of individuals) emerged; however, there was no significant difference in the emergence of pioneer and non-pioneer species (t = 0.73, p > 0.05). The mean height values for pioneers and non-pioneers were 209.5 ± 86.6 cm and 84.8 ± 62.0 cm, respectively, with the lowest heights observed for the pioneer species Enterolobium contortisiliquum and Peltophorum dubium, both belonging to the family Fabaceae. Only the height of the non-pioneer species Astronium urundeuva (Synonym of Myracrodruon urundeuva M. allemão) was higher than the mean height of the pioneer species.
Pioneer and non-pioneer species had mean diameter at collar height (DCH) of 23.2 ± 13.0 mm and 12.2 ± 8.9 mm, respectively. Ceiba speciosa was the only species among non-pioneers with a DCH higher than the mean recorded for pioneer species (36.0 ± 13.1 mm). It was found that 29% of the 38 listed species were anemochoric (n = 11), 9 of which emerged; another 29% were autochoric (n = 11), 8 of which emerged; and the remaining 42% were zoochoric (n = 16), among which only 6 species emerged. There was a significant difference when comparing the emergence between species with biotic dispersion (zoochoric; n = 6; 47.8 ± 38.1 individuals) and those with abiotic dispersion (autochoric; n = 6; 79.9 ± 77.6 individuals) and anemochoric (n = 9; 66.0 ± 61.0 individuals), with higher values for abiotic species (F = 3.345; p = 0.024).

3.2. The Trajectory of Direct Seeding

Three phases were identified in the trajectory of direct seeding: (a) the emergence phase from the 30th to the 90th day after sowing (DAS), which concentrated the newly emerged seedlings (<10 cm); (b) the establishment phase, with the growth and establishment of seedlings (~90th to the 270th DAS); and (c) the structural phase (>270th DAS), when a reduced seed emergence and an increased seedling growth were observed.
The mortality rapidly increased between 30 and 90 days (8.3% of total emerging individuals), and after this period, the mortality continued to increase over time; however, its velocity decreased, reaching 15.1% of individuals at 720 DAS, when the highest mortality was observed (n = 235 individuals). There was a slight upward trend in mortality after 90 days but without reducing the total number of seedlings due to the emergence of new species and individuals. Throughout the phases, mortality differed significantly (F = 5.83, p < 0.01) only in the emergence period (from the 30th to the 90th DAS). In the establishment and structural phases, the species had high survival (>80%), and seedlings showed persistence from 90 to 360 days.
Although mortality did not differ between ecological groups (t = 0.2726; p = 0.787), there was an effect at the species level. Even though S. romanzoffiana (n = 9 ind.; 93 ind ha−1), P. gonoacantha (n = 5 ind.; 52 ind ha−1), T. roseoalba (n = 5 ind.; 52 ind ha−1), C. fissilis (n = 4 ind.; 42 ind ha−1), and C. myrianthum (n = 3 ind.; 31 ind ha−1) have had low emergence, they were associated with low mortality and showed persistence in the environment, regardless of their low abundance. Based on this behavior, the association between low emergence and low mortality indicated that these species were capable of surviving and persisted in direct seeding even with few individuals.
Fabaceae species were predominant in the assemblage due to their performance in germinability (higher vigor) and emergence (seedling abundance and density) (Table 1). However, the taxonomic diversity (Δ) and taxonomic distinctness (Δ*) indexes indicated that there was a slight taxonomic relationship at the species level for survival (Δ = 2.790; Δ* = 3.024) than for emergence (Δ = 2.718; Δ* = 2.955) and germinability (Δ = 1.836; Δ* = 2.000) when compared to the family level for survival (Δ = 1.584; Δ* = 1.717), emergence (Δ = 1.511; Δ* = 1.642), and germinability (Δ = 1.429; Δ* = 1.556).

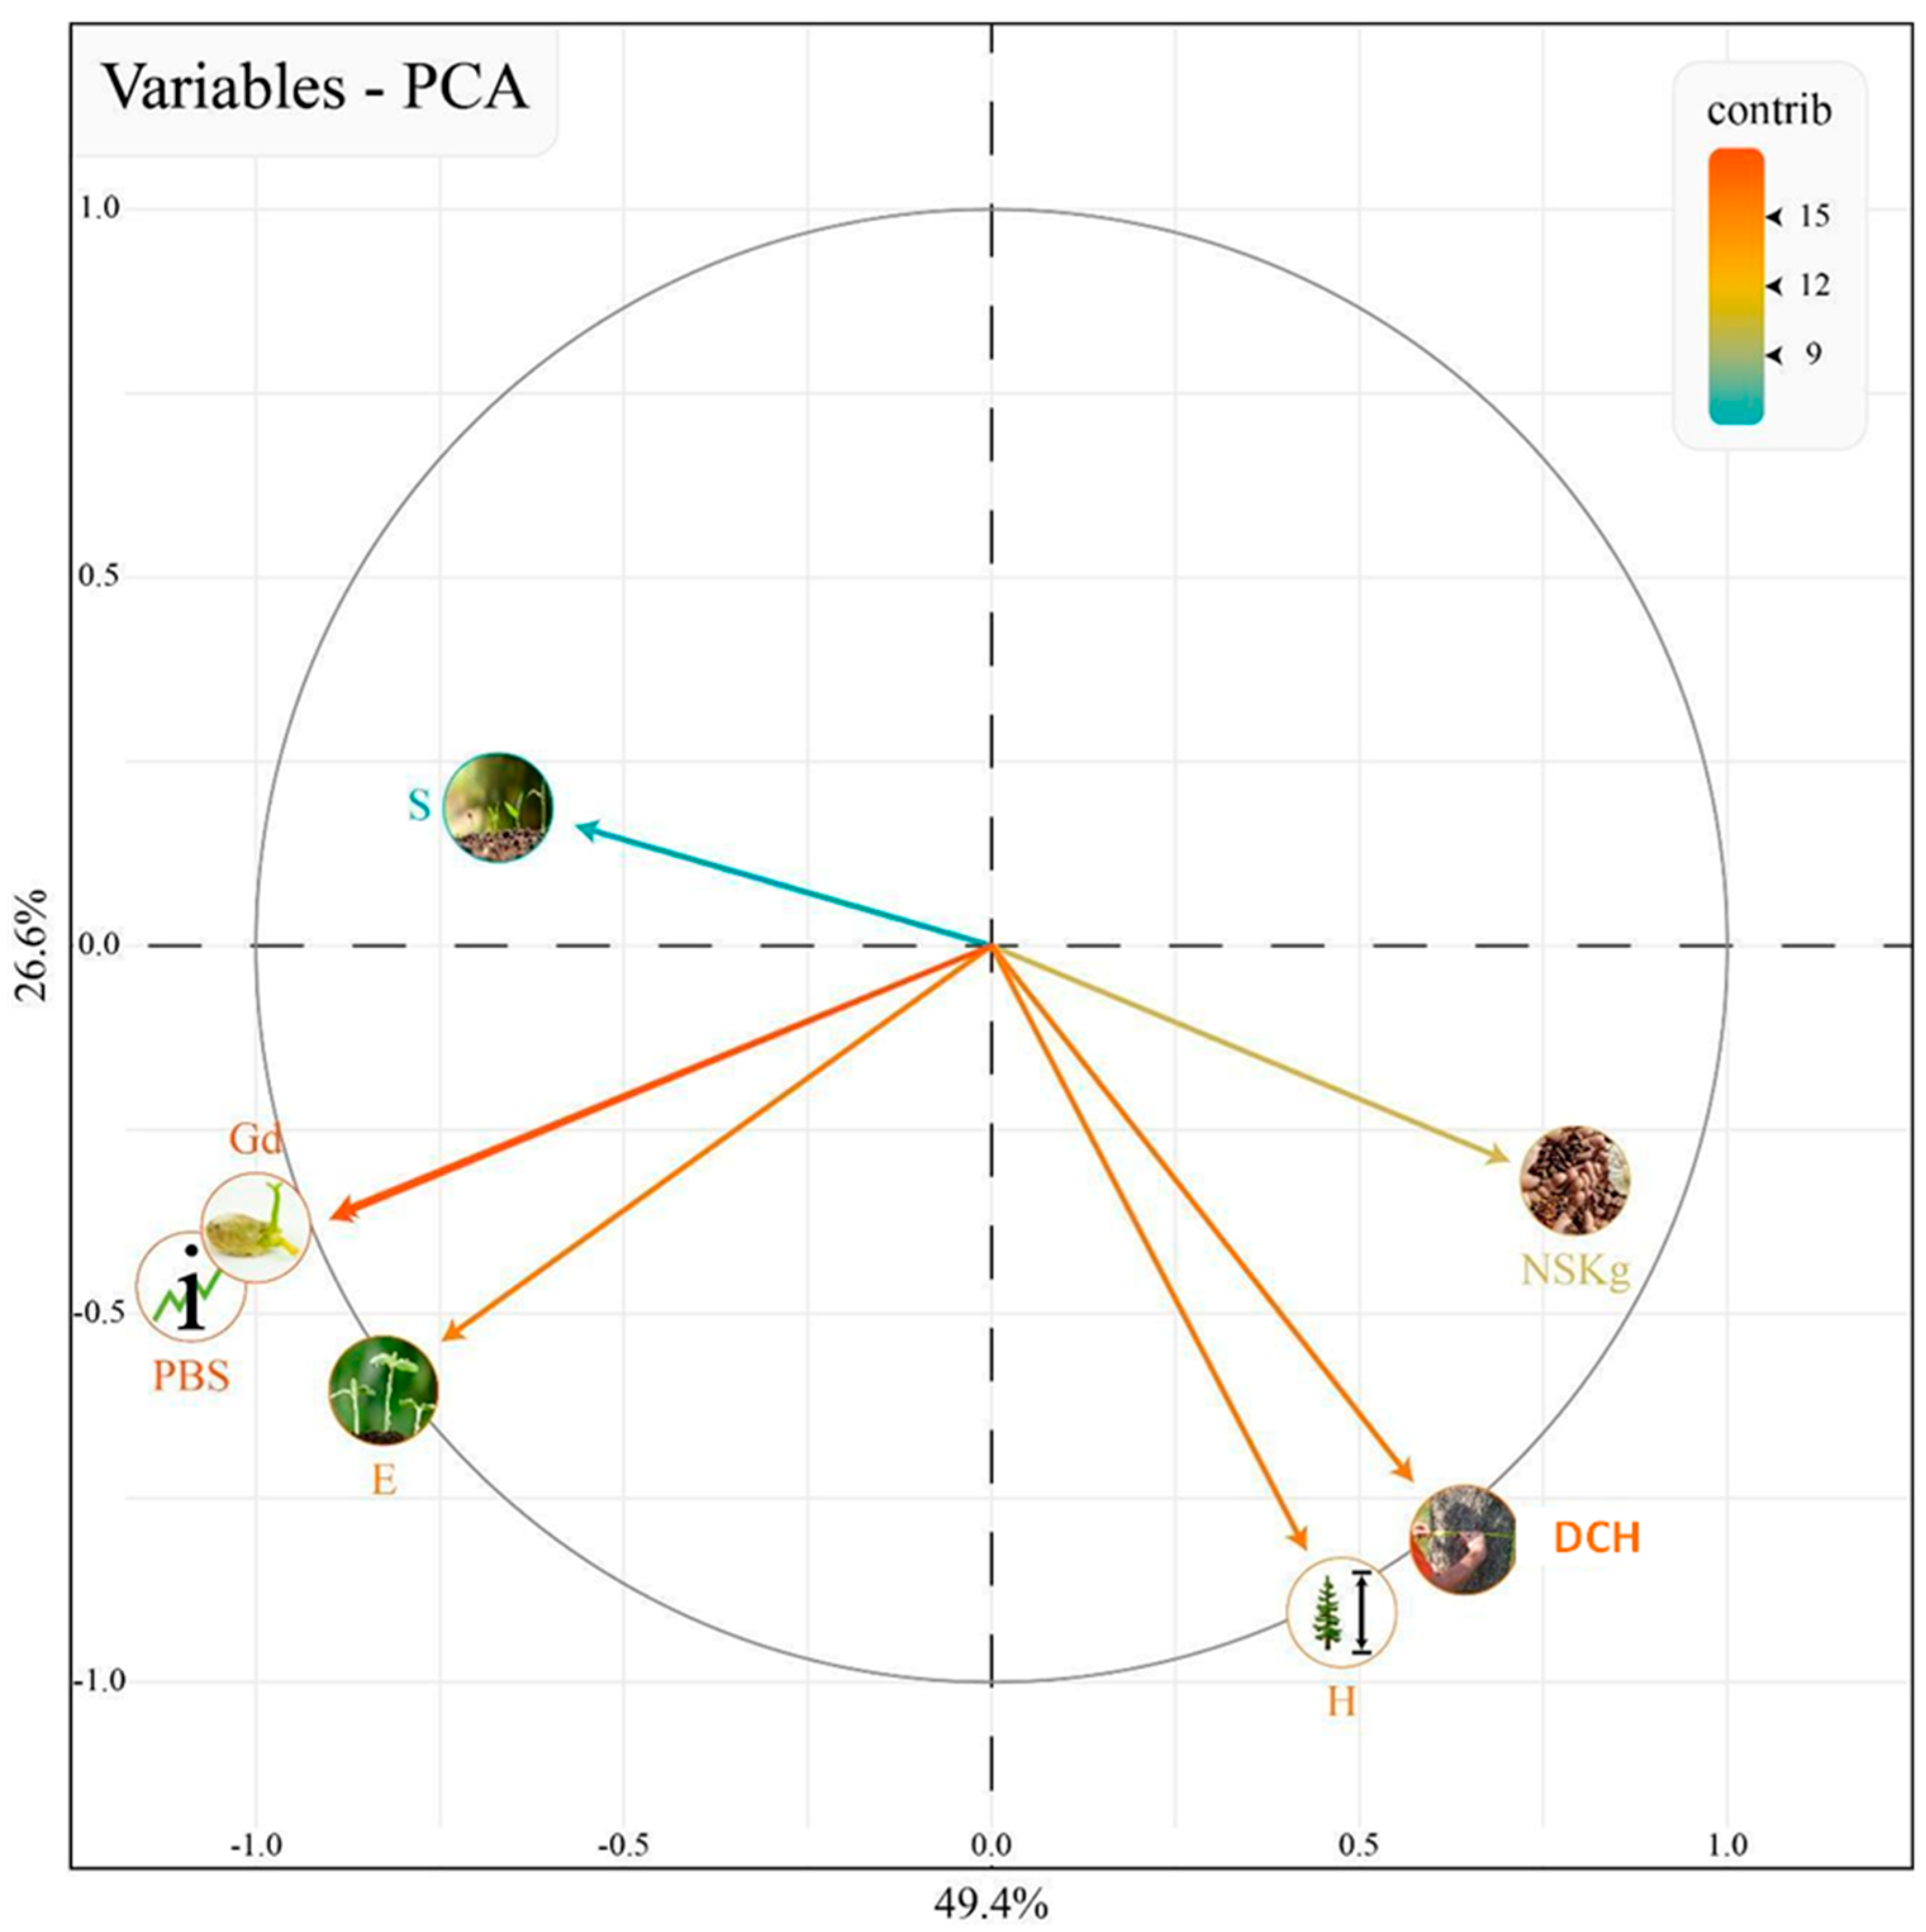
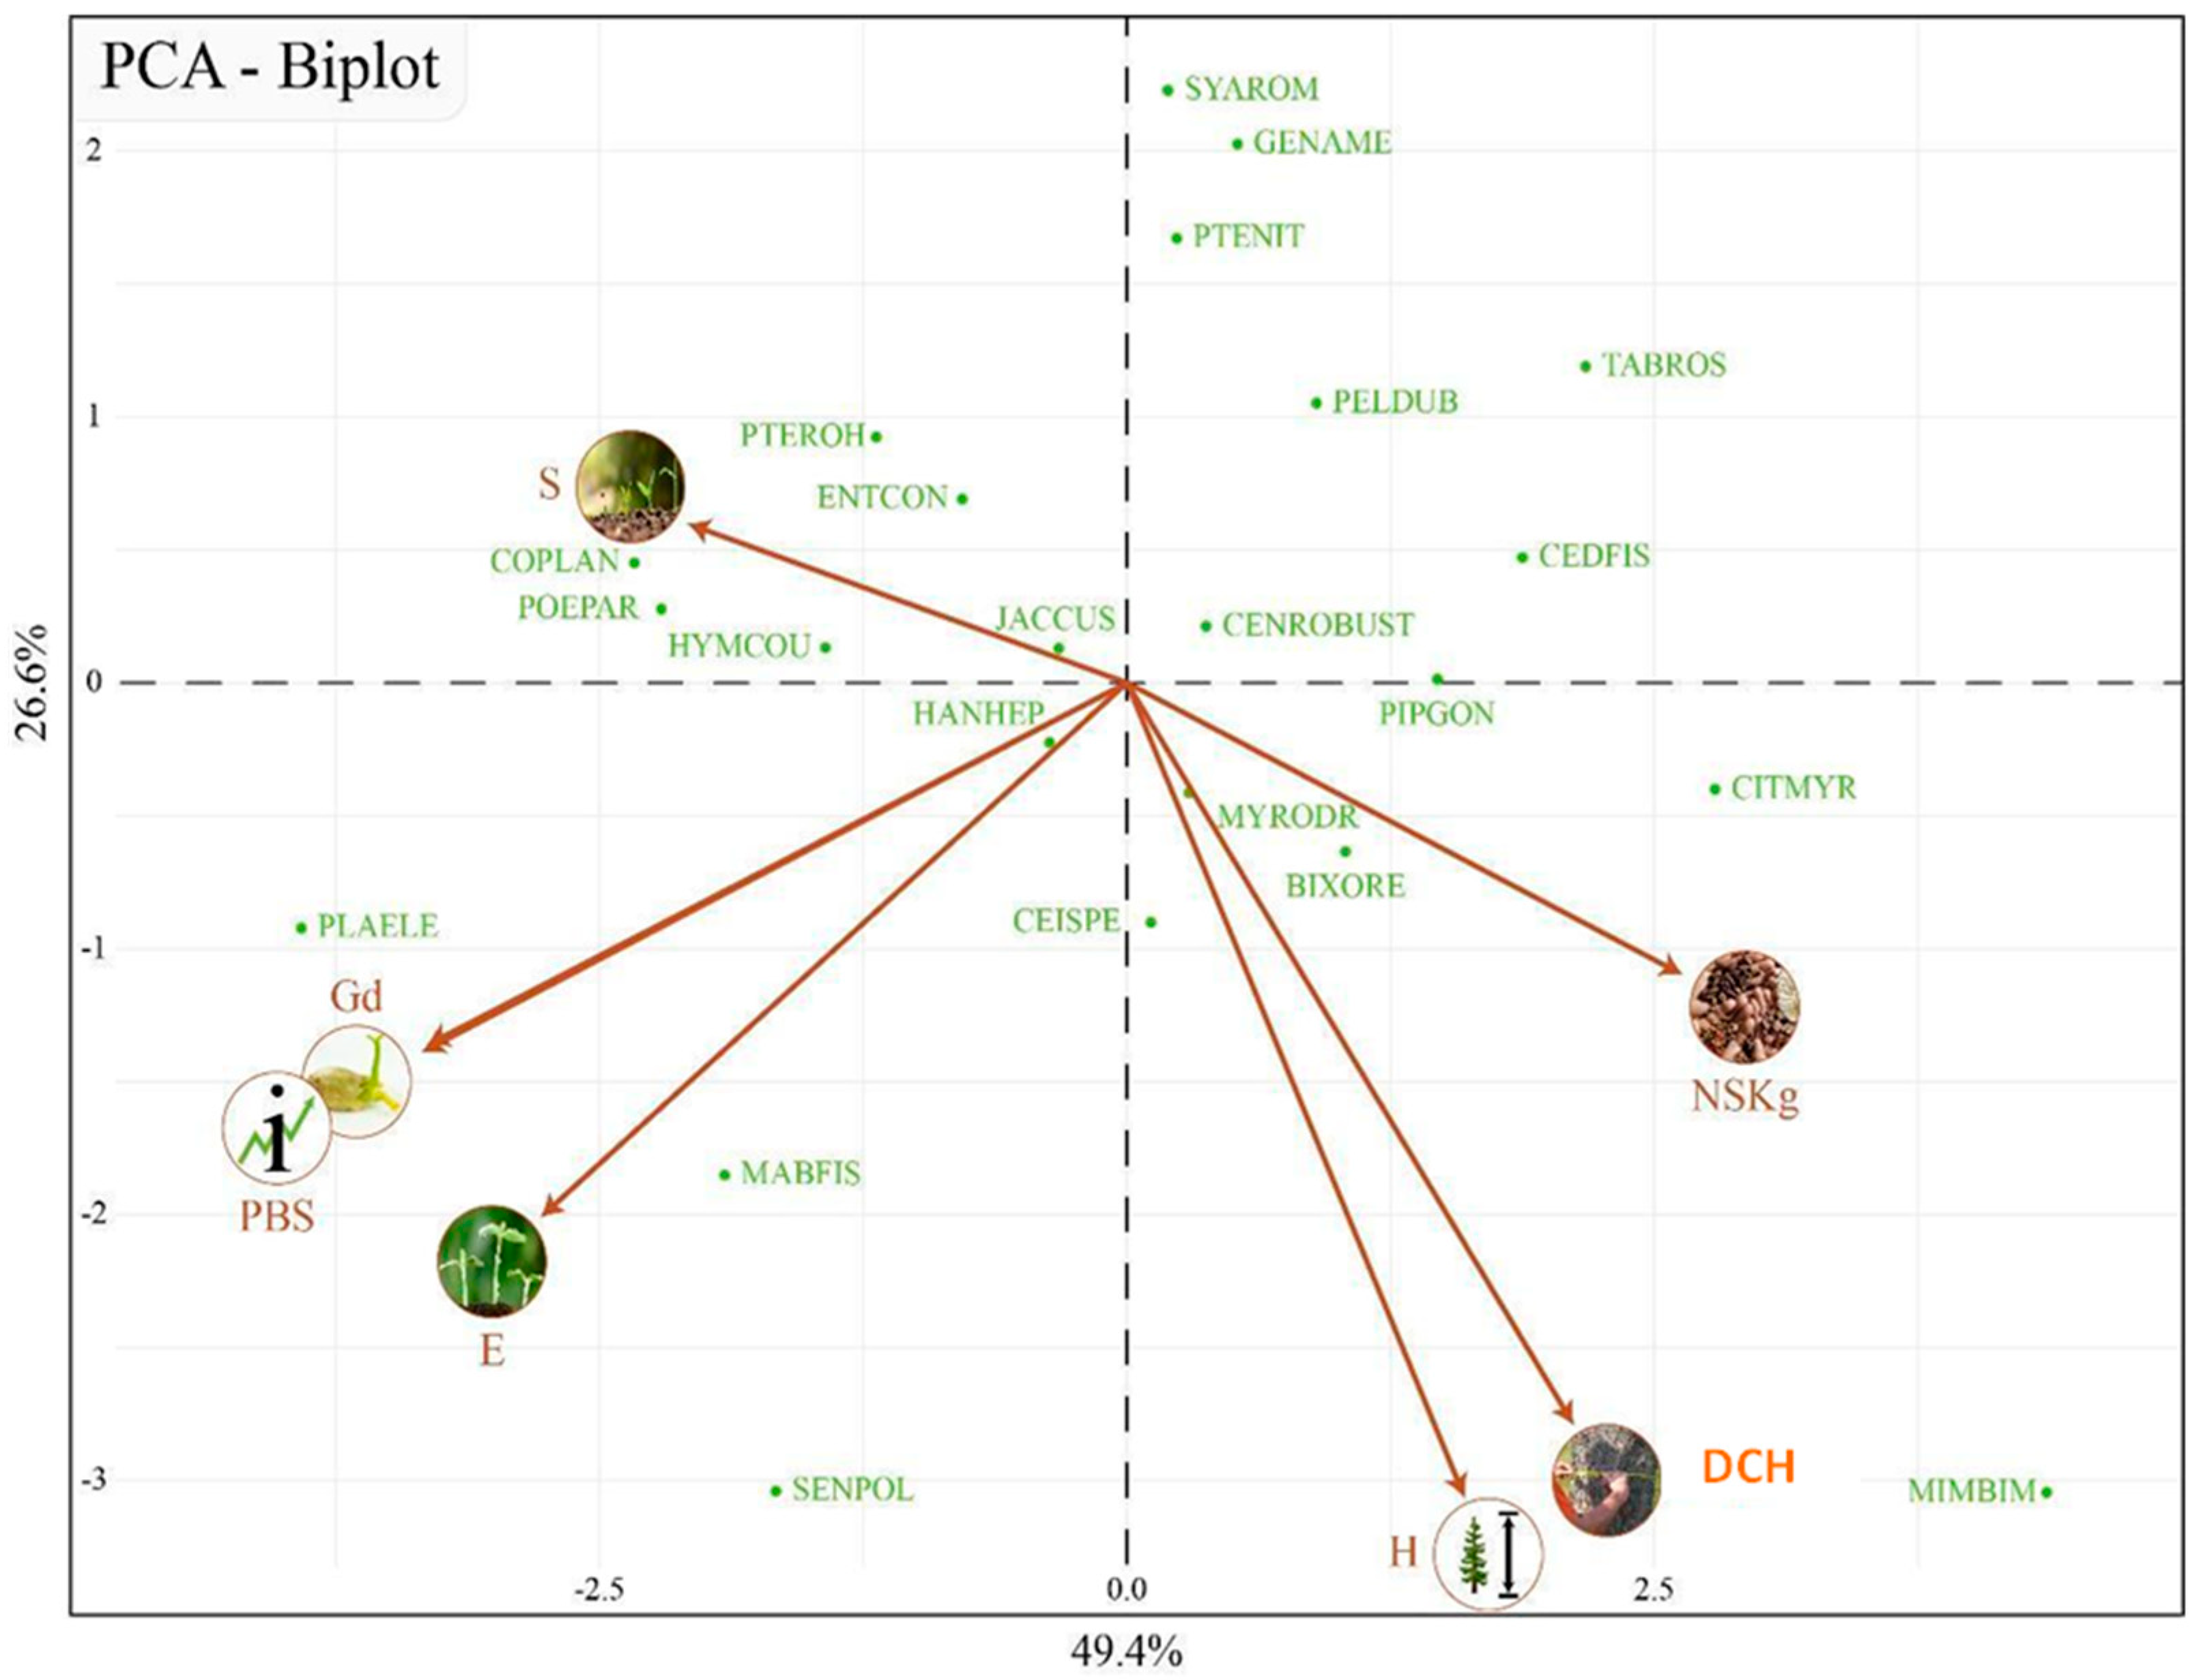
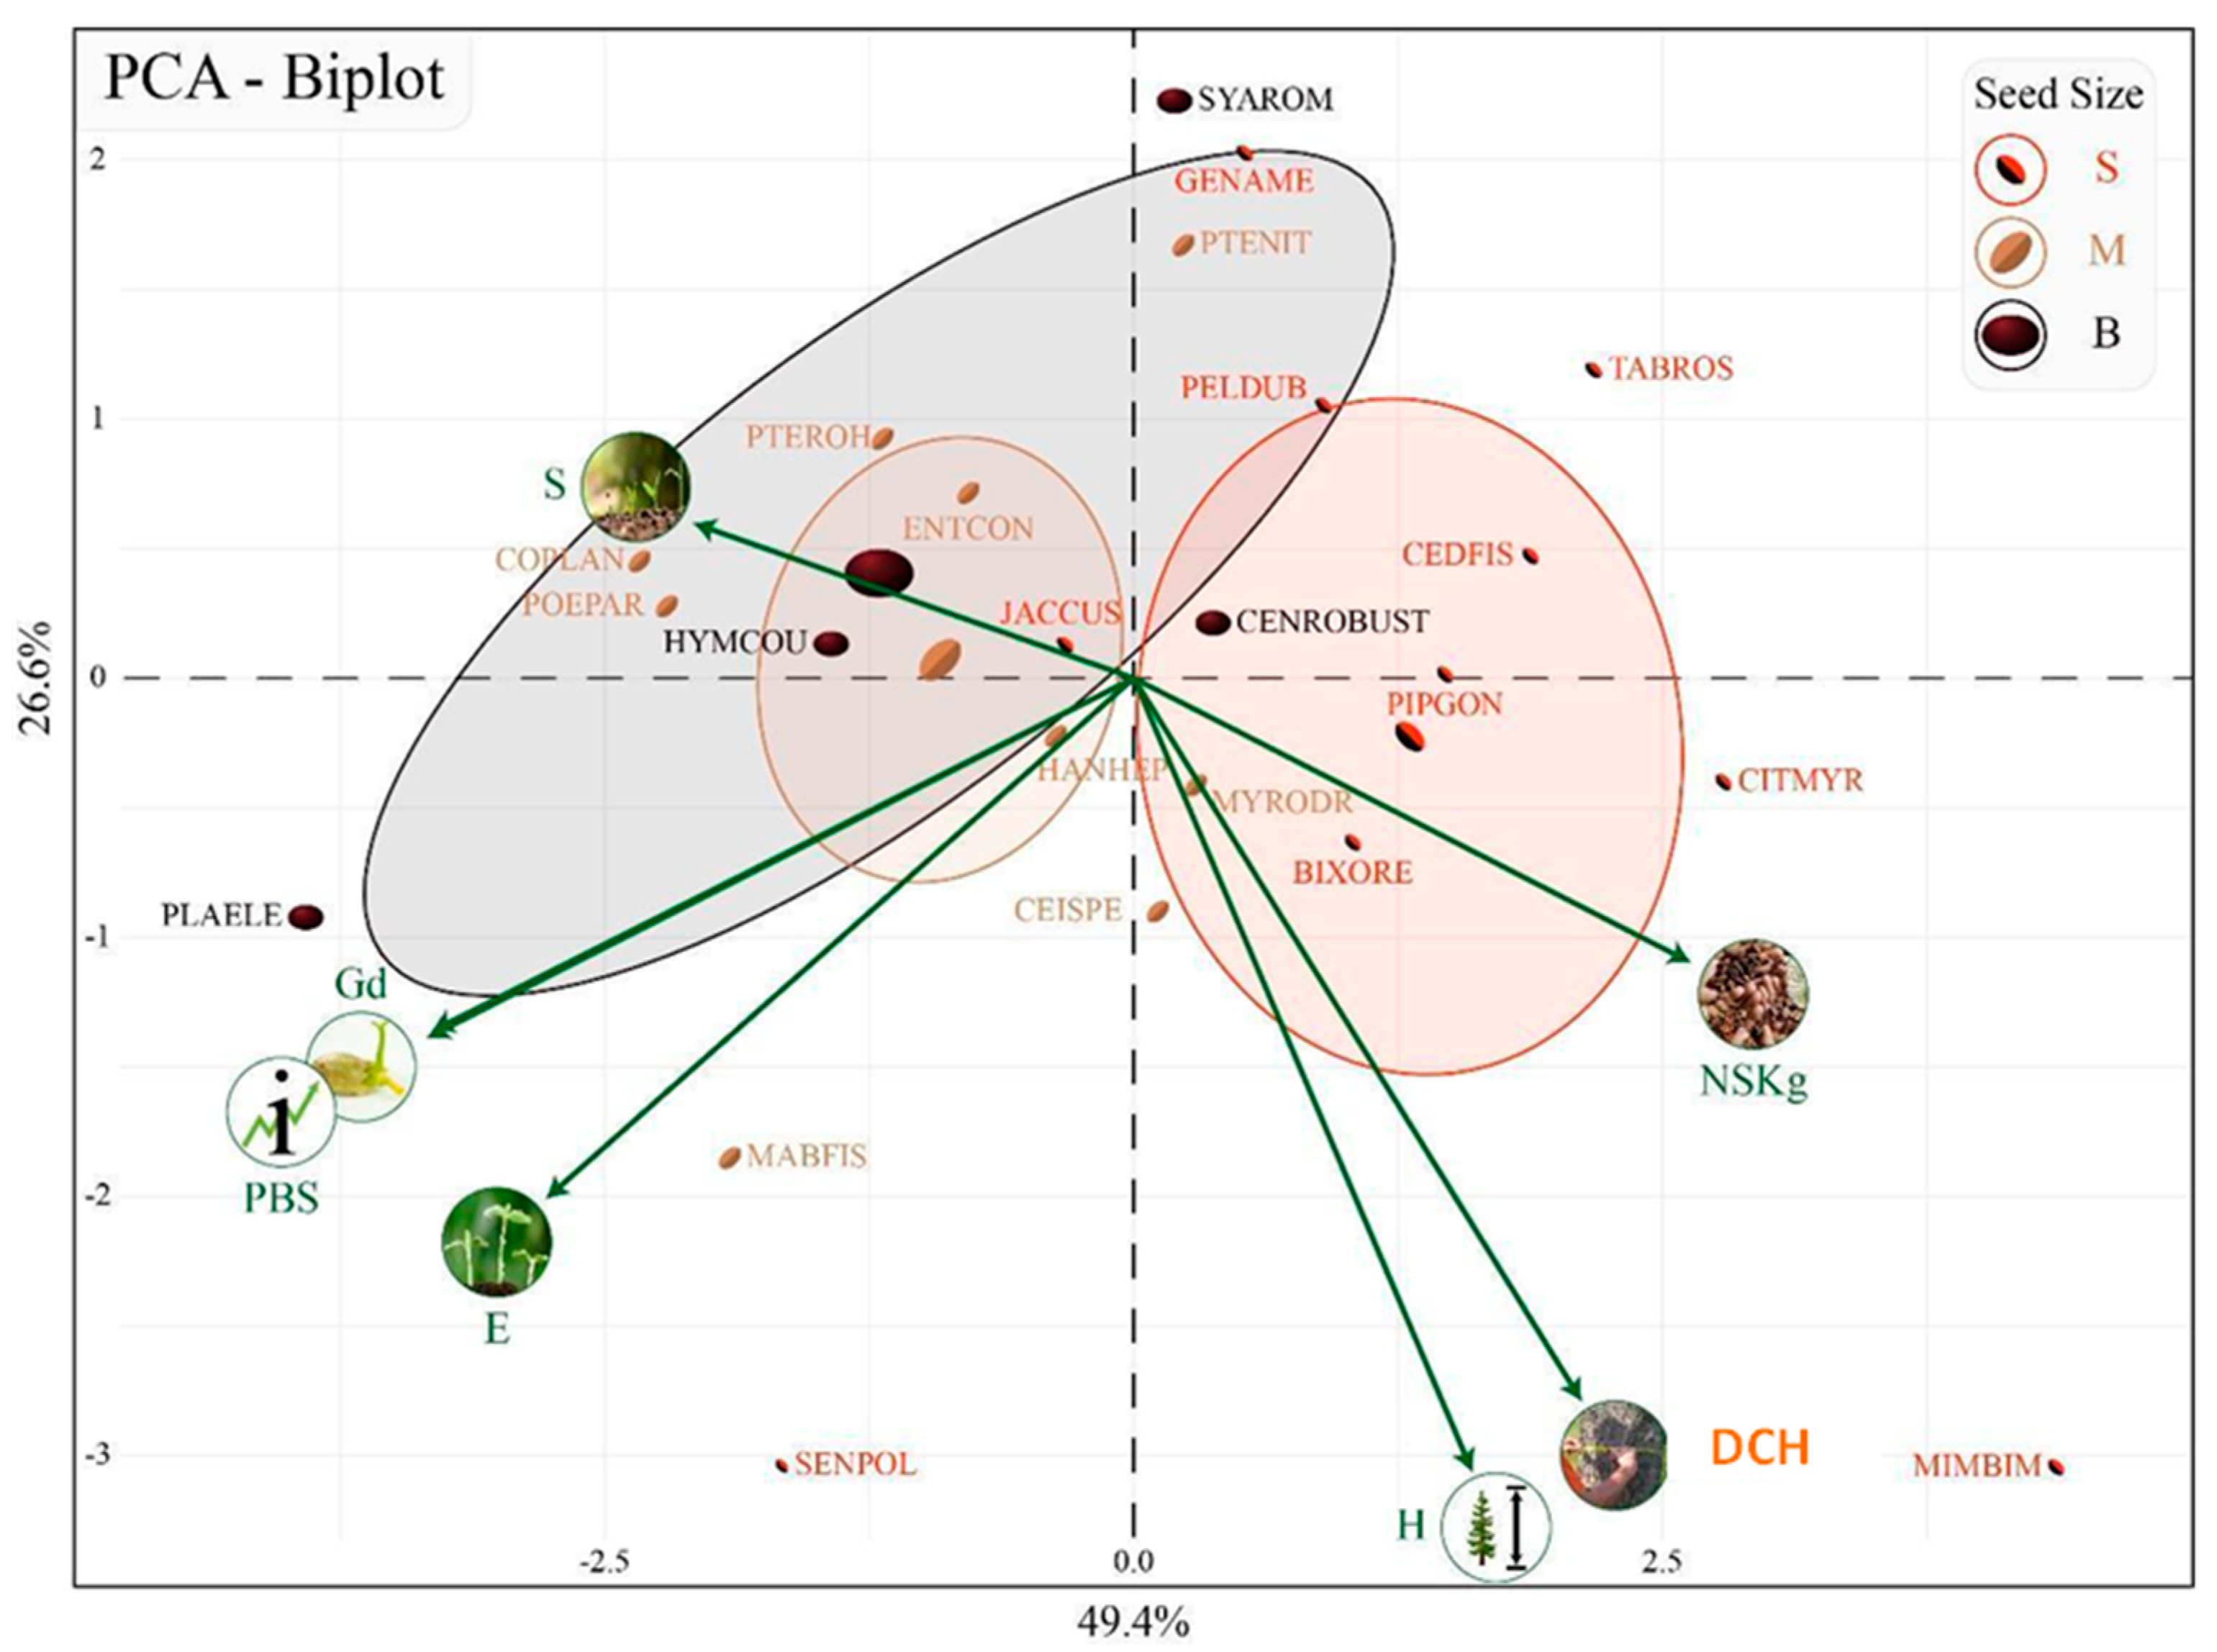
3.3. Early Seed Traits and the Ability for Direct Seeding

Germinability (Gd%) and survival rate (S%) were significant predictors of the probability of success (PBS) (Table 2), whose increase was positively related to field seed emergence and survival rate (Figure 2) represented and adjusted by the equation PBS = 0.008474Gd + 0.029903S − 0.021696 + ℇ. The parameter (β) is related to the value of germinability and survival, reaching the maximum probability of success. Although both germinability and survival expressed the probability of success, probably due to autocorrelation, field seed emergence expressed as germinability was more expressive than survival as a component of the probability of success of one species. This is demonstrated by the robustness of its linear fit with probability of success and the high correlation of Gd (r = 0.99) and PBS and the low correlation of S (r = 0.32) and PBS (see Table 3; see Figure 2).
The first three principal components (PC) were responsible for 89.19% of the total variance (see Table 3). PC1 was responsible for 49.43% of the total variance of the species and was associated with probability of success (r = −0.896), germinability (r = −0.890), and emergence (r = −0.744). The PC2 accounted for 26.6% of the total variance, and the variables height (r = −0.818), diameter at collar height (r = −0.723), and number of seeds per Kg (r = −0.292) most contributed to this component. The PC3 accounted for 13.16% of the total variance and was associated with survival (r = 0.725). To determine the number of principal components, as the first two PCs generated from this analysis had eigenvalues > 1 (λi > 1) and were responsible for 76.03% of the total variance, the first two principal components were considered because they effectively summarize the total sample variance and can be used for the dataset study.
In the correlation circle for PC1 and PC2, the variables (Figure 3) and species (Figure 4) were colored according to their contribution values. The PBS and Gd similarly contributed to PC1, as indicated by the overlapping of the longest vector closer to PC1. There were higher correlations between PBS and Gd (r = 0.99) than between PBS and E (r = 0.82), as revealed by the acute angles between the vectors [0]. Although Gd and PBS were on different sides of the PCA in relation to NSKg, they all had their highest loads with the same PC1, which could suggest a relationship between them. However, there was a low correlation between NSKg and PBS (r = −0.48) and Gd (r = −0.48), which was evidenced by the vector angle close to 90 degrees. The same behavior was observed for H and DCH, with higher contribution to PC2 (Figure 3).
The PC1 was more associated with probability of success, germinability, and emergence, whereas PC2 was more associated with the species correlated with growth variables (H and DCH). The species P. parviflora (POEPAR), C. fissilis (CEDFIS), H. courbaril (HYMCOU), C. langsdorffii (COPLAN), and P. elegans (PLAELE) had a higher correlation with the PC1 variables, whereas C. speciosa (CEISPE), G. americana (GENAME), A. urundeuva (Synonym of Myracrodruon urundeuva—MYRODR), and S. romanzoffiana (SYAROM) had the lowest correlation (Figure 4). In the PC2, S. romanzoffiana (SYAROM), G. americana (GENAME), and P. nitens (PTENIT) had the lowest correlation with the growth variables.
The PCA allows us to see the general “shape” of the data, identifying which samples are similar to each other and which ones are quite different. This makes possible the identification of similar groups of samples and identifies which variables make one group different from another. After filtering species by ecological groups (Figure 5) and seed size (Figure 6), a set of species with a similar response to variables was identified; however, from different ecological groups such as the non-pioneer C. robustum (CENROB), H. heptaphyllus (HANHEP), C. speciosa (CEISPE), and A. urundeuva (ASTURU (Synonym of Myracrodruon urundeuva—MYRODR)), and the pioneer species P. gonoacantha (PIPGON) and B. orellana (BIXORE), which were more associated with the growth variables. Regarding seed size, two sets of species and one subset, which included species of different ranges, were observed. The subset included E. contortisiliquum (ENTCON) (small), H. courbaril (HYMCOU) (large), J. cuspidifolia (JACCUS) (medium), and H. heptaphyllus (HANHEP) (small), which were correlated to survival, and medium species, such as C. langsdorffii (COPLAN), P. parviflora (POEPAR), and P. violaceus (PTEVIO).

4. Discussion

Seed-based restoration is an efficient and cost-effective method despite the low rate of seed establishment, between 5 and 10% [40]. Native seed production for restoration is not an easy process, and reducing seed waste and enhancing the rate of establishment must be a priority in direct seeding.
Communities based on native seed networks produce a high diversity of species but in quantities above the restoration demand [18]. On the other hand, the commercial market is concentrated on easy-production species [41], often with unknown quality or provenance. As demonstrated in our study, although we listed more than 100 selected species, only 38 species were available on the market, ready for purchase. Therefore, native seed production systems need to improve the quality and increase the quantity of seeds to provide commercially viable seeds. Therefore, the use of high density, from 250,000 to 500,000 seeds ha−1 [11,42], needs to be revised.
Our results demonstrated that species selection could lead to sowing density below 250,000 seeds ha−1. As there is a linear relationship between sowing density and seedling emergence [8], based on our research, for a density of 5000 plants ha−1, the sowing density could be reduced to 100,000–110,000 seeds ha−1, which represents a considerable reduction in the number of sowed seeds, provided that the proper selection of species is carried out. However, the trajectory of the community depends on the restoration method adopted [43], and so before selecting species, it is necessary to define which trajectory we intend to reach with the direct seeding.
The framework method uses a small set of species capable of promoting the forest structure and the attraction of dispersers, favoring the entry of new species [44,45]. Direct seeding can be performed with an initial small group of species, which can increase functional diversity as required in restored areas [46]. Although only 23 species have emerged, the diversity (H’ = 2.712) was in the range of passive (H’ = 2.008) and active restoration by seedlings (H’ = 3.017), and nucleation (H’ = 1.965) [7], and only lower than natural native deciduous forests (H’ = 3.272) [43].
After two years, 33 of the 38 selected species established with high survival (82.7 ± 15.2%), a success rate of 5.5%, and a ratio of one surviving plant in the field for every 18 seeds sown, promoting a higher density (13,718 plants ha−1) than seedling plantation (1666 plants ha−1). Seed germinability (Gd = 14.6 ± 14.5%) was in the range reported by other direct sowing studies, such as 4.3 and 20.3% for 3 species [47], 14.9% of emergence for 8 species [9], 8.2 ± 3.7% at 180 days [11], 4.6% ± 6.9% at 161 days for 19 species [48], 8.6% for 36 species [49], and 10% for 38 species [50]. Despite the variable number of species, in general, germinability was below 20%, which demonstrates the low performance and waste of seeds in the field. At the same time, this emphasizes the importance of selecting species with ability for direct seeding and based on seed batch vigor (germinability).
Our study suggests that traits associated with seed vigor measured by field seed emergence, emergence, and seedling survival may show a phylogenetically similar performance in direct seeding. Nevertheless, seedling survival was more phylogenetically correlated between species than seed vigor, which is a highly inheritable trait within species at the individual level [51]. It is noteworthy that surviving plant assemblage may be more related to traits occurring at the species level than at the family level, which reinforces the importance of species selection for direct seeding. As distinctiveness indices are normally independent of the sample size [32], the presence of a higher number of Fabaceae species may not have interfered with the result obtained. However, this result must be verified by analyzing the performance of these families and species in other areas, conditions, and proportions. Fabaceae (15 species), Bignoniaceae, Euphorbiaceae, Malvaceae, Anacardiaceae, and Myrtaceae had the most prominent species richness and density (Table 1). According to previous findings, some families such as Fabaceae, Bignoniaceae, and Euphorbiaceae had good performance and responsiveness to direct seeding [20,46].
According to the framework concept, zoochoric species work as a source of attraction of animal dispersers to introduce new species in the restoration [52]. Although there were no significant differences in germinability between dispersal syndromes (H = 5.528; p = 0.5261), seedling density between anemochoric (n = 9; 6188 ind ha−1) and zoochoric species (n = 6; 2990 ind ha−1) was significantly different (H = 5.647; p = 0.4937). This may be due to the dominance of abiotic syndromes among emerged species; however, we identified that new seedlings from natural regeneration included zoochoric species such as S. terebinthifolia, C. urucurana, and Solanum spp., highlighting the nucleation role of direct seeding.
Although pioneer species were abundant, non-pioneers had a high number of emerging species; therefore, there is a balance between them. Throughout the 60 months, pioneer species showed an expected fast growth but did not differ from non-pioneers in survival. Our results contrast with other studies on active restoration by seedlings with higher growth and survival of pioneer species [53], as well as on direct seeding [54]. Despite their low density, non-pioneer species such as H. courbaril, S. romanzofianum, P. nitens, G. americana, C. speciosa, and C. fissilis had 100% of survival after 60 months, which reflects their persistence. On the other hand, non-pioneer species such as P. elegans (PLAELE) and T. rosoealba (TABROS) had emergence and survival similar to the pioneer species S. poliphylla (SENPOL) and B. orellana (BIXORE) (Table 1) but did not show similarity of behavior regarding early seed traits or ecological group (Figure 5). Our results demonstrated that the dichotomy between pioneer and non-pioneer species did not explain their expected behavior for direct seeding. The relationship between examined traits suggested that early seed traits such as seed vigor (field seed emergence and germinability) and probability of success and seedling density (emergence) were more strongly associated than survival, which is influenced by growth variables (Figure 3 and Figure 5). Thus, we can propose that species’ seed vigor evaluated by field seed emergence may be an important early trait for selecting species with the ability for direct seeding, regardless of their ecological group. Additionally, the probability of success can be seen as a selection criterion, due to its relationship with germinability (r = 0.99) and survival (r = 0.32), which allows us to estimate the number of seeds to be sowed to obtain an expected seedling density.
There was a high variability within each seed size class and only large-seeded species differed from the small ones (Figure 2). Seed size (r(axis1) = −0.77) was opposite to survival, indicating that small seeds, with a higher number of seed kg−1, tend to have lower germinability and survival (Figure 6). Large-seeded species such as S. romanzoffiana had low germinability (2.8%) and abundance (n = 8 ind.) but with the persistence of individuals, which had 88.9% survival at 720 days (Table 1). On the other hand, H. courbaril had medium germinability and high abundance (n = 73 ind.). In turn, among small-seeded species, which tend to have lower performance than large ones in direct sowing [55], S. polyphylla (Fabaceae) proved to have a high ability due to its germinability (28.9%), emergence (n = 219 ind.), survival (90.9%), and growth (H and DCH) (Table 1, Figure 6). Although other studies [14,20] have indicated the efficiency of large-seeded species in direct seeding (558), we found that some small- and medium-seeded species have a similar behavior in direct seeding (Figure 6), with higher richness and abundance of individuals in the surviving plant assembly than the large ones (Table 1). These results suggest that although the classification by size contributes to species selection, it should not be adopted in a generalized way as the main trait for evaluating species’ ability for direct sowing.
As expected, germinability was highly correlated (r = 0.81) with emergence; however, despite germinability and survival having been also applied to assess the probability of success, only germinability was highly correlated with the probability of success (r = 0.997; Figure 3). Survival had a low correlation with germinability (r = 0.288) and emergence (r = 0.295), indicating that different environmental filters affected germinability in the field and seedling establishment (survival). Higher germinability did not guarantee the density of surviving plants, since survival was not correlated with germinability or emergence and depends on the ability or persistence of each species in relation to the environmental filters throughout the establishment and structural phases. This can occur because, after field seed emergence, the environmental filters (weed competition, predation, and others) may drive the community towards phylogenetically related species (such as Fabaceae).
The dominance of newly emerged seedlings occurred in the emergence phase up to 90 days, corroborating other studies [9,42]; however, the abundance of seedlings did not change. Environmental filters in the emergence phase are greater than in the establishment phase [49]. This means that field seed emergence influences the abundance of seedlings (emergence); nonetheless, environmental filters after the 90th day and the management techniques in the establishment and structural phases should be better studied, since the survival of the seedlings did not directly depend on field seed emergence in the trajectory of the assemblage.
Our results suggest that the adopted management practices were efficient in providing the survival of the emerged seeds throughout the establishment and structural phases. Climatic, predation, and other factors can cause high mortality in newly emerged seedlings [12]. The exponential increase observed in plant mortality up to 120 days, associated with a trend towards stabilization of seedling establishment, indicated a critical phase for seedling survival in the emergence phase, referred to as the Critical Phase of Emergence (CPE). Early monitoring of CPE and the intensive use of management practices can favor the emergence of seeds for up to 90–120 days, which can reduce restoration costs and improve direct sowing practices and efficiency.
Studies on direct sowing suggest its use as a supplementary restoration technique for planting seedlings due to the lack of knowledge of species and the low availability of seed suppliers [20,54]. The use of seedlings by direct seeding can complement the diversity of the forest [56] since many species have restricted use in direct sowing, such as species with recalcitrant seeds [19] and those with low growth or emergence failure, which may, in the future, be replaced by seedlings in the form of enrichment [11]. Additionally, direct seeding is indicated for the enrichment of planted areas, aiming to increase the diversity of late species that would hardly come naturally [57] and may require enrichment with late species and be less tolerant to competition with invaders [8,58].
Traits such as successional group, dormancy, and dispersion are related to germinability and emergence. Dormancy is more common in dry and cold severe climates [59]; however, in warm climates, such as in the Atlantic Forest, it is not associated with successional groups, and physiological dormancy is common in small seeds while physical dormancy frequently occurs in autochoric species [60]. In our study, seasonal dry conditions hindered seed emergence. Thus, dormancy was not evaluated as an early seed trait since it was removed to promote a prompt emergence of seedlings after sowing.
The results indicated seed vigor expressed by field seed emergence as a trait to assess species’ ability for direct seeding. Although it can be measured at an individual level [61], due its heritability [51], it can define species phylogenetic response to abiotic changes and their ability to colonize a habitat. Our results emphasize the need to estimate early seed or seedling traits related to seed vigor and emergence and how they can contribute to species ability for direct seeding.

Implications for Direct Seeding

The association between seed vigor expressed by field seed emergence with prompt emergence and survival demonstrated the importance of this trait to understanding species’ ability for direct seeding or even to improve the use of seed lots reducing seed costs and loss. Few studies have considered seed vigor for direct seeding [11,19,55,60,62,63], although nursery or laboratory tests such as tetrazolium [64], germination speed [65], emergence test, and accelerated aging [28] can provide a rapid evaluation of seed vigor to estimate species sowing density and survival. However, management throughout the establishment phase may drive a direct seeding efficiency trajectory, changing the potential seed quality and vigor.
The ability of non-pioneer species seems to be more associated with their persistence, whereas pioneer species ability may be associated with their intrinsic field seed emergence and abundance. Among the 23 species, five groups had similar performance in seed and growth traits, so this functional redundancy allows us to replace one with the other in the case of a lack of seeds for sowing (Figure 4, Figure 5 and Figure 6). Additionally, sowing small and medium-sized species is less expensive than sowing large ones, and small seeds of high ability can reduce costs and increase direct seeding efficiency.
Early seed traits collaborate with restoration practitioners with useful information about the species’ behavior. In our study, late-successional species such as H. courbaril, S. romazoffiana, and T. roseoalba stood out in direct seeding, with a high probability of success and persistence, traits directly associated with their germinability and survival. This indicates that we can use late successional species in direct seeding depending on their ability. Copaifera langsdorffii, Poecilanthe parviflora, and Hymenaea courbaril have a high ability due to their performance in relation to germinability, emergence, and survival. On the other hand, Syagrus romanzoffiana, Genipa americana, and Pterogyne nitens showed high ability due to the persistence of the few emerging seedlings. Species with high ability should be prioritized for restoration due to their growth performance and probability of success. However, the number of seeds per species with high ability needs to be carefully estimated to avoid dominance in community assemblage. Among these, M. fistulifera, S. polyphylla, and C. speciosa, which have rapid growth and high density and survival, may predominate and inhibit the establishment of other species. Slow growth (height and diameter) and highly persistent species should be considered as part of the group of species that provide diversity, contributing to the initial structure in direct seeding.

5. Conclusions

Species selection favored the direct seeding efficiency, contributing to high plant density, richness, and diversity in the restored area, making it possible to reduce seeding density below 250,000 seed ha−1 using 23 species, with survival greater than 80%. We identified species with a high ability for direct seeding. High field emergence and density were observed in the pioneer species M. fistulifera and S. polyphylla and the non-pioneers P. elegans, P. parviflora, H. courbaril, and C. langsdorffii. Persistence was associated with low abundance and high survival of species such as S. romanzoffiana and T. roseoalba. Medium-sized to large seeds were related to a higher probability of success. Species filtering according to their growth, seed vigor, and probability of success provides restorers with practical parameters for the selection of potential species, contributing to defining the number of seeds to be used in direct seeding.
Selection needs to be performed at the species level rather than at the family level, adopting early traits based on seed vigor associated with species performance in direct seeding. Management practices and monitoring in direct seeding need to be intensive in the critical emergence period, from 30 to 90–120 days after sowing to guarantee survival and establishment.
We must emphasize that given the current situation, we have no answer as to whether the germinability was related to the species, or whether it resulted from the characteristics of the seed samples and the conditions of emergence. We suggest studies with the same species in other locations in order to verify if different responses would be evidenced.

Supplementary Materials

The following supporting information can be downloaded at https://www.mdpi.com/article/10.3390/f14030547/s1.

Author Contributions

Conceptualization, F.C.M.P.-R., J.M.S.d.S. and I.P.; methodology, F.C.M.P.-R., I.P., L.S.d.A. and A.M.T.L.; validation, I.P., L.S.d.A., F.C.M.P.-R. and J.M.S.d.S.; formal analysis, H.M.P. and F.C.M.P.-R.; investigation, I.P., L.S.d.A. and A.M.T.L.; resources, F.C.M.P.-R. and J.M.S.d.S.; data curation, I.P. and F.C.M.P.-R.; writing—preparation of the original draft, I.P. and F.C.M.P.-R.; writing—proofreading and editing, F.B.D., B.S.F. and F.C.M.P.-R.; visualization, F.B.D., B.S.F. and F.C.M.P.-R.; inspection, J.M.S.d.S.; project management, F.C.M.P.-R. and J.M.S.d.S. All authors have read and agreed to the published version of the manuscript.

Funding

MBA in Restoration, Licensing and Environmental Adaptation (UFSCar).

Institutional Review Board Statement

Not applicable.

Informed Consent Statement

Not applicable.

Data Availability Statement

Not applicable.

Acknowledgments

We thank Higher Education Personnel Improvement Coordination (CAPES) and the Postgraduate Program in Planning and Use of Renewable Resources at the Federal University of São Carlos for the grants received and MBA in Restoration, Licensing and Environmental Adaptation (UFSCar) for the financial and logistic support.

Conflicts of Interest

The authors declare no conflict of interest.

References

  1. Lebrija-Trejos, E.; Perez-Garcia, E.A.; Meave, J.A.; Bongers, F.; Poorter, L. Functional traits and environmental filtering drive community assembly in a species-rich tropical system. Ecology 2010, 91, 386–398. [Google Scholar] [CrossRef] [PubMed] [Green Version]
  2. Kraft, N.J.B.; Valencia, R.; Ackerly, D.D. Functional traits and niche-based tree community assembly in an amazonian forest. Science 2008, 322, 580–582. Available online: https://www.science.org/doi/10.1126/science.1160662 (accessed on 20 June 2022). [CrossRef] [PubMed] [Green Version]
  3. Mouillot, D.; Mason, N.W.H.; Wilson, J.B. Is the abundance of species determined by their functional traits? A new method with a test using plant communities. Oecologia 2007, 152, 729–737. [Google Scholar] [CrossRef]
  4. Fernández-Pascual, E.; Jiménez-Alfaro, B.; Bueno, A. Comparative seed germination traits in alpine and subalpine grasslands: Higher elevations are associated with warmer germination temperatures. Plant Biol. 2017, 19, 32–40. [Google Scholar] [CrossRef] [PubMed] [Green Version]
  5. Brancalion, P.H.S.; Gandolfi, S.; Rodrigues, R.R. Procedimentos operacionais para aplicação de métodos de restauração florestal. In Restauração Florestal; Brancalion, P.H.S., Gandolfi, S., Rodrigues, R.R., Eds.; Oficina de Textos: São Paulo, Brazil, 2015; pp. 251–285. Available online: http://www.lcb.esalq.usp.br/sites/default/files/publicacao_arq/978-85-7975-019-9.pdf (accessed on 20 June 2022).
  6. Tymus, J.R.C.; Lenti, F.E.B.; Silva, A.P.M.; Isernhagen, I. Restauração da Vegetação Nativa no Brasil. Caracterização de Técnicas e Estimativas de Custo. Relatório de Pesquisa. 2018. Available online: https://www.tnc.org.br/content/dam/tnc/nature/en/documents/brasil/restauracao-da-vegetacao-nativa-no-brasil.pdf (accessed on 20 June 2022).
  7. Trentin, B.E.; Estevan, D.A.; Rossetto, E.F.S.; Gorenstein, M.R.; Brizola, G.P.; Bechara, F.C. Restauração florestal na Mata Atlântica: Passiva, nucleação e plantio de alta diversidade. Ciência Florest. 2018, 28, 160–174. [Google Scholar] [CrossRef] [Green Version]
  8. Meli, P.; Isernhagen, I.; Brancalion, P.H.S.; Isernhagen, E.C.C.; Behling, M.; Rodrigues, R.R. Optimizing seeding density of fast-growing native trees for restoring the Brazilian Atlantic Forest. Restor. Ecol. 2017, 26, 212–219. [Google Scholar] [CrossRef]
  9. Ferreira, R.A.; Santos, P.L.; Aragão, A.G.; Santos, T.I.S.; Santos-Neto, E.M.; Rezende, A.M.D.S. Semeadura direta com espécies florestais na implantação de mata ciliar no Baixo São Francisco em Sergipe. Braz. Sci. For. 2009, 37, 37–46. Available online: https://www.ipef.br/publicacoes/scientia/nr81/cap04.pdf (accessed on 20 June 2022).
  10. Aguirre, A.G.; Lima, J.T.; Teixeira, J.; Gandolfi, S. Potencial da semeadura direta na restauração florestal de pastagem abandonada no município de Piracaia, SP, Brasil. Hoehnea 2015, 42, 629–640. [Google Scholar] [CrossRef] [Green Version]
  11. Freitas, M.G.; Rodrigues, S.B.; Campos-Filho, E.M.; Carmo, G.H.P.; Veiga, J.M.; Junqueira, R.G.P.; Vieira, D.L.M. Evaluating the success of direct seeding for tropical forest restoration for over ten years. For. Ecol. Manag. 2019, 438, 224–232. [Google Scholar] [CrossRef]
  12. Florentine, S.K.; Graz, F.P.; Ambrose, G.; O’brien, L. The current status of different age, direct-seeded revegetation sites in an agricultural landscape in the Burrumbeet Region, Victoria, Australia. Land Degrad. Dev. 2013, 24, 81–89. [Google Scholar] [CrossRef]
  13. Pilon, N.A.L.; Durigan, G. Critérios para indicação de espécies prioritárias para a restauração da vegetação de cerrado. Sci. For. 2013, 41, 389–399. Available online: https://www.ipef.br/publicacoes/scientia/nr99/cap10.pdf (accessed on 20 June 2022).
  14. Palma, A.C.; Laurance, S.G.W. A review of the use of direct seeding and seedling plantings in restoration: What do we know and where should we go? Appl. Veg. Sci. 2015, 18, 561–568. [Google Scholar] [CrossRef]
  15. Havens, K.; Vitt, P.; Still, S.; Kramer, A.T.; Fant, J.B.; Schatz, K. Seed sourcing for restoration in an era of climate change. Nat. Areas J. 2015, 35, 122–133. [Google Scholar] [CrossRef]
  16. Freire, J.M.; Urzedo, D.I.; Piña-Rodrigues, F.C.M. A realidade das sementes nativas no Brasil: Desafios e oportunidades para a produção em larga escala. Seed News 2017, 21, 24–28. [Google Scholar] [CrossRef]
  17. Urzedo, D.I.; Fisher, R.; Piña-Rodrigues, F.C.M.; Freire, J.M.; Junqueira, R.G.P. How policies constrain native seed supply for restoration in Brazil. Restor. Ecol. 2019, 27, 768–774. [Google Scholar] [CrossRef]
  18. Urzedo, D.I.; Piña-Rodrigues, F.C.M.; Feltran-Barbieri, R.; Junqueira, R.G.P.; Fisher, R. Seed networks for upscaling forest landscape restoration: Is it possible to expand native plant sources in Brazil? Forests 2020, 11, 259. [Google Scholar] [CrossRef] [Green Version]
  19. Campos-Filho, E.M.; Costa, J.N.M.N.; Sousa, O.L.; Junqueira, R.G.P. Mechanized direct-seeding of native forests in Xingu, central Brazil. J. Sustain. For. 2013, 32, 702–727. Available online: https://www.tandfonline.com/doi/abs/10.1080/10549811.2013.817341 (accessed on 20 June 2022). [CrossRef]
  20. Ceccon, E.; González, E.J.; Martorell, C. Is direct seeding a biologically viable strategy for restoring forest ecosystems? Evidences from a meta-analysis. Land Degrad. Dev. 2016, 27, 511–520. [Google Scholar] [CrossRef]
  21. Villela, F.N.J.; Manfredini, S.; Corrêa, A.J.M.; Carmo, J.B. Morfopedologia e zoneamento voltado à ocupação. Rev. Dep. Geogr.-USP 2015, 30, 179–192. [Google Scholar] [CrossRef]
  22. Corrêa, L.S.; Cardoso-Leite, E.; Castello, A.C.D.; Coelho, S.; Kortz, A.R.; Villela, F.N.J.; Koch, I. Estrutura, composição florística e caracterização sucessional em remanescente de floresta estacional semidecidual no sudeste do Brasil. Rev. Árvore 2014, 38, 799–809. [Google Scholar] [CrossRef] [Green Version]
  23. Alvares, C.A.; Stape, J.L.; Sentelhas, P.C.; Gonçalves, J.L.M.; Sparovek, G. Ko¨ppen’s climate classification map for Brazil. Meteorol. Z. 2013, 22, 711–728. [Google Scholar] [CrossRef] [PubMed]
  24. Inmet-Instituto Nacional de Meteorologia, 2020. Banco de Dados Meteorológicos. Available online: https://bdmep.inmet.gov.br/ (accessed on 18 May 2021).
  25. Galetti, G.; Silva, J.M.S.; Piña-Rodrigues, F.C.M.; Piotrowiski, I. Análise multicriterial da estabilidade ecológica em três modelos de restauração florestal. Rev. Bras. Ciências Ambient. 2018, 48, 142–157. [Google Scholar] [CrossRef] [Green Version]
  26. Barbosa, L.M.; Shirasuna, R.T.; Lima, F.C.; Ortiz, P.R.T. Lista de Espécies Indicadas Para Restauração Ecológica Para Diversas Regiões do Estado de São Paulo; Instituto de Botânica: São Paulo, Brazil, 2017; pp. 303–436. Available online: https://www.infraestruturameioambiente.sp.gov.br/institutodebotanica/wp-content/uploads/sites/235/2019/10/lista-especies-rad-2019.pdf (accessed on 20 June 2022).
  27. Brasil., 2013. Ministério da Agricultura, Pecuária e Abastecimento. Instruções Para Análise de Sementes de Espécies Florestais. Brasília. Available online: https://www.gov.br/agricultura/pt-br/assuntos/laboratorios/arquivos-publicacoes-laboratorio/florestal_documento_pdf-ilovepdf-compressed.pdf (accessed on 18 November 2019).
  28. Marcos-Filho, J. Seed vigor testing: An overview of the past, present and future perspective. Sci. Agric. 2015, 72, 363–374. [Google Scholar] [CrossRef] [Green Version]
  29. Mori, E.S.; Piña-Rodrigues, F.C.M.; Freitas, N.P. Guia Para Germinação de 100 Espécies Nativas, 1st ed.; Instituto Refloresta: São Paulo, Brazil, 2012; Available online: https://esalqlastrop.com.br/img/publicacoes/C2.pdf (accessed on 18 February 2018).
  30. Piotrowski, I.; Silva, J.M.S.; Piña-Rodrigues, F. Linha do Tempo de Implantação e Manejo de Áreas Restauradas por Semeadura Direta. 2020. Available online: https://www.researchgate.net/publication/348235852_Sistematica_para_implantacao_e_manejo_de_areas_restauradas_por_semeadura_direta_em_Floresta_Decidual (accessed on 23 January 2023).
  31. Magurran, A.E. Measuring Biological Diversity; Blackwell: Oxford, UK, 2004. [Google Scholar]
  32. Clarke, K.R.; Warwick, R.M. A further biodiversity index applicable to species lists: Variation in taxonomic distinctness. Mar. Ecol. Prog. Ser. 2001, 216, 265–278. [Google Scholar] [CrossRef]
  33. Price, A.R.G.; Keeling, M.J.; O’callaghan, C.J. Ocean-scale patterns of ‘biodiversity’ of Atlantic asteroids determined from taxonomic distinctness and other measures. Biol. J. Linn. Soc. Lond. 1999, 66, 187–203. [Google Scholar] [CrossRef] [Green Version]
  34. Liao, X.; Li, Q.; Yang, X.; Zhang, W.; Li, W. Multi-objective optimization for crash safety design of vehicles using stepwise regression model. Chin. J. Mech. Eng. 2007, 35, 561–569. [Google Scholar] [CrossRef]
  35. R Development Core Team. R: A Language and Environment for Statistical Computing; R Foundation for Statistical Computing: Vienna, Austria, 2021. [Google Scholar]
  36. Fox, J.; Weisberg, S. An R Companion to Applied Regression, 2nd ed.; Sage publications: Thousand Oaks, CA, USA, 2010; p. 449. ISBN 978-1-4129-7514-8. [Google Scholar]
  37. Pearson, K. On lines and planes of closest fit to systems of points in space. Philos. Mag. 1901, 2, 559–572. Available online: http://pbil.univ-lyon1.fr/R/pearson1901.pdf (accessed on 18 March 2020). [CrossRef] [Green Version]
  38. Johnson, R.A.; Wichern, D.W. Applied Multivariate Statistical Analysis; Pearson: Prentice Hall, NJ, USA, 2002. [Google Scholar]
  39. Kassambara, A.; Mundt, F. Factoextra: Extract and Visualize the Results of Multivariate Data Analyses. R Package Version 1.0.6. 2019. Available online: https://CRAN.R-project.org/package=factoextra (accessed on 18 February 2020).
  40. Merritt, D.J.; Dixon, K.W. Restoration seed banks—A matter of scale. Science 2011, 332, 424–425. Available online: https://www.science.org/doi/10.1126/science.1203083 (accessed on 18 February 2018). [CrossRef]
  41. Schmidt, I.B.; Ferreira, M.C.; Sampaio, A.B.; Walter, B.M.T.; Vieira, D.L.M.; Holl, K.D. Tailoring restoration interventions to the grassland-savanna-forest complex in central Brazil. Restor. Ecol. 2019, 27, 942–948. [Google Scholar] [CrossRef]
  42. Isernhagen, I. Uso de Semeadura Direta de Espécies Arbóreas Nativas Para Restauração Florestal de Áreas Agrícolas, Sudeste do Brasil. 2010. Tese (Doutorado em Ciências-Recursos Florestais)-Departamento de Ciências Florestais, Universidade de São Paulo-Escola Superior de Agricultura “Luiz de Queiroz”, Piracicaba, 2010. Available online: https://www.teses.usp.br/teses/disponiveis/11/11150/tde-20102010-155109/pt-br.php (accessed on 16 August 2020).
  43. Corsini, C.R.; Scolforo, J.R.S.; Oliveira, A.D.; Mello, J.M.; Machado, E.L.M. Diversidade e similaridade de fragmentos florestais nativos situados na região nordeste de Minas Gerais. Cerne 2014, 20, 1–10. [Google Scholar] [CrossRef] [Green Version]
  44. Shoo, L.P.; Freebody, K.; Kanowski, J.; Catterall, C.P. Slow recovery of tropical old-field rainforest regrowth and the value and limitations of active restoration. Conserv. Biol. 2016, 30, 121–132. [Google Scholar] [CrossRef] [PubMed]
  45. Elliot, S.; Navakitbumrung, P.; Kuarak, C.; Zangkum, S.; Anusarnsunthorn, V.; Blakesley, D. Selecting framework tree species for restoring seasonally dry tropical forests in northern Thailand based on field performance. For. Ecol. Manag. 2003, 184, 177–191. [Google Scholar] [CrossRef]
  46. Rodrigues, S.B.; Freitas, M.G.; Campos-filho, E.M.; do Carmo, G.H.P.; da Veiga, J.M.; Junqueira, R.G.P.; Vieira, D.L.M. Direct seeded and colonizing species guarantee successful early restoration of South Amazon forests. For. Ecol. Manag. 2019, 451, 117559. [Google Scholar] [CrossRef]
  47. Pérez, D.R.; González, F.; Ceballos, C.; Oneto, M.E.; Aronson, J. Direct seeding and outplantings in drylands of Argentinean Patagonia: Estimated costs, and prospects for large-scale restoration and rehabilitation. Restor. Ecol. 2019, 27, 1105–1116. [Google Scholar] [CrossRef]
  48. Pietro-Souza, W.; Silva, N.M. Plantio manual de muvuca de sementes no contexto da restauração ecológica de áreas de preservação permanente degradadas. Rev. Bras. Agroecol. 2014, 9, 63–74. Available online: http://revistas.aba-agroecologia.org.br/index.php/rbagroecologia/article/view/15350 (accessed on 18 February 2018).
  49. Oliveira, M.C.; Leite, J.B.; Galdino, P.S.; Ogata, R.S.; Silva, D.A.; Ribeiro, J.F. Sobrevivência e crescimento de espécies nativas do Cerrado após semeadura direta na recuperação de pastagem abandonada. Neotrop. Biol. Conserv. 2019, 14, 313–327. [Google Scholar] [CrossRef]
  50. Pellizzaro, K.F.; Cordeiro, A.O.O.; Alves, M.; Motta, C.P.; Rezende, G.M.; Silva, R.R.P.; Ribeiro, J.F.; Sampaio, A.B.; Vieira, D.L.M.; Schmidt, I.B. “Cerrado” restoration by direct seeding: Field establishment and initial growth of 75 trees, shrubs and grass species. Braz. J. Bot. 2017, 40, 681–693. [Google Scholar] [CrossRef] [Green Version]
  51. Martínez-Garza, C.; Bongers, F.; Poorter, L. Are functional traits good predictors of species performance in restoration plantings in tropical abandoned pastures? For. Ecol. Manag. 2013, 303, 35–45. [Google Scholar] [CrossRef]
  52. Soler-Guilhen, J.H.; Bernardes, C.O.; de Souza Marçal, T.; Oliveira, W.B.d.S.; Ferreira, M.F.d.S.; Ferreira, A. Euterpe edulis seed germination parameters and genotype selection. Acta Scientiarum. Agronomy 2019, 42, e42461. [Google Scholar] [CrossRef] [Green Version]
  53. Leitão, F.H.M.; Marques, M.C.M.; Ceccon, E. Young restored forests increase seedling recruitment in abandoned pastures in the Southern Atlantic rainforest. Rev. Biol. Trop. 2010, 58, 1271–1282. Available online: https://www.scielo.sa.cr/scielo.php?pid=S0034-77442010000400019&script=sci_arttext&tlng=en (accessed on 18 February 2018). [PubMed] [Green Version]
  54. Doust, S.J.; Erskine, P.D.; Lamb, D. Restoring rainforest species by direct seeding: Tree seedling establishment and growth performance on degraded land in the wet tropics of Australia. For. Ecol. Manag. 2008, 256, 1178–1188. [Google Scholar] [CrossRef]
  55. Souza, D.C.; ENGEL, V.L. Direct seeding reduces costs, but it is not promising for restoring tropical seasonal forests. Ecol. Eng. 2018, 116, 35–44. [Google Scholar] [CrossRef] [Green Version]
  56. Ceccon, E. Restauración en Bosques Tropicales: Fundamentos Ecológicos, Prácticos y Sociales; Ediciones Diaz Santos: Mexico City, Mexico, 2014; 288p, Available online: https://www.crim.unam.mx/web/sites/default/files/Muestra_Restauracion%20de%20bosques.pdf (accessed on 18 February 2018).
  57. Guerin, N.; Isernhagen, I.; Vieira, D.L.M.; Campos-Filho, E.M.; Campos, R.J.B. Avanços e próximos desafios da semeadura direta para restauração ecológica. Restauração Ecológica Ecossistemas Degrad. 2015, 2, 331–376. Available online: https://www.researchgate.net/publication/273381379_Avancos_e_Proximos_Desafios_da_Semeadura_Direta_para_Restauracao_Ecologica#fullTextFileContent (accessed on 16 August 2020).
  58. Santos, P.L.; Ferreira, R.A.; Aragão, A.G.; Amaral, L.A.; Oliveira, A.S. Estabelecimento de espécies florestais nativas por meio de semeadura direta para recuperação de áreas degradadas. Rev. Árvore 2012, 36, 237–245. [Google Scholar] [CrossRef] [Green Version]
  59. de Souza, T.V.; Torres, I.C.; Steiner, N.; Paulilo, M.T.S. Dormência de sementes em espécies arbóreas da Mata Atlântica Tropical Brasileira e suas relações com características de sementes e condições ambientais. Braz. J. Bot. 2015, 38, 243–264. [Google Scholar] [CrossRef]
  60. Cole, R.J.; Holl, K.D.; Keene, C.L.; Zahawi, R.A. Direct seeding of late-successional trees to restore tropical montane forest. For. Ecol. Manag. 2011, 261, 1590–1597. [Google Scholar] [CrossRef]
  61. Jurado, E.; Flores, J. Is seed dormancy under environmental control or bound to plant traits? J. Veg. Sci. 2005, 16, 559–564. [Google Scholar] [CrossRef]
  62. Lavorel, S.; Garnier, E. Predicting changes in community composition and ecosystem functioning from plant traits: Revisiting the Holy Grail. Funct. Ecol. 2002, 16, 545–556. [Google Scholar] [CrossRef]
  63. Silva, R.R.P.; Vieira, D.L.M. Direct seeding of 16 Brazilian savanna trees: Responses to seed burial, mulching and an invasive grass. Appl. Veg. Sci. 2017, 20, 410–421. [Google Scholar] [CrossRef] [Green Version]
  64. Masullo, L.S.; Piña-Rodrigues, F.C.M.; Figliolia, M.B.; Américo, C.C. Otimização de testes de tetrazólio para avaliar a qualidade de Platymiscium floribundum, Lonchocarpus muehlbergianus e Acacia polyphylla DC. Sementes. J. Seed Sci. 2017, 39, 189–197. [Google Scholar] [CrossRef]
  65. Ranal, M.A.; Santana, D.G. How and Why to Measure the Germination Process? Braz. J. Bot. 2006, 29, 1–11. [Google Scholar] [CrossRef] [Green Version]
Figure 1. Boxplot for germinability at 720 days after sowing, of large (<1000 seed kg−1), medium (>1000 and <10,000 seed kg−1), and small-seeded (>10,000 seed kg−1) forest species. Only big seeds differed from small ones (p < 0.01).
Forests 14 00547 g001
Figure 2. Representation of the probability of success (PBS) linear model as a function of germinability (%) and survival rate (%) of 23 species in direct seeding in a deciduous forest in Brazil.
Forests 14 00547 g002
Figure 3. Principal component analysis (PCA) applied to early seed trait variables. PC1 and PC2 represented 49.3% and 26.6% of total variation, respectively. Vectors are colored according to contribution values. Gd = germinability (%); E = emergence (number of emerged seedlings); H = seedling height (cm) at 720 days, DCH = diameter at collar height (mm) at 720 days; NSKg = number of seeds per kilogram; S = survival (%) at 720 days; PBS = probability of success.
Forests 14 00547 g003
Figure 4. Principal component analysis (PCA) applied to early seed trait variables and 23 species. Vectors according to contribution values of each variable. PC1 (x-axis) represented 49.3% and PC2 (y-axis) 26.6% of total variation. Gd = germinability (%); E = emergence (number of emerged seedlings); H = seedling height (cm) at 720 days, DCH = diameter at collar height (mm) at 720 days; NSKg = number of seeds per kilogram; S = survival (%) at 720 days; PBS = probability of success. Species code is described in Table 1.
Forests 14 00547 g004
Figure 5. Principal component analysis (PCA) applied to early seed trait variables and 23 species, colored according to their ecological groups. PC1 (x-axis) represented 49.3% and PC2 (y-axis) 26.6% of total variation. Species inside an ellipse circle are similar, and vectors are variables that most represent their similarity. Gd = germinability (%); E = emergence (number of emerged seedlings); H = seedling height (cm) at 720 days, DCH = diameter at collar height (mm) at 720 days; NSKg = number of seeds per kilogram; S = survival (%) at 720 days; PBS = probability of success. Species code is described in Table 1.
Forests 14 00547 g005
Figure 6. Principal component analysis (PCA) applied to early seed trait variables and 23 species, colored according to the number of seeds per kilogram (NSKg). PC1 (x-axis) represented 49.3% and PC2 (y-axis) 26.6% of total variation. Species inside ellipses are similar and vectors are variables that most represent their similarity. Gd = germinability (%); E = emergence (number of emerged seedlings); H = seedling height (cm) at 720 days, DCH = diameter at collar height (mm) at 720 days; NSKg = number of seeds per kilogram; S = survival (%) at 720 days; PBS = probability of success; S = small seeds; M = medium seeds and B = big seeds. Species code is described in Table 1.
Forests 14 00547 g006
Table 1. Size classes (Sz)—large (L < 1000 seed.kg−1), medium (1000 ≤ M ≤10,000 seed kg−1), small (S < 10,000 seed kg−1); ecological group—EG (P = pioneer, NP = non-pioneer), dispersion (Disp): anemochoric (Ane), autochoric (Aut), and zoochoric (Zoo); number of seeds per kilogram (NS Kg−1), number of seeds in the plots (NS plots−1), germination (G%), germinability (Gd%), number of newly emerged seedlings (E), and number of plants per hectare (density-Den).
Scientific NameAcronymsFamilySzEGDispNS Kg−1NS Plots−1G (%)Gd (%)EDen (ind.hec)
Senegalia polyphylla (DC.) Britton & RoseSENPOLFabaceaeSPAut13,8298357728.92412510
Platypodium elegans VogelPLAELEFabaceaeLNPAne8853265953.41741813
Handroanthus heptaphyllus (Vell.) MattosHANHEPBignoniaceaeMNPAne40,0008357616.31361417
Mabea fistulifera Mart.MABFISEuphorbiaceaeMPAut96003265738.71261313
Copaifera langsdorffii Desf.COPLANFabaceaeMNPZoo17203266633.11081125
Jacaranda cuspidifolia Mart.JACCUSBignoniaceaeSNPAne33,0008357812.81071115
Poecilanthe parviflora Benth.POEPARFabaceaeMNPAut23503264331.91041083
Hymenaea courbaril L.HYMCOUFabaceaeLNPZoo3253262924.279823
Bixa orellana L.BIXOREBixaceaeSPZoo31,000835569.277802
Pterocarpus violaceus VogelPTEVIOFabaceaeMNPAne25713262221.570729
Astronium urundeuva (M. Allemão) Engl.ASTURUAnacardiaceaeSNPAut55,500835858.067698
Enterolobium contortisiliquum (Vell.) MorongENTCONFabaceaeMPAut30003263516.353552
Ceiba speciosa (A.St.-Hil.) RavennaCEISPEMalvaceaeMNPAne57003267415.350521
Centrolobium robustum (Vell.) Mart. Ex Benth.CENROBFabaceaeLNPAne98326----10.434354
Peltophorum dubium (Spreng.) Taub.PELDUBFabaceaeSPAut20,850835793.731323
Pterogyne nitens Tul.PTENITFabaceaeMNPAne5250326174.314146
Mimosa bimucronata (DC.) KuntzeMIMBIMFabaceaeSPAut88,500835411.412125
Genipa americana L.GENAMERubiaceaeSNPZoo14,250835461.311115
Syagrus romanzoffiana (Cham.) GlassmanSYAROMArecaceaeLNPZoo800326102.8994
Piptadenia gonoacantha (Mart.) J.F.Macbr.PIPGONFabaceaeSPAut21,50083530.6552
Tabebuia roseoalba (Ridl.) SandwithTABROSBignoniaceaeSNPAne69,000835900.6552
Cedrela fissilis Vell.CEDFISMeliaceaeSNPAne36,000326651.2442
Citharexylum myrianthum Cham.CITMYRVerbenaceaeSPZoo19,000835180.4331
Albizia niopoides (Spruce ex Benth.) BurkartALBNIOFabaceaeSPAut36,00083515000
Apeiba tibourbou Aubl.APETIBMalvaceaeSsPZoo265,00083528000
Cecropia pachystachya TréculCECPACUrticaceaeSsPZoo1,172,00083543000
Cupania vernalis Cambess.CUPVERSapindaceaeMNPZoo35003264000
Gallesia integrifolia (Spreng.) Harms.GALINTPhytolaccaceaeSNPAne19,50083581000
Guazuma ulmifolia Lam.GUAULMMalvaceaeSsPZoo132,00083559000
Maclura tinctoria (L.) D.Don ex Steud.MACTINMoraceaeSsNPZoo364,30083575000
Myroxylon peruiferum L.f.MYRPERFabaceaeMNPAne180032671000
Psidium myrtoides O.BergPSIMYRMyrtaceaeSNPZoo23,64532636000
Psidium rufum Mart. Ex DC.PSIRUFMyrtaceaeSNPZoo12,60083581000
Schinus terebinthifolia RaddiSCHTERAnacardiaceaeSPZoo40,5008352000
Senna multijuga (Rich.) H.S.Irwin & BarnebySENMULFabaceaeSPZoo89,00083532000
Myrsine coriacea (Sw.) R.Br. ex Roem. & Schult.MYRCORPrimulaceaeSPZoo20,5008350000
Croton floribundus (Spreng.) HarmsCROFLOREuphorbiaceaeSsPAut31,1508350000
Croton urucurana Baill.CROURUEuphorbiaceaeSsPAut120,0008350000
Table 2. Stepwise analysis results with the models for each predictor variable and the probability of success (PBS). Values of the coefficients of intercept, germinability and survival, and the fitting equation (PBS = 0.008474Gd + 0.029903S − 0.021696 + ℇ) results with the significant variables (Gd% and S%), showing the data of the coefficient of determination (R2—%), adjusted coefficient of determination (R2aj—%), standard error (Sxy—%), and F statistic (p < 0.05). Probability of success (PBS), Germinability (Gd%), Emergence (E) and survival rate (S%), AIC= Akaike’s information criterion. Significance levels are shown as * 0.05 and *** 0.001.
Model AIC
PBS~E + Gd + S AIC = −217.54
PBS~Gd + S AIC = −219.13
VariablesCoefficientSignificance
Interceptβ0 = −0.0216960.0335 *
Germinability (Gd%)β1 = 0.008474<2 × 10⁻¹⁶ ***
Survival (S%)β2 = 0.0299030.0194 *
Fitting equation coefficients
R2 (%) 99.62
R2aj (%) 99.59
Sxy% 0.008
p-value 2.2 × 10⁻¹⁶ ***
Table 3. Proportion of variance, cumulative proportion of the three principal components axis (PC1, PC2, and PC3), weighting coefficients, and correlation coefficients of functional trait variables, with the first two principal components (PC1 and PC2). E = Emergence (cumulative number of emerged seedlings); H = seedling height (cm) at 720 days, DCH = diameter at collar height (mm) at 720 days; NSKg = number of seeds per kilogram; Gd = germinability (%); S = survival (%) at 720 days; PBS = probability of success.
PC1PC2PC3
Cumulative proportion 0.49430.76030.8919
Weighting coefficientsCorrelation coefficients
VariablesPC1PC2PC1PC2
E−0.40−0.39−0.74−0.54
H0.23−0.600.43−0.82
DCH0.31−0.530.57−0.72
NSKg0.38−0.210.70−0.29
Gd−0.48−0.27−0.89−0.36
S−0.300.12−0.560.16
PBS−0.48−0.27−0.90−0.37
Disclaimer/Publisher’s Note: The statements, opinions and data contained in all publications are solely those of the individual author(s) and contributor(s) and not of MDPI and/or the editor(s). MDPI and/or the editor(s) disclaim responsibility for any injury to people or property resulting from any ideas, methods, instructions or products referred to in the content.

