Abstract
In the Siberian Arctic, worldwide largest forest mortality was caused by chronical (since the 1940s) influence of SO2 emissions on the larch-dominant communities. We hypothesized that warming might mitigate SO2 influence by increasing trees’ vigor and growth. We studied trees (larch, Larix sibirica; spruce, Picea obovate; birch, Betula pendula) and bushes (willow, Salix sp., alder, Duschekia fruticosa) growth dependence on SO2, air temperature, soil temperature and moisture, and precipitation. We sampled woods in severely damaged larch and moderately damaged mixed larch, spruce and birch forests. We generated tree ring chronologies and growth indices (GI). We used Terra/MODIS satellite data for mapping trends of vegetation (NDVI) and productivity (GPP, NPP) indexes. In the larch forest, we found a strong decrease in GI and tree mortality, which lasted until the end of 1990s. In the mixed forest, larch and birch were more resistant to SO2 influence compared to spruce. SO2, air and soil temperatures were mediators of all woody species growth. Winter precipitation stimulated trees growth by mitigating spring water stress. Warming onset in the 2000s led to a pronounced increase of all woody species growth. June–July air and soil temperatures, together with a moderate decrease in SO2 emissions, were the primary drivers of that phenomenon. Increasing trends of GPP, NPP, and NDVI were observed within the large part of earlier damaged forests, which was attributed to trees GI increase together with the expansion of SO2-resistant grasses and bushes.
1. Introduction
The high warming rate in the Arctic has lead to increased fire rate, permafrost melting, and consequent changes in vegetation productivity and species composition [1,2,3]. Within the Siberian Arctic, warming is combined with air pollution caused by smelters located in the Norilsk industrial region. In that region, the subarctic vegetation has experienced the chronic influence of pollutants (mostly sulfur dioxide) over the past 70 years. The scale and consequences of the pollution impact on the subarctic landscapes is a unique phenomenon both within and beyond the Arctic Circle.
Norilsk is the world’s largest northern city, located 300 km beyond the Arctic Circle (Figure 1). Norilsk’s industry provided its first metallurgy products (nickel, copper, cobalt, and platinoids) in 1942. By the end of the 1980s, Norilsk’s metallurgy and mining had developed rapidly [4]. In addition to the first nickel and copper plants, a huge plant, named Nadezhda, was constructed in 1979. Nadezhda’s emissions were transferred over a long distance due to its high (250 m) smokestack, located at an elevation of c. 200 m. The smokestacks of copper and nickel plants are shorter (c. 180 m), and they are usually located on the plains. Sulfur dioxide output reached its maximum in 1985 (c. 2.5 M t). At present, emission volume has decreased to c. 1.5 M t due to technological improvements and closure of the nickel plant in 2016 y [5]. Nowadays, Norilsk industry provides, alongside nickel and copper, gold, silver, platinoids (palladium, osmium, iridium, rhodium, and ruthenium), selenium, tellurium, and sulfur [4]. Although that production is in demand worldwide, sulfur and nitrogen oxides and heavy metal pollutants are harmfully influencing subarctic larch-dominant forests and ground-cover communities (mostly moss and lichen), which have experienced decline and mortality since the 1950s [6,7,8,9,10,11]. The scale of vegetation disturbances is much larger than in similar areas near the Sudbury industry (Canada) [12], and Monchegorsk, Karabash, and Revda (Russia) [6,13,14,15,16].
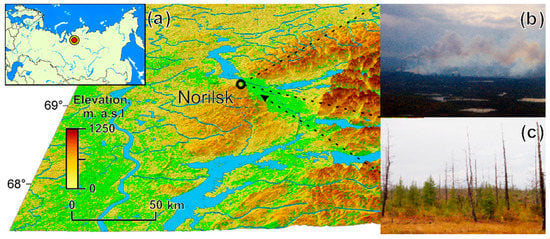
Figure 1.
(a) The study area. The background: green shows NDVI index mean values (2001–2022); yellow-brown colors show elevations. (b) Airborne view of the emissions plum. (c) An example of larch forest within SO2 emission influence zone.
Previous studies of the “Norilsk phenomenon” were focused on the pollution-driven temporal dynamics and scale of larch tree growth and vegetation cover mortality [7,8,9,10,17]. However, those studies did not consider woody species growth dependence on the climate variables or, in a broader aspect, vegetation growth and productivity in the warming subarctic climate. Meanwhile, in a recent paper [11], it was shown that warming led to an increasing trend of larch growth and vegetation productivity within the polluted territories near to Norilsk.
The issue of combined pollutions and the influence climate warming on the trees’ vigor is still unclear [18]. Thus, Zvereva et al. [19] hypothesized that warming may increase trees’ sensitivity to pollutants because, in warm and rainy climates at low latitudes, trees are more sensitive to pollutants. However, trees at Arctic latitudes are inhibited by a harsh environment, i.e., low air and soil temperatures and short growth period. Current warming has led to a growth increase of the woody species, including permafrost-dominant Larix species [3,11]. We suggest that more vigorous trees will be less vulnerable to the harsh environment, including air pollutants. We suggest that warming will increase tree growth and decrease tree vulnerability to the habitat’s stresses, including pollutants. We hypothesize that climate change at high latitudes might mitigate the influence of adverse emissions on typical subarctic trees (larch, Larix sibirica Ledeb; spruce, Picea obovata Ledeb; and birch, Betula pendula Roth) and bush species.
We also suggest that warming may lead to increased tree growth and increasing trends of the vegetation cover gross (GPP) and net (NPP) primary productivity. We aim to analyze the combined influence of air pollution (mainly sulfur dioxide) and climate warming on the main subarctic tree and shrub species as well as on the productivity of larch-dominant communities within the whole area of Norilsk’s emission territory.
We seek the answers to the following questions:
- What are the consequences of the combined pollution and warming influence on the growth and dieback of the main tree and shrub species?
- What are the temporal trends of GPP, NPP, and NDVI within the polluted area?
2. Materials and Methods
2.1. Study Area
The study area is located within lowlands and wetlands surrounded by offshoots of the Putorana plateau. This is a zone of continuous permafrost with multiple lakes (Figure 1). Sparse and open forests are formed mostly by larch (Larix sibirica), with a mixture of spruce (Picea obovata) and birch (Betula pendula). The trees are growing mainly within lowlands and river valleys. Bushes are presented mostly by willow species (Salix spp.), alder (Dushekia fruticosa), and shrub birch (Betula sp.). Ground cover is formed by moss, lichens, and grass communities. The climate is sharply continental with below zero (from −9 to −10 °C) annual air temperature (recorded minimum was −57 °C).
2.2. Field Studies
Field surveys (2021 and 2022) covered sites with tree decline and mortality, as well as reference sites (Figure 2). The surveys were conducted within two different areas: (1) larch-dominant forest in the area of strong SO2 influence (or “impact zone”) and (2) mixed larch, spruce, and birch forest in the zone of lower SO2 influence (or “LSB zone”) (Figure 2). Spruce is known as a less cold-resistant species compared to larch. Therefore, the spruce population is located in the wind-sheltered foothill zone in which relief features mitigate SO2 and the influence of winter winds. Winter winds cause snow abrasion and twig and needle desiccation. Within the other parts of the area, spruce is found in sheltered microsites across a heterogeneous landscape. The LSB site is perfectly suited for comparative studies of the response of larch, spruce, and birch to pollution and climatic influences. A description of the test plots (TPs) is given in Table 1.
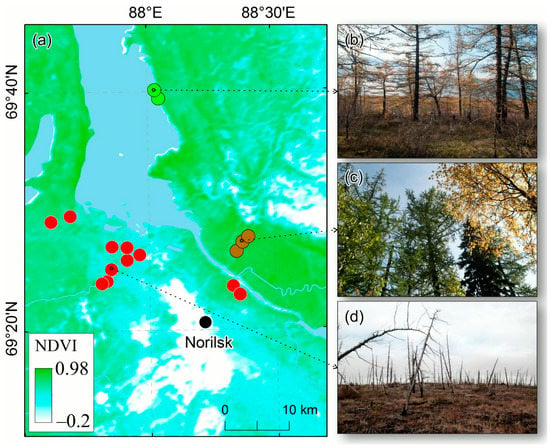
Figure 2.
Study area and test plot (TP) location (a). TPs in the “impact zone” (area of severe damage and mortality) are indicated by red dots. Brown dots indicate TPs in the mixed larch, spruce, and birch stands, or “LSB zone”. Reference plots are shown in green. (b) Larch trees in refence plot, (c) mixed larch-spruce-birch forest in the LSB zone, (d) dead larches in impact zone.

Table 1.
Description of test plots.
In the impact zone, we established 11 TPs in sparse larch stands (red dots in Figure 2). Tree populations within that zone are represented mostly by dead and alive larch trees, with a small proportion of willow, alder, and birch species. In the reference zone, we established 3 TPs in the sparse larch stands (green dots in Figure 2). The reference TPs were located within c. 30–40 km north of the impact zone. The air temperatures within the reference and impact sites were similar (Figure 3 and Figure 4), i.e., the temperature gradient between those sites was negligible. No reference zones for spruce and birch were found because non-polluted spruce and birch stands only grow far away from the study area. Samples of willow and alder species were obtained within the impact zone. Three plots were established in the LSB zone (brown dots in Figure 2).
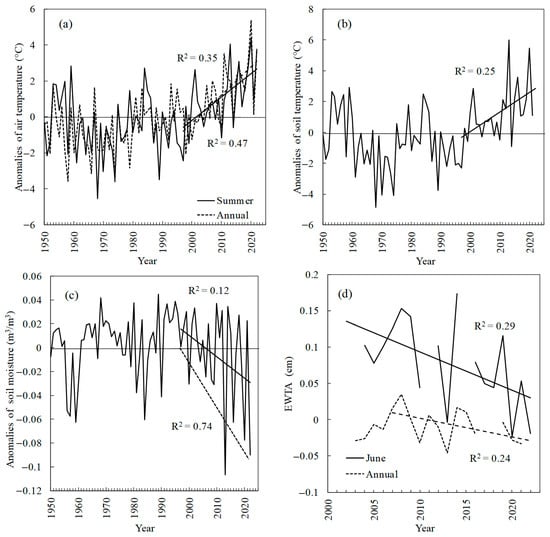
Figure 3.
(a) Summer (June–August) and annual (January–December) air temperature anomalies. (b) Summer soil temperature. (c) Summer soil moisture. The dashed line indicates the trend of local minimum values. (d) Terrestrial water storage (EWTA, June and annual data). Trends are significant at p < 0.05 (a,b) and p < 0.1 (c,d).
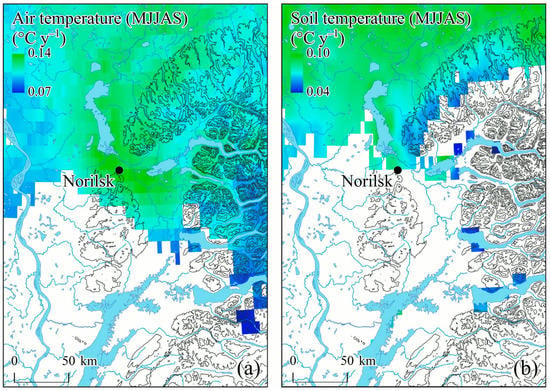
Figure 4.
Maps of air (a) and soil (b) temperature trends (May–September; 2001–2021) (p > 0.1). Water bodies are indicated by light blue. Black lines show the terrain’s elevation isolines.
For dendrochronological analysis, we obtained cores from randomly selected trees within c. 0.5 ha of the central point of the TP. Cores were taken at DBH height (1.3 m above ground-line). We extracted cores from alive and dead trees with an increment borer (approximately 15–25 trees within each TP). We determined trees’ diameters and heights, stand density, regeneration number, ground cover, and soil type. In total, 505 wooden core samples were collected. The “impact group” consisted of 180 and 52 samples of survived and dead larch trees, respectively, 19 samples of alder, and 59 samples of willow. The “reference group” consisted of 51 samples of larch trees. The “LSB group” consisted of 57 samples of larch, 45 samples of spruce, and 42 samples of birch (Table 1).
2.3. Dendrochronological Analysis
Tree samples were glued onto a wooden backing. Cores were finely sanded and treated with contrast powder to enhance the visualization of the tree ring boundaries. The measurements were carried out on an LINTAB-6 platform with an accuracy of 0.01 mm. The cross-dating quality was performed by TSAP [20] and COFECHA software (https://www.ldeo.columbia.edu/tree-ring-laboratory/resources/software, accessed on 6 February 2023) [21]. For each TP, we constructed growth index chronologies based on the measured tree ring series. An ARSTAN program was used for tree ring chronology construction. We used the detrending method with a negative exponential curve or line with a negative slope (https://www.ldeo.columbia.edu/tree-ring-laboratory/resources/software, accessed on 6 February 2023) [22]. We determined the dates of larch trees’ mortality using the master-chronology method. As a master-chronology, we used the tree-ring chronology of survived trees in the impact zone. The date of tree mortality was defined as the date of the last tree ring.
2.4. Eco-Climate Variables
We analyzed GI dependence on the air and soil temperature, soil moisture, precipitation, terrestrial water storage (or EWTA), and the volume of SO2 emissions. Air and soil temperature, precipitation, and soil moisture were obtained from the ERA5-Land database (1951–2022; https://cds.climate.copernicus.eu/cdsapp#!/dataset/reanalysis-era5-land-monthly-means?tab=overview, accessed on 6 February 2023; spatial resolution of 0.1° × 0.1° or 9 km; accessed on 15 October 2022). Soil temperature and moisture values refer to the topsoil layer (0–7 cm). Soil moisture is measured as a volumetric fraction of water (m3 m−3) (https://confluence.ecmwf.int/display/CKB/ERA5-Land%3A+data+documentation; accessed on 6 February 2023). Terrestrial water storage is the product of satellite gravimetric measurements, with an on-ground resolution of 1° × 1°. EWTA is characteristic of the moisture regime and represents total terrestrial water storage in cm units [23]. EWTA values were obtained from the NASA-JPL database (https://podaac-opendap.jpl.nasa.gov/opendap/hyrax/allData/tellus/L3, accessed on 6 February 2023). The volumes of SO2 emissions were obtained from published data [5,6,24]. The data of sulfur dioxide transfer were obtained from the ESA Copernicus Sentinel-5P Mapping Portal [25]. We also generated the wind rose for the study area based on the daily wind direction dataset obtained from the nearest weather stations (69.33° N/87.95° E and 69.33° N/88.25° E). In the analysis of GI dependence on sulfur dioxide emissions and climate variables, we used data from 1993 because it coincided with reliable SO2 data and with the beginning of the current warming.
We used gross (GPP) and net (NPP) primary productivity and normalized vegetation index (NDVI) to estimate the trends of vegetation cover productivity. GPP values (C kg/ha), calculated based on summer 8-day GPP composites, were obtained from the Terra/MODIS product MOD17A2H version 6.0 (https://lpdaac.usgs.gov/products/mod17a2hv006; spatial resolution 500 m; accessed on 15 October 2022) [26]. NPP annual values (C kg/ha) were extracted from the Terra/MODIS product MOD17A3HGF version 6.0 (https://lpdaac.usgs.gov/products/mod17a3hgfv006; spatial resolution 500 m; accessed on 15 October 2022) [27]. NDVI (16-day composites) was obtained from the Terra/MODIS product MOD13Q1 (https://lpdaac.usgs.gov/products/mod13q1v006; spatial resolution 250 m; accessed on 15 October 2022). We created mosaics of GPP, NPP, and NDVI composites. We then calculated raster datasets of median values for each year. Datasets were used to generate maps of the GPP, NPP, and NDVI mean values and trends for the 2001–2022 time interval.
2.5. Statistical Analysis
Four sets of statistics were applied in the analysis of GI dependence on environmental variables. We applied Pearson and Spearman statistics and multiple linear regression analysis to reveal and estimate the relationships between the trees’ GI and eco-climate variables. The best subset of equations was determined based on the corrected Akaike information criterion (AICc). AICc is a second-order or small sample AIC [28]. We applied hierarchical multiple regression analysis to estimate the contribution of each predictor to the GI variation [29].
We used StatSoft Statistica software (http://statsoft.ru, accessed on 6 February 2023), R-Studio (version 2022.07.2; https://www.r-studio.com, accessed on 6 February 2023), and R (version 4.1.3; https://www.r-project.org, accessed on 6 February 2023). We applied a non-parametric Theil–Sen estimator to generate maps of the NDVI, GPP, NPP, and climate variable trends. Theil–Sen is a method for fitting a line to sample points by choosing the median of the slopes of all lines through pairs of points [30,31]. This estimator is less sensitive to outliers, and it is more accurate than linear regression [32]. Trends were calculated using the Python pymannkendall 1.4.2 (https://pypi.org/project/pymannkendall, accessed on 6 February 2023) library imported to ESRI ArcGIS. As a result, we created raster datasets of trends’ slopes and p-levels.
3. Results
3.1. Eco-Climate Variables
Air temperatures (summer and annual) and summer soil temperatures have been increasing since the 1990s (r2 = 0.35, r2 = 0.47, and r2 = 0.25, respectively) (Figure 3a,b). In contrast, summer soil moisture as well as terrestrial moisture (or EWTA) have been decreasing since ca. 2000s (Figure 3c,d). What is notable is a strong decrease of the minimal soil moisture values (r2 = 0.74), which indicates an increased frequency of anomalously dry years (Figure 3c). A spatial distribution of the air and soil temperature trends is presented in Figure 4. Significant trends are observed mostly within northern territories. Precipitation trends were insignificant.
3.2. Air Pollution Volume and Transfer
Sulfur dioxide emissions reached their maximum (c. 2.5 M t) at the beginning of the 1980s, when the major metallurgy plant (Nadezhda) was constructed. Emission’s local minimum was observed at the beginning of the 1990s, with a consequent increase until the beginning of the 2000s. The pollution decrease that followed was caused by improvements in technology and the closing of the nickel plant in 2016. The SO2 emission level in 2021 y was c. 1.5 M t. Nitrogen oxide emission volume was approximately three orders lower than SO2, and it shows similar temporal dynamics. Dust emissions have also decreased since the 1990s [5,33]. Dust, together with aerosols, is the cause of soil pollution by heavy meals. The maximum concentration of Co, Ni, and Cu, as well as sulfur, was observed mostly within the smelters’ vicinity (c. 20–30 km) [34]. Meanwhile, the SO2 plume spread over several hundred km (Figure 5).
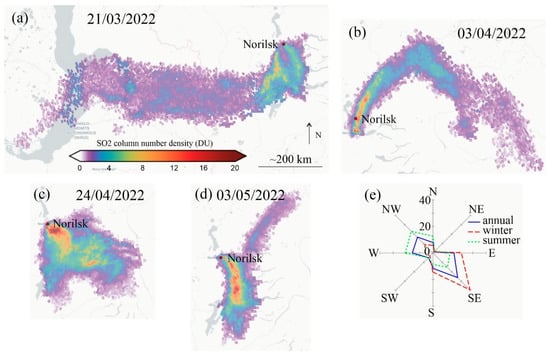
Figure 5.
(a–d) Examples of sulfur dioxide transfer (based on Copernicus Sentinel-5P data [25]). SO2 pollution spreads to a distance of several hundred km. The scale of SO2 concentrations at the 7 km altitude is presented in (a). (e) The wind rose. Northwestern wind prevailed in summer, whereas southeastern ones prevailed in winter.
3.3. Tree Growth and Mortality Dynamics
The first official data regarding pollution-driven forest dieback referred to 1970 [35]. At that time, the total area of dead forests was estimated as c. 5000 ha (red curve on Figure 6d and Figure A1). Since then, a team of foresters from the State Forest Service have been surveying decline and mortality based on the on-ground and airborne data. Thus, in 1986 (the date of the last survey), the areas of total mortality and weakened forests were approximately 300,000 and 550,000 ha, respectively (Figure A1). Later, forest status was usually estimated based on satellite data, with occasional on-ground studies. According to the latest satellite-derived estimate, the total area of dead and weakened vegetation communities was c. 24,000 km2 [7].
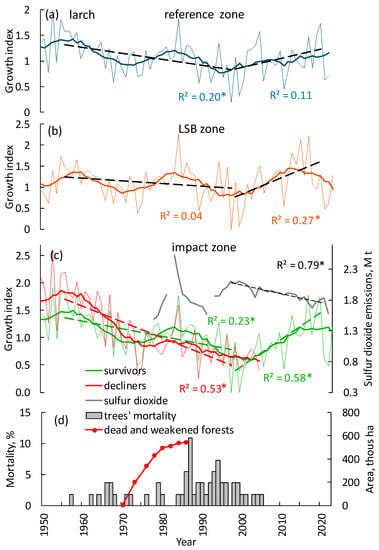
Figure 6.
GI dynamics of larch trees in the (a) reference and (b) LSB zone. (c) Comparative GI dynamics of “survivors” and “decliners” larch trees and sulfur dioxide emission in the impact zone. Solid lines indicate an 11-year moving average. (d) Tree mortality dates (gray columns; dendrochronology-derived values) and the total area of dead and weakened forests (red curve; based on [35] data; see also Figure A1). Mortality is the percent of trees that died in the given year. Stars (*) indicate significant trends at p < 0.05.
The comparative GI dynamics of larch trees in the reference, LSB (larch-spruce-birch mixed forest), and impact zones are presented in Figure 6a–c. In the impact zone, tree population was divided into “decliners” (i.e., trees that eventually died) and “survivors” cohorts. The growth index of larch in the impact zone (especially “decliners”) has had a significant negative trend since the 1950s until the beginning of the 2000s, whereas in the LSB zone, the trend is significantly lower (Figure 6c). In the reference zone, variations in the GI correlated with air temperature, whereas in the impact and LSB zones variations were meditated by both warming and SO2 emissions (see equations in Table 2). In the impact zone, decliners’ mortality was observed until c. 2005 (Figure 6d), whereas survived trees have increased growth since the end of the 1990s (Figure 6c). A similar positive trend was also observed in the reference zone (Figure 6a). Synchronous variations of the GI in all zones can be attributed to the variations in the temperature, which is, along with sulfur dioxide, a primary factor of tree growth.

Table 2.
Dependence of tree and bush species on the eco-climate variables. Abbreviations: LSB—mixed larch-spruce-birch zone; SD—sulfur dioxide emission; TMay, TJul, TJunJul, and TSep—air temperature in May, July, June–July, and September, respectively; STJul—July soil temperature; SMJul—July soil moisture; POctMay—October–May precipitation. Study period is 1993–2021. *—significant at p < 0.001; **—significant at p < 0.05.
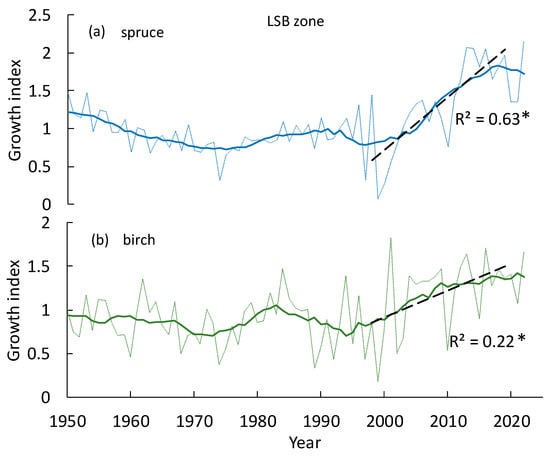
Figure 7.
The LSB zone (brown dots in Figure 2). Comparative growth index dynamics of spruce and birch trees. Solid lines indicate an 11-year moving average. Stars (*) indicate significant trends at p < 0.05.
As for bushes (willow and alder), the GI dynamics of willow are similar to trees in the LSB zone, i.e., without significant depression in the 1990s, whereas the GI of alder is similar to larch tree growth in the impact zone. Both species increased growth since the 2000s (Figure 8a,b).
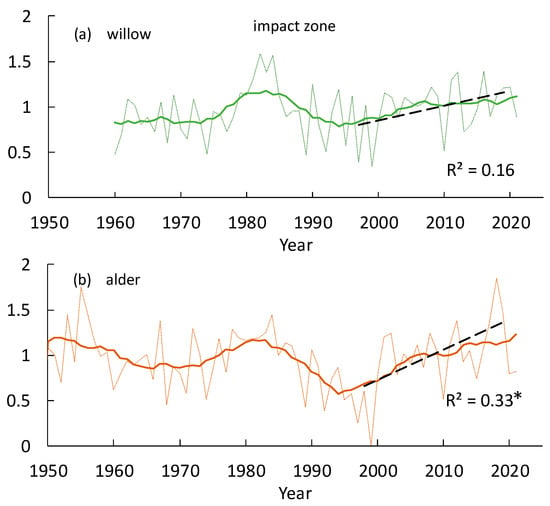
Figure 8.
Comparative growth index dynamics of bushes (willow (a) and alder (b)) in the impact zone. Solid lines indicate an 11-year moving average. Stars (*) indicate significant trends at p < 0.05.
3.4. Trees Growth Dependence on the Eco-Climate Variables
3.4.1. Partial Correlations
Within both impact and reference zones, larch growth was positively correlated with air and soil temperatures, whereas soil moisture negatively influenced larch growth (Figure 9). SO2 emissions strongly (r2 = 0.44) suppress larch growth in the impact zone. A similar correlation for the reference zone is insignificant, although some minor SO2 influence probably occurred because emissions occasionally covered the reference zone (Figure 5b). In this analysis, the study period was 1993–2021. This period coincided with (i) a time interval of reliable data regarding SO2 emission values and (ii) with the beginning of the positive trend in thermal variables and negative trend in moisture (Figure 3).
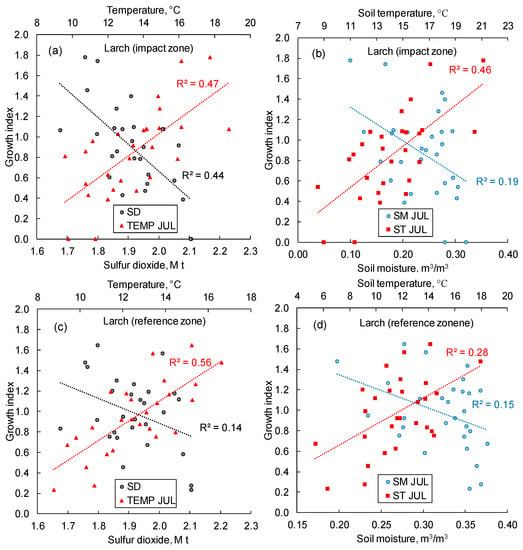
Figure 9.
In the impact zone (a,b), larch growth increases with air and soil temperatures increase, and decreases with soil moisture and SO2 emission increase. In the reference zone (c,d), similar correlations were observed, except for the GI–SO2 correlation, which is insignificant. TEMP and ST—air and soil temperatures, SM—soil moisture, SD—sulfur dioxide emission, JUL—July. All trends are significant at p < 0.05, except for the GI–SO2 trend (c). The study period is 1993–2021.
In the LSB and impact zones, larch similarly responded to the air and soil temperatures, whereas larch response to SO2 was significantly lower in the LSB zone (r2 = 0.23; Figure 10a,b). Meanwhile, spruce shows a strong (r2 = 0.54) dependence on SO2 emissions (Figure 10c), whereas the response of birch was significantly lower (r2 = 0.29; Figure 10c). The growth of all species strongly (r2 = 0.38–0.60) responded to the elevated air and soil temperatures (Figure 10).
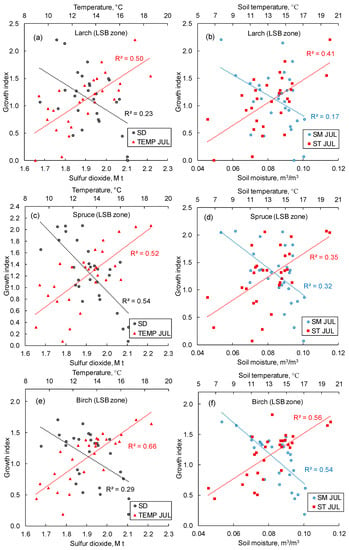
Figure 10.
In the LSB zone, growth indexes of larch (a,b), spruce (c,d), and birch (e,f) increase with air and soil temperatures increase, and growth indexes decrease with sulfur dioxide emissions and soil moisture increases. TEMP and ST—air and soil temperatures, SM—soil moisture, SD—sulfur dioxide emission, JUL—July. The study period is 1993–2021. All trends are significant at p < 0.05.
The growth index of willow shows a high response to the elevated temperatures (both soil and air) and a minor (non-significant) response to SO2 (Figure 11a,b). There is a strong response of willow’s GI to the air temperature at the end (September) of the growth period (Figure 11a). Alder, similar to the conifer species, responded positively to the thermal variables and negatively to the SO2 and soil moisture (Figure 11c,d).
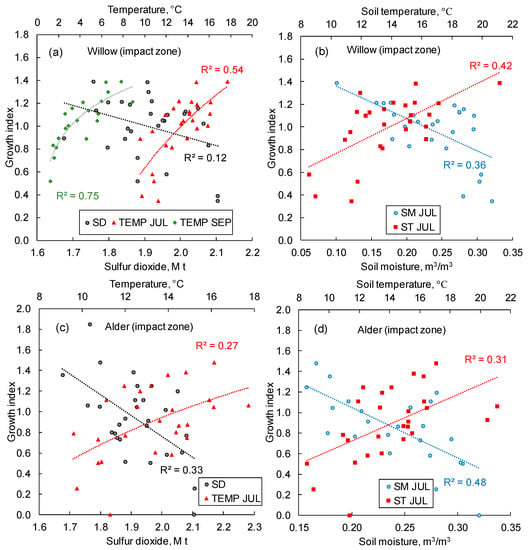
Figure 11.
Willow (a,b) and alder (c,d) growth index correlation with sulfur dioxide emissions, air temperature, soil moisture, and soil temperatures. TEMP and ST—air and soil temperatures, SM—soil moisture, SD—sulfur dioxide emission, JUL—July, SEP—September. The study period is 1993–2021. All trends are significant at p < 0.05 (except for correlations between the GI of willow and SD).
Alongside considered variables, it was found that “cold period” (October–May) precipitation stimulated trees’ and bushes’ growth (R2 = 0.07 … 0.27; Table 2).
3.4.2. Multiple Correlations
The tree and bush growth index is dependent on the eco-climate variables described by the equations in Table 2. The table includes tree equations with minimal AICc coefficients for each species. Sulfur dioxide emissions are the primary predictor for larch GI in the impact zone and for spruce GI in the LSB zone. The other variables (air and soil temperatures, soil moisture, and “cold period” precipitation), significantly influenced the growth of all trees and bushes.
3.5. Temporal Trends of NDVI, GPP and NPP Indexes
Unexpectedly, since the 2000s, positive trends of NDVI, GPP, and NPP are observed within the area of former larch communities’ mortality (dotted lines in Figure 12a–c). The onset of increasing trends referred to the years 2003–2005. Before the SO2-driven vegetation mortality, sparse and open larch stands, and mostly moss-lichen communities, formed vegetation cover in that area.
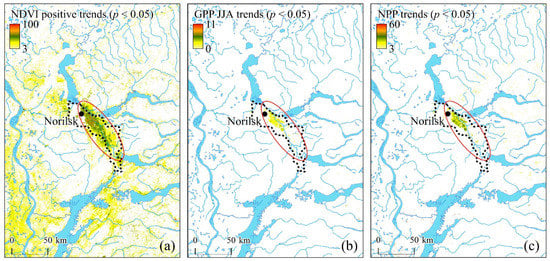
Figure 12.
NDVI (10−4/year), GPP (kg/ha/year), and NPP (kg/ha/year) significant (p < 0.05) trends (2001–2021). The zone of significant productivity trends is shown by the oval. The dotted line approximated the area of the larch communities’ decline and mortality (adopted from [34]).
4. Discussion
Within the spread of Norilsk’s plumes, subarctic tree growth was determined mostly by the combined influence of sulfur dioxide emissions and thermal regime. Chronic (since the 1940s) SO2 pollution led to the largest forest community decline and mortality worldwide. Since the first documented larch stands’ mortality (c. five thousand ha in 1970 [35]), the approximate area of weakened and damaged vegetation cover spread to c. 24,000 square km [7], although that area might be overestimated.
The spatial pattern of emission transfer and, consequently, vegetation damage is determined by prevailing winds and terrain orography. Thus, northwestern winds prevailed in the summer, whereas southeastern ones prevailed in the winter (Figure 5c). Vegetation mortality spread mostly in the southeast direction along the valley bounded by hills, at a distance of up to c. 100 km, whereas the northwest direction of mortality spread to c. 20 km only [7,24]. However, mixed larch, spruce, birch (LSB) forests survived in the vicinity (c. 5 km northeast) of the smelters due to relief-sheltering (Figure 2c and Figure 7). Contrary to earlier studies [17], we found that larch is more SO2-resistant compared to spruce. Thus, GI dependence on SO2 for spruce was much higher than for larch (Figure 9; r2 = 0.54 vs. r2 = 0.2, respectively). Meanwhile, spruce survive due to the mitigation of pollution influence by the inflection of wind direction. Winter winds themselves caused serious damage to spruce by desiccation and snow abrasion. Actually, the spruce forest in question is the most northward refugium of spruce species. That refugium is a seed-source for spruce northward warming-driving migration. In a broader aspect, the heterogeneity of the terrain orography provided sheltered sites for vegetation within the area of SO2 influence. Even in the impact zone, trees can survive on leeward slopes, along river valleys, or within the depression around the numerous lakes. It is noteworthy that even within the impact zone larch regeneration can be found within local depressions, although Kirdyanov et al. [9] reported zero larch seedlings within the larch mortality zone. Certainly, regeneration location, abundance, vitality, and species composition dynamics need further studies. Vegetation sheltering by relief features was also reported for Karabash (Russia) and Sudbury (Canada) polluted territories [12,36]. What is noteworthy is the high SO2 resistance of birch and especially willow (Figure 11b,c; Table 2). This indicates a potential use of both species for the reclamation of polluted areas.
In the impact zone, the larch growth decrease lasts until the mid-1990s (Figure 6). In the mixed LSB zone, similar decreases were insignificant for all tree species (Figure 7). In the current period of warming, the growth indices of all woody species are increasing (Figure 6, Figure 7 and Figure 8). That increase coincided with current warming (Figure 2a) and a minor (approximately 13%) decrease in SO2 volume (Figure 6c). Actually, the combined effect of those two factors led to tree growth increase (Figure 9, Figure 10 and Figure 11; equations in Table 2). A strong positive response of all species to elevated air and soil temperatures refute the hypothesis of warming-increase trees’ vulnerability to the pollutants [19]. In Sudbury, Canada, and South Urals, Russia, more vigorous growth of certain surviving species has also occurred since pollution decreased [12,37]. Meanwhile, no analysis of climate warming was carried out in those works. In addition, the willow’s strong growth response to September temperatures is remarkable, i.e., when leaves’ photosynthesis is partly or completely inhibited (Figure 10a; Table 2, Equation (2)). That phenomenon might be attributed in part to non-leaf (“bark”) photosynthesis. For instance, in the case of Populus tremuloides, bark photosynthesis is responsible for c. 10–15% of the trees’ carbohydrate pool [38]. Therefore, according to our observations, certain willow species may vegetate, even in the leafless form in a harsh habitat (e.g., in mountain tundra). Potentially non-leaf photosynthesis may be also partly responsible for the willow’s high SO2-resistance.
Notable “cold period precipitation” (i.e., snow-accumulated water) has a positive influence on the trees’ growth (Table 2). At the beginning of the growth period, melted water mitigated seasonal water stress while permafrost-derived water was still not available. That was also observed in subarctic Larix gmelinii habitat [39]. As a drought-resistant species, larch is less dependent on soil moisture and is usually located within dryer sites, whereas spruce grows mostly on wet sites. Excessive soil moisture in summer inhibited the growth of all species (Figure 9, Figure 10 and Figure 11). Meanwhile, decreasing temporal trends of terrestrial water storage (Figure 3d) indicate a potential improvement of moisture regime at high latitudes [11], whereas at lower latitudes vegetation is suffering from decreasing soil moisture content [40].
Together with SO2 pollution, the smelters also emitted heavy metals (Cu, Ni, Cr, Co), which poisoned vegetation [41,42,43,44]. In the soils of the Norilsk area, the highest concentrations of the pollutants were observed within the smelters’ vicinity (c. 20–25 km). However, knowledge regarding the influence of heavy metals on vegetation in that area is still controversial and insufficient [17,34,43].
Alongside trees, moss and lichen communities are also severely affected by the smelters’ emissions. Similar processes were described for the Southern Urals polluted areas [14,16,37] and Sudbury, where, since the decrease in pollution, grasses and horsetails expanded their range [44].
Unexpectedly, we found increasing trends of vegetation GPP, NPP, and NDVI indexes within a large part of formerly died larch-dominant communities (Figure 12). These increases are partly explained by the warming-driven growth of woody species (Figure 9, Figure 10 and Figure 11; Table 2). Meanwhile, because subarctic larch forests are mostly sparse and open, tree growth itself was not the main cause of GPP and NPP increase, and mostly referred to the expansion of bushes and grass species into the “technogenic desert”. According to Pimenov et al. [45], SO2-killed former moss and lichen communities are being substituted by grass and bush phytocenosis. We also observed birch expansion into the pollution-damaged zone. Similar processes, i.e., certain broadleaf species expansion into the former heavily polluted territories, are reported for Monchegorsk (Peninsula Russia) [13] and Sudbury [44].
Together with warming-driving productivity increase, soil fertilization caused by NOx and SO2 emissions may have stimulated vegetation growth. Since the 1970s, the volume of NOx emissions varied within c. 9000–25,000 t per year. Nitrogen is known as the main factor that limited tree growth in the subarctic, whereas industrial nitrogen emissions often caused soil fertilization (e.g., [46,47]). Finally, it is worth noting that increasing trends of vegetation productivity in the Norilsk area coincided with prevailed positive GPP and NPP trends in the Siberian Arctic and increased carbon uptake by the forests of Siberia [39,48].
5. Conclusions
Subarctic forests’ pollution-driven decline and mortality were a large phenomenon, both within and beyond the Polar Circle. Larch-dominant communities have experienced a chronic influence of sulfur dioxide since the 1940s, which led to tree growth decrease that lasted until the end of the 1990s. SO2, air, and soil temperatures are mediators of trees growth.
Since the beginning of the 2000s, tree (larch, spruce, and birch) and bush (willow and alder) growth has been increasing due to air and soil warming in combination with a minor decrease in pollution. Alongside this, increasing trends of vegetation (NDVI) and productivity (GPP and NPP) indices were observed within a large part of previously dead and heavily damaged forests. That phenomenon is attributed to combined warming-driven increased carbon uptake by trees, together with the expansion and increased growth of resistant species (birch, bushes, and grasses).
Author Contributions
Conceptualization, V.I.K.; Methodology, V.I.K. and I.A.P.; validation, V.I.K., S.T.I. and I.A.P.; formal analysis, S.T.I., I.A.P. and M.L.D.; investigation, V.I.K., S.T.I. and I.A.P.; resources, S.T.I. and A.S.G.; data curation, S.T.I. and I.A.P.; writing—original draft preparation, V.I.K.; visualization, S.T.I., M.L.D., A.S.G. and A.S.S.; supervision, V.I.K.; project administration, V.I.K.; funding acquisition, V.I.K., A.P.S. and V.L.T. All authors have read and agreed to the published version of the manuscript.
Funding
This research was funded by the Tomsk State University Development Program «Priority-2030» and the Norilsk-Taimyr Energy Company (contract NTEK-32-523-1/21 dated 7 April 2021).
Institutional Review Board Statement
Not applicable.
Informed Consent Statement
Informed consent was obtained from all subjects involved in the study.
Data Availability Statement
The data presented in this study are openly available: climate data in https://cds.climate.copernicus.eu (accessed on 15 October 2022); EWTA in https://podaac-opendap.jpl.nasa.gov/opendap/hyrax/allData/tellus/L3 (accessed on 15 October 2022), reference number [16]; GPP in https://lpdaac.usgs.gov/products/mod17a2hv006 (accessed on 15 October 2022), reference number [17]; NPP in https://lpdaac.usgs.gov/products/mod17a3hgfv006/ (accessed on 15 October 2022) reference number [18]; NDVI in https://lpdaac.usgs.gov/products/mod09q1v006/ accessed on 15 October 2022 and https://lpdaac.usgs.gov/products/mod09a1v006 (accessed on 15 October 2022); Kharuk, V.; Petrov, I.; Im, S.; Golyukov, A.; Dvinskaya, M.; Shushpanov, A.; Savchenko, A,; Temerova V. Shared Data Used in the Manuscript Subarctic Vegetation under the Mixed Warming and Air Pollution Influence. OSF. Available online: http://osf.io/hv7dn (accessed 13 February 2023). https://doi.org/10.17605/OSF.IO/HV7DN [49].
Conflicts of Interest
The authors declare no conflict of interest.
Appendix A
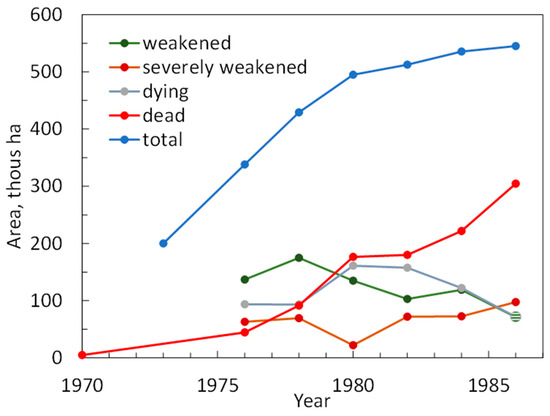
Figure A1.
Dynamics of the larch forest decline and mortality. Data covered the period of the State Forest Service on-ground and airborne surveys [35]. In 1970, the area of dead forests was c. 5000 ha. The proportion of dying and dead trees in weakened, severely weakened, and dead stands were 11–25, 26–50, and 51–80%, respectively.
References
- Mack, M.C.; Walker, X.J.; Johnstone, J.F.; Alexander, H.D.; Melvin, A.M.; Jean, M.; Miller, S.N. Carbon loss from 650 boreal forest wildfires offset by increased dominance of deciduous trees. Science 2021, 372, 280–283. [Google Scholar] [CrossRef]
- Chylek, P.; Folland, C.; Klett, J.D.; Wang, M.; Hengartner, N.; Lesins, G.; Dubey, M.K. Annual Mean Arctic Amplification 1970–2020: Observed and Simulated by CMIP6 Climate Models. Geophys. Res. Lett. 2022, 49, e2022GL099371. [Google Scholar] [CrossRef]
- Kharuk, V.I.; Petrov, I.A.; Krivobokov, L.V.; Golyukov, A.S.; Dvinskaya, M.L.; Im, S.T.; Shushpanov, A.S.; Smith, K.T. Larch response to warming in northern Siberia. Reg. Environ. Chang. 2023, 23, 17. [Google Scholar] [CrossRef]
- Dolgikh, V.I. Phenomenon of Norilsk: History of the Norilsk Industrial Region; Polar Star: Moscow, Russia, 2006. [Google Scholar]
- Governmental Reports on the State and Protection of the Environment in Krasnoyarsk Region; Polygraph-Avanta Ltd.: Krasnoyarsk, Russia, 2022.
- Kozlov, M.V.; Zvereva, E.L.; Zverev, V.E. Impacts of Point Polluters on Terrestrial Biota: Comparative Analysis of 18 Contaminated Areas; Springer: Dordrecht, The Netherlands, 2009. [Google Scholar] [CrossRef]
- Korets, M.A.; Ryzhkova, V.A.; Danilova, I.V. GIS-Based approaches to the assessment of the state of terrestrial ecosystems in the Norilsk industrial region. Contemp. Probl. Ecol. 2014, 7, 643–653. [Google Scholar] [CrossRef]
- Kirdyanov, A.V.; Prokushkin, A.S.; Tabakova, M.A. Tree-ring growth of Gmelin larch under contrasting local conditions in the north of Central Siberia. Dendrochronologia 2013, 31, 114–119. [Google Scholar] [CrossRef]
- Kirdyanov, A.V.; Krusic, P.J.; Shishov, V.V.; Vaganov, E.A.; Fertikov, A.I.; Myglan, V.S.; Barinov, V.V.; Browse, J.; Esper, J.; Ilyin, V.A.; et al. Ecological and conceptual consequences of Arctic pollution. Ecol. Lett. 2020, 23, 1827–1837. [Google Scholar] [CrossRef] [PubMed]
- Kharouk, V.I.; Winterberger, K.; Tsibul’skii, G.M.; Yakhimovich, A.P.; Moroz, S.N. Technogenic disturbance of pretundra forests in Noril’sk Valley. Russ. J. Ecol. 1996, 27, 406–410. [Google Scholar]
- Kharuk, V.I.; Petrov, I.A.; Im, S.T.; Golyukov, A.S.; Dvinskaya, M.L.; Shushpanov, A.S. Pollution and Climatic Influence on Trees in the Siberian Arctic Wetlands. Water 2023, 15, 215. [Google Scholar] [CrossRef]
- Freedman, B.; Hutchinson, T. Long-term effects of smelter pollution at Sudbury, Ontario, on forest community composition. Can. J. Bot. 2011, 58, 2123–2140. [Google Scholar] [CrossRef]
- Chernen’kova, T.V.; Kabirov, R.R.; Basova, E.V. Progressive successions in northern taiga forests upon reduction of aerotechnogenic load. Lesovedenie 2011, 6, 49–66. [Google Scholar]
- Vorobeichik, E.L.; Trubina, M.R.; Khantemirova, E.V.; Bergman, I.E. Long-term dynamic of forest vegetation after reduction of copper smelter emissions. Russ. J. Ecol. 2014, 45, 498–507. [Google Scholar] [CrossRef]
- Vorobeichik, E.L. Natural Recovery of Terrestrial Ecosystems after the Cessation of Industrial Pollution: 1. A State-of-the-Art Review. Russ. J. Ecol. 2022, 53, 1–39. [Google Scholar] [CrossRef]
- Trubina, M.R.; D’yachenko, A.P. Current state of the forest moss layer after reduction of emissions from the Middle Ural Copper Smelter. Povolzh. Ekol. Zh. 2020, 4, 477–491. [Google Scholar] [CrossRef]
- Zubareva, O.N.; Skripal’shchikova, L.N.; Greshilova, N.V.; Kharuk, V.I. Zoning of landscapes exposed to technogenic emissions from the Norilsk mining and smelting works. Russ. J. Ecol. 2003, 34, 375–380. [Google Scholar] [CrossRef]
- De Marco, A.; Sicard, P.; Feng, Z.; Agathokleous, E.; Alonso, R.; Araminiene, V.; Augustatis, A.; Badea, O.; Beasley, J.C.; Branquinho, C.; et al. Strategic roadmap to assess forest vulnerability under air pollution and climate change. Glob. Chang. Biol. 2022, 28, 5062–5085. [Google Scholar] [CrossRef]
- Zvereva, E.L.; Roitto, M.; Kozlov, M.V. Growth and reproduction of vascular plants in polluted environments: A synthesis of existing knowledge. Environ. Rev. 2010, 18, 355–367. [Google Scholar] [CrossRef]
- Rinn, F. Tsap V. 3.6 Reference Manual: Computer Program for Tree-Ring Analysis and Presentation; Frank Rinn Distribution: Heidelberg, Germany, 1996. [Google Scholar]
- Holmes, R.L. Computer-assisted quality control in tree-ring dating and measurement. Tree-Ring Bull. 1983, 44, 69–75. [Google Scholar]
- Cook, E.R.; Holmes, R.L. User’s Manual for Program ARSTAN. In Tree-Ring Chronologies of Western North America: California, Eastern Oregon and Northern Great Basin; Chronology Series 6; Holmes, R.L., Adams, R.K., Fritts, H.C., Eds.; Laboratory of Tree-Ring Research: Tucson, TX, USA, 1986; pp. 50–65. [Google Scholar]
- Landerer, F.W.; Flechtner, F.M.; Save, H.; Webb, F.H.; Bandikova, T.; Bertiger, W.I.; Bettadpur, S.V.; Byun, S.H.; Dahle, C.; Dobslaw, H.; et al. Extending the global mass change data record: GRACE Follow-On instrument and science data performance. Geophys. Res. Lett. 2020, 47, e2020GL088306. [Google Scholar] [CrossRef]
- Kharuk, V.I. Air pollution impact on subarctic forests at Norilsk, Siberia. In Forest Dynamics in Heavily Polluted Regions; Innes, J.L., Oleksyn, J., Eds.; CAB International: Wallingford, UK, 1999; pp. 77–86. [Google Scholar]
- ESA Copernicus Sentinel-5P Mapping Portal. Available online: https://maps.s5p-pal.com/SO2/ (accessed on 20 December 2022).
- Running, S.; Mu, Q.; Zhao, M. MOD17A2H MODIS/Terra Gross Primary Productivity 8-Day L4 Global 500 m SIN Grid V006; NASA EOSDIS Land Processes DAAC: Sioux Falls, SD, USA, 2015. [Google Scholar] [CrossRef]
- Running, S.; Zhao, M. MOD17A3HGF MODIS/Terra Net Primary Production Gap-Filled Yearly L4 Global 500 m SIN Grid V006; NASA EOSDIS Land Processes DAAC: Sioux Falls, SD, USA, 2019. [Google Scholar] [CrossRef]
- Hurvich, C.M.; Tsai, C.-L. A corrected Akaike information criterion for vector autoregressive model selection. J. Time Ser. Anal. 1993, 14, 271–279. [Google Scholar] [CrossRef]
- Ryan, S.E.; Porth, L.S. A Tutorial on the Piecewise Regression Approach Applied to Bedload Transport Data; Gen. Tech. Rep. RMRS-GTR-189; U.S. Department of Agriculture, Forest Service, Rocky Mountain Research Station: Fort Collins, CO, USA, 2007; 41p.
- Sen, P.K. Estimates of the regression coefficient based on Kendall’s tau. J. Am. Stat. Assoc. 1968, 63, 1379–1389. [Google Scholar] [CrossRef]
- Conover, W.J. Practical Nonparametric Statistics, 3rd ed.; Wiley: Hoboken, NJ, USA, 1999; 608p. [Google Scholar]
- Fernandes, R.; Leblanc, S.G. Parametric (modified least squares) and non-parametric (Theil–Sen) linear regressions for predicting biophysical parameters in the presence of measurement errors. Remote Sens. Environ. 2005, 95, 303–316. [Google Scholar] [CrossRef]
- Telyatnikov, M.Y. Dynamics of the Phytodiversity of Natural Ecosystems Affected by Oil Products in the Norilsk Industrial District. Contemp. Probl. Ecol. 2022, 15, 160–179. [Google Scholar] [CrossRef]
- Kharuk, V.I. Spectral Indicators of the Vegetation Stress. Ph.D. Thesis, Institute of Biiopfysics Siberian Branch of Russian Academy of Sciences, Krasnoyarsk, Russia, 1993; 350p. [Google Scholar]
- USSR Ministry of Forests. Report of the Forest Service; USSR: Moscow, Russia, 1988; 21p.
- Yarmishko, V.T.; Lyanguzova, I.V.; Lyanguzov, A.Y. Changes in the annual increment of Pinus sylvestris (Pinaceae) trunks upon reduction of aerotechnogenic pollution. Rastit. Resur. 2017, 4, 527–542. [Google Scholar]
- Chernen’kova, T.V.; Kabirov, R.R.; Mekhanikova, E.V.; Stepanov, A.M.; Gusarova, A.Y. Demutation of vegetation after copper smelter shutdown. Lesovedenie 2001, 6, 31–37. [Google Scholar]
- Kharouk, V.I.; Middleton, E.M.; Spencer, S.L.; Rock, B.N.; Willams, D.L. Aspen bark photosynthesis and its significance to remote sensing and carbon budget estimates in the boreal ecosystem. J. Water Air Soil Pollut. 1995, 82, 483–497. [Google Scholar] [CrossRef]
- Kharuk, V.I.; Dvinskaya, M.L.; Im, S.T.; Golyukov, A.S.; Smith, K.T. Wildfires in the Siberian Arctic. Fire 2022, 5, 106. [Google Scholar] [CrossRef]
- Shao, H.; Zhang, Y.; Yu, Z.; Gu, F.; Peng, Z. The Resilience of Vegetation to the 2009/2010 Extreme Drought in Southwest China. Forests 2022, 13, 851. [Google Scholar] [CrossRef]
- Veselkin, D.V.; Chashchina, O.E.; Kuyantseva, N.B.; Mumber, A.G. Stable carbon and nitrogen isotopes in woody plants and herbs near the large copper smelting plant. Geochem. Int. 2019, 57, 575–582. [Google Scholar] [CrossRef]
- Veselkin, D.; Kuyantseva, N.; Mumber, A.; Molchanova, D.; Kiseleva, D. δ15N in Birch and Pine Leaves in the Vicinity of a Large Copper Smelter Indicating a Change in the Conditions of Their Soil Nutrition. Forests 2022, 13, 1299. [Google Scholar] [CrossRef]
- Zhulidov, A.V.; Robarts, R.D.; Pavlov, D.F.; Kämäri, J.; Gurtovaya, T.Y.; Meriläinen, J.J.; Pospelov, I.N. Long-term changes of heavy metal and sulphur concentrations in ecosystems of the Taymyr Peninsula (Russian Federation) North of the Norilsk Industrial Complex. Environ. Monit. Assess. 2011, 181, 539–553. [Google Scholar] [CrossRef]
- Winterhalder, K. Natural recovery of vascular plant communities on the industrial barrens of the Sudbury area. In Restoration and Recovery of an Industrial Region; Gunn, J.M., Ed.; Springer: New York, NY, USA, 1995; pp. 93–102. [Google Scholar] [CrossRef]
- Pimenov, A.V.; Efimov, D.Y.; Pervunin, V.A. Topo-ecological differentiation of vegetation in the Norilsk industrial region. Sib. J. Ecol. 2014, 6, 923–931. (In Russian) [Google Scholar]
- Emmett, B.A. The Impact of Nitrogen on Forest Soils and Feedbacks on tree Growth. Water Air Soil Pollut. 1999, 116, 65–74. [Google Scholar] [CrossRef]
- Bontemps, J.-D.; Hervé, J.-C.; Leban, J.-M.; Dhôte, J.F. Nitrogen footprint in a long-term observation of forest growth over the twentieth century. Trees 2010, 25, 237–251. [Google Scholar] [CrossRef]
- Watts, J.D.; Farina, M.; Kimball, J.S.; Schiferl, L.D.; Liu, Z.; Arndt, K.A.; Zona, D.; Ballantyne, A.; Euskirchen, E.S.; Parmentier, F.W.; et al. Carbon uptake in Eurasian boreal forests dominates the high-latitude net ecosystem carbon budget. Glob. Chang. Biol. 2023, 29, 1870–1889. [Google Scholar] [CrossRef] [PubMed]
- Kharuk, V.; Petrov, I.; Im, S.; Golyukov, A.; Dvinskaya, M.; Shushpanov, A.; Savchenko, A.; Temerova, V. Shared Data Used in the Manuscript Subarctic Vegetation under the Mixed Warming and Air Pollution Influence. OSF. Available online: http://osf.io/hv7dn (accessed on 13 February 2023). [CrossRef]
Disclaimer/Publisher’s Note: The statements, opinions and data contained in all publications are solely those of the individual author(s) and contributor(s) and not of MDPI and/or the editor(s). MDPI and/or the editor(s) disclaim responsibility for any injury to people or property resulting from any ideas, methods, instructions or products referred to in the content. |
© 2023 by the authors. Licensee MDPI, Basel, Switzerland. This article is an open access article distributed under the terms and conditions of the Creative Commons Attribution (CC BY) license (https://creativecommons.org/licenses/by/4.0/).