Article

Coarse Woody Debris and Carbon Stocks in Pine Forests after 50 Years of Recovery from Harvesting in Northeastern California

1
USDA Forest Service, Pacific Southwest Research Station, 3644 Avtech Parkway, Redding, CA 96002, USA
2
USDA Forest Service, Rocky Mountain Research Station, 1221 S. Main, Moscow, ID 83843, USA
3
College of Forest Resources and Environmental Science, Michigan Technological University, 1400 Townsend Drive, Houghton, MI 49931, USA
4
USDA Forest Service, Pacific Southwest Research Station, Davis, CA 95616, USA
5
Ecosystems Northwest, 189 Shasta Avenue, Mount Shasta, CA 96067, USA
*
Author to whom correspondence should be addressed.
This author is retired.
Forests 2023, 14(3), 623; https://doi.org/10.3390/f14030623
Submission received: 21 February 2023 / Revised: 8 March 2023 / Accepted: 17 March 2023 / Published: 20 March 2023
(This article belongs to the Special Issue Aboveground and Belowground Interaction and Forest Carbon Cycling)

Abstract

:
The long-term effects of harvesting on stand carbon (C) pools were assessed in a dry, interior pine-dominated forest at the Blacks Mountain Experimental Forest in northeastern California. Six 8-hectacre plots, established in 1938–1943, were treated as either an uncut control or a heavy-cut harvest (three-quarters of the stand volume removed). Response variables included C pools in overstory tree and shrub, coarse woody debris (CWD), forest floor, mineral soil (to 30 cm depth), cubicle brown root fragments of wood, fine roots, and ectomycorrhizal root tips. CWD was further classified as intact wood or more highly decayed brown rot or white rot types. CWD nutrient stocks (N, P, K, Ca, and Mg) and soil N content were also measured. In 1992, 50 years after harvest, total ecosystem C was 188 and 204 Mg C ha−1 in the harvest and control treatments or 8% lower (p = 0.02) in the harvest stands. There were changes in the distributions of C pools between the treatments. After 50 years of recovery, most C pools showed statistically non-significant and essentially no change in C pool size from harvests. Notable reductions in C with harvests were declines of 43% in CWD including standing snags (p = 0.09) and a decline of 9% of live tree C (p = 0.35). Increases in C pools after harvest were in a 3-fold build-up of fragmented brown cubicle rot (p = 0.26) and an 11% increase in soil C (p = 0.19). We observed strong evidence of C transfers from CWD to soil C pools with two- to three-fold higher soil C and N concentrations beneath CWD compared to other cover types, and lower CWD pools associated with elevated cubicle brown rot are elevated soil C in the harvests. Our results showed that while harvest effects were subtle after 50 years of regrowth, CWD may play an important role in storing and transferring ecosystem C to soils during recovery from harvesting in these dry, eastside pine forests of California. This poses a tradeoff for managers to choose between keeping CWD for its contribution to C sequestration and its removal as the hazardous fuels.

1. Introduction

Forests store large amounts of carbon (C) in the different pools [1,2] and particularly so in California forests [3], and forests continue accumulating carbon. Therefore, maintaining and restoring healthy forests remain among the most effective strategies for capturing and storing C as a climate change mitigation [4,5]. Because forests are naturally dynamic systems, the C stocks are at risk of loss with disturbances [6,7,8,9,10,11]. Land managers are considering new ways to manage forests to maintain or maximize C sequestration and prevent loss from disturbances such as harvests, drought, beetle kill, disease, or wildfires [12,13]. Forest being able to capture C even beyond 200 years of age has been shown by eddy covariance techniques [14,15], but the detailed mechanisms of how forests store and release C from various pools is still poorly described. On-site measures and construction of forest C budgets can be expensive, and annual measures generally cannot detect small C gains or losses. Because of the expense, C budgets are often assembled “ad hoc” from available data that were not necessarily designed for a C budget in mind. Long-term studies with datasets on forest C are rare; they are particularly valuable as they can better detect C change on the timescale of stand development and soil C changes. Such datasets can help managers understand forests as C processors and will aid it the design of new management options with C sequestration in mind. Here, we assembled data into a C budget from a field study designed to statistically test forest harvest effects on C responses after 50 years of recovery.
Disturbances such as wildfires and insect outbreaks in the western U.S. are becoming larger and more frequent, partially enhanced as a result of a changing climate [13,16,17,18]. These events can alter C storage via changes in stand dynamics, biodiversity, and ecosystem functions [19,20]. After such disturbances, land managers often use salvage logging operations to fell and remove dead or dying trees to maximize tree value at sawmills, reduce hazards to infrastructure (e.g., roads, campgrounds), and reduce wildfire risk [21,22]. Simultaneously, land managers also thin densely crowded stands as a way to reduce potential for severe fires or reduce tree competition as a way to enhance resilience to future disturbances [23]. These restoration harvests (salvage logging and thinning) by themselves can alter C accumulations via stand dynamics [24] and alter C inputs to detrital pools [17]. Concerns are that logging operations (i.e., removal of wood products) may lead to soil compaction, long-term reductions in forest soil productivity [25,26], and net C losses. Logging can also change stand C cycling by affecting the amount of C left on site in coarse woody debris (CWD) [27], soil organic matter (OM) [10,11,28], and standing snags [28,29,30].
Extensive bark beetle infestations were documented across the western United States during the 1930s. In response to the large increases in tree mortality from bark beetle attack, a study was established by the U.S. Forest between 1938 and 1947 at the Blacks Mountain Experimental Forest Service in northeast California. The study goal was to determine the effect of different harvesting methods after severe insect attack on future stand succession and growth [31,32]. This study produced, by design, a wide range of residual stand structures, soil disturbances, and amounts of CWD on the soil surface [33]. Given the current high incidence of bark beetle occurrence in interior ponderosa pine (Pinus ponderosa Lawson and C. Lawson) forests, we re-visited the research plots from this original study to assess the long-term impacts of salvage logging after bark beetle infestation on above- and below-ground C stocks. The original study had six harvest treatments, of which we used two in our research: (1) harvests with logging consisting of heavy Forest Service cut that removed three-quarters of the tree volume (low stand structural diversity) and (2) uncut control (high stand structural diversity). The specific objectives of this study were to (1) determine the long-term effects of removing a large portion of the overstory volume on ecosystem C stocks, (2) examine the distribution of C pools within each treatment, and (3) assess treatment effects on C storage from individual pools, especially the role of the CWD.

2. Materials and Methods

2.1. Study Site

The study plots were at the Blacks Mountain Experimental Forest (BMEF; Figure 1), located approximately 35 km northeast of Mount Lassen in northeastern California, USA (Lat. 40.7293, Long. 121.1494). The experimental forest occupies 3715 ha on the Lassen National Forest with an elevational range between 1700 m and 2100 m. The tree overstory was composed of at least two age cohorts: an overstory of widely scattered 300~500-year-old ponderosa pine (Pinus ponderosa Douglas ex C. Lawson), Jeffrey pine (Pinus jeffreyi Balf.), and incense-cedars (Calocedrus decurrens (Torr.) Florin) and a dense 50~100-year-old second cohort of pines, incense-cedar, and white fir (Abies concolor (Gord. and Glend.) Lindl. Ex Hildebr.) which originated after intensive livestock grazing ceased in 1910s and with the onset of wildfire suppression (Figure 2). Forest understory is composed of 5–10% cover of perennial grasses and forbs (coverage) and 10–15% shrub cover predominated by prostrate ceanothus (Ceanothus prostrates) and bitterbrush (Purshia tridentate) with the remainder in open or non-vegetated condition.
Soils are in the taxonomic subgroup Typic Argixerolls and are 1~3 m deep over fractured basaltic bedrock with mesic soil temperature regimes. Soil properties in the surface 15 cm of mineral soil are 4.6% OM, 0.1% total N, pH 6.9, and <10% clay content [34]. The climate is characterized by warm, dry summers and cold, wet winters. Annual precipitation was 440 mm from 1930 to 2017 (Figure 3), as estimated from the PRISM climate model at Oregon State University (https://prism.oregonstate.edu/; accessed on 10 October 2022) and then calibrated by three surrounding RAWS stations (Bogard: https://raws.dri.edu/cgi-bin/rawMAIN.pl?caCBOG, Grasshopper: https://raws.dri.edu/cgi-bin/rawMAIN.pl?caCGHP, and Ladder Butte: https://raws.dri.edu/cgi-bin/rawMAIN.pl?caCLDR; accessed on 10 October 2022). Similarly, mean daily air temperature is 6.4 °C with an average maximum of 13.7 °C and minimum of −0.9 °C, respectively. January is usually the coldest month with minimum average of −8.7 °C, and during the average maximum hottest month (July), temperature is about 26.8 °C (Figure 3).

2.2. Experimental Design

In 1992, we utilized the original experimental treatment units established beginning in 1938. This original design was a randomized 10 blocks, with one block installed each successive year beginning in 1938 [31,32,33]. Four to six plots, each 8 ha in size, were established in each block, depending on the size of an area with uniform stand conditions. Six harvest treatments were installed that ranged from an uncut, old-growth stand (control) to a clear-cut (Figure 1). For our study, we selected three blocks (38, 39, and 43) and two treatments: the old-growth control (uncut) and the U.S. Forest Service heavy cut that removed about three-quarters of large tree volume. The heavy volume removal was one of the standard harvest methods used on National Forests at that time. The heavy cut (thereafter we call this treatment as “harvest”) produced a single canopy layer of well-spaced pole-timber and small sawtimber-sized trees with a few large gaps in the canopy [35] and was considered an extreme contrast to the uncut forest. The uncut control had no cutting of live trees or of dead or dying timber from the beetle attack. Trees were defined to be stems with dbh > 29.2 cm, and all stems were measured in the entire block. Pole-size trees were those with 9.1 cm ≤ dbh ≤ 29.2 cm and were tallied by species on four 0.25 ha strips. Dbh of all standing snags were measured, and snag condition and decomposition stage were recorded following Maser et al. [36].
The original plots across ten blocks for both treatments prior to harvest had an average of 60 trees ha−1 with a quadratic mean diameter (QMD) of 66 cm and bole volume of 205 m3 ha−1 [33]. After treatment, the harvested plots had 30 trees ha−1, a QMD of 53 cm, and standing volume of 57 m3 ha−1. When plots were remeasured in 1990–1991, uncut control and harvest plots both averaged 86 trees ha−1, with a QMD of 56 and 46 cm and a volume of 196 and 120 m3 ha−1, respectively. On six plots among three blocks (Figure 1), we used the respective tree species’ diameter data to estimate all aboveground biomass (boles, branches, and needles) based on allometric equations developed from northern California [37]. These data and other characteristics (basal area and tree density) were used to characterize the contemporary stand conditions. Although tree seedlings and saplings with dbh < 9.1 cm were not measured, we estimated this biomass pool with 5% of total overstory trees that was estimated based on data from high structural diversity plots by Zhang et al. [38]. The coarse root biomass was assumed to be at a root/shoot ratio of 22% [39]. Carbon stock was obtained by assuming 50% C content in the tree biomass.
In the two treatments plots in each of the three blocks, we installed three 500 m2 circular subplots (25.2 m diameter) (①, ②, and ③) within the center 4 ha of each plot in 1992 (Figure 1C). We classified the surface area of each subplot into 4 ground cover categories: (1) coarse wood debris (CWD), (2) bitterbrush (PUTR), (3) prostrate ceanothus (CEPR), and (4) pine needles and herbaceous plants (OPEN) (Figure 2). The shrub cover types (PUTR and CEPR) are both N-fixing plants. Samples were collected for mass and C within each ground cover type over five return trips over an 18-month period. The pools collected were wood fragments of brown cubicle rot, forest floor, and soil (Figure S1).

2.3. Coarse Woody Debris (Lying and Standing Dead Wood)

In each plot, we randomly located CWD transects for lying wood where CWD volume of pieces 0.6 to 60 cm in diameter was tallied by diameter class according to Brown [40]. Transect data provided an estimate of volume by decay types, intact wood, as white rot decayed, or brown rot decayed [41], which was converted to mass using estimates of wood densities. For logs > 60 cm diameter, we selected one log in each treatment plot and cut three 1-meter-long sections (at each end and the middle, Figure S2), yielding a total of 54 sections (3 blocks × 3 plots × 2 harvest treatments × 3 log sections = 54) (Figure 2B). Log sections were separated into decay types of intact wood, white rot, or brown rot (decay types were verified by laboratory analyses described below). The three decay types were weighed in the field. A subset of the smaller CWD (<60 cm) was also subsampled by decay type for laboratory analyses.
Dimensions of larger downed logs were used to estimate volume, and these were converted to mass using estimates of wood density. Total down CWD mass was estimated by adding the totals from the CWD transects and the larger downed logs.
Snag volumes (standing dead wood including branches) were estimated from the stem inventories and were based on the snag dbh applied to biometric equations of Zhang et al. [42] if snags showed no breakage. Snags with broken tops were estimated as cylinders. Volumes were converted to mass using specific gravity by decomposition classes [37].

2.4. Forest Floor and Soil Sampling

At each of the five sample dates we randomly selected a sampling point in each circular plot under each ground cover type (CWD, PUTR, CEPR, and OPEN). Forest floor (combined Oa, Oe, and Oi including woody debris < 0.6 cm diameter) in a 30-centimeter ring was first collected. After the forest floor was removed, the mineral soil was sampled to a 30 cm depth using a 10 cm diameter slide-hammer corer [43]. In the field, the core was separated into the 0–15 cm and 15–30 cm layers for separate determinations of total- and fine-soil bulk density. When encountered (typically as a layer on top of the mineral soil), soil wood was separated out; the decay type was later determined to be nearly all brown cubicle rot type [41,44]. This brown rot wood was characterized as highly decomposed woody residue of decay similar to class 5 [45], which was a distinct pool from the brown rot wood measured in the CWD transects. Collected forest floor and soil samples that were used for laboratory analysis totaled 720 for mineral soil for over the five sample dates (n = 3 blocks × 3 plots × 2 harvest treatments × 4 soil cover types × 2 soil depths × 5 sample dates) and 360 for forest floor samples.

2.5. Laboratory Analysis

Samples of wood, forest floor, and soils were analyzed at the USDA Forest Service, Rocky Mountain Research Station Forestry Sciences Laboratory (Moscow, ID, USA). During analyses, roots were hand-picked from the forest floor and mineral soils, washed to remove excess soil, and stored at 2 °C until the ectomycorrhizal root tips were counted. CWD, forest floor, brown cubicle rotted wood, and root samples were dried at 60 °C, weighed, and fine-ground in a Wiley Mill for total C and N analysis on a Leco TruSpec CN analyzer (Leco Corp., St. Joseph, MI, USA). Coarse wood samples were also analyzed for phosphorus (P), calcium (Ca), potassium (K), and magnesium (Mg) by inductively coupled plasma emission spectroscopy (ICP) after microwave digestion using a nitric acid digestion mixture. Mineral soil samples were dried to a constant weight at 105 °C, weighed, and passed through a 2 mm screen to remove rock and other fragments > 2 mm [46]. The sieved soils were analyzed for C and N as described above. Coarse fragments were weighed, and volumes were estimated as part of the determination of total- and fine-soil bulk densities.
The dry mass of the CWD, forest floor, soil wood, roots, and ectomycorrhizal root tips in each core were extrapolated to total values in each plot. Mineral soil C and N concentrations were adjusted to a hectare basis using the fine-fraction bulk density [47]. Total soil C and N pools were calculated for each ground cover type based on the soil C and N contents for the cover type and multiplied by the respective proportion of their plot areal cover. We did not analyze the coarse rock fragments, which have been found to contain appreciable amounts of C and N in some soils [48,49]. After grinding, CWD samples were also analyzed for lignin and hemicelluloses at the USDA Forest Service, Forest Products Laboratory, Madison, WI using the Van Soest method [50].

2.6. Statistical Analysis

We analyzed the data based on a randomized complete block design with treatments (uncut control and harvest) as the fixed effect and block as a random effect using SAS MIXED [51]. This simple model (main plot effect portion of the model) was used to test treatment effects on overstory large and pole size trees, understory shrubs, and downed CWD. For other variables that we collected from the four ground cover types, we used a split-split-plot model with treatments as the main plot effect (4 ha) and different ground covers (CWD, CEPR, PUTR, and OPEN) as the subplot effect on each of three 0.05 ha subplots. Then, sampling seasons were regarded as sub subplot effect. The full statistical model is:
y i j k l m = μ + α i + ε 1 i k m + β j + α β i j + ε 2 i j k m + δ l + α δ i l + β δ j l + α β δ i j l + γ k + ε 3 i j k l m
where y i j k l m is the dependent variable summarized for the ith harvesting treatment (uncut control versus heavy cut), jth ground cover, lth sampling season, mth circular plot, and the kth block; μ is the overall mean; α i , β j , and δ l are the fixed effect of the ith methods of cutting (i = 1 and 2), jth ground cover (j = 1, 2, 3, and 4), lth sampling season (l = 1, 2,…, and 5), and mth circular plot (m = 1, 2, and 3); γ k is the random effect of the kth block (k = 1, 2, and 3), γ k ~ N ( 0 , σ B 2 ) ; ε 1 i k m is an experimental error to test main plot effect (uncut control versus heavy cut); ε 2 i j k m is an experimental error to test subplot effect (ground cover type and its associated interaction); and ε 3 i j k l m is an experimental error to test sub subplot effect (sampling season and its associated interactions), ε 1 i k m ~ i i d N ( 0 , σ e 1 2 ) , ε 2 i j k m ~ i i d N 0 , σ e 2 2 , and ε 3 i j k l m ~ i i d N 0 , σ e 3 2 .
Because the ground areas covered by CWD, CEPR, PUTR, and OPEN varied significantly in areal coverage from each other, all variables measured beneath them were weighted by their specific ground area proportions for total C pools. Based on sample size estimates from this site and others in similar ecosystems [52,53], we expected that our sample location and sampling intensity within each cover type would yield accurate estimates of C pools.
For each analysis, residuals were examined to ensure that statistical assumptions of normality and homoscedasticity were met. If the assumption were not met, a natural log transformation was applied. Multiple comparisons were conducted for least squares means by the Tukey–Kramer test by controlling for the overall α = 0.10 due to the limited replications of the experimental units but we also report P values. If a covariate was used in the model, we presented least square means and standard errors in the results. Otherwise, we presented treatment means and standard errors.

3. Results

3.1. Overstory Trees, Shrubs, and Ground Cover

Fifty years after harvesting, there was a greater tree density in the harvest due to an abundance of pole-size trees (Figure 4C). While total basal area was the same between treatments, the harvest again had a greater proportion of smaller stems than the control (Figure 4B). Although harvested plots showed significantly more C stock for the pole-size trees and less C stock for the large trees than the uncut control (p < 0.10), the tradeoff between these two tree categories resulted in only a slightly smaller (9%) mean C stock of trees in the harvest, which was not statistically significant overall (p = 0.35, Figure 4A).
Cover types and areal coverage are given in Figure S3. PUTR coverage was relatively low with no treatment difference (p = 0.26); mean percent cover ranged in the harvest from 6.4% to slightly higher in the uncut control with 8.3%. CEPR coverage was nearly twice that of PUTR in both the control (13.3%) and the heavy cut plots (14.4%), and the two treatments were not very different (p = 0.72). Assuming a 50% biomass C content, the combined PUTR and CEPR shrub vegetation contained a relatively small 1.34 Mg C ha−1 in the heavy cut and 1.22 Mg C ha−1 in the uncut control. In addition, there were no significant differences in the amount of grass, forb, or other ground covers between the heavy cut and control stands (data not shown). Shrub biomass was further summarized by Busse et al. [34].

3.2. CWD and Snags

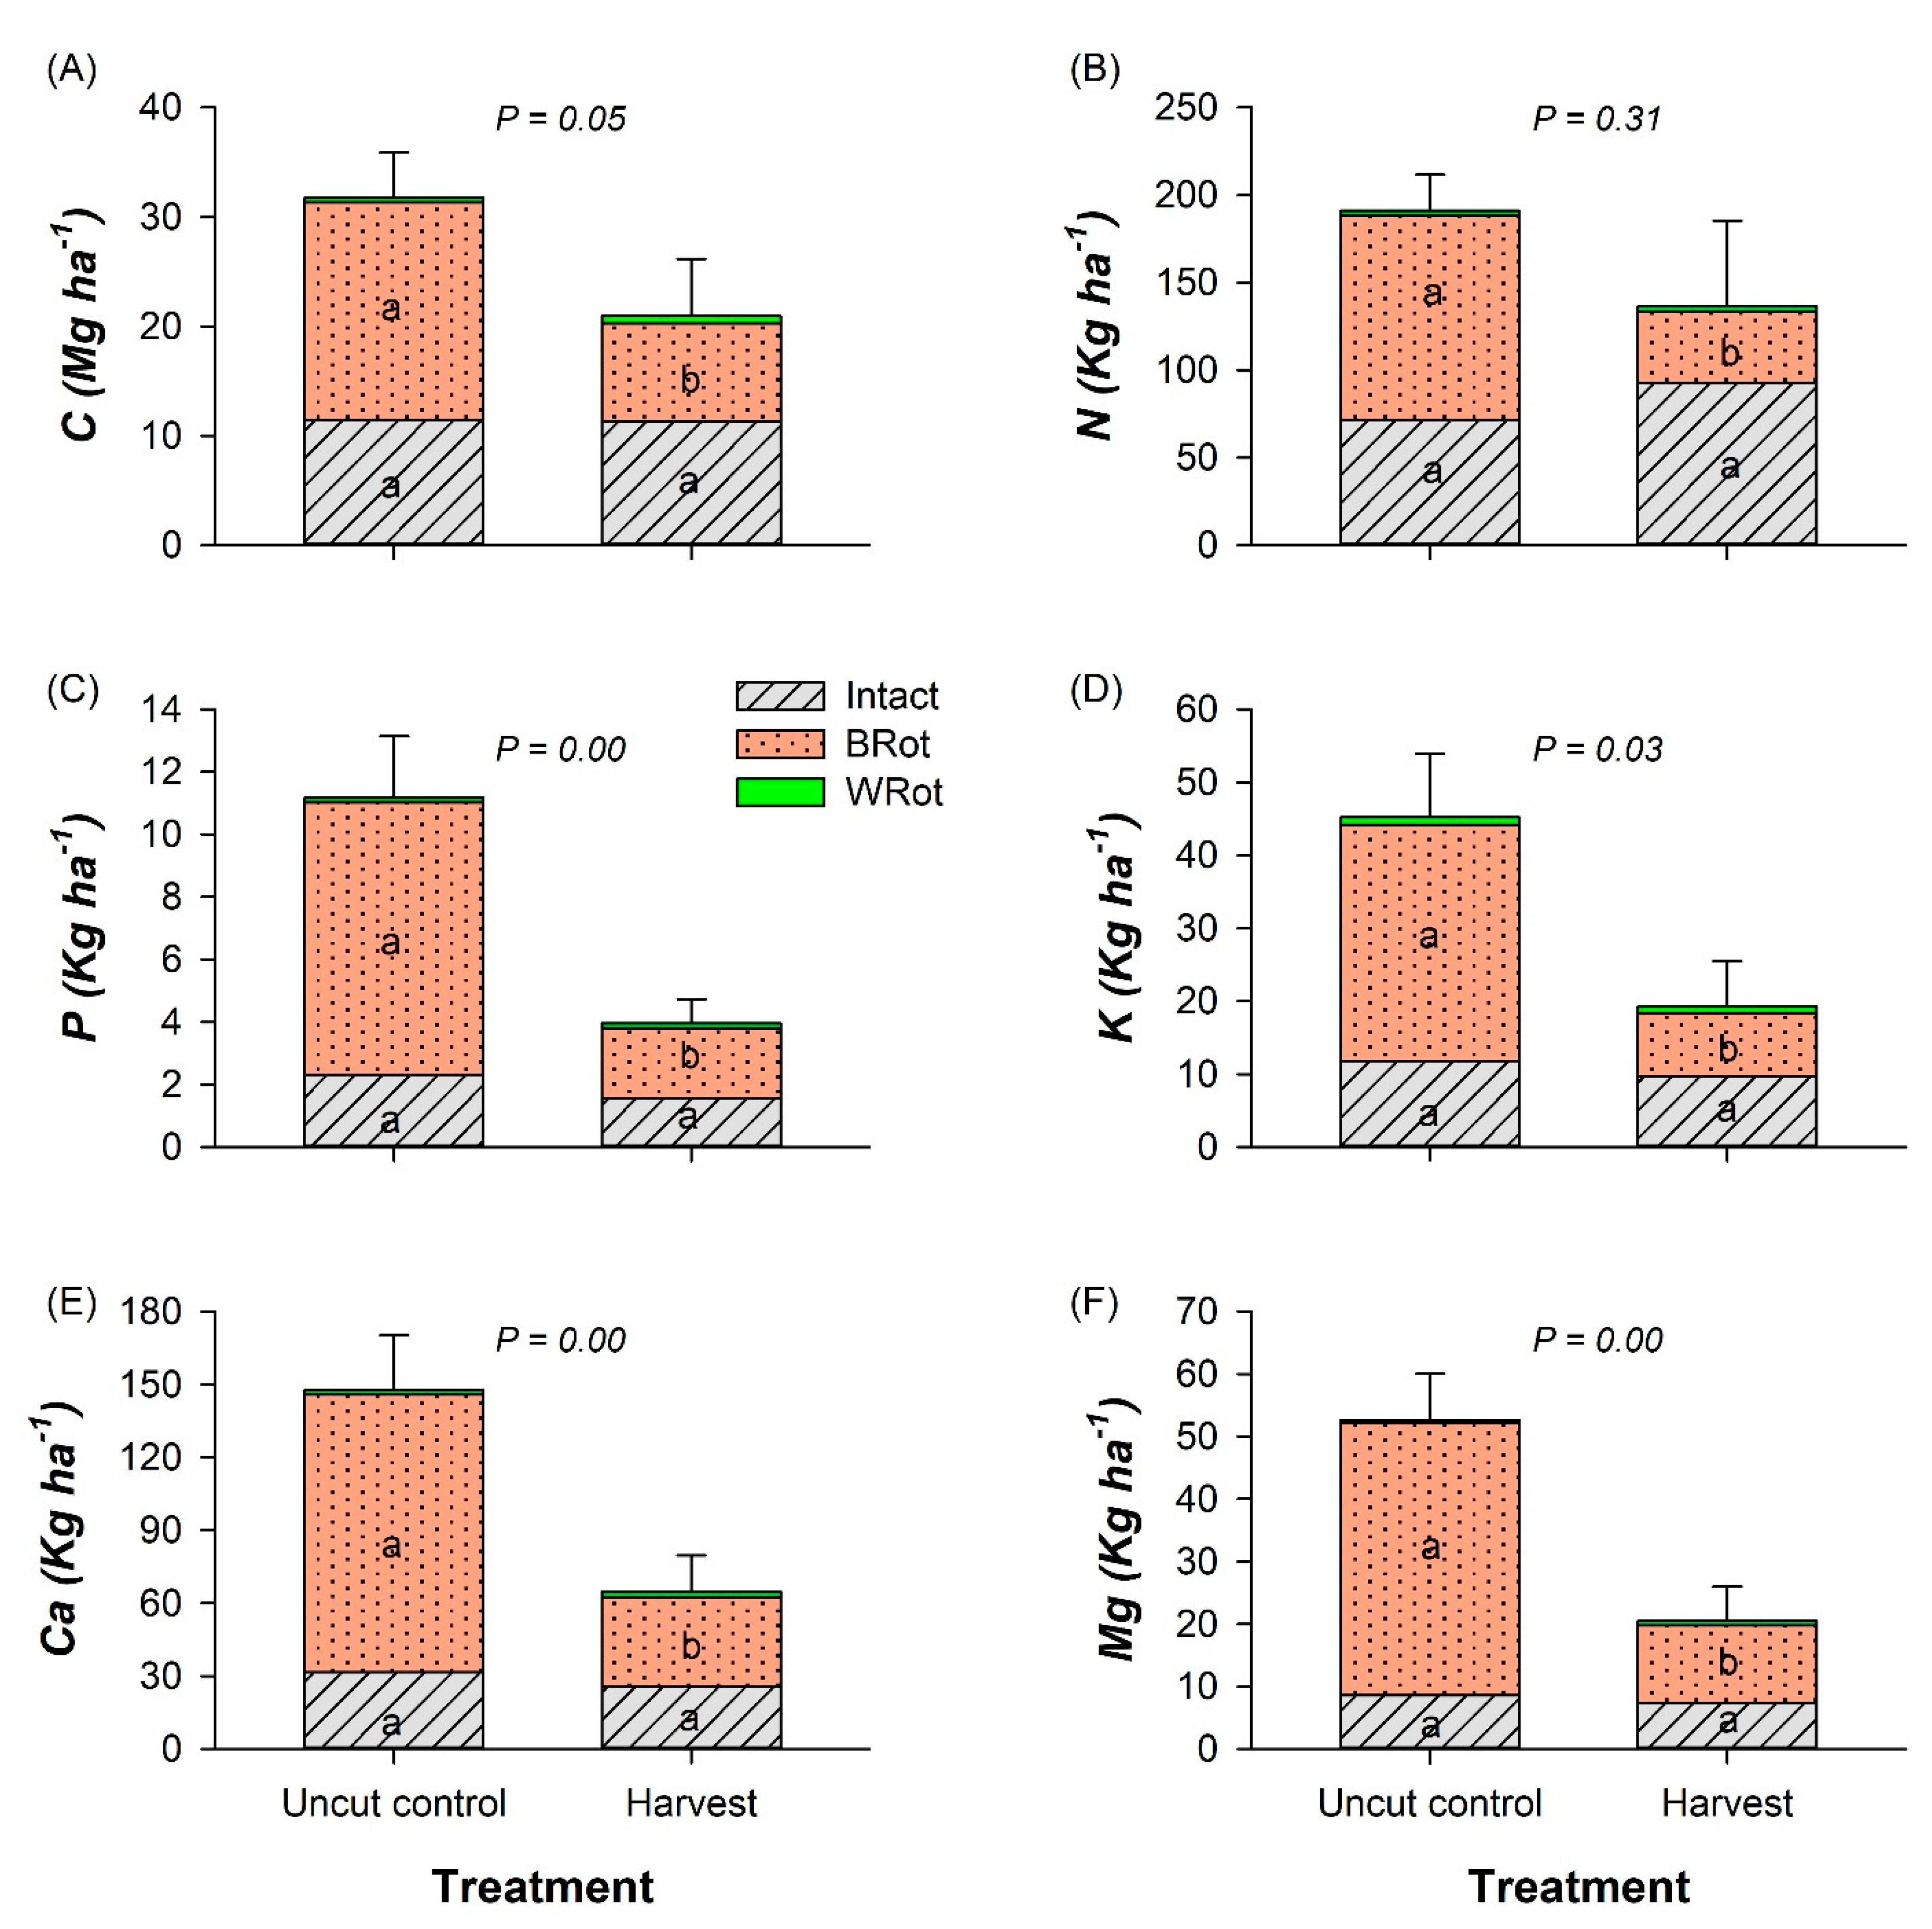
Coarse woody debris (downed logs) covered about 7% of the ground area in both stands (Figure S3). At least half of the CWD C mass was in brown rot type of decay with the remainder in intact wood and essentially no white rot. CWD C mass was 1/3 less (p = 0.09) in the heavy cut compared to the uncut control (21.4 vs. 37.6 Mg C ha−1), and this was due mainly to differences in the amounts of brown rot as intact wood was similar between the treatments (Figure 5A). Nutrient content largely followed the C mass patterns with reduced nutrient stocks in CWD in the harvest due to the differences in brown rots; there were essentially similar nutrient stocks in the intact wood portion between the two treatments (Figure 5). In addition, CWD in the heavy cut plots had slightly less but significantly (p ≤ 0.05) lower lignin concentrations in the brown rot as compared to the uncut control (Table 1). Higher lignin suggests a more decayed state, and older wood as lignin is mostly conserved in decaying wood under brown rots [41]. Mass of intact wood is similar between the treatments, and the mass of nutrients in the intact wood are also similar. However, all the nutrients except N in brown rots are proportionately reduced a greater amount than C in harvests versus the controls. This suggests that brown rots in the harvests may be more highly decayed, having conserved N while other nutrients were leached. If CWD masses were similar at the initiation of the treatments, brown rot may have formed faster by higher decay rates and fragmented off the CWD faster in the harvests (i.e., is now missing). Higher rates of wood stake decomposition in harvested as compared to uncut control plots have been reported elsewhere [54]. This is one line of evidence of CWD C transfer to forest floor and soils. However, sampling did not show a statistically higher level of soil C under CWD in the harvests versus the uncut controls (Table 2); mean C stocks in brown rot pools collected in the forest floor and soil sampling were three-fold higher in the harvests.
Standing snag C was significantly higher (p = 0.049) in the harvest (0.5 ± 0.03 Mg ha−1) than in the uncut control (5.8 ± 1.91 Mg ha−1) although this pool was grouped into the CWD pool. The number in the uncut control is very similar to Woodall et al. (2011) who found an average of 5.2 Mg C ha−1 of standing dead measured in FIA plots of western coniferous forests on Forest Service lands.

3.3. Forest Floor and Mineral Soil

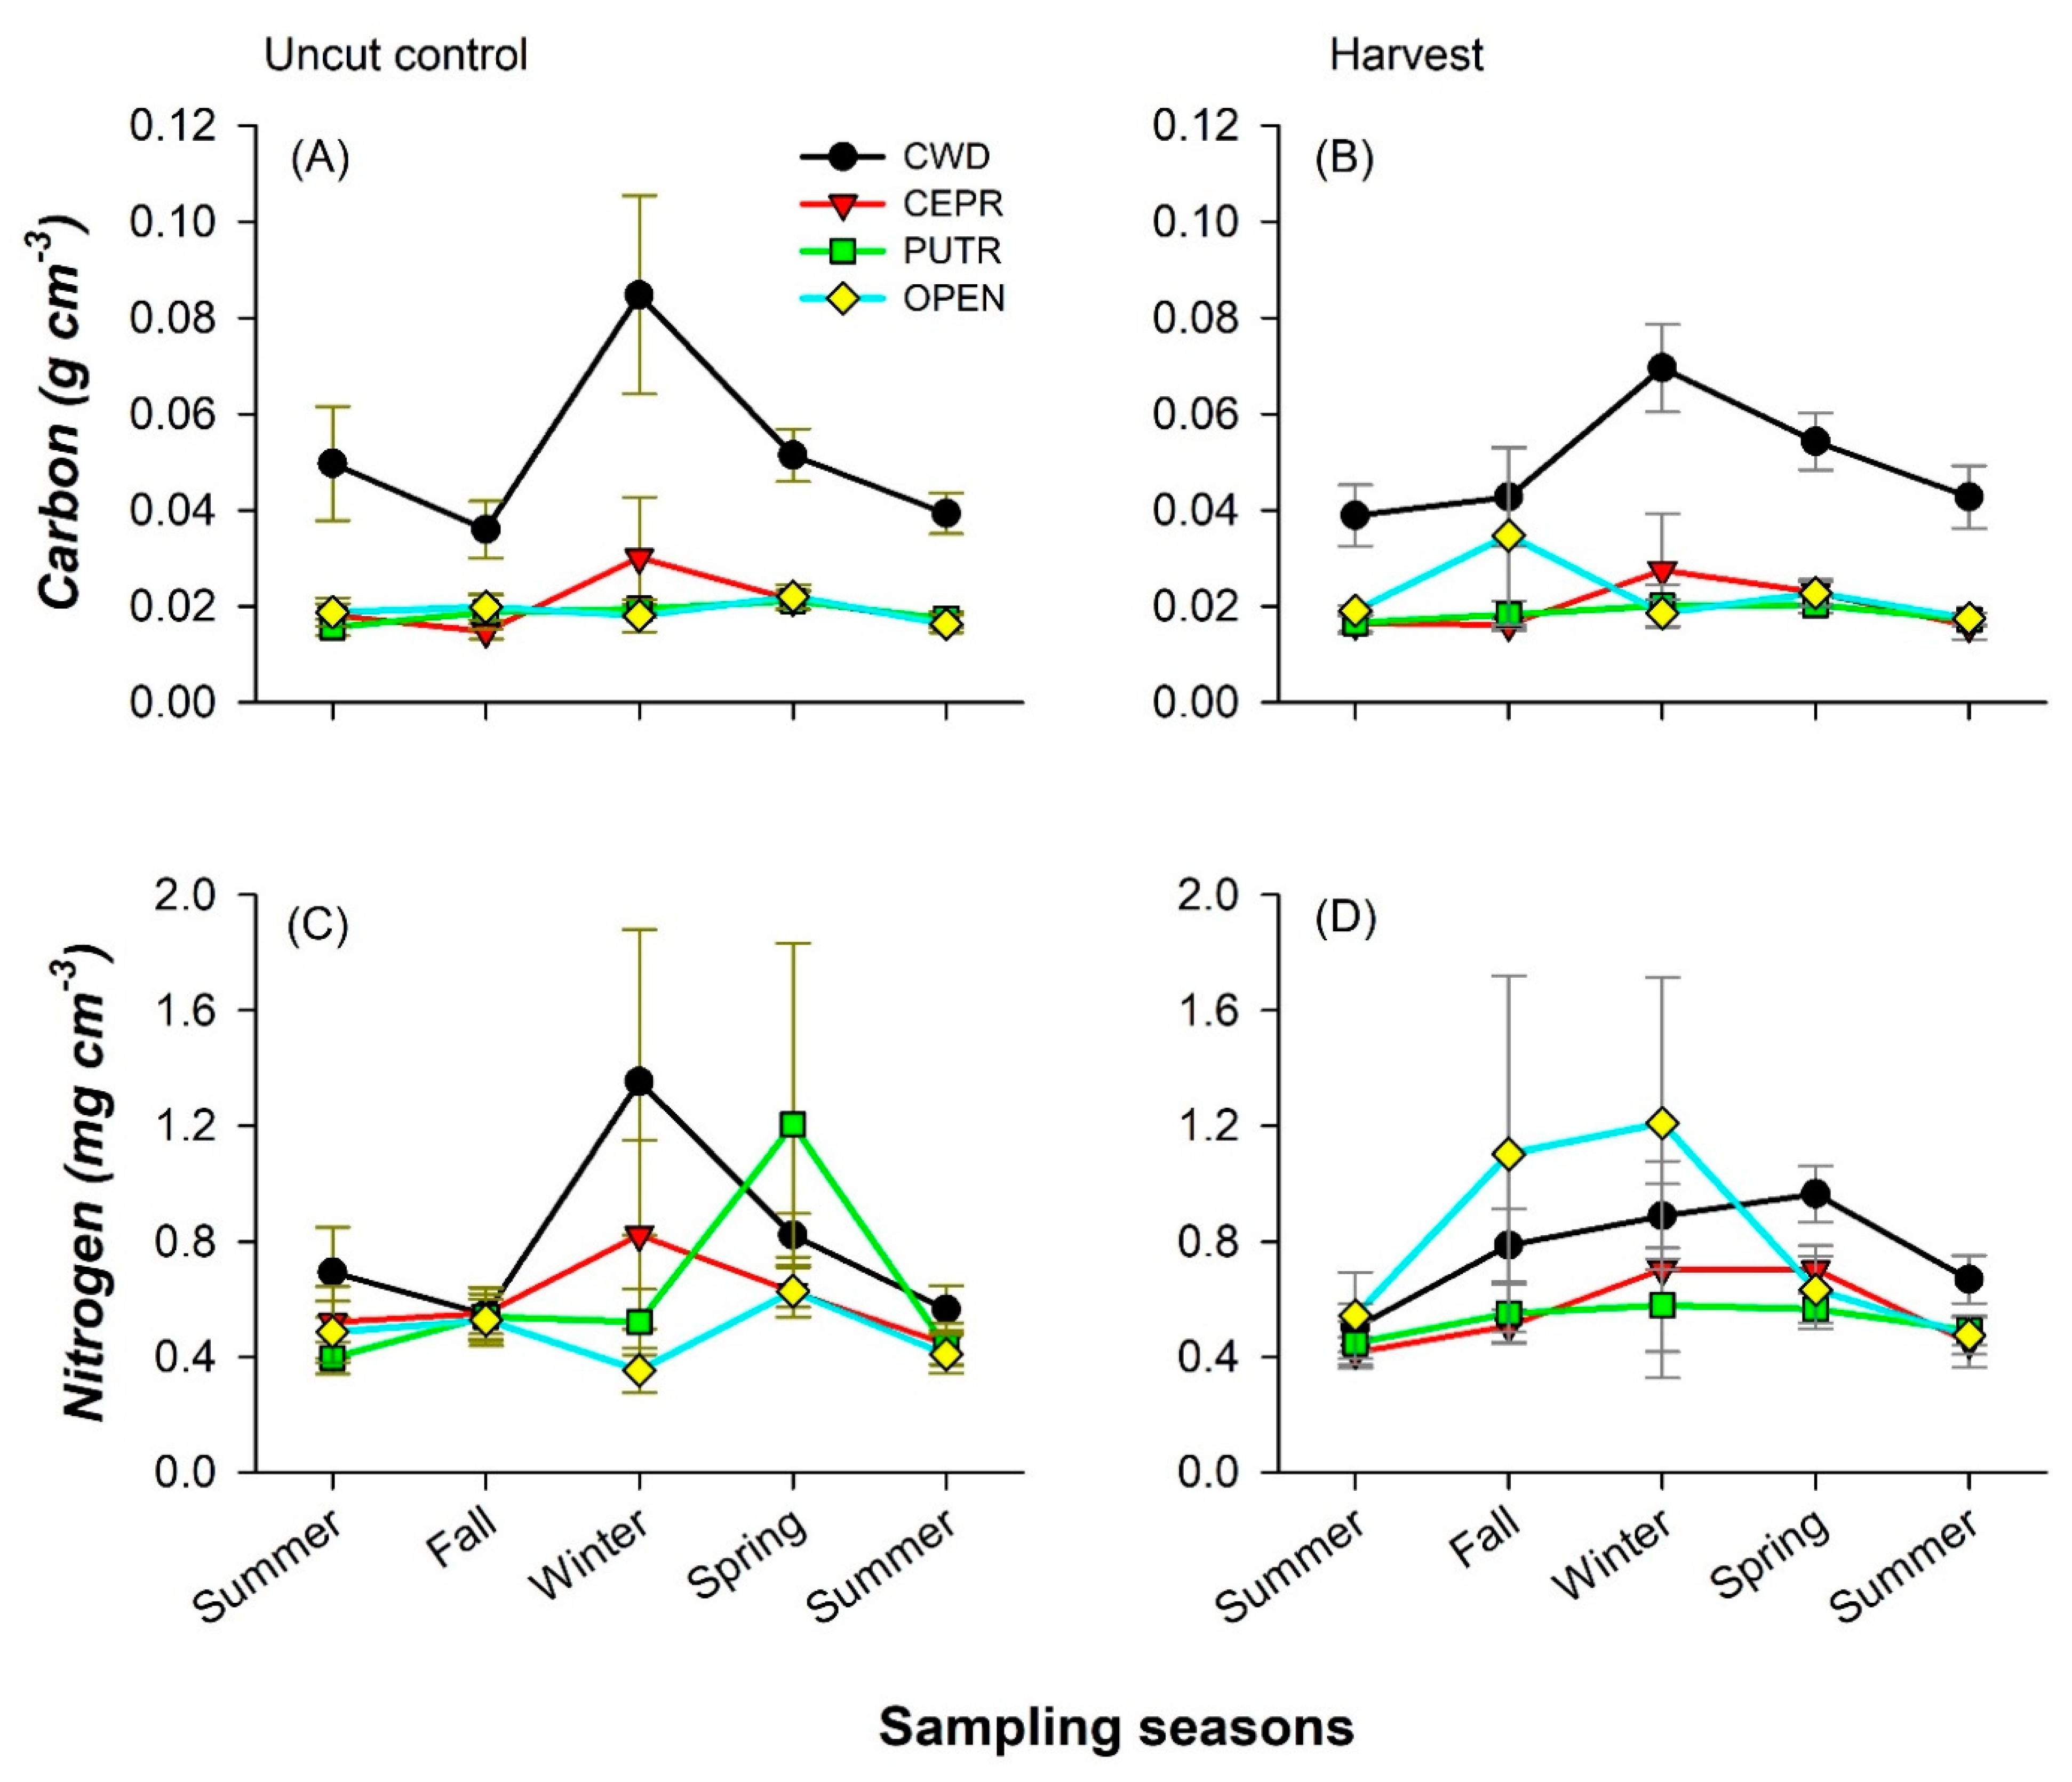
Harvesting three-quarters of stand volume from the forest 50 years ago did not alter mineral soil C and N stocks (p > 0.78; Table 2). However, the type of ground cover significantly affected soil C and N stocks regardless of treatments. Although the comparison of sampling season was more focused on trends for root and ectomycorrhizae (see below), we did observe that winter samples had consistently higher soil C and N (p < 0.001; Table 2). We had no reason to expect increased concentrations in winter, and we cannot exclude sampling error among subplots. One novel finding, however, something that has not been commonly studied before (e.g., [55]), is our observation of two- to three-fold higher soil C concentrations beneath the CWD than other cover types, which is consistent across all sampling seasons (Figure 6A,B). This was associated with our sampling design of sampling beneath CWD and into the underlying mineral soil so as to include soil wood in the cores that were not collected as part of the CWD sampling. No decomposed woody materials were observed beneath CEPR and OPEN in the uncut control or beneath CEPR and PUTR in the harvested plots. In comparison, the trends for soil N stocks were more variable with a trend of higher N also beneath CWD, and the OPEN had elevated N soil N concentrations in the harvested plots during fall and winter versus the uncut control (p = 0.35). An unexpected result that N was not higher beneath CEPR and PUTR, which are both N-fixing species (Figure 6C,D).
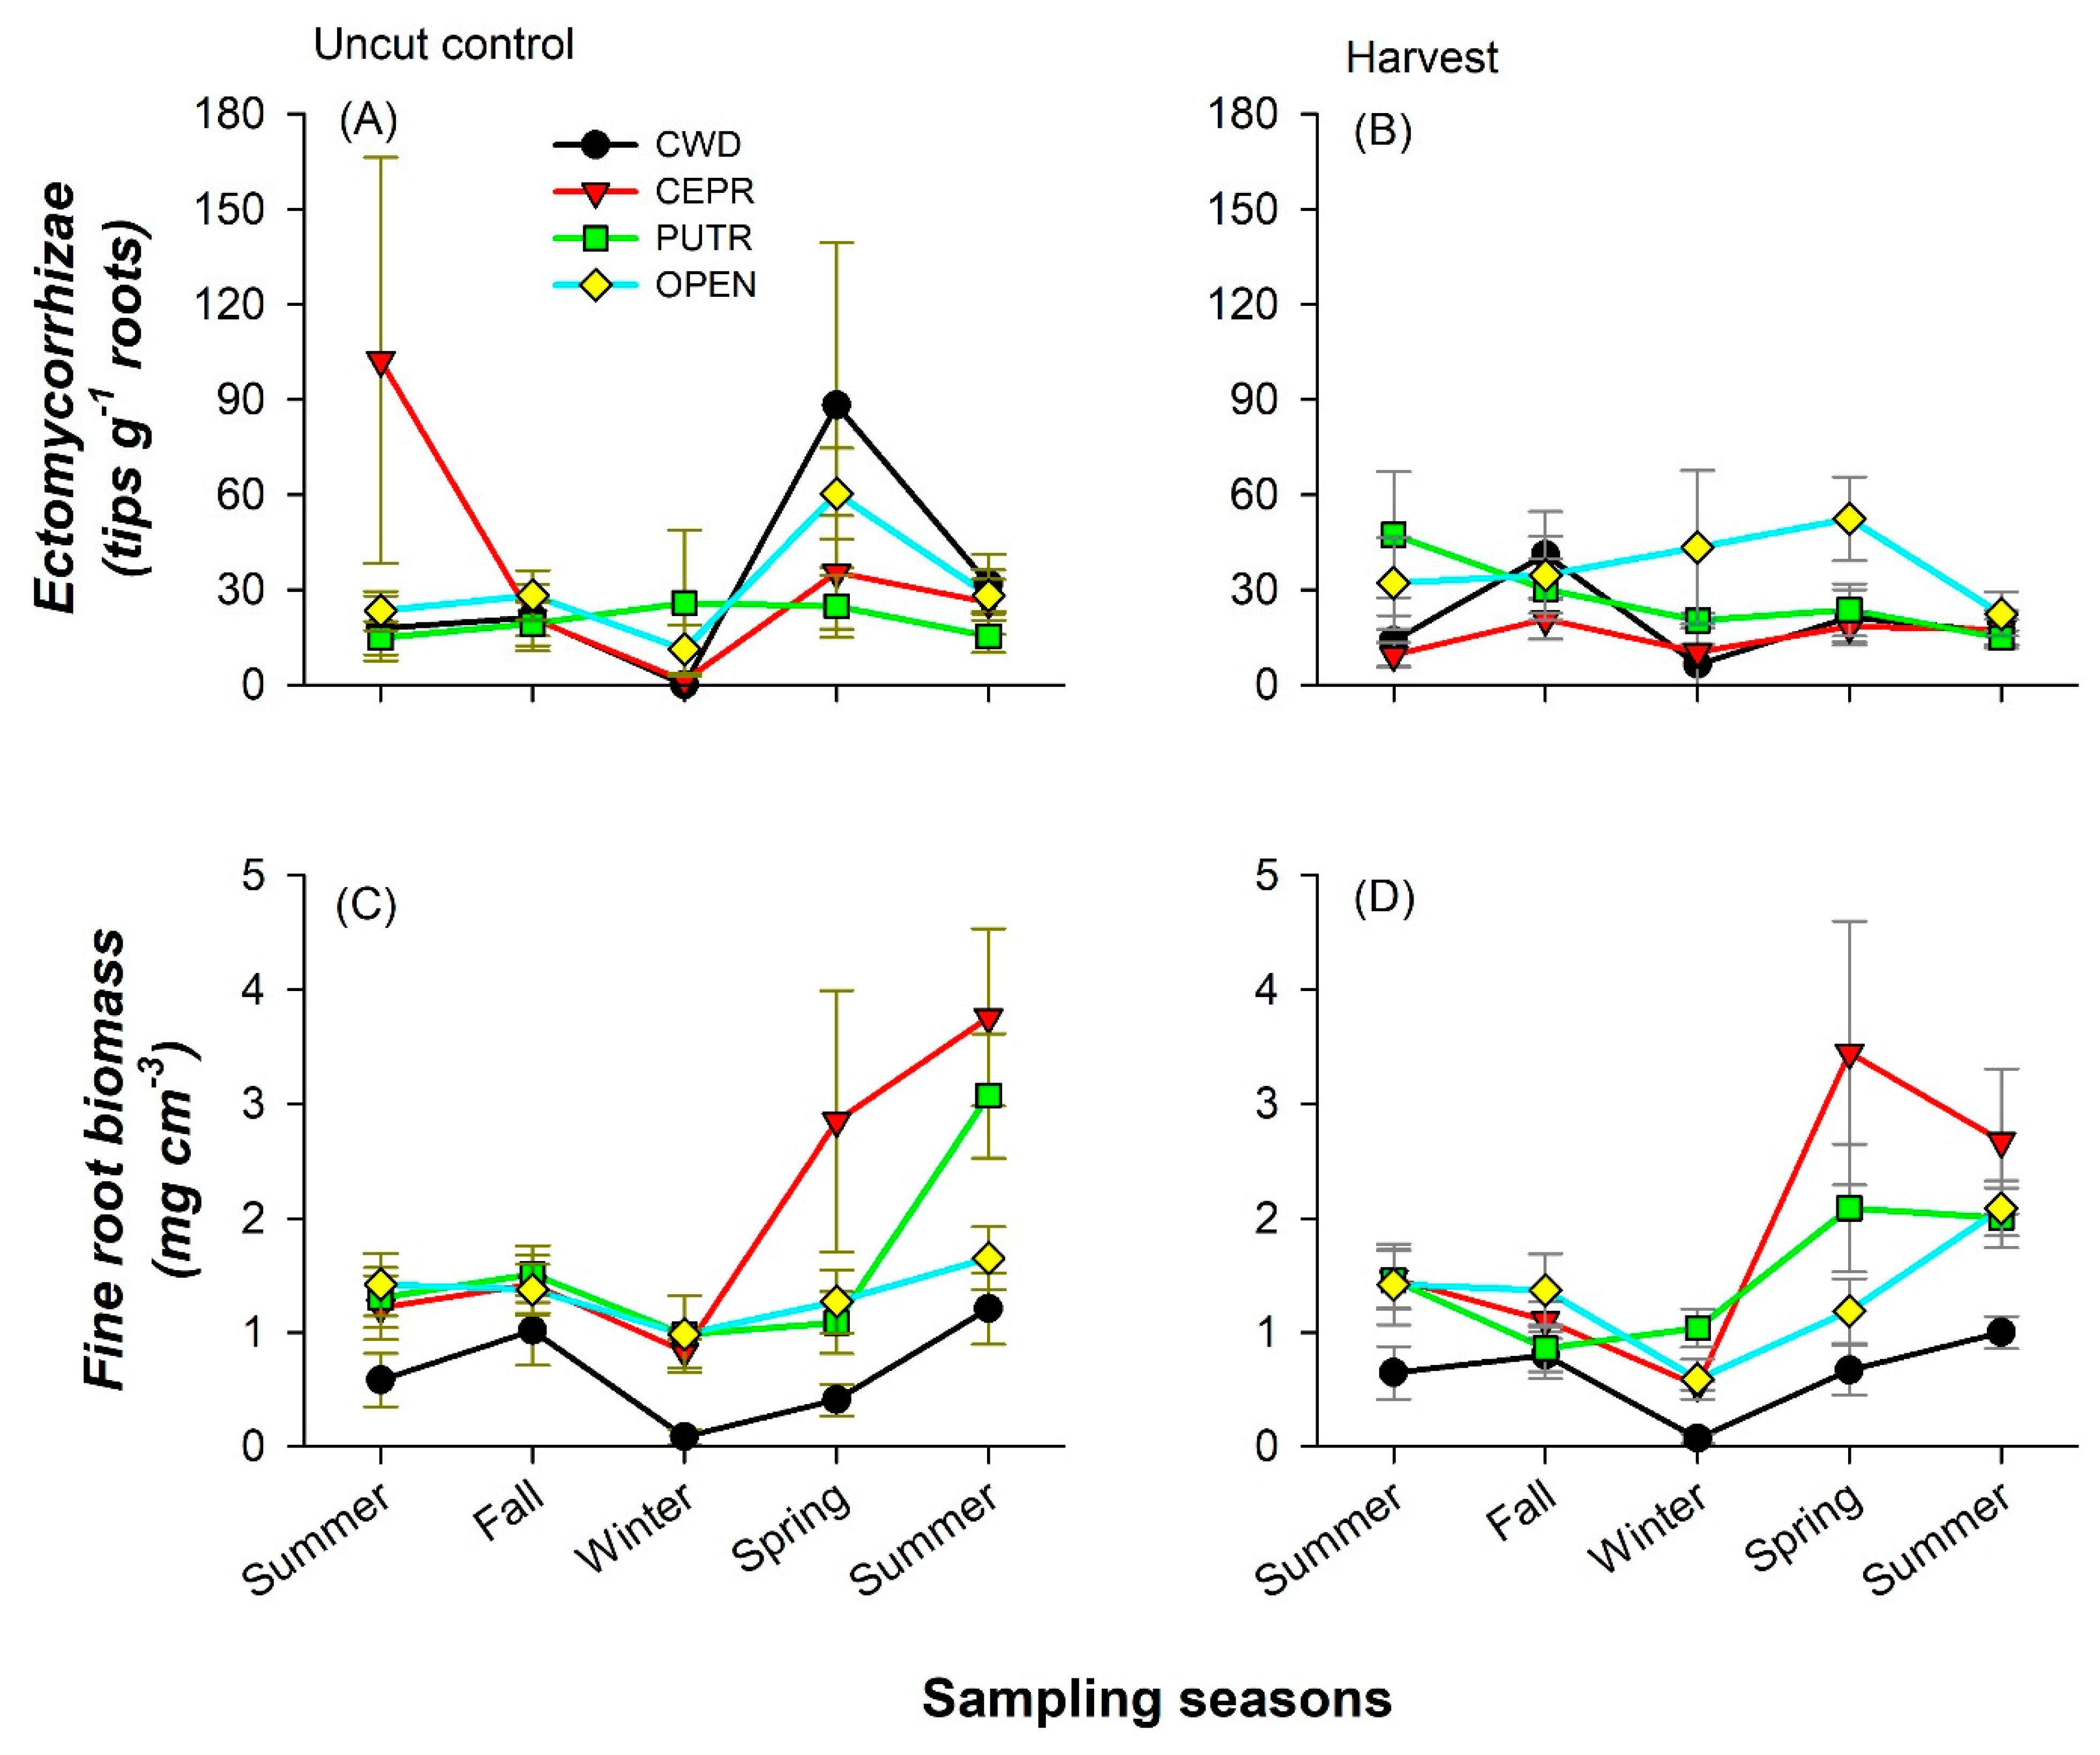
Overall, we found no significant differences in fine root biomass or the number of ectomycorrhizal root tips between the harvest and the uncut control (p > 0.52; Table 2). However, ground cover and sampling season significantly affected fine root biomass (p < 0.001). Ectomycorrhizal root tip numbers were highest on tree roots under the OPEN ground cover, followed by PUTR > CEPR > CWD for both soil depths. None of the treatment effects were significant for ectomycorrhizal tips counts (Table 2), and the weak seasonal effect (p = 0.12) suggests reduced tips and lower variability during winter (Figure 7A,B). Across all seasons, fewer fine roots grew beneath CWD (Figure 7C,D). Although there were more fine roots beneath both shrub species (CEPR and PUTR) than beneath the other ground covers collectively, the trends were not consistent across all seasons. As expected, we observed a majority of fine roots in the mineral soil at the 0–15 cm depth and in the forest floor beneath both shrub species. In both uncut control and harvest, fine root biomass tended to be highest in spring and summer.

3.4. Stand-Level C Pools

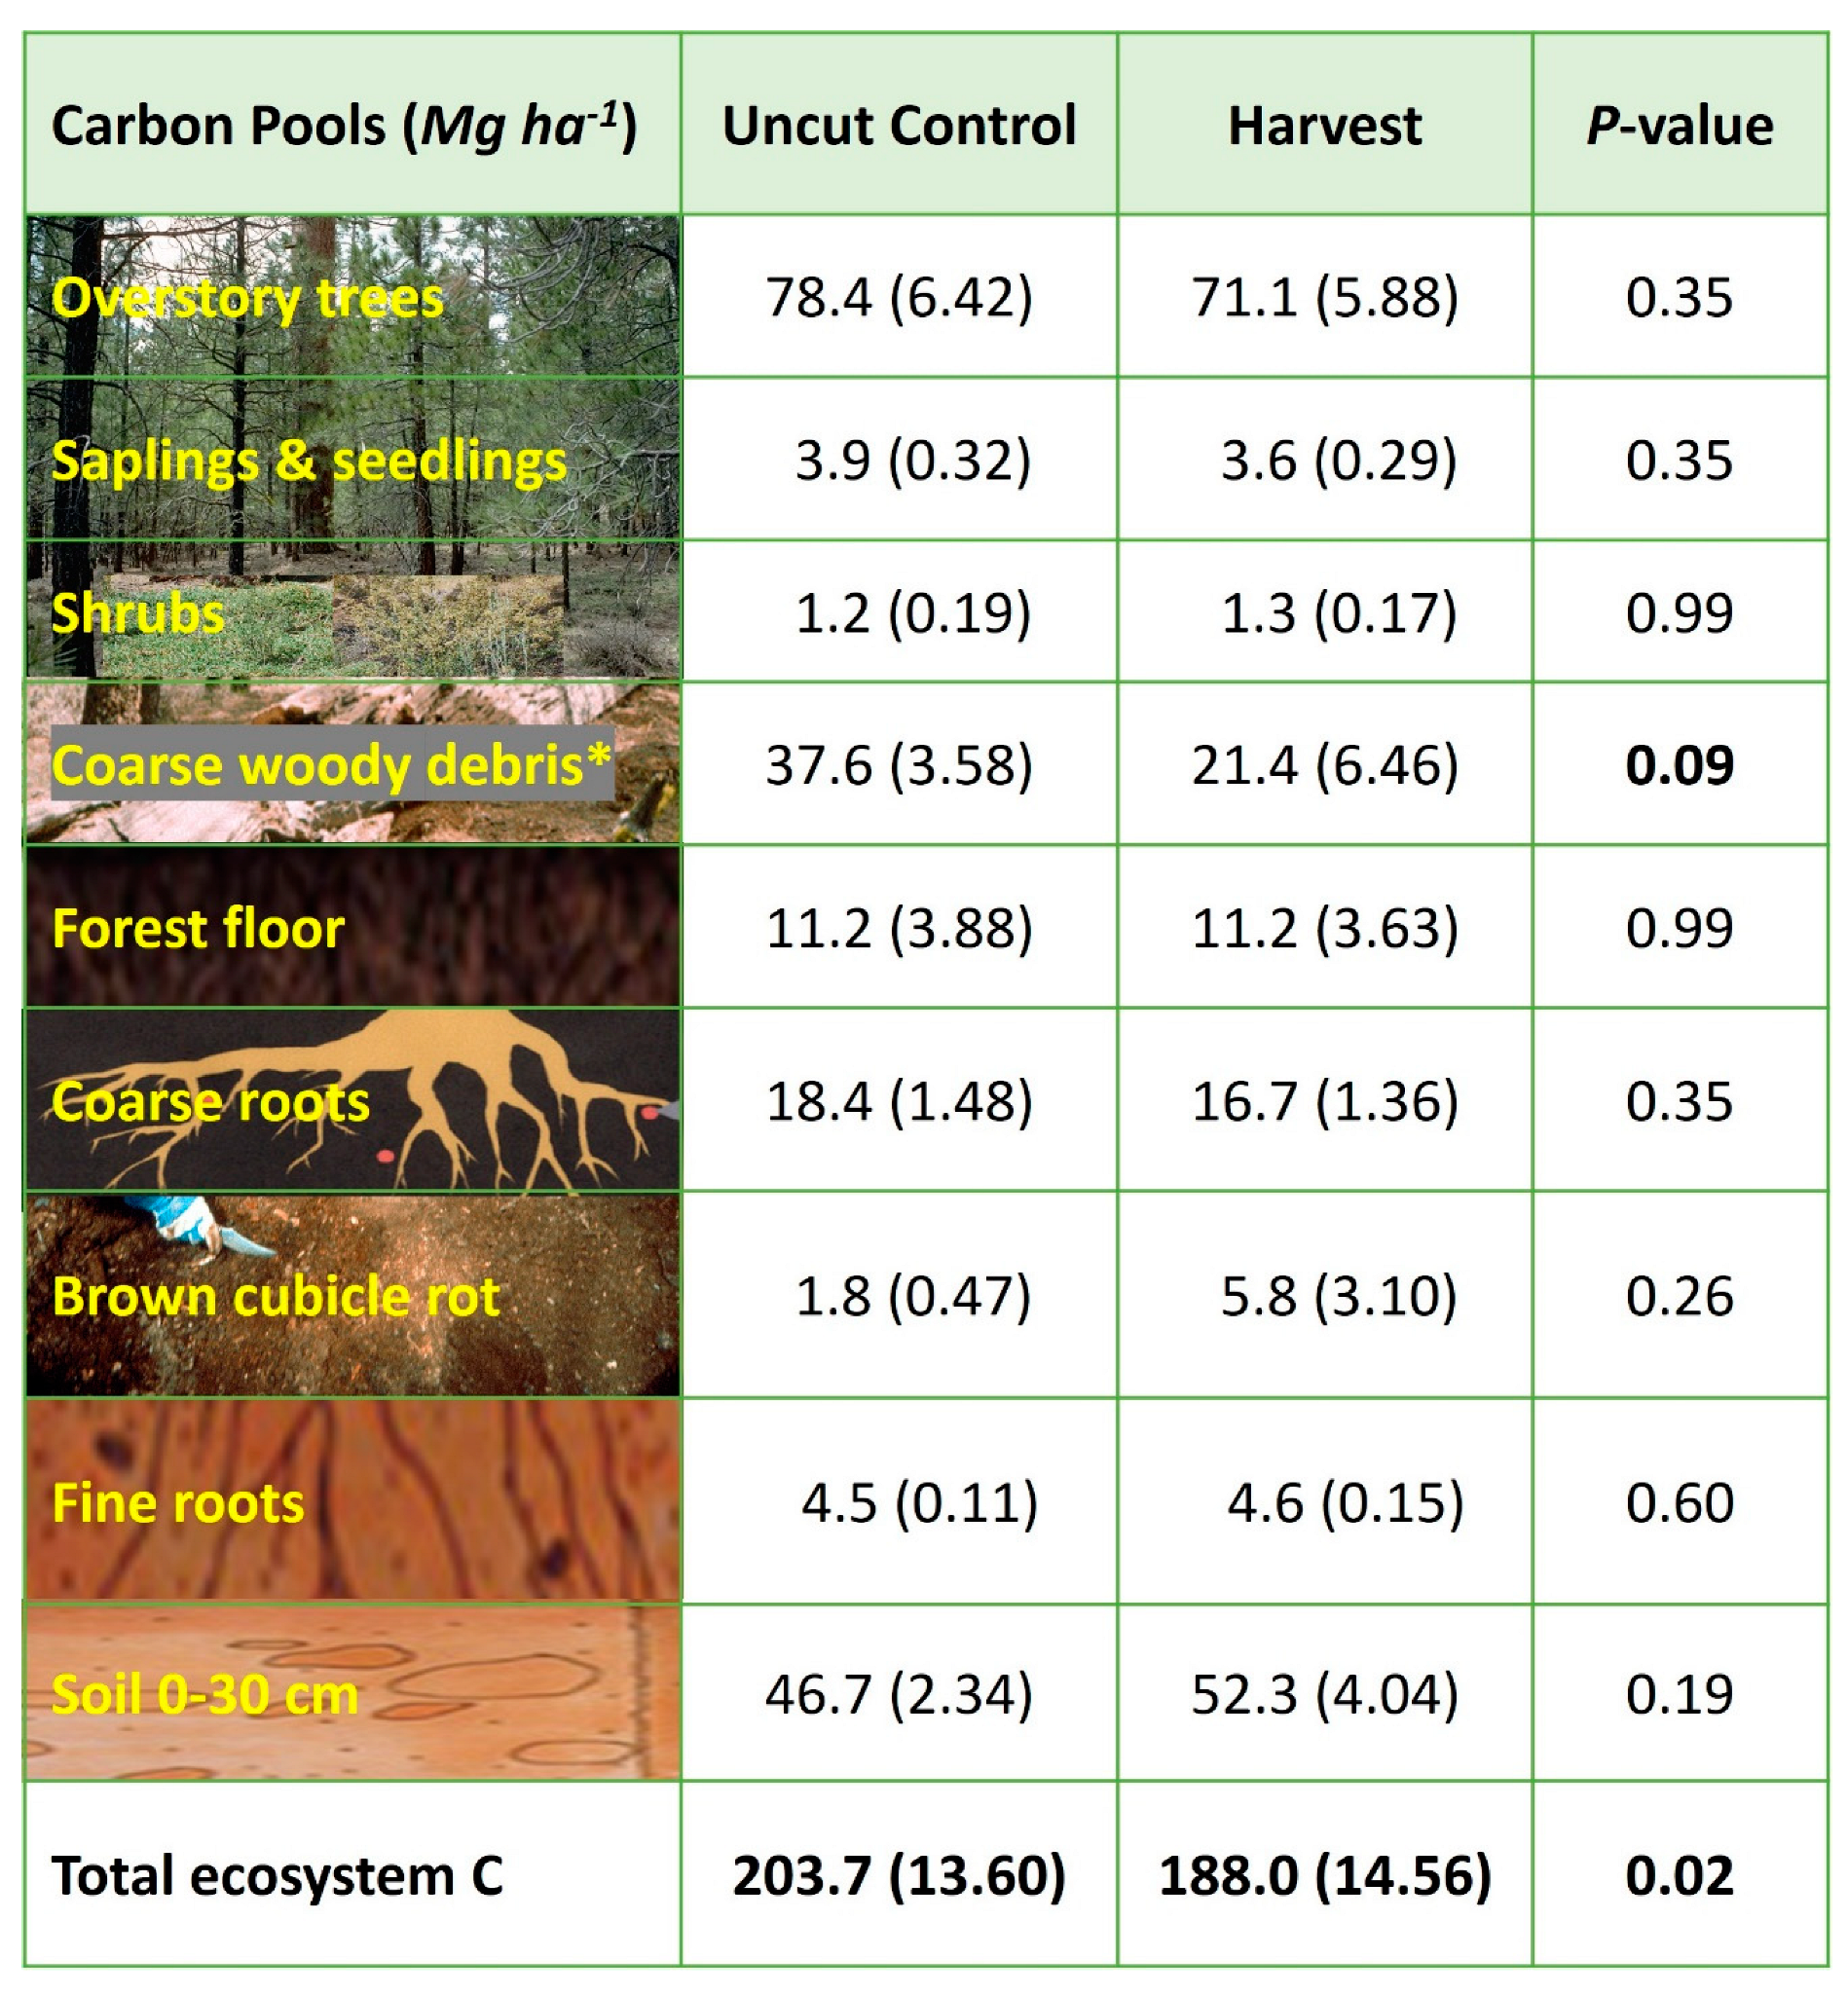
Summing all C pools, we calculated 188.0 Mg ha−1 in the harvest and 203.7 Mg ha−1 in the uncut control (Figure 8). Statistically significant differences were observed for C in the total ecosystem (p = 0.02) and CWD (p = 0.09). Although they were non-significant, C stocks in brown cubical rot (p = 0.26) and within the mineral soil (p = 0.19) were substantially higher in the harvest than in the uncut control. The other measured pools were very similar between treatments (i.e., differences of ≤10 % and p values ≥ 0.35). Live vegetation contributed about 52% to total ecosystem C in both treatments. However, the non-soil detritus (CWD + forest floor + brown cubicles) contributed about 20% to the total C pool in the harvest and 25% in the uncut control.

4. Discussion

Total ecosystem C of 204 and 188 Mg C ha−1 for the uncut control and harvest on this drier site are slightly lower than analogous estimates of pine forests in the western US. Ecosystem C estimates (Mg C ha−1) include 253 for soils to a 30 cm depth in a 60-year-old pine plantation on a good growth site in the northern Sierra Nevada Range of California [3] and 275 for 300-year-old ponderosa pine in eastern Oregon [56]. Powers et al. [37] in examining mixed conifer stands recovering from fire in northern California reported 206 for a lightly burned stand (30 cm soil depth) but 282 for a severely burned stand with 100% stem mortality. The higher C there was due to large amounts of incompletely burned C left over. Though similar estimates of total C are from Law et al. [57] who estimated 210 Mg C in an older-growth ponderosa stand in eastern Oregon to 1 m soil depth and from Smithwick et al. [58] who estimated a mean of 195 to 1 m depth soil for four old-growth forest stands in eastern Oregon.
The control and harvest live C masses of 78 and 71 Mg C ha−1, respectively, are quite similar to each other suggesting the harvest has recovered; however, the control in this study had undergone a severe beetle mortality 55 years ago, and it was likely in a recovery stage itself. These stand C masses were somewhat low when compared to similar pine or mixed conifer stands of older ages or recovering on better sites. For example, Mattson and Zhang [3] reported 124 Mg C ha−1 for their 65-year-old pine plantation on a productive site and 157 for their older-aged mixed conifer stand that had sustained limited cutting entries. Law et al.’s [56] oldest pine stands in eastern Oregon ranged from 122 to 157 Mg C ha−1. This suggests the control and harvest stand of this study may still have been accumulating live biomass as Law et al.’s [56] three younger stands ranging from 57- to 89-years-old and recovering from harvests had low C masses ranging from 36 to 69 Mg C ha−1. Based on these comparisons, our stands may still be in a C accumulation phase despite some remnant older stems in the control. Despite that both the control and harvest may not have yet reached their full live C pool size found in older stands, the live vegetation harvest had largely recovered back to near the control C size. Given similar stand sizes, rates of C inputs from net primary productivity were likely similar, and indeed most of the faster cycling C pools within the harvested stands were similar to the controls such as the forest floor and roots. It is notable that the slower cycling C pools, that is the CWD and soils, were different in the harvest and were still in a recovery stage at year 50.
The reasons for the reduction in the CWD of 16 Mg C ha−1 in the harvests may not be surprising considering three-quarters of the stem volume was removed during logging, and pre-existing CWD may have been reduced during the logging operations by equipment crushing or collapsing older pieces; large declines in CWD were observed by Uzoh and Skinner [27] immediately following their thinning treatments in nearby plots at Blacks Mountain. In addition, mortality of the larger trees and the subsequent rate of wood input to the forest floor would have been expected to be reduced simply due to the removal of mostly large trees during logging, and since the stands had sustained a beetle kill in the years just previous to the logging, logging likely removed some of these recently killed trees. The existence of substantially more standing snags in the uncut control than in the harvest supports the low input from the harvest in our results.
It is also notable that harvests had three-fold greater amounts of cubical brown rot wood in the soils. This brown rot wood had fragmented from the CWD and was part of the organic matter layers in soils beneath CWD. This was associated with slightly higher (though not statistically significant) soil C stocks in the harvests. These differences from the control (e.g., greater brown rot wood fragments and higher soil C) suggest that, in the harvests, the reduced CWD may have been the result of additional C transfers from the CWD pools to the brown rot fragment pools and ultimately to the soil pools. These two pools increased by 10 Mg C ha−1, making 6 Mg C ha−1 missing from the CWD when compared to the control. This missing C could be attributed to the physical disturbance of the logging or simply to sampling variability. One may expect the forest floors to also show some evidence of larger C stocks in the harvested stands as decaying and fragmenting wood would also be transferred first to the forest floor. However, sampling error due to the limited replication may again be the problem.
The CWD C stocks including standing dead of 37.6 Mg ha−1 in the uncut control and 21.4 Mg ha−1 in the harvest are notably high relative to the size of the other C pools except for overstory trees, representing 18% of the control and 11% of the harvest stands (Figure 8) of the total forest C when measured to a depth of 30 cm in the mineral soil. These percentages are higher than the 8% estimated for global CWD contributions to forest C stocks to a soil depth of 100 cm included in the review by Pan et al. [2]. In the California Mediterranean climate, CWD in northeastern dry ponderosa pine-mixed conifer forests decomposes relatively slowly, and wood can last decades on the soil surface [59,60,61] as large CWD stocks are reported for other temperate and boreal coniferous forests [55,62].
This CWD C in these two treatments is similar to many other studies for this region. CWD stocks range from a low value in an 80–120-year-old lodgepole pine stand, also a dry forest in eastern Oregon, USA, of 9 Mg C ha−1 [63], to a high value for an older aged northern Sierran mixed conifer stand of 45 Mg ha−1 standing and down CWD [3].
The Forest Inventory and Analysis (FIA) plots in California for CWD mass in 200+ years old stands average a similar 26.1 Mg ha−1 [64]. In addition, using the FIA dataset from the northwest USA, ponderosa pine stand CWD was 20.4 Mg ha−1, and lodgepole pine stand CWD was 28.8 Mg ha−1 [65]. Generally, results from FIA plots include multiple ponderosa pine stand ages and harvest regimes. Large CWD masses have been reported for other conifer forests when protected from fires in Sierra Nevada Range of California, ranging from 32 to 49 Mg C ha−1 (reviewed by Uzoh and Skinner). Uzoh and Skinner [27] reported similarly high C in intact CWD of 29 Mg C ha−1 at nearby sites in protected old growth forest.
Magnusson et al. [55], in their review of the sequestration of C from CWD in forest soils, note many knowledge gaps regarding the flux of C from wood to forest soils, especially the leaching of dissolved C, assimilation by decomposers and transformation of organic compounds, transport by fragmentation, and mixing. However, they also note decomposition rates are largely unknown and rarely studied and that “results regarding soil C content change below CWD remain sporadic.” We report a relatively large mass of cubical brown rotted wood being associated with the intact CWD and the associated two- to three-fold higher soil C concentrations beneath highly decomposed logs versus concentrations in soils nearby (Figure 6). An extremely high 88 Mg C ha−1 mass of fragmented brown rot was reported by Uzoh and Skinner [27] in their old-growth plots before burning treatments, and nearly all of it disappeared following prescribed burning treatments. It should be noted such high estimates may be viewed with some caution as methods of collection of brown rot wood are not standardized, separation of organic layers from mineral soil in the field is problematic [66], and it is difficult to determine the endpoint of decay where highly decayed wood becomes soil humus [55]. Further complicating how highly decayed CWD is categorized, are the input of litter and the amount of excavation needed to describe the amount of CWD on and in the mineral soil.
Studies of soil C either as a flux from wood or following harvests are varied in methods, and it is not always easy to disentangle a clear trend [66]. However, two meta-analyses of large sets of studies of harvests show a tendency of C loss in surface organic matter (forest floors) and mineral soils with harvest operations [10,11]. Losses tend to be most evident during the first decades, and James and Harrison’s [11] graphs showed soil C recovers by year 75. Black and Harding [6] used a chronosequence to study ecosystem C following harvests with clearing and burning of mixed conifer stands in California. Though their stands had complications of erosion and a control that showed low soil C, they concluded that the total forest floor and soils lost C for the first 17 years following harvests, and their stand at year 79 shows signs of recovery though perhaps not to pre-harvest levels.
Studies of C transfers from woody residues to mineral soil are scarce as Maganusson et al. [55] point out, but one study that showed such transfers is Busse et al. [67] who in a designed study with replication and controls found statistically significant doublings of soil C following mixing of 75 Mg OM ha−1 wood chips into forest soils in California. Fragmentation fluxes from wood are not typically noted in most wood decay studies as they focus on more recently dead wood and on density loss [68] or CO2 efflux [69]. Studies of later stages of wood decay report relatively high rates of fragmentation of wood. Lambert et al. [70] reported that fragmentation was the greatest path of C loss during decay of balsam fir (Abies balsamea (L.) Mill.) in New Hampshire. Larsen et al. [44] in reviewing their studies of wood decay in conifer forests of the northern Rocky Mountains noted brown cubicle wood was relatively frequent, being observed in 15% of their transects lengths; they also believed that brown cubicle wood was more functionally unique than previously thought, and exhibit functions and characteristics that are similar to (and even more efficient than) other soil components such as humus. Mattson and Swank [71] reported that CWD in hardwood forests in North Carolina during the last half of wood decay lost one-third of their mass as fragmentation. Mattson and Zhang [3] reported three conifer stands that contained on average 16.5 Mg C ha−1 wood fragments on the forest floor and in mineral soil to a 30 cm depth, but this buried soil wood mass followed the trend of above ground CWD mass in the forests though soil C mass did not.
As wildfires, insect outbreaks, and diseases seem to be exacerbated by rapid climate change [12], land manages currently need to consider their options to improve forest resilience to such disturbances. Furthermore, intact growing forests are increasingly being looked to as highly efficient C sequestration mechanisms [14,72,73]. Past fire suppression, grazing, and logging of western forest stands have significantly increased stem density and have changed stand structure and composition [74,75] and CWD distributions [76]. Therefore, the management goals often are to maintain and even increase forest C capture while also reducing stand densities to relieve environmental stressors to trees and treat hazardous fuels build up in public forests [27]. The role of soil in releasing and storing C following harvests and other disturbances still appears to be complicated and variable, and general patterns are not easily described. In this context, several management implications are worth noting from our results. First, the current thinning intensity used in restoration projects on public land is much lower than what was used in the heavy harvest plots at Blacks Mountain Experimental Forest. Therefore, evidence of vegetation C recovery here indicates currently treated stands likely would recover quicker, and the recovery of net positive C by the forest should be faster. Second, in our study, slightly elevated ecosystem C 50 years after harvests was largely the result of the greater CWD pools in the uncut control, and CWD may have had a role in enhancing C transfers to the soil during the recovery period. Last, woody debris is considered a major fuel hazard for some length of time until advanced stages of decay. In extremely hot fires, the advanced stage of decayed wood can also be fuel in drought-prone climate regimes [76]. Therefore, managers face a dilemma to retain CWD in the forests as a C sink or remove it as a fire reduction action. While this study sheds light on potential benefits of leaving woody debris in forests, such tradeoffs with increased fire hazards will require further study.

5. Conclusions

We show that overall ecosystem C changes its partitioning among pools at year 50 following recovery from heavy harvest of pine stands in northeastern California. We also demonstrate a likely pathway of C flux from CWD to forest soils, as observed from increased soil C concentrations beneath logs, increased mass of brown cubicle rotted wood beneath logs, and increased soil C pools in harvests where CWD has declined. Because CWD is a relatively large and long-term C storage source, this resource may be a way to manage for C sequestration in the wood itself and into the soil pool.

Supplementary Materials

The following supporting information can be downloaded at: https://www.mdpi.com/article/10.3390/f14030623/s1, Figure S1: Sample collection: (A) decomposed woods mixed with soil under downed log, (B) roots collection from soil, (C) soil core collection on OPEN, (D) soil core collection beneath Ceanothus, and (D) soil core collection beneath decomposed wood; Figure S2: Downed wood sampling (A) one of three 1-m logs sampled from a downed log, (B) white-rot fungi decayed wood, (C) Brown-rot fungi decayed wood, (D) decayed wood separation, and (E) decomposed log that was sampled; Figure S3: Cover percentage beneath coarse woody debris (CWD), Ceonothus prostratus (CEPR), Purshia tridentata (PUTR), and OPEN in uncut control and harvest at Blacks Mountain Experimental Forest.

Author Contributions

Conceptualization, J.Z., D.S.P.-D. and M.F.J.; methodology, J.Z., D.S.P.-D. and M.F.J.; formal analysis, J.Z. and D.S.P.-D.; investigation, D.S.P.-D. and M.F.J.; writing—original draft preparation, J.Z.; writing—review and editing, J.Z., D.S.P.-D., K.G.M., M.F.J. and M.B. All authors have read and agreed to the published version of the manuscript.

Funding

This research received no external funding.

Data Availability Statement

The data presented in this study are available on request from the corresponding author.

Acknowledgments

We thank all supporting staff for their help when this study was conducted. We dedicate this paper to our late colleague R.F. Powers who initiated this project and oversaw field data collections and some laboratory analyses. The comments from anonymous reviewers and editors for improving the manuscript are greatly appreciated. Use of trade names in this paper does not constitute endorsement by the United States Department of Agriculture Forest Service. The findings and conclusions in this publication are those of the authors and should not be construed to represent any official USDA or US government determination or policy.

Conflicts of Interest

The authors declare no conflict of interest.

References

  1. Birdsey, R.; Pregitzer, K.; Lucier, A. Forest carbon management in the United States: 1600–2100. J. Environ. Qual. 2006, 35, 1461–1469. [Google Scholar] [CrossRef] [PubMed] [Green Version]
  2. Pan, Y.; Birdsey, R.A.; Fang, J.; Houghton, R.; Kauppi, P.E.; Kurz, W.A.; Phillips, O.L.; Shvidenko, A.; Lewis, S.L.; Canadell, J.G.; et al. A large and persistent carbon sink in the world’s forests. Science 2011, 333, 988–993. [Google Scholar] [CrossRef] [PubMed] [Green Version]
  3. Mattson, K.G.; Zhang, J.W. Forests in the northern Sierra Nevada of California, USA store large amounts of carbon in different patterns. Ecosphere 2019, 10, 1–23. [Google Scholar] [CrossRef] [Green Version]
  4. Bastin, J.-F.; Finegold, Y.; Garcia, C.; Mollicone, D.; Rezende, M.; Routh, D.; Zohner, C.M.; Crowther, T.W. The global tree restoration potential. Science 2019, 365, 76–79. [Google Scholar] [CrossRef]
  5. Domke, G.M.; Oswalt, S.N.; Walters, B.F.; Morin, R.S. Tree planting has the potential to increase carbon sequestration capacity of forests in the United States. Proc. Natl. Acad. Sci. USA 2020, 117, 24649–24651. [Google Scholar] [CrossRef]
  6. Black, T.A.; Harden, J.W. Effect of timber harvest on soil carbon storage at Blodgett Experimental Forest, California. Can. J. For. Res. 1995, 25, 1385–1396. [Google Scholar] [CrossRef]
  7. Dore, S.; Kolb, T.E.; Montes-Helu, M.; Eckert, S.E.; Sullivan, B.W.; Hungate, B.A.; Kaye, J.P.; Hart, S.C.; Koch, G.W.; Finkral, A. Carbon and water fluxes from ponderosa pine forests disturbed by wildfire and thinning. Ecol. Appl. 2010, 20, 663–683. [Google Scholar] [CrossRef]
  8. Jurgensen, M.F.; Larsen, M.J.; Mroz, G.D.; Harvey, A.E. Timber harvesting, soil organic matter, and site productivity. In Proceedings of the 1986 Symposium on the Productivity of Northern Forests Following Biomass Harvesting, Durham, NH, USA, 1–2 May 1986; Smith, C.T., Martin, C.W., Tritton, L.M., Eds.; USDA Forest Service NE Experiment Station NE-GTR-115. [Google Scholar]
  9. Jurgensen, M.F.; Harvey, A.E.; Graham, R.T.; Page-Dumroese, D.S.; Tonn, J.R.; Larsen, M.J.; Jain, T.B. Impacts of timber harvesting on soil organic matter, nitrogen, productivity, and health of inland northwest forests. For. Sci. 1997, 43, 234–251. [Google Scholar]
  10. Nave, L.E. Harvest impacts on soil carbon storage in temperate forests. For. Ecol. Manag. 2010, 259, 857–866. [Google Scholar] [CrossRef]
  11. James, J.; Harrison, R. The effect of harvest on forest soil carbon: A meta-analysis. Forests 2016, 7, 308. [Google Scholar] [CrossRef]
  12. Millar, C.I.; Stephenson, N.L. Temperature forest health in an era of emerging megadisturbance. Science 2015, 349, 823–826. [Google Scholar] [CrossRef] [PubMed]
  13. Seidl, R.; Thom, D.; Kautz, M. Forest disturbances under climate change. Nat. Clim. Chang. 2017, 7, 395–402. [Google Scholar] [CrossRef] [PubMed] [Green Version]
  14. Luyssaert, S.; Schulze, E.; Börner, A.; Knohl, A.; Hessenmöller, D.; Law, B.E.; Ciais, P.; Grace, J. Old-growth forests as global carbon sinks. Nature 2008, 455, 213–215. [Google Scholar] [CrossRef]
  15. Gundersen, P.; Thybring, E.E.; Nord-Larsen, T.; Vesterdal, L.; Nadelhoffer, K.J.; Johannsen, V.K. Old-growth forest carbon sinks overestimated. Nature 2021, 591, E21–E23. [Google Scholar] [CrossRef]
  16. Bentz, B.J.; Régnière, J.; Fettig, C.J.; Hansen, E.M.; Hayes, J.L.; Hicke, J.A.; Kelsey, R.G.; Negrón, J.F.; Seybold, S.J. Climate change and bark beetles of the western United States and Canada: Direct and indirect effects. BioScience 2010, 60, 602–613. [Google Scholar] [CrossRef]
  17. Leverkus, A.B.; Buma, B.; Wagenbrenner, J.; Burton, P.J.; Lingua, E.; Marzano, R.; Thorn, S. Tamm review: Does salvage logging mitigate subsequent forest disturbances? For. Ecol. Manag. 2021, 481, 118721. [Google Scholar] [CrossRef]
  18. Westerling, A.L. Warming and earlier spring increase western U.S. forest wildlife activity. Science 2006, 313, 940–943. [Google Scholar] [CrossRef] [Green Version]
  19. Kulakowski, D.; Seidl, R.; Holeksa, J.; Kuuluvainen, T.; Nagel, T.A.; Panayotov, M.; Svoboda, M.; Thorn, S.; Vacchiano, G.; Whitlock, C.; et al. A walk on the wild side: Disturbance dynamics and the conservation and management of European mountain forest ecosystems. For. Ecol. Manag. 2017, 388, 120–131. [Google Scholar] [CrossRef] [Green Version]
  20. Thom, D.; Seidl, R. Natural disturbance impacts on ecosystem services and biodiversity in temperate and boreal forests. Biol. Rev. Camb. Philos. Soc. 2016, 91, 760–781. [Google Scholar] [CrossRef]
  21. Donato, D.C.; Simard, M.; Romme, W.H.; Harvey, B.J.; Turner, M.G. Evaluating post-outbreak management effects on future fuel profiles and stand structure in bark beetle-impacted forests of Greater Yellowstone. For. Ecol. Manag. 2013, 303, 160–174. [Google Scholar] [CrossRef]
  22. Lindenmayer, D.B.; Burton, P.J.; Franklin, J.F. Salvage Logging and Its Ecological Consequences; Island Press: Washington, DC, USA, 2008. [Google Scholar]
  23. Hood, S.M.; Baker, S.; Sala, A. Fortifying the forest: Thinning and burning increase resistance to a bark beetle outbreak and promote forest resilience. Ecol. Appl. 2016, 26, 1984–2000. [Google Scholar] [CrossRef]
  24. Dhar, A.; Parrott, L.; Hawkins, C.D.B. Aftermath of mountain pine beetle outbreak in British Columbia: Stand dynamics, management response and ecosystem resilience. Forests 2016, 7, 171. [Google Scholar] [CrossRef] [Green Version]
  25. Leverkus, A.B.; Lindenmayer, D.B.; Thorn, S.; Gustafsson, L. Salvage logging in the world’s forests: Interactions between natural disturbance and logging need recognition. Glob. Ecol. Biogeogr. 2018, 27, 1140–1154. [Google Scholar] [CrossRef]
  26. James, J.N.; Page-Dumroese, D.S.; Busse, M.; Palik, B.J.; Zhang, J.; Eaton, B.; Slesak, R.A.; Tirocke, J.; Kwon, H. Effects of forest harvesting and biomass removal on soil carbon and nitrogen: Two complementary meta-analyses. For. Ecol. Manag. 2021, 485, 118935. [Google Scholar] [CrossRef]
  27. Uzoh, F.; Skinner, C. Effects of creating two forest structures and using prescribed fire on coarse woody debris in northeastern California, USA. Fire Ecol. 2009, 5, 1–13. [Google Scholar] [CrossRef]
  28. Vanderwel, M.C.; Thorpe, H.; Shuter, J.L.; Caspersen, J.P.; Thomas, S.C. Contrasting downed woody debris dynamics in managed and unmanaged northern hardwood stands. Can. J. For. Res. 2008, 38, 2850–2861. [Google Scholar] [CrossRef] [Green Version]
  29. Duvall, M.D.; Grigal, D.F. Effects of timber harvesting on coarse woody debris in red pine forets across the Great Lakes states, U.S.A. J. For. Res. 1999, 29, 1926–1934. [Google Scholar]
  30. Kirschbaum, M.U.F. Will changes in soil organic carbon act as a positive or negative feedback on global warming? Biogeochemistry 2000, 48, 21–51. [Google Scholar] [CrossRef]
  31. Eaton, E.B. Insect-Caused Mortality in Relation to Methods of Cutting in Ponderosa Pine in the Blacks Mountain Experimental Forest; USDA Forest Service Technical Paper PSW-43; Pacific Southwest Forest and Range Experiment Station: Berkeley, CA, USA, 1959; 33p.
  32. Hallin, W.E. The Application of Unit Area Control in the Management of Ponderosa-Jeffrey Pine at Blacks Mountain Experimental Forest; USDA Technical Bulletin No. 1191; USDA: Washington, DC, USA, 1959; 96p.
  33. Dolph, K.L.; Mori, S.R.; Oliver, W.W. Long-term response of old-growth stands to varying levels of partial cutting in the eastside pine type. West. J. Appl. For. 1995, 10, 101–108. [Google Scholar] [CrossRef]
  34. Busse, M.; Jurgensen, M.F.; Page-Dumroese, D.S.; Powers, R.F. Contribution of actinorhizal shrubs to site fertility in a Northern California mixed pine forest. For. Ecol. Manag. 2007, 244, 68–75. [Google Scholar] [CrossRef]
  35. Oliver, W.W. Ecological Research at the Blacks Mountain Experimental Forest in Northeastern California; USDA Forest Service General Technical Report PSW GTR-179; Pacific Southwest Research Station: Albany, CA, USA, 2000; 66p.
  36. Maser, C.; Anderson, R.; Cromack, K.; Williams, J.T.; Martin, R.G. Dead and down woody material. In Wildlife Habitats in Managed Forests the Blue Mountains of Oregon and Washington; Agriculture Handbook No. 553; Thomas, J.W., Ed.; U.S. Department of Agriculture, Forest Service: Washington, DC, USA, 1979; 512p.
  37. Powers, E.M.; Marshall, J.D.; Zhang, J.W.; Wei, L. Post-fire management regimes affect carbon sequestration and storage in a Sierra Nevada mixed conifer forest. For. Ecol. Manag. 2013, 291, 268–277. [Google Scholar] [CrossRef]
  38. Zhang, J.W.; Ritchie, M.W.; Oliver, W.W. Vegetation responses to stand structure and prescribed fire in an interior ponderosa pine ecosystem. Can. J. For. Res. 2008, 38, 909–918. [Google Scholar] [CrossRef] [Green Version]
  39. Burrill, E.A.; Wilson, A.M.; Turner, J.A.; Pugh, S.A.; Menlove, J.; Christensen, G.; Conklin, B.L.; David, W. The Forest Inventory and Analysis Database: Database Description and User Guide for Phase 2 (Version 7.0.1); U.S. Department of Agriculture, Forest Service: Washington, DC, USA, 2018; 588p.
  40. Brown, J.K. Handbook for Inventorying Downed Woody Material; USDA Forest Service General Technical Report INT-16, Intermountain Research Station: Ogden, UT, USA, 1974. [Google Scholar]
  41. Cowling, E.B. Comparative Biochemistry of the Decay of Sweetgum Sapwood by White-Rot and Brown-Rot Fungi; Technical Bulletin No. 1258; U.S. Department of Agriculture: Washington, DC, USA, 1961; p. 79.
  42. Zhang, J.W.; Ritchie, M.W.; Maguire, D.A.; Oliver, W.W. Thinning ponderosa pine (Pinus ponderosa) stands reduces mortality while maintaining stand productivity. Can. J. For. Res. 2013, 43, 311–320. [Google Scholar] [CrossRef] [Green Version]
  43. Jurgensen, M.F.; Larsen, M.J.; Harvey, A.E. A Soil Sampler for Steep, Rocky Slopes; Research Note INT-RN-217; USDA Forest Service, Intermountain Forest and Range Experiment Station: Ogden, UT, USA, 1977; 5p.
  44. Larsen, M.J.; Harvey, A.E.; Jurgensen, M.F. Residue decay processes and associated environmental functions in northern Rocky Mountain forests. In Proceeding Environmental Consequences of Timber Harvesting in Rocky Mountain Forests; Technical Report INT-90; Intermountain Forest and Range Experimental Station, USDA Forest Service: Ogden, UT, USA, 1980; pp. 157–174. [Google Scholar]
  45. Triska, F.J.; Cromack, K., Jr. The role of woody debris in forests and streams. In Forests: Fresh Perspectives from Ecosystem Analysis; Waring, R.H., Ed.; Oregon State University Press: Corvallis, OR, USA, 1979; pp. 171–190. [Google Scholar]
  46. Page-Dumroese, D.S.; Jurgensen, M.F.; Miller, C.A.; Pickens, J.B.; Tirocke, J.M. Wildfire alters belowground and surface wood decomposition on two national forests in Montana, USA. Int. J. Wildland Fire 2019, 28, 456–469. [Google Scholar] [CrossRef]
  47. Page-Dumroese, D.S.; Brown, R.E.; Jurgensen, M.F.; Mroz, G.D. Comparison of methods for determining bulk densities of rocky forest soils. Soil Sci. Soc. Am. J. 1999, 63, 379–383. [Google Scholar] [CrossRef]
  48. Harrison, R.B.; Adams, A.B.; Licata, C.; Flaming, B.; Wagoner, G.L.; Carpenter, P.; Vance, E.D. Quantifying deep-soil and coarse-soil fractions. Soil Sci. Soc. Am. J. 2003, 67, 1602–1606. [Google Scholar] [CrossRef]
  49. Whitney, N.; Zabowski, D. Total soil nitrogen in the coarse fraction and at depth. Soil Sci. Soc. Am. J. 2004, 68, 612–619. [Google Scholar] [CrossRef]
  50. Van Soest, P.J. Use of Detergents in the Analysis of Fibrous Feeds. II. A Rapid Method for the Determination of Fiber and Lignin. J. AOAC Int. 1963, 46, 829–835. [Google Scholar] [CrossRef]
  51. SAS Institute Inc. SAS User’s Guide; SAS Institute Inc.: Cary, NC, USA, 2012. [Google Scholar]
  52. Page-Dumroese, D.S. Soil physical property changes at the North American Long-Term Soil Productivity study sites: 1 and 5 years after compaction. Can. J. For. Res. 2006, 36, 551–564. [Google Scholar] [CrossRef]
  53. Han, Y.; Zhang, J.; Mattson, K.G.; Zhang, W.; Weber, T.A. Sample Sizes to Control Error Estimates in Determining Soil Bulk Density in California Forest Soils. Soil Sci. Soc. Am. J. 2016, 80, 756–764. [Google Scholar] [CrossRef]
  54. Wang, W.; Page-Dumroese, D.; Jurgensen, M.; Tirocke, J.; Liu, Y. Effect of forest thinning and wood quality on the short-term wood decomposition rate in a Pinus tabuliformis plantation. J. Plant Res. 2018, 131, 897–905. [Google Scholar] [CrossRef]
  55. Magnússon, R.Í.; Tietema, A.; Cornelissen, J.H.C.; Hefting, M.M.; Kalbitz, K. Tamm Review: Sequestration of carbon from coarse woody debris in forest soils. For. Ecol. Manag. 2016, 377, 1–15. [Google Scholar] [CrossRef]
  56. Law, B.E.; Sun, O.J.; Campbell, J.; Van Tuyl, S.; Thornton, P.E. Changes in carbon storage and fluxes in a chronosequence of ponderosa pine. Glob. Chang. Biol. 2003, 9, 510–524. [Google Scholar] [CrossRef]
  57. Law, B.E. Carbon storage and fluxes in ponderosa pine forests at different developmental stages. Glob. Chang. Biol. 2001, 7, 755–777. [Google Scholar] [CrossRef]
  58. Smithwick, E.A.H.; Harmon, M.E.; Remillard, S.M.; Acker, S.A.; Franklin, J.F. Potential upper bounds of carbon stores in forests of the pacific northwest. Ecol. Appl. 2002, 12, 1303–1317. [Google Scholar] [CrossRef]
  59. Agee, J.K. Fire as a coarse filter for snags and logs. In Proceedings of the Symposium on the Ecology and Management of Dead Wood in Western Forests, Reno, Nevada, 2–4 November 1999; Laudenslayer, W.F., Jr., Shea, P.J., Valentine, B.E., Weatherspoon, C.P., Lisle, T.E., Eds.; General Technical Report PSW-GTR-181. U.S. Department of Agriculture, Forest Service, Pacific Southwest Research Station: Albany, CA, USA, 2002; pp. 359–368. [Google Scholar]
  60. Harmon, M.E.; Cromack, K., Jr.; Smith, B.G. Coarse woody debris in mixed-conifer forests, Sequoia National Park, California. Can. J. For. Res. 1987, 17, 1265–1272. [Google Scholar] [CrossRef]
  61. Wagener, W.W.; Offord, H.R. Logging Slash: Its Breakdown and Decay at Two Forests in Northern California; Research Paper PSW-RP-083; U.S. Department of Agriculture, Forest Service, Pacific Southwest Research Station: Albany, CA, USA, 1972; 20p.
  62. Herrmann, S.; Prescott, C.E. Mass loss and nutrient dynamics of coarse woody debris in three Rocky Mountain coniferous forests: 21 year results. Can. J. For. Res. 2008, 38, 125–132. [Google Scholar] [CrossRef]
  63. Busse, M.D. Downed bole-wood decomposition in lodgepole pine forests of central oregon. Soil Sci. Soc. Am. J. 1994, 58, 221–227. [Google Scholar] [CrossRef]
  64. Brodie, L.C.; Palmer, M. California’s Forest Resources, 2006–2015: Ten-Year Forest Inventory and Analysis Report; General Technial Report PNW-GTR-983; U.S. Department of Agriculture, Forest Service, Pacific Northwest Research Station: Portland, OR, USA, 2020; 60p.
  65. Herrero, C.; Krankina, O.; Monleon, V.J.; Bravo, F. Amount and distribution of coarse woody debris in pine ecosystems of north-western Spain, Russia and the United States. Iforest—Biogeosci. For. 2014, 7, 53–60. [Google Scholar] [CrossRef] [Green Version]
  66. Yanai, R.D.; Currie, W.S.; Goodale, C.L. Soil carbon dynamics after forest harvest: An ecosystem paradigm reconsidered. Ecosystems 2003, 6, 197–212. [Google Scholar] [CrossRef]
  67. Busse, M.D.; Sanchez, F.G.; Ratcliff, A.W.; Butnor, J.R.; Carter, E.A.; Powers, R.F. Soil carbon sequestration and changes in fungal and bacterial biomass following incorporation of forest residues. Soil Biol. Biochem. 2009, 41, 220–227. [Google Scholar] [CrossRef] [Green Version]
  68. Harmon, M.E.; Franklin, J.F.; Swanson, F.J. Ecology of coarse woody debris in temperate ecosystems. Adv. Ecol. Res. 1986, 15, 133–302. [Google Scholar]
  69. Forrester, J.A.; Mladenoff, D.J.; Gower, S.T.; Stoffel, J.L. Interactions of temperature and moisture with respiration from coarse woody debris in experimental forest canopy gaps. For. Ecol. Manag. 2012, 265, 124–132. [Google Scholar] [CrossRef]
  70. Lambert, R.L.; Lang, G.E.; Reiners, W.A. Loss of mass and chemical change in decaying boles of a subalpine balsam fir forest. Ecology 1980, 61, 1460–1473. [Google Scholar] [CrossRef]
  71. Mattson, K.G.; Swank, W.T. Wood decomposition following clearcutting at Coweeta Hydrologic Laboratory. In Long-Term Response of a Forest Watershed Ecosystem; Swank, W.T., Webster, J.R., Eds.; Oxford University Press: Oxford, UK, 2014; Chapter 7; pp. 118–133. [Google Scholar]
  72. Lal, R. Carbon sequestration. Phil. Trans. R. Soc. B 2008, 363, 815–830. [Google Scholar] [CrossRef] [PubMed]
  73. Lewis, S.L.; Wheeler, C.E.; Mitchard, E.T.A.; Koch, A. Restoring natural forests is the best way to remove atmospheric carbon. Nature 2019, 568, 25–28. [Google Scholar] [CrossRef] [Green Version]
  74. Ansley, J.-A.S.; Battles, J.J. Forest composition, structure, and change in an old-growth mixed conifer forest in the Northern Sierra Nevada. J. Torrey Bot. Soc. 1998, 125, 297–308. [Google Scholar] [CrossRef]
  75. Stephens, S.L.; Lydersen, J.M.; Collins, B.M.; Fry, D.L.; Meyer, M.D. Historical and current landscape-scale ponderosa pine and mixed conifer forest structure in the Southern Sierra Nevada. Ecosphere 2015, 6, 79. [Google Scholar] [CrossRef] [Green Version]
  76. Skinner, C.N. Influence of fire on the dynamics of dead woody material in forests of California and southwestern Oregon. In Proceedings of the Symposium on the Ecology and Management of Dead Wood in Western Forests, Reno, Nevada, 2–4 November 1999; Laudenslayer, W.F., Jr., Shea, P.J., Valentine, B.E., Weatherspoon, C.P., Lisle, T.E., Eds.; General Technical Report PSW-GTR-181. USDA Forest Service, Pacific Southwest Research Station: Albany, CA, USA, 2002; pp. 445–454, 949p. [Google Scholar]
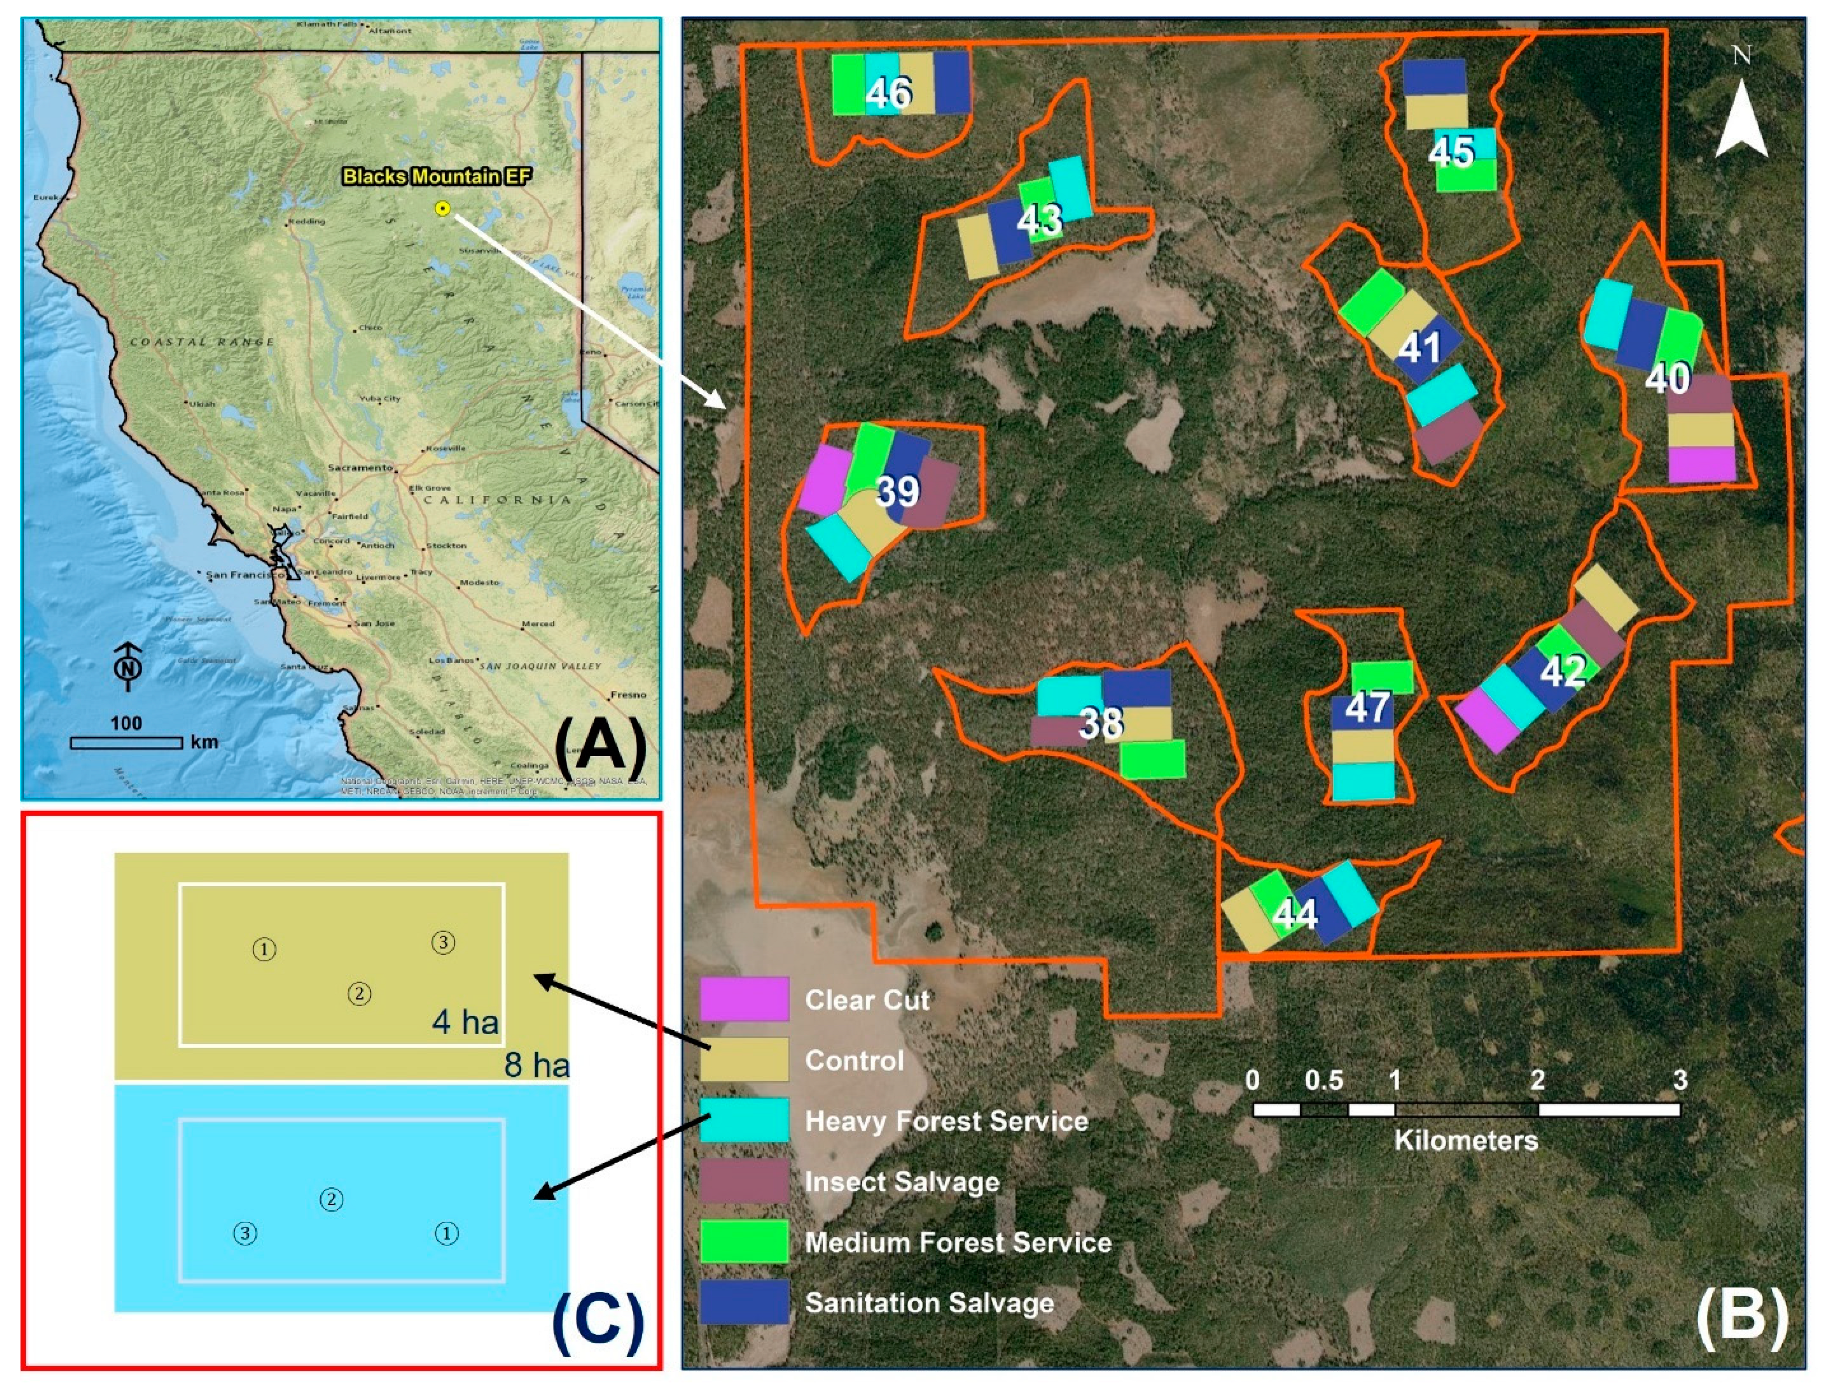
Figure 1. (A) Location of Blacks Mountain Experimental Forest in northeastern California. (B) Perimeter of the experimental forest and numbered blocks with treatment plots established in 1938 to examine methods of cutting after mortality from western pine beetle infestation in 1934–1936. (C) Two plots (uncut control and heavy cut) and our inserted three subplots established in 1992 in blocks 38, 39, and 43.
Forests 14 00623 g001
Figure 2. Stand characteristics at Blacks Mountain Experimental Forest. (A) The two-storied layer of the canopy in the uncut control. (B) Example of large coarse woody debris chosen as one cover type for forest floor and soil sample collections. (C) Three other ground cover types chosen for forest floor and soils collections were prostrate ceanothus (CEPR), bitterbrush (PUTR), and pine needle and herbaceous (OPEN).
Forests 14 00623 g002
Figure 3. Long-term average yearly temperature and precipitation at Blacks Mountain Experimental Forest from 1930 to 2017. Data were generated from the PRISM climate model (https://prism.oregonstate.edu/; accessed on 10 October 2022) and calibrated with three surrounding RAWS stations (Bogard, Grasshopper, and Ladder Butte).
Forests 14 00623 g003
Figure 4. Overstory tree C stock (A), basal area (B), and trees/hectare (C) for large trees (dbh > 29.2 cm) and pole-size trees (dbh 9.1 29.2 cm) in the uncut control and harvest in 1990–1991, approximately 50 years after harvest at Blacks Mountain Experimental Forest. p-values are for testing the treatment effect for all trees. Different letters between treatments for each tree category (large or pole-size) indicate a significant difference (α = 0.10).
Forests 14 00623 g004
Figure 5. Carbon (A), nitrogen (B), phosphorus (C), potassium (D), calcium (E), and magnesium (F) pools in the three decay states (intact, brown rot, and white rot) of CWD in the uncut control and the harvest at Blacks Mountain Experimental Forest. p-values are for testing the overall treatment effect. Different letters between treatments for both intact and brown rot decay types indicate a significant difference.
Forests 14 00623 g005
Figure 6. Soil C (A,B) and N (C,D) contents beneath coarse woody debris (CWD), Ceonothus prostratus (CEPR), Purshia tridentata (PUTR), and OPEN in uncut control and harvest at Blacks Mountain Experimental Forest.
Forests 14 00623 g006
Figure 7. Ectomycorrhizal root tips (A,B) and fine root biomass (C,D) in the top 30 cm of soil under four ground covers in uncut control and harvest at Blacks Mountain Experimental Forest across five sampling seasons.
Forests 14 00623 g007
Figure 8. Stand level carbon pools in the uncut control and the harvest 3/4 of stand volumes in 1938–1943 in pine forests at Blacks Mountain Experimental Forest in northeastern California. p-values are statistical probabilities for testing the harvest effect. * refers to that CWD includes standing snags.
Forests 14 00623 g008
Table 1. Average lignin amounts (%) in the uncut control and harvest for intact, brown rot, and white rot decay types sampled from each log.
TreatmentDecay TypeLignin (%)
Uncut controlIntact47.5 (2.0)
White rot43.4 (2.1)
Brown rot73.6 (4.3)
HarvestIntact46.0 (2.0)
White rot44.6 (2.1)
Brown rot67.2 (4.4)
Table 2. Source of variation, degree of freedom, and probability (Pr > F) for testing fixed effects of treatment (uncut control versus harvest), ground cover type (CWD, CEPR, PUTR, and OPEN), sampling season (five times), and their interactions on soil C and N as well as fine root and ectomycorrhizal tips at Blacks Mountain Experimental Forest.
Source of VariationNum dfDen dfSoil CSoil NFine RootsEcto-mycorrhizae
Treatment (TRT)140.9610.7810.6900.523
Ground Cover (GC)3253<0.001<0.001<0.0010.117
TRT * GC32530.8880.3530.9270.486
Sampling season (SS)4253<0.001<0.001<0.0010.114
TRT * SS42530.9610.8080.3400.601
GC * SS122530.2850.9880.1260.630
TRT * GC * SS122531.0000.5810.8200.867
Disclaimer/Publisher’s Note: The statements, opinions and data contained in all publications are solely those of the individual author(s) and contributor(s) and not of MDPI and/or the editor(s). MDPI and/or the editor(s) disclaim responsibility for any injury to people or property resulting from any ideas, methods, instructions or products referred to in the content.