Abstract
Tea plant cultivar identification is normally achieved manually or by spectroscopic, chromatographic, and other methods that are time-consuming and often inaccurate. In this paper, a method for the identification of three tea cultivars with similar leaf morphology is proposed using transfer learning by five pre-trained models: EfficientNet-B0, MobileNetV2, MobileNetV3, MobileViT-S, and ShuffleNetV2. The results showed that the best test accuracy percentages for EfficientNet-B0, MobileNetV2, MobileNetV3, MobileViT-S, and ShuffleNetV2 were 98.33, 99.67, 99.33, 98.67, and 99.00%, respectively. The most lightweight model was ShuffleNetV2, and the fastest combination was ShuffleNetV2 with 112 × 112 image resolution. Considering accuracy, the number of parameters, and floating point operations (FLOPs), MobileNetV2 was not only the most accurate model, but also both lightweight and fast. The present research could benefit both farmers and consumers via identifying tea cultivars without destructive techniques, a factor that would reduce the adulteration of commodity tea.
1. Introduction
Tea derived from the young shoots of Camellia sinensis is one of the world’s most popular non-alcoholic aromatic beverages, and tea has demonstrated benefits for human health. The quality, taste, and unique health benefits of tea are due to the original tea plant cultivars and the drying, fermentation, and other processes used in tea production. Fast and accurate identification of tea plant cultivars is a primary and critical step in tea plant breeding.
Many previous studies have focused on the identification of tea cultivars by chromatographic, spectroscopic, and other techniques [1], including inductively coupled plasma-atomic emission spectrometry (ICP-AES) [2,3], high performance liquid chromatography (HPLC) [4], headspace solid phase microextraction/gas chromatograph-mass spectrometry (HS-SPME/GC-MS) [5], ultraviolet–visible spectroscopy (UV–Vis spectra) [6], laser-induced breakdown spectroscopy (LIBS) [7], and mid-infrared diffuse reflectance spectroscopy [8]. The main disadvantages of these methods are their use of expensive equipment and complicated operation; they are mainly used for commodity tea. In addition, there is no way to use these methods for identification without damaging the plant itself.
Based on the above concerns, identifying tea plant cultivars using computer vision methods has made significant advances in the past few years. Tea images were obtained by computer vision systems, and linear discriminant analysis (LDA) was applied to build an identification model with 12 color feature variables and 12 texture feature variables (100% for the training set and 98.33% for the prediction set) [9]. Hyperspectral imaging technology [10] was used to classify different tea cultivars using bootstrapping soft shrinkage (BOSS) and light gradient boosting machine (LightGBM) models (100% for the training set and 97.33% for the prediction set) [11]. To improve the accuracy of laser-induced breakdown spectroscopy (LIBS), a genetic algorithm-support vector machine (GA-SVM) model was constructed for different tea cultivars; the correct classification rate was 99.73% in the training set, while the accuracy was 98.40% in the test set [12]. Although these methods can achieve high accuracy, the process of acquiring characteristic parameters is complicated, especially during non-destructive identification of plants.
Deep learning methods based on deep neural networks (DNNs), especially convolutional neural networks (CNNs), have been successfully applied in areas [13,14] such as image classification. These methods have already been used to detect diseased tea leaves. A previous study developed a deep CNN called LeNet that could identify tea plant diseases from leaf image sets with high accuracy (84–94%) [15], and several other models with high accuracy have also been constructed [16,17,18,19]. Deep learning methods have also been used in the detection of tea buds. Researchers implemented an approach that combined the rapid detection ability of YOLOv3 and the high-accuracy classification ability of DenseNet201 to detect tea buds (95.71% detection accuracy for side-shot tea buds) [20]. The image recognition of different commodity tea cultivars also uses deep learning methods. Researchers constructed a CNN model with four convolution layers and three fully connected layers to learn the classification of commodity tea images, and the correct rate reached up to 96% [21]. Other researchers have found that the classification accuracy could reach as high as 97.5% using fluorescence images [22].
At present, there is still little research on the application of neural network recognition in the identification of tea cultivars. Traditional methods depend on human sensory evaluation, a process that is idiosyncratic and time consuming. Smartphones in particular offer a novel approach to identifying tea cultivars due to their computing power, high-resolution displays, and extensive built-in sets of accessories [23]. Developing an effective system for the precise and non-destructive identification of tea plant cultivars is therefore possible.
In this study, three tea plant cultivars—“Zi 1”, “Zi 2”, and “Zi 3”—with similar leaf morphologies and different metabolite contents were used as research materials, and five DNN models—EfficientNet-B0, MobileNetV3, MobileNetV2, MobileViT-S, and ShuffleNetV2—were used to select the best models for identifying tea cultivars.
2. Materials and Methods
2.1. Plant Material
Three purple-leaf tea cultivars from the same parental origin were selected for this study. All materials in the experiment were planted in the fields of Daqinggu, Hangzhou, China (30°20′ N, 120°07′ E). The tea plants were fertilized and watered using the same standards, and shoots at the stage of one bud and two leaves (the raw material used to produce high-quality teas) were collected in March 2021.
2.2. Observation of Leaf Morphological Appearance
At the same sampling time in the spring of 2021, the leaf properties of three tea cultivars were investigated in the tea garden. Fresh leaves were collected at the one bud and two leaf stage. The length and width of each leaf were measured, and at least 10 individual plants were sampled for each cultivar.
2.3. Determination of Amino Acids, Polyphenols, Caffeine, and Catechins
Nutrient metabolite contents influence the taste and medicinal properties of tea. The amino acid (AA), polyphenol (PP), catechin (CAT), and caffeine (CAF) contents were determined according to previous methods [24]. All analyses were performed with three replications for each tea sample taken from a 20 m2 planting area for each cultivar. All standards were purchased from Sigma Chemicals (St. Louis, MO, USA).
2.4. Collecting and Preprocessing Images
The images were collected during the same growth period (the one bud and two leaf stage) in the spring of 2021. Tea leaf images of “Zi 1”, “Zi 2”, and “Zi 3” were prepared by taking 600 photos of each type from a 20 m2 planting area for each cultivar during one week, including morning and afternoon samples; an example image is shown in Figure 1. The raw images were taken using an iPhone 12 mini with 3024 × 4032 resolution that used almost 4 MB of storage. Offline preprocessing was performed before training to reduce the occupied storage space, i.e., cropping the central square part of the image according to the short edge of each tea leaf image and resizing the image to 672 × 672 resolution using bilinear interpolation. Then, for each category, the samples were split into training and testing sets in a ratio of 5:1, i.e., 500 samples for training and 100 samples for testing. Based on these steps, a training set of 1500 samples and a test set of 300 samples were prepared.
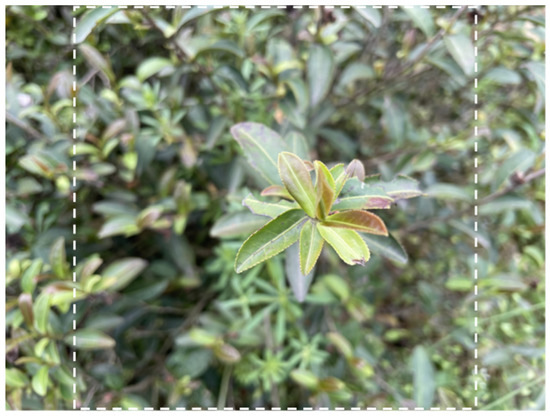
Figure 1.
Example of a tea image (the white dashed square shows the center cropped part of the raw image).
After preparing the training and test sets using offline preprocessing, the online preprocessing for training and testing progress was performed as follows:
During training for the training set, a 448 × 448 area was randomly cropped from the image with 672 × 672 resolution. The cropped image was resized to a fixed resolution (112 × 112, 224 × 224, or 336 × 336) using bilinear interpolation. Then, the image pixel value was rescaled from (0, 255) to (−1, 1) as a fit for DNN models. Finally, the samples were shuffled and split into batches (eight samples per batch), and the model was trained with the mini-batch stochastic gradient descent (SGD) optimization method.
During testing, for the test set the central 448 × 448 area was cropped from the image with 672 × 672 resolution. The image was resized to a fixed resolution (112 × 112, 224 × 224, or 336 × 336) using bilinear interpolation. Then, the image pixel value was rescaled from (0, 255) to (−1, 1). Finally, the images were split into batches (eight samples per batch), and the model was evaluated with each batch.
Figure 2 shows a sample image in the dataset that was preprocessed offline, followed by four randomly cropped images for training and one centrally cropped image for testing that were preprocessed online. The random cropping was a data augmentation method widely used in deep learning to enrich training samples and mitigate overfitting. The same image was used here for training and testing so that the results of these two forms of preprocessing could be compared. In actual practice, the samples for the training set and testing did not overlap.

Figure 2.
A sample image in the dataset to show the difference of image preprocessing during training and testing (the sample image followed by four randomly cropped images fed into the model during training and one centrally cropped image fed into the model during testing).
2.5. DNN Model Training and Testing
The experiment was conducted on a Baidu Machine Learning CodeLab Notebook, the details of which are shown in Table 1.

Table 1.
Details of the Baidu Machine Learning CodeLab Notebook.
The lightweight DNN models used in our experiment were EfficientNet-B0, MobileNetV2, MobileNetV3, MobileViT-S, and ShuffleNetV2. Those models were open source and are available on platforms such as TorchVision and PyTorch Image Models. Pre-trained weights (i.e., trainable parameters) trained on the ILSVRC2012 dataset (a famous subset of the ImageNet dataset) that comprises 1000 categories were downloaded. These models were then modified and trained on our tea leaf dataset for transfer learning.
In the training part, each model was modified to replace the old head for 1000 categories with a new head for 3 categories. The weights of all model layers except the head layers were frozen so that the training process only optimized the weights of the head layers. Some neurons dropped out of the head layer to mitigate overfitting, except for ShuffleNetV2 as it was too small (lightweight) to overfit. The Adam optimizer, a famous and effective optimization method, was used to train the models. During training, the model was validated on the test set for each epoch and the model weights with the best accuracy were saved. The detailed hyperparameters for training are shown in Table 2.
Table 2.
Detailed hyperparameters for training.
After training, each model–resolution combination was evaluated in terms of the highest accuracy and number of floating point operations (FLOPs), and the number of parameters was calculated.
In the testing section, the model weight with the best accuracy was loaded and was again evaluated on the test set to obtain the final best accuracy and the confusion matrix. The accuracy was calculated as follows:
where the abbreviations are as follows:
TP, True Positive. For a category, this meant that the sample belonged to this category (positive), and the prediction was also positive.
TN, True Negative. For a category, this meant that the sample did not belong to this category (negative), and the prediction was also negative.
FP, False Positive. For a category, this meant that the sample did not belong to this category (negative), but the prediction was positive.
FN, False Negative. For a category, this meant that the sample belonged to this category (positive), but the prediction was negative.
The structure from start to finish used in our experiment is shown in Figure 3.
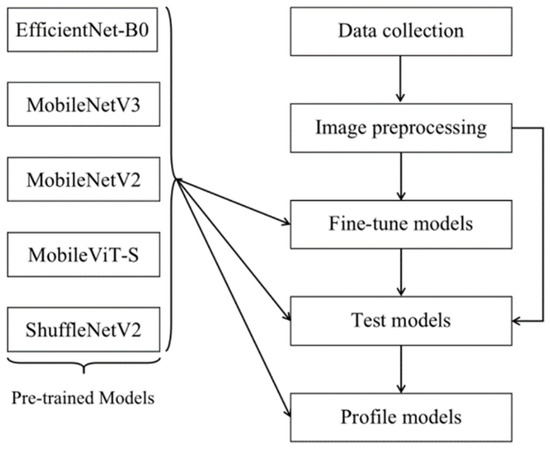
Figure 3.
A structure of the proposed methodology.
2.6. Data Analysis
The data are presented as the mean and standard deviation (SD) of replicate determinations. A one-way analysis of variance (ANOVA) was used for comparison of the three means. Probability values of p < 0.05 were considered statistically significant. All statistical analyses were completed using SPSS software (version 25.0, IBM SPSS Statistics, Chicago, IL, USA).
3. Results
3.1. Leaf Morphology and Metabolite Content of Three Tea Cultivars
Commodity tea-making materials are often taken from leaves at the stage of one bud and two leaves. Different sizes of leaves in three purple-leaf tea cultivars were observed. The leaf sizes of the three cultivars were measured, and the length of the leaves was between 3.0 and 7.0 cm, while the width was between 1.5 and 3.4 cm (Figure 4). The average length of “Zi 1” was significantly higher than those of “Zi 2” and “Zi 3,” while the width values did not show significant differences. Although “Zi 1” was slightly longer, the difference was not distinguishable from the naked eye due to its relatively large fluctuation value. In addition, the leaf morphology of all three cultivars was elliptical and did not differ in outline appearance, as each type came from the same parent population. Therefore, it was difficult to classify the cultivars manually using leaf morphology.
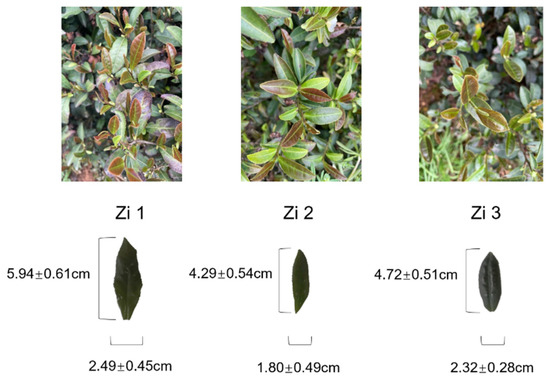
Figure 4.
The leaf morphology of three purple-leaf tea cultivars.
Although similar in leaf morphology, there were significant differences in the nutrient metabolite contents of the three purple-leaf tea cultivars. Caffeine (CAF), polyphenols (PP), and amino acids (AA) are closely related to the tea quality and could possibly be used to identify different tea cultivars. Among the three purple-leaf cultivars, the AA content of “Zi 2” was higher than those of “Zi 1” and “Zi 3”, and other nutrient contents were significantly lower than in “Zi 1” and “Zi 3.” The PP and CAF contents were highest in “Zi 3,” while “Zi 1” had the highest CAT content (Table 3). The phenol to ammonia ratio (P/A) is another main factor that determines the taste of tea. The P/A contents of three tea cultivars had the following pattern: “Zi 3” > “Zi 1” > “Zi 2” (Table 3).
Table 3.
Nutrient metabolite content of three purple-leaf tea cultivars (mean ± SD) *.
Among the polyphenols, the total catechins (CAT) were the main components and were divided into simple catechins (SCAT, GC + EGC + C + EC) and ester-type catechins (ETCAT, EGCG + GCG + ECG + CG). In different tea cultivars, most catechins differed significantly in content and could therefore be used for classification, except for C, ECG, and CG (Table 4).
Table 4.
Catechin contents of three purple-leaf tea cultivars (mean ± SD) *.
In this study, three tea cultivars from the same parental origin, “Longjing” named “Zi 1”, “Zi 2”, and “Zi 3” were used. Although they had similar genetic backgrounds and morphological leaf characteristics, the metabolites including catechins, polyphenols, and amino acids that determine nutritional and therapeutic benefits differed among the three cultivars. It is thus important to establish a simple and feasible identification method for such cultivars.
3.2. Five DNN Models to Identify Three Tea Cultivars
3.2.1. Effect of Image Resolution Size on Identification
To study the effect of image resolution size on recognition results, the images were compressed to 112 × 112, 224 × 224, and 336×336 resolution, and each model was trained separately on each resolution. Among all the models, MobileViT-S had the highest accuracy at 224 × 224; the highest accuracy of the others was at 336 × 336. All models had low accuracy at 112 × 112. However, among all models, the accuracy was similar for 224 × 224 and 336 × 336, with a significant improvement compared with that for 112 × 112 (Figure 5).
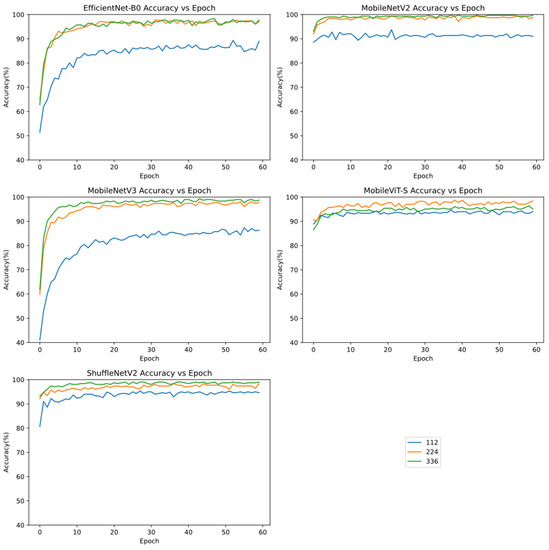
Figure 5.
Accuracy curves during the training progress of five models, EfficientNet-B0, MobileNetV2, MobileNetV3, MobileViT-S, and ShuffleNetV2, at resolutions of 112 × 112, 224 × 224 and 336 × 336.
All five models at the three resolutions showed excellent results in the identification of the three tea cultivars, each with an accuracy of almost above 90%. As the number of batches increased, the accuracy of all models increased gradually with slight oscillation, and the accuracy curves reached a plateau, indicating convergence in deep learning.
3.2.2. Effect of Different Models on Identification
ShuffleNetV2 had the highest accuracy (95.33%) at the 112 × 112 resolution. MobileNetV2 had the highest accuracy (99.33%) at the 224 × 224 resolution and at the 336 × 336 resolution (99.67%). Among the models, MobileNetV2 generally had the best accuracy (Figure 6).
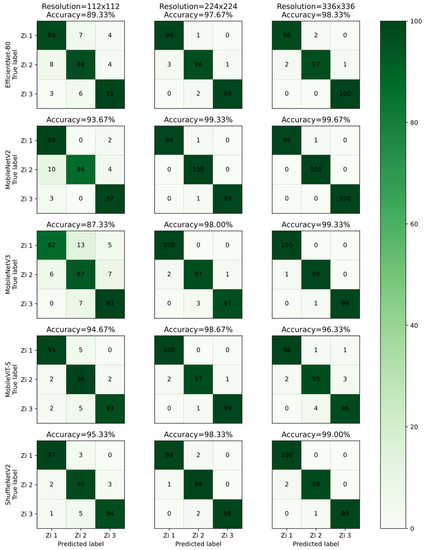
Figure 6.
Confusion matrix for the five models EfficientNet-B0, MobileNetV2, MobileNetV3, MobileViT-S, and ShuffleNetV2 at resolutions of 112 × 112 and 224 × 224. The number on the diagonal indicates how many predictions were TP, while others indicate wrong predictions. The larger the diagonal number, the darker the color and the more accurate the model.
Different models had specific preferences for the identification of different cultivars at different resolutions (Figure 6). For all models, the correct identification rate for “Zi 2” was the highest at the 224 × 224 resolution, and the highest rate for “Zi 3” was at the 336 × 336 resolution. For “Zi 1,” the situation was more complicated. Among the three models Efficientnet-B0, MobileNetV2, and ShufflenetV2, the correct rate was highest when the resolution was 336 × 336, while in models MobileNetV3 and MobileViT-S the correct rate was highest when the resolution was 224 × 224. Although there were subtle differences, the models all performed well at all three resolutions and had better performance at 224 × 224 and 336 × 336 compared to 112 × 112.
Except for accuracy, different models had different performances with other factors. The floating point operations (FLOPs) were a measure of the calculation speed in the model inference. The lower the number of FLOPs, the faster the model inference. Less FLOPs meant real-time experience when deploying the models on mobile devices; the number of parameters of a model represented the model size in storage, a value of concern for mobile devices. The greater the number of parameters, the larger the storage size. As shown in Figure 7, the models in the left upper corner were the most optimal. MobileNetV2-224 and ShuffleNetV2-224 had low FLOPs and high accuracy. MobileNetV2-336 and ShuffleNetV2-336 had a small number of parameters and high accuracy.
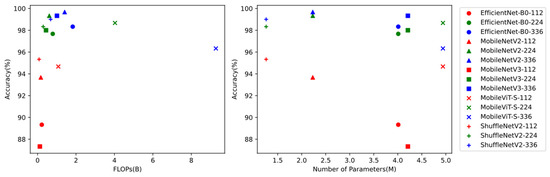
Figure 7.
The performance of five models (EfficientNet-B0, MobileNetV2, MobileNetV3, MobileViT-S, and ShuffleNetV2) at resolutions of 112 × 112, 224 × 224 and 336 × 336. Left: The x-axis shows the FLOPs value in billions (B), and the y-axis shows the model’s test accuracy. Right: The x-axis shows the number of parameters in millions (M), and the y-axis shows the model’s test accuracy.
4. Discussion
4.1. Importance and Necessity of Tea Cultivar Identification Based on Deep Learning
Traditional methods used to identify different tea cultivars are based on morpho-agronomic characteristics such as leaf shape, leaf color, and leaf size [25]. In this study, three purple-leaf tea cultivars with similar appearance and from the same parental population were used as the test subjects. The traditional observation method of distinguishing cultivars via the appearance of the leaf morphology and size at the first bud and second leaf stage is difficult. Such an identification method must be based on large sample measurements, and the number of agronomic parameters involved must be sufficiently large. Data collection required picking the leaves for measurement, entailing a large investment of time and labor. At the same time, based on our experimental data it was difficult to identify cultivars that were closely related and that had a high degree of leaf shape similarity when attempting to use fewer agronomic traits.
Although similar in appearance, there were significant differences in nutrient metabolite contents among the cultivars, a factor that influences the taste and medicinal qualities of the three purple-leaf cultivars. Previous research has shown that a high level of AAs such as theanine (L-glutamate-c-ethylamide, Thea), the main compound responsible for the taste of green tea, is reflective of tea quality [26]. PP is a well-known antioxidant that transfers an electron to stabilize free radicals [27]. CAF also has health benefits such as improvements in physical endurance, cognitive function, alertness and vigilance, mood, and perception of fatigue under low to moderate intake [28]. Total CAT is rapidly and extensively metabolized, emphasizing the importance of demonstrating antioxidant activity in vivo [29]. In addition, the P/A ratio reflects the relationship between mellow taste and astringency, an important index for the suitability of tea production [30]. The differences in these metabolite contents among cultivars give tea cultivars different tastes and health benefits and serve as a guide to the selection of subsequent processing conditions. For these reasons, it is necessary to identify cultivars, and the main disadvantages of identification by nutrient metabolite content are the use of expensive equipment and the requirement of professional operation.
In this paper, five DNN models were compared for the image identification of three purple-leaf tea cultivars. This image identification technology of deep learning as a simple and inexpensive experimental process could achieve accurate and non-destructive identification of tea leaves without picking leaves.
4.2. Comparison of Five DNN Models to Identify Tea Cultivars
The deep learning method has had success in computer vision tasks such as image classification. In this study, the identification of three purple-leaf tea cultivars was proposed using transfer learning of five pre-trained models: EfficientNet-B0, MobileNetV2, MobileNetV3, MobileViT-S, and ShuffleNetV2.
EfficientNet-B0 was proposed by Google Research in 2020. It is the smallest model belonging to a family of models called EfficientNets designed by a neural architecture search. By systematically studying model scaling, those models balance network depth, width, and resolution, leading to state-of-the-art 84.3% top-1 accuracy on ImageNet, while being small and producing rapid inference. EfficientNet also transfers well and has achieved state-of-the-art accuracy on other transfer learning datasets such as CIFAR-100 (91.7%) and Flowers (98.8%) [31]. EfficientNet-B0 has 4.01M parameters and achieved 89.33%, 97.67%, and 98.33% accuracy at resolutions of 112 × 112, 224 × 224, and 336 × 336, respectively, in our experiment.
MobileNetV2 was introduced by Google Inc. (Mountain View, CA, USA) in 2018, and was designed specifically for mobile devices. MobileNetV2 introduced a linear bottleneck and inverted the residual structure on the basis of MobileNetV1 to improve network representation capability [32]. It also uses depth-wise separable convolution to replace common convolution inherited from MobileNetV1; this increases the depth but greatly reduces the amount of computation required. MobileNetV2 achieved 93.67%, 99.33%, and 99.67% accuracy at resolutions of 112 × 112, 224 × 224, and 336 × 336, respectively, in our experiment.
MobileNetV3 was proposed by Google AI and Google Brain in 2019. Researchers used hardware-aware network architecture search (NAS) for a block-wise search and the NetAdapt algorithm for a layer-wise search, and the model was then improved through novel architecture design [33]. MobileNetV3 achieved 87.33%, 98.00%, and 99.33% accuracy at resolutions of 112 × 112, 224 × 224, and 336 × 336, respectively, in our experiment. MobileNetV3 had a lower number of FLOPs than MobileNetV2 at the same resolution, but achieved lower accuracy in our identification task.
MobileViT-S was introduced by Apple Inc. (Cupertino, CA, USA) in 2022. Convolutional neural networks (CNN) use spatial inductive biases to learn representations with fewer parameters but lack global information, and self-attention-based vision transformers (ViTs) learn global representation but have heavy model weights [34]. In our experiment, MobileViT-S achieved 94.67%, 98.67%, and 96.33% accuracy at resolutions of 112 × 112, 224 × 224, and 336 × 336, respectively. This model had average accuracy but a higher number of FLOPs compared to other models.
ShuffleNetV2 was presented in 2019 by Megvii Inc. (Beijing, China) and Tsinghua University. The researchers aimed to design a state-of-the-art model in terms of speed and accuracy tradeoffs. They combined many advanced techniques, including depth-wise separable convolution, channel shuffle, and group convolution [35]. ShuffleNetV2 achieved 95.33%, 98.33%, and 99.00% accuracy at resolutions of 112 × 112, 224 × 224, and 336 × 336, respectively, in our experiment. This model was competitive in terms of accuracy and FLOPs and had the lowest number of parameters compared to the other models.
Generally speaking, MobileNetV2 and ShuffleNetV2 were optimal models considering accuracy, FLOPs, and the number of parameters. MobileNetV2 had the advantage of accuracy, and ShuffleNetV2 had advantages in FLOPs and model size. As accuracy is the most important, we chose MobileNetV2-224 as the best model and resolution for our identification task.
5. Conclusions
The quality, taste, and unique health benefits of commodity tea are due to differences in tea plant cultivars and preparation processes, and the identification of tea cultivars is the primary step in determining the value of tea as a commodity. Tea identification was previously achieved manually or by spectroscopic, chromatographic, or other traditional methods, which are complicated and often inaccurate. In this study, five deep learning models were used to identify three purple-leaf tea cultivars with similar leaf morphological characteristics and different metabolite contents. Over 1800 images of tea leaves from 3 tea cultivars were collected and preprocessed to 3 resolutions: 112 × 112, 224 × 224, and 336 × 336. The number of parameters of these five models was calculated to determine the most lightweight model. The FLOPs of the 15 combinations (5 models × 3 resolutions) were also calculated to determine the fastest model. The experimental results were as follows: (1) The best test accuracy values for EfficientNet-B0, MobileNetV2, MobileNetV3, MobileViT-S, and ShuffleNetV2 were 98.33, 99.67, 99.33, 98.67, and 99.00%, respectively (regardless of the image resolution). (2) Generally, the higher the image resolution, the better the accuracy obtained by the model. (3) The most lightweight model was ShuffleNetV2 (1.26 million parameters), and the fastest combination was ShuffleNetV2 with a 112 × 112 image resolution (0.04 billion FLOPs). (4) Considering accuracy, the number of parameters, and FLOPs, MobileNetV2 not only had the best accuracy, but was also lightweight (2.23 million parameters) and fast (0.3 billion FLOPs). Table 5 showed the summary of the five models. This research could be a great advantage for farmers and customers in identifying tea cultivars and aiming to reduce the adulteration of commodity tea.
Table 5.
Summary of the five models, EfficientNet-B0, MobileNetV2, MobileNetV3, MobileViT-S, and ShuffleNetV2 *.
Author Contributions
Conceptualization, Y.D. and H.H.; methodology, Y.D.; software, Y.D.; validation, Y.D., H.H. and X.W.; formal analysis, X.W.; investigation, H.C.; resources, H.H.; writing, Y.D.; review and editing, X.W.; supervision, Y.Z.; project administration, Y.Z.; funding acquisition, Y.Z. All authors have read and agreed to the published version of the manuscript.
Funding
This research was funded by the Zhejiang Science and Technology Major Program on Agricultural New Varieties of Breeding Tea Plants (2021C02067-4 and 2021C02067-5), the Science and Technology Innovation and Demonstration and Promotion Fund of Hangzhou Academy of Agricultural Sciences (2022HNCT-04), the Key Technology Research and Product Creation for the High Value Utilization of Tea in the Hangzhou Longjing Production Area (202203A06), and the Key Techniques and Innovative Applications of the Inheritance and Protection of Xihu Longjing Tea (2021HN58-1).
Data Availability Statement
The data presented in this study are available on request from the corresponding author. The data are not publicly available due to the lack of application of plant variety rights.
Acknowledgments
The authors would like to acknowledge the following financial support: the Zhejiang Science and Technology Major Program on Agricultural New Varieties of Breeding Tea Plants and Hangzhou Academy of Agricultural Sciences.
Conflicts of Interest
The authors have no conflict of interest.
References
- Ye, N.S. A minireview of analytical methods for the geographical origin analysis of teas (Camellia sinensis). Crit. Rev. Food Sci. Nutr. 2012, 52, 775–780. [Google Scholar] [CrossRef] [PubMed]
- Fernández-Cáceres, P.L.; Martín, M.J.; Pablos, F.; González, A.G. Differentiation of tea (Camellia sinensis) varieties and their geographical origin according to their metal content. J. Agric. Food Chem. 2001, 49, 4775. [Google Scholar] [CrossRef] [PubMed]
- McKenzie, J.S.; Jurado, J.M.; Pablos, F. Characterisation of tea leaves according to their total mineral content by means of probabilistic neural networks. Food Chem. 2010, 123, 859–864. [Google Scholar] [CrossRef]
- Fernández, P.L.; Martín, M.J.; González, A.G.; Pablos, F. HPLC determination of catechins and caffeine in tea. Analyst 2000, 125, 421–425. [Google Scholar] [CrossRef] [PubMed]
- Ye, N.; Zhang, L.; Gu, X. Discrimination of green teas from different geographical origins by using HS-SPME/GC-MS and pattern recognition methods. Food Anal. Methods 2012, 5, 856–860. [Google Scholar] [CrossRef]
- Palacios-Morillo, A.; Alcázar, A.; Pablos, F. Differentiation of tea varieties using UV–Vis spectra and pattern recognition techniques. Spectrochim. Acta Part A Mol. Biomol. Spectrosc. 2013, 103, 79–83. [Google Scholar] [CrossRef]
- Zhang, H.; Zhu, Q.; Huang, M.; Guo, Y. Automatic determination of optimal spectral peaks for classification of Chinese tea varieties using laser-induced breakdown spectroscopy. Int. J. Agric. Biol. Eng. 2018, 11, 154–158. [Google Scholar]
- Wu, X.; Zhou, J.; Wu, B.; Sun, J.; Dai, C. Identification of tea varieties by mid-infrared diffuse reflectance spectroscopy coupled with a possibilistic fuzzy c-means clustering with a fuzzy covariance matrix. J. Food Process Eng. 2019, 42, e13298. [Google Scholar] [CrossRef]
- Chen, Q.; Zhao, J.; Cai, J. Identification of tea varieties using computer vision. Trans. ASABE (Am. Soc. Agric. Biol. Eng.) 2008, 51, 623–628. [Google Scholar]
- Kao, Y.H.; Chang, H.H.; Lee, M.J.; Chen, C.L. Tea, obesity, and diabetes. Mol. Nutr. Food Res. 2006, 50, 188–210. [Google Scholar] [CrossRef]
- Ge, X.; Sun, J.; Lu, B.; Chen, Q.; Jin, Y. Classification of oolong tea varieties based on hyperspectral imaging technology and BOSS-LightGBM model. J. Food Process Eng. 2019, 42, e13289. [Google Scholar] [CrossRef]
- Yao, M.; Fu, G.; Chen, T.; Liu, M.; Xu, J.; Zhou, H.; He, X.; Huang, L. A modified genetic algorithm optimized SVM for rapid classification of tea leaves using laser-induced breakdown spectroscopy. J. Anal. At. Spectrom. 2021, 36, 361–367. [Google Scholar] [CrossRef]
- Zhu, X.; Zhang, X.; Sun, Z.; Zheng, Y.; Su, S.; Chen, F. Identification of oil tea (Camellia oleifera C.Abel) cultivars using efficientnet-b4 cnn model with attention mechanism. Forests 2022, 13, 1. [Google Scholar] [CrossRef]
- Li, L.; Zhang, S.; Wang, B. Apple leaf disease identification with a small and imbalanced dataset based on lightweight convolutional networks. Sensors 2022, 22, 173. [Google Scholar] [CrossRef]
- Gayathri, S.; Wise, D.; Shamini, P.B.; Muthukumaran, N. Image analysis and detection of tea leaf disease using deep learning. In Proceedings of the International Conference on Electronics and Sustainable Communication Systems (ICESC), Coimbatore, India, 2–4 July 2020; IEEE: Piscataway, NJ, USA, 2020. [Google Scholar]
- Sun, X.; Shaomin, M.U.; Yongyu, X.U.; Cao, Z.; Tingting, S.U. Image recognition of tea leaf diseases based on convolutional neural network. In Proceedings of the International Conference on Security, Pattern Analysis, and Cybernetics (SPAC), Jinan, China, 14–17 December 2018; IEEE: Piscataway, NJ, USA, 2018. [Google Scholar]
- Hu, G.; Wang, H.; Zhang, Y.; Wan, M. Detection and severity analysis of tea leaf blight based on deep learning. Comput. Electr. Eng. 2021, 90, 107023. [Google Scholar] [CrossRef]
- Mao, T.; Liu, F.; Huang, B.; Wang, L. Research on the method of tea disease recognition based on deep learning. In New Developments of IT, IoT and ICT Applied to Agriculture; Springer: Berlin/Heidelberg, Germany, 2021; pp. 119–128. [Google Scholar]
- Hu, G.; Yang, X.; Zhang, Y.; Wan, M. Identification of tea leaf diseases by using an improved deep convolutional neural network. Sustain. Comput. Inform. Syst. 2019, 24, 100353. [Google Scholar] [CrossRef]
- Xu, W.; Zhao, L.; Li, J.; Shang, S.; Ding, X.; Wang, T. Detection and classification of tea buds based on deep learning. Comput. Electron. Agric. 2022, 192, 106547. [Google Scholar] [CrossRef]
- Gao, M.; Shi, M.; Li, C. Research and implementation of image recognition of tea based on deep learning. In Proceedings of the 21st ACIS International Winter Conference on Software Engineering, Artificial Intelligence, Networking and Parallel/Distributed Computing (SNPD-Winter), Ho Chi Minh City, Vietnam, 28–30 January 2021; IEEE: Piscataway, NJ, USA, 2021. [Google Scholar]
- Kaihua, W.; Bojian, C.; Zejian, L.; Dongmei, C.; Guangyu, L.; Hongze, L.; Baihua, Z. Classification of tea leaves based on fluorescence imaging and convolutional neural networks. Sensors 2022, 22, 7764. [Google Scholar]
- Mohanty, S.P.; Hughes, D.P.; Salathé, M. Using deep learning for image-based plant disease detection. Front. Plant Sci. 2016, 7, 1419. [Google Scholar] [CrossRef]
- Ding, Y.; Wang, X.; Cui, H.; Zhao, Y. Biochemical and proteome analysis reveal different nutritional compound compositions and chloroplast development situations between purple-red and white-yellow tea plant cultivars. Horticulturae 2022, 8, 685. [Google Scholar] [CrossRef]
- Wibowo, N.A.; Martono, B. The diversity and classification of tea germplasm based on morpho-agronomic characteristics. In IOP Conference Series: Earth and Environmental Science; IOP Publishing: Bristol, UK, 2022; Volume 985, p. 012008. [Google Scholar]
- Zhu, Y.; Luo, Y.; Wang, P.; Zhao, M.; Li, L.; Hu, X.; Chen, F. Simultaneous determination of free amino acids in Pu-erh tea and their changes during fermentation. Food Chem. 2016, 194, 643–649. [Google Scholar] [CrossRef] [PubMed]
- Barhé, T.A.; Tchouya, G.F. Comparative study of the anti-oxidant activity of the total polyphenols extracted from hibiscus sabdariffa l., glycine max l. merr., yellow tea and red wine through reaction with DPPH free radicals. Arab. J. Chem. 2016, 9, 1–8. [Google Scholar] [CrossRef]
- Ruxton, C.J. The impact of caffeine on mood, cognitive function, performance and hydration: A review of benefits and risks. Nutr. Bull. 2008, 33, 15–25. [Google Scholar] [CrossRef]
- Higdon, J.V.; Frei, B. Tea catechins and polyphenols: Health effects, metabolism, and antioxidant functions. Crit. Rev. Food Sci. Nutr. 2003, 43, 89–143. [Google Scholar] [CrossRef]
- Guo, Z.; Barimah, A.O.; Yin, L.; Chen, Q.; Shi, J.; Hesham, R.E.; Zou, X. Intelligent evaluation of taste constituents and polyphenols-to-amino acids ratio in matcha tea powder using near infrared spectroscopy. Food Chem. 2021, 353, 129372. [Google Scholar] [CrossRef] [PubMed]
- Tan, M.; Le, Q.V. Efficientnet: Rethinking model scaling for convolutional neural networks. In Proceedings of the International Conference on Machine Learning 2019, Long Beach, CA, USA, 10–15 June 2019. [Google Scholar]
- Sandler, M.; Howard, A.; Zhu, M.; Zhmoginov, A.; Chen, L.C. MobileNetV2: Inverted residuals and linear bottlenecks. In Proceedings of the IEEE Conference on Computer Vision and Pattern Recognition, Salt Lake City, UT, USA, 18–22 June 2018. [Google Scholar] [CrossRef]
- Howard, A.; Sandler, M.; Chen, B.; Wang, W.; Chen, L.C.; Tan, M. Searching for MobileNetV3. In Proceedings of the IEEE/CVF International Conference on Computer Vision, Seoul, Repulic of Korea, 27 October–2 November 2019; IEEE: Piscataway, NJ, USA, 2019. [Google Scholar]
- Mehta, S.; Rastegari, M. MobileViT: Light-weight, general-purpose, and mobile-friendly vision transformer. arXiv 2021, arXiv:2110.02178. [Google Scholar]
- Ma, N.; Zhang, X.; Zheng, H.T.; Sun, J. ShuffleNet V2: Practical guidelines for efficient CNN architecture design. In Proceedings of the European Conference on Computer Vision (ECCV), Munich, Germany, 8–14 September 2018; pp. 122–138. [Google Scholar]
Disclaimer/Publisher’s Note: The statements, opinions and data contained in all publications are solely those of the individual author(s) and contributor(s) and not of MDPI and/or the editor(s). MDPI and/or the editor(s) disclaim responsibility for any injury to people or property resulting from any ideas, methods, instructions or products referred to in the content. |
© 2023 by the authors. Licensee MDPI, Basel, Switzerland. This article is an open access article distributed under the terms and conditions of the Creative Commons Attribution (CC BY) license (https://creativecommons.org/licenses/by/4.0/).