Abstract
The increasing importance of utilizing new technologies, such as GNSS (Global navigation satellite system) devices, total stations, drones, scanners, etc., in forestry has become evident with the development of these tools. Combined with precise GNSS devices, UAVs represent an efficient tool that facilitates field measurements and reduces time spent in the field while also providing highly accurate data. To accurately determine the application of spatial data for calculating the longitudinal slope of forest/logging roads in a research project, measurements based on UAVs were conducted and compared with GNSS data. GNSS data were considered the reference values for the studied area, assuming that satellite positions and internet signals were good. An accurate longitudinal slope was necessary to define fuel consumption on forest/logging roads and slopes throughout the project and to verify the calculation method that could be applied for such or similar terrain conditions and overgrowth. The main goal of this research phase was not to study fuel consumption but to obtain an accurate longitudinal profile of forest/skid roads on rocky terrain that is not overgrown or poorly grown. The study put forth two hypotheses, one of which was ultimately confirmed, while the other was refuted. The results show no significant differences when comparing the absolute elevation of the points in the profiles for defining the longitudinal slope of the road using the program for designing forest/skid roads. While applying such a method of data collection to create the main projects for the (re)construction of forest/skid roads, there are significant deviations in earthwork masses. There was a difference of over 22.64% in one of the types of earthwork excavation on the designed forest road, so the method implemented in the research does not give sufficiently accurate results.
1. Introduction
The longitudinal slope (angle of incline along the length) of a forest/skid road and its impact on skidder (heavy-duty vehicle used for hauling logs from the forest to the processing site) operation and fuel consumption are crucial issues that need to be considered to ensure safe and efficient logging operations. A steep slope can create several challenges for skidder operations, including decreased stability and traction, increased fuel consumption, and the potential for skidder rollovers. In addition, a steep slope can also increase the risk of soil erosion and damage to the forest floor, which can negatively impact the overall health of the forest ecosystem [1]. On the other hand, a relatively gentle slope can improve skidder operation by allowing for better traction and stability, reducing fuel consumption, and reducing the risk of forest soil erosion and damage.
The diesel engine is still the main source of energy in all types of forest machinery, and hydrostatic–mechanical power transmission is mainly used [2]. The demand for forest machines that cost less, have the same efficiency and can reduce the emission of harmful gases is growing, and the interest of manufacturers in the development of electric and hybrid drives has also increased [3,4]. By conducting this study and project, one of the consumption segments was the dependence of the fuel consumption of a skidder on the slope of the road, and precise measurements of the longitudinal slopes of forest/skid roads had to be carried out with the use of modern technologies such as GNSS (Global Navigation Satellite System) devices, drones, and total stations.
The current measurement of field data of terrain configurations on forest land is difficult to carry out, primarily due to the lack of high-quality internet signal and GPS signal reception in conditions of uneven terrain configurations and canopy cover [5,6,7,8]. Surveying using geodetic devices is the most accurate method for carrying out direct surveys in the field, but results in significant expenditure of time and high dependence on the human factor during the survey, which can also result in inaccurate longitudinal profile data [9]. The most common errors occur in the subjective determination of longitudinal terrain fractures during terrain surveying. Contemporary technologies provide the ability to carry out measurements from the air by defining precise reference points with precise GNSS devices to create a 3D terrain model. The use of unmanned aerial vehicles (UAVs) enables rapid and accurate data in forest research and surveys [10,11,12,13], forest wind damages [14,15], forest postharvest soil disturbances [16], and fire risk management [17].
Modern technology, such as airborne laser scanning and terrestrial mobile laser scanning, has improved our ability to assess natural resources and the accuracy of field parameters compared with some classical surveys [18], but it is still extremely expensive. Thus, in the field of forestry, one often resorts to aerial measurements and photo processing based on the photogrammetric method. This also allows for a faster data acquisition process and automated processing afterward. Therefore, these new technologies can be used in a wide array of forest-related studies [19].
Unfavorable weather conditions in the forest, such as wind, limit the quality of photographs [20] and can affect the accuracy of data obtained from the air, which are processed by the photogrammetric method. Therefore, for more precise positioning, we need to define precise ground control points (GCPs) using GNSS devices. In addition, tree density [21] and other factors, such as terrain configuration [22], acquisition time (i.e., ensuring enough position fixes per point), and satellite geometry, can also affect the accuracy of GNSS instruments [23]. Therefore, to ensure the necessary higher spatial accuracy, it is necessary to provide certain preconditions, which in our case are enabled by connecting to the CROPOS (Croatian Positioning System) network and the presence of a high-quality Internet signal (4G speed). The CROPOS system consists of 33 reference GNSS stations at a distance of 70 km from each other, arranged so that they cover the entire area of Croatia to collect data from satellite measurements and calculate correction parameters [24]. This enables us to have horizontal precision within ±0–2 cm and vertical precision within ±0–4 cm. The basic assumption was that the rover receiver and the network of reference stations must be operated by using GPS, GLONASS, Galileo, and BeiDou [25].
Via this segment of research and measurement of the forest/skid road, an attempt was made to confirm the precise determination method of the longitudinal slope, and this was conducted to determine the consumption of the skidder on different longitudinal slopes and for further analyses when testing the hybrid skidder and obtaining the consumption reduction parameters of the hybrid drive on different slopes. Moreover, comparisons with a diesel-powered skidder were carried out.
In addition, the purpose of this work is to show the possibility of using this method in practical forestry with the help of the photogrammetric method and the use of aerial photographs and to try to prove whether sufficient accuracy is obtained for the creation of future main construction/reconstruction projects with respect to forest/skid roads in similar field conditions.
2. Materials and Methods
2.1. Research Area
The research area was in the municipality of Perušić—Croatia, Management Unit (MU) Risovac—Grabovača (coordinates from 44°38′20″ N, 15°21′45″ E to 44°38′34″ N, 15°21′52″ E) (Figure 1). The entire research campaign was conducted in one day at the beginning of June 2022 during the intense growing season.
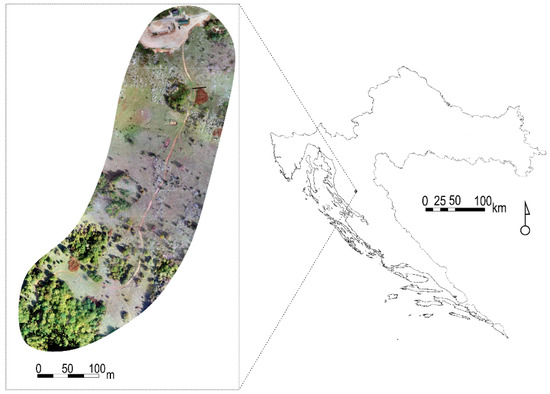
Figure 1.
Research area.
The terrain of the MU “Risovac—Grabovača” is slightly undulated with a series of higher or lower ascents, and the direction of these ascents is only observed in northwest–southeast locations, mostly in locations bordering the river and lake. Numerous higher or lower hills are separate units, so the relief is quite fragmented, without any particularly prominent exposure [26]. This area is characterized by the dominance of calcareous breccias, conglomerates, limestones, and some dolomites and proluvial deposits. The large spread of lime breccias and a smaller part of dolomitized limestones and dolomites under the forest surfaces conditioned the development of rendzina as the most represented soil. Colluvial hillside deposits are full of unsorted, coarse, unrounded dolomite and limestone karst mixed with brown loams and red clay, and occupy the lower and steep parts at the transition of steep slopes to flat terrain [26]. The area that was chosen for the survey is at the edge of the forest with weak growth where the conditions are most favorable for the survey using the GNSS. Initially, the intention of the study was to investigate the possibility of using the results for the hypotheses set within such an area. Later, if the results are statistically acceptable and the method is proven (hypothesis 1 obtains), the same research study will be conducted on forest land with a dense canopy.
2.2. Goals and Hypotheses
One of the goals of the research in this project was to devise a new method for field surveying for determining the longitudinal slope of the forest transport infrastructure with the maximum reduction in the influence of the human factor, to research faster and simpler field surveying methods, to realize a more accurate determination of parameters, and to obtain more reliable data. To achieve this, the correct steps are defined by using a data flowchart (Figure 2) in order to outline a correct method for measuring the current longitudinal slope of forest/skid roads. It is necessary to clearly form the hypotheses of the research itself and the steps that lead from the measurement and analysis stages to the final results.
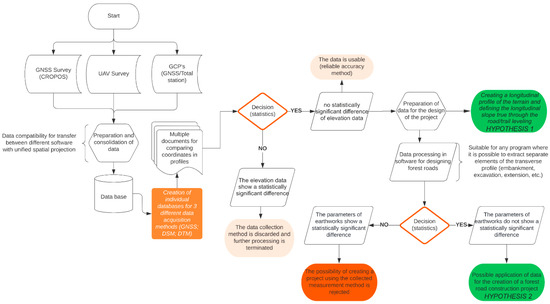
Figure 2.
Data flowchart from stages of surveying field data to the final proof/refutation of hypotheses.
2.3. Field Measurements
The measurement was performed in this way to maintain the same conditions for all types of measurements regarding the layout of satellites, the quality of the internet signal, and the weather conditions. Field data were collected with a 3-component GNSS device, a UAV, and a total station. Field data was collected with a specific device to achieve the maximum accuracy that can be provided by that particular device while completing the targeted steps in the research itself. The GNSS device was the Stonex S900A model equipped with a high-performance 800-channel GNSS board. It can support all satellite constellations, such as GPS, GLONASS, BEIDOU, GALILEO, QZSS, and IRNSS, including L-band–Atlas corrections. It has an integrated E-Bubble sensor that allows measurement of inaccessible points with an inclined stick. It calculates the exact coordinate of the point by conducting measurements from 3 different positions. It is equipped with an optional IMU sensor with a tilt of up to 60° [27]. For the controlling receiver, a Stonex S40 controller with Android Cube 4.0 software was used. The UAV was DJI Phantom 4 PRO (software Pix4dcapture for the fly mission) with a 3-axis-stabilized gimbal camera, a 20MP 1” CMOS sensor capable of shooting up to 4 K/60 fps video and photo bursts at up to 14 fps, and a Stonex R35L total station (software SurvCE) with a variable prism height of 2.0–4.6 m.
Data for the research zone in the imaginary profiles of the forest/skid road were recorded approximately every 10–15 m and at 4–6 points in the terrain breaks to obtain a sufficiently accurate configuration of the recorded road (Figure 3). The GNSS receiver was switched on outside the forest to avoid cold-start problems [28], and it was configured to store data only in the FIX mode.
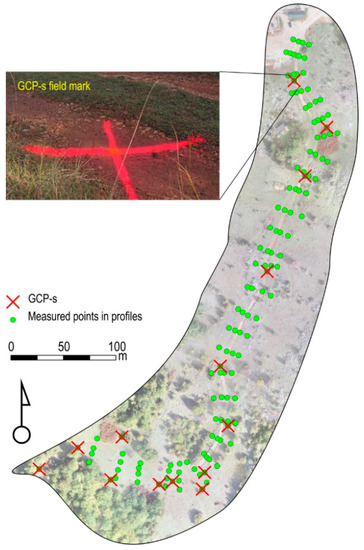
Figure 3.
Positions of recorded terrain points in profiles and GCPs.
GCPs for positioning purposes in the process of processing aerial images were measured using the GNSS device and corrected with a total station (it was used with an angular accuracy of 5” and a distance accuracy of ±2 mm + 2 ppm), so this method practically works independently of forest conditions and therefore guarantees reliable results [29]. The total station was used only for providing control and possibly for correcting the position of the GNSS points, i.e., it was used if necessary to make any horizontal or vertical corrections with respect to the GCPs themselves due to possible deviations in the GNSS recordings. A total of 14 GCPs were recorded (shapes in the form of a cross of approx. 50 × 50 cm were used for GCP markings) (Figure 4). GCPs were used solely for georeferencing and were not used in the final analysis for point comparisons [30].
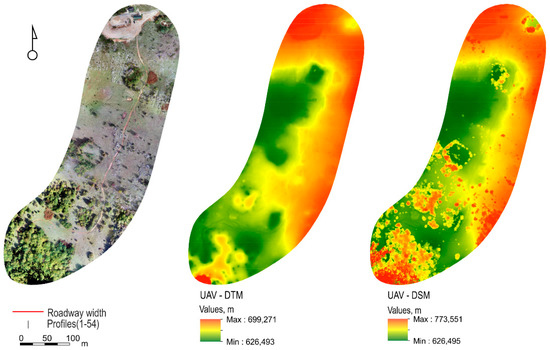
Figure 4.
Processing results of UAV recording (from left: orthomosaic, DTM, and DSM).
The last survey of the road was carried out by a UAV, where aerial photos were collected with an overlap of 80% from a height of 50 m. Two missions were conducted that covered the entire research area, and the UAV was kept at a stable height according to the starting point, mostly due to limited battery life. Postprocessing was performed using the Pix4Dmapper program, and the general parameters of the recording and the obtained data after processing in the program are shown in Table 1.

Table 1.
Parameters of the processed footage of the UAV device.
2.4. Evaluation Methods
ArcMap 10.8 and Office Excel 2016 were used for final processing and creating a database. Since each pixel is of small dimensions, the same positions were used in terms of X and Y coordinates, and only the values of the Z coordinates, i.e., the values of the absolute heights, were compared. In ArcMap 10.8, the raster DTM and DSM overlapped with the GNSS points, the rasters of DTM and DSM were extracted only in the positions of GNSS points, and the maximum horizontal deviations between the GNSS points and the center of gravity of the raster were within 5 mm, which is a negligible error for forest land. Moreover, since the longitudinal profile of the forest/skid road is of interest, only the Z coordinate is important. The height data compared are between reference heights obtained by the GNSS device and data calculated from DTM and DSM obtained from UAV data processed in Pix4Dmapper.
The data are statistically processed to determine the reliability of the measurement for the method of determining the longitudinal slope of the forest/skid road. Based on the results of statistical processing, decisions are made on further processing and the use of the obtained data to confirm or refute research hypothesis 1. For statistical analyses, the Statistica 10 program was used. An analysis of variance of repeated measurements was performed, and a post hoc Tukey HSD test was conducted to assess statistical differences between repeated measurements with different methods. If hypothesis 1 is confirmed, the project of the forest/skid road is created in the forest/skid road design program CESTA (a noncommercial program for designing forest/skid roads used in state services that manage forests in Croatia and produced in Slovenia by the company SOFDATA), to form the level of the planned road and to be able to compare the data with respect to whether an identical level can be formed based on these data. From these procedures, the values of the longitudinal slopes of the level breaks are obtained. Differences in the elevation of the level and the terrain for the results are checked in Statistics 10 with a T-test to determine whether there is a difference in the middle points of the road.
To confirm or refute hypothesis 2, a design of the forest/skid road (re)construction based on data obtained from GNSS devices is created due to the assumption that data obtained by the UAV can be used in the future for a detailed construction or reconstruction project with respect to forest/skid roads. The project was later developed based on field data obtained using UAV devices, and earthwork data with respect to Fill and Cut (in cubic meters) were compared between each profile of the designed forest/skid road. The statistical comparison was performed with a T-test of the dependent variables.
3. Results
In sum, 29 profiles (10–15 m apart) were defined in the field to measure the design zone (3D terrain) of the future forest/skid road with a GNSS device with 4–6 points in each profile. A total of 14 GCP points were defined for the precise processing of aerial images. The total length of the route was 542.55 m on sparsely vegetated and non-vegetated forest land. Later in the design program, in order to obtain more detailed drawings and a more significant number of cross-sections for comparing the masses of excavations and embankments, 54 profiles (approx. every 9–10 m) were formed to illustrate the parameters of the designed forest/skid road. The products of data processing were DTM (digital terrain model), DSM (digital surface model), and an orthomosaic of the researched area (Figure 4). A total of 140 points were compared using DTM and DSM data from the same positions to compare them with GNSS height points.
The compared and tested elevation data are presented with descriptive statistics (Table 2). The analysis of variance (Table 3) revealed a significant statistical error between a certain group of height data, and to determine whether there was a deviation between all groups or only certain pairs, a post hoc Tukey HSD test was performed (Table 4).
Table 2.
Descriptive statistics of the tested elevation points.
Table 3.
Results of the analysis of variance for height points measured by GNSS, DTM, and DSM.
Table 4.
Tukey HSD test results for pairs of elevation data.
The results of the post hoc test indicate that there is no statistically significant difference between the height data of GNSS and DTM, while the difference between GNSS and DSM is significant, and these data cannot be used for further analysis or for creating a detailed main project in the design program for forest/skid roads. Based on GNSS and DTM elevation points, the main detailed projects were carried out, and leveling was formed by using the reference data (GNSS data 3D terrain model) in the CESTA program for the design of forest roads. After that, only field data were replaced with a DTM 3D terrain model, while leveling did not change its shape or height position. A forest/skid road with eight horizontal curves was designed (minimum radius of 20 m and maximum radius of 700 m).
The level is formed by 12 breaks (changes in slope), i.e., 13 sections of different longitudinal slopes. The minimum longitudinal slope ranges from 0.79% to a maximum longitudinal slope of 9.89%. As shown in Figure 5, when replacing the 3D terrain model with two different methods for obtaining height points, there are no significant changes, and during the design stage, there was no need to change the level. The average deviations were 0.02 m, which is not significant for the change in the level’s position. This confirms hypothesis 1, and we can state that if it is observed only in the longitudinal section, that is, the 2D view in the height sense, there are no significant changes in the terrain characteristics of the data recorded by GNSS- and UAV-processed data. The only significant deviation, which was obtained in profile 9, is 19 cm. Still, the leveling appearance does not need to be changed due to only one deformation in the terrain.
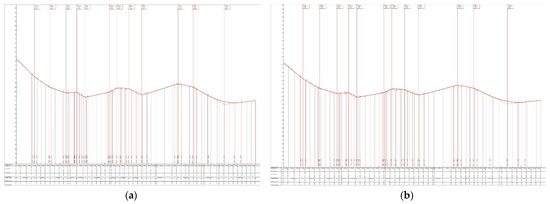
Figure 5.
Results of the designed longitudinal level in software for designing forest/skid roads CESTA: (a) GNSS elevation points in profiles; (b) DTM elevation points in profiles.
After proving hypothesis 1, further analysis was conducted to prove/disprove hypothesis 2, and the data obtained using the UAV are tested via the amount of earthwork (Fill = excavation; Cut = embankment) created during the process of designing the future forest/skid road. Data on the amount of Fill and Cut for all road profiles (Figure 6) were extracted from the design program, and a statistical comparison of the data was carried out.
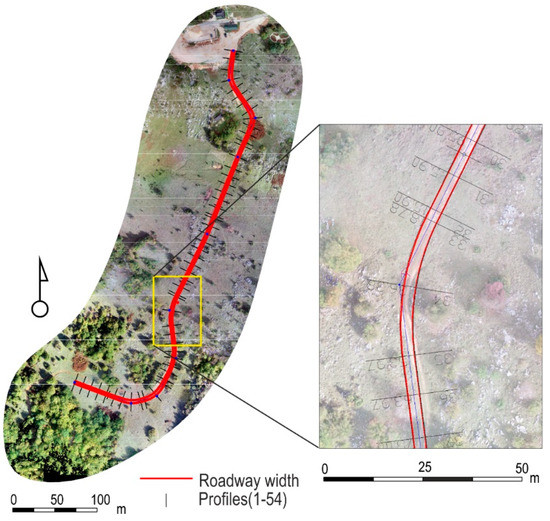
Figure 6.
Designed forest/skid road in the zone of the research area on 3D terrain from GNSS elevation points within pavement that is 3.00 m in width.
As already observed in the aggregated data, a significant difference in masses is visible for data created from GNSS terrain and terrain from the UAV. In the data for Fill values, there is a decrease of 6.68% for UAV 3D terrain, while there is a significant difference of 22.64% (50.25 m3) (Table 5) with respect to the increase in Cut earthworks. These data were tested in Statistics 10 using a T-test of dependent variables, and significant differences in Cut data and differences (Fill–Cut) in total masses were proven (Figure 7). We can also confirm that the test did not prove a significant difference in the earthworks of Fill, but since we cannot observe only one segment during the earthworks in the construction of the forest/skid road, we can confirm that hypothesis 2 has not been proven and that this methodology does not provide sufficient accuracy when the UAV 3D terrain (photogrammetric method) is used in the mass calculation.
Table 5.
Summary data on earthworks of Fill and Cut on the designed forest/skid road.
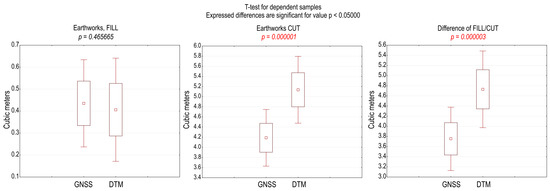
Figure 7.
Results of the t-test for earthworks of Fill and Cut obtained from GNSS 3D terrain and UAV-obtained DTM.
4. Discussion
The variable density of canopies, forests, and forest infrastructure presents unique challenges for both aerial and terrestrial surveying methods, setting them apart from other types of environments. By utilizing this method for measuring the longitudinal slope of preexisting forest/skid roads, accurate slope values can be obtained while minimizing errors that may result from human operations. This approach avoids long-term terrestrial field measurements, and in conjunction with forest/skid road design software programs facilitates the production of precise slope measurements. The GNSS records locations based on the information received from satellites (independently of the location of other points). As the research area was sparsely forested land with good GNSS signal coverage and an internet signal for connecting to CROPOS, in general, we can conclude that GNSS provided precise and reasonable measurements under this forest canopy condition [19]. The use of differential correction techniques, specifically, a network of reference stations (CROPOS), was essential to achieving high levels of accuracy and precision in this research. The real-time kinematic (RTK) mode, virtual reference stations (VRS) mode, and postprocessing observations after fieldwork are all enabled by access to such a network. This has been confirmed by researchers worldwide [31,32,33], who have found that this technique is not only applicable to GIS or geodetic-class receivers but also to some smartphones [34]. The influence of PDOP was not checked, but points were recorded when PDOP was at its lowest value.
The UAV device provides a on-demand, highly precise photo resolution for forestry research [35], but the good resolution obtained by the photogrammetric method does not mean that the data generated in the raster maps of DSM and DTM on all parts of the image are of sufficient precision for future use. This research was also carried out in good terrain conditions in order to achieve a lower value of PDOP so that the values recorded by the GNSS device could be considered as a reference. To test this method in denser stands, a new study should be conducted, and how the accuracy of the data changes under the denser stand should be observed.
The influence of the number and position of ground control points (GCPs) has been widely studied. Typically, 4 to 20 GCPs are used, regardless of the size of the area being studied. To minimize GNSS errors caused by the forest canopy and postprocessing corrections, it is necessary to place GCPs in areas with a clear view of the sky [36]. Therefore, in the research, a large number of GCPs (14 positions) were placed on surfaces that are clearly visible from the air, and they were placed more densely on parts where the configuration of the terrain was more uneven and had more lateral forest vegetation.
The measurement of terrain profiles often consists of 4–6 terrain breaks (perpendicular to the direction of the route), and when calculating earthworks, significantly more points are taken to define the 3D terrain. For this reason, there was a significant deviation in the results in the soil masses of the Cut, so hypothesis 2 was not proved (Figure 8).
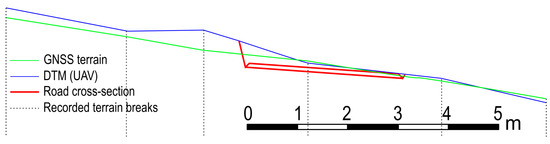
Figure 8.
Illustrative representation of the forest/skid road profile for different 3D terrain inputs and deviations that occur when observing the surface, i.e., all terrain breaks in the cross-section.
When observing the 2D profile in the longitudinal direction, minor possible errors occur, because only 54 height points in the middle of the designed forest road are observed. This alone reduces the possibility of major deviations, and even if there is a deviation in an individual profile, it does not affect the position of the level line segment itself, which uniformly passes through the same slope with respect to the length of several designed profiles.
5. Conclusions
By conducting a statistical analysis of the variance in repeated measurements and ultimately comparing the terrain in the longitudinal plan, we can say that such a method can be accepted for calculating the correct longitudinal slope of a forest/skid road with the help of software for designing forest roads. The results confirm the first hypothesis, which states that the computational determination of the longitudinal slope of the level provides accurate results and reduces human error during field measurements. When collecting data from aerial sources, it is crucial to capture enough high-quality shots and to define an adequate number of precise GCPs using a GNSS device with a clear view of favorable satellite positions and a reliable internet signal. The second hypothesis in this research study was not confirmed, as field data collected by aerial surveys and processed photographs using the photogrammetric method with precise georeferencing still did not provide sufficient accuracy to create a precise main project for forest/skid road construction or reconstruction. This level of accuracy requires aerial scanner imaging if that form of data collection is pursued.
Author Contributions
Conceptualization, K.L.; methodology, K.L.; software, K.L.; formal analysis, H.N.; investigation, Z.P., M.B. and H.K.; resources, M.Š.; data curation, Z.P. and H.K.; writing—original draft preparation, K.L.; writing—review and editing, H.N.; visualization, M.B.; supervision, K.L.; project administration, H.N.; funding acquisition, M.Š. All authors have read and agreed to the published version of the manuscript.
Funding
This research was cofunded by the European Regional Development Fund within the scope of the European Union Operational Programme “Competitiveness and Cohesion” under grant KK. 01.1.1.04.0010 (Development of Hybrid Drive of Skidder—HiSkid).
Data Availability Statement
The data for this research can be shared upon request.
Acknowledgments
We acknowledge with deep gratitude that this research was supported by the European Regional Development Fund within the scope of the European Union Operational Programme “Competitiveness and Cohesion” under grant KK. 01.1.1.04.0010 (Development of Hybrid Drive of Skidder—HiSkid) and within the scope of the European Union Operational Programme “Competitiveness and Cohesion” 2014–2020 (2014HR16M1OP00-1.2). The authors also wish to thank the Faculty of Forestry and Wood Technology at the University of Zagreb for all their support during this research.
Conflicts of Interest
The authors declare no conflict of interest.
References
- Solgi, A.; Naghdi, R.; Tsioras, P.A.; Ilstedt, U.; Salehi, A.; Nikooy, M. Combined Effects of Skidding Direction, Skid Trail Slope and Traffic Frequency on Soil Disturbance in North Mountainous Forest of Iran. Croat. J. For. Eng. 2017, 38, 97–106. [Google Scholar]
- Marenče, J.; Brnić, A.; Šušnjar, M. Wheel Slip During Wood Extraction. Work. Fac. For. Univ. Sarajevo 2017, 47, 36–48. [Google Scholar] [CrossRef]
- Rong-Feng, S.; Xiaozhen, Z.; Chengjun, Z. Study on Drive System of Hybrid Tree Harvester. Sci. World J. 2017, 2017, 8636204. [Google Scholar] [CrossRef] [PubMed]
- Silvaş, E.; Hofman, T.; Steinbuch, M. Review of optimal design strategies for hybrid electric vehicles. IFAC Proc. 2012, 45, 57–64. [Google Scholar] [CrossRef]
- Pirti, A.; Gumus, K.; Erkaya, H.; Hosbas, R.G. Evaluating Repeatability of RTK GPS/GLONASS Near/Under Forest Environment. Croat. J. For. Eng. 2010, 31, 23–33. [Google Scholar]
- Pirti, A. Accuracy Analysis of GPS Positioning Near the Forest Environment. Croat. J. For. Eng. 2008, 29, 189–199. [Google Scholar]
- Sigrist, P.; Coppin, P.; Hermy, M. Impact of Forest Canopy on Quality and Accuracy of GPS Measurements. Int. J. Remote Sens. 1999, 20, 3595–3610. [Google Scholar] [CrossRef]
- Magiera, W.; Vārna, I.; Mitrofanovs, I.; Silabrieds, G.; Krawczyk, A.; Skorupa, B.; Apollo, M.; Maciuk, K. Accuracy of Code GNSS Receivers under Various Conditions. Remote Sens. 2022, 14, 2615. [Google Scholar] [CrossRef]
- Lepoglavec, K. Optimization of Primary and Secondary Forest Traffic Infrastructure on Sloped Terrain. Ph.D. Thesis, Faculty of Forestry and Wood Technology, Zagreb, Croatia, 2014; pp. 1–341. [Google Scholar]
- Hillman, S.; Wallace, L.; Lucieer, A.; Reinke, K.; Turner, D.; Jones, S. A comparison of terrestrial and UAS sensors for measuring fuel hazard in a dry sclerophyll forest. Int. J. Appl. Earth Obs. 2021, 95, 102261. [Google Scholar] [CrossRef]
- Schiefer, F.; Kattenborn, T.; Frick, A.; Frey, J.; Schall, P.; Koch, B.; Schmidtlein, S. Mapping Forest tree species in high resolution UAV-based RGB-imagery by means of convolutional neural networks. ISPRS J. Photogramm. Remote Sens. 2020, 170, 205–215. [Google Scholar] [CrossRef]
- Tang, L.; Shao, G. Drone remote sensing for forestry research and practices: Review article. J. For. Res. 2015, 26, 791–797. [Google Scholar] [CrossRef]
- Balenović, I.; Liang, X.; Jurjević, L.; Hyyppä, J.; Seletković, A.; Kukko, A. Hand-held personal laser scanning–current status and perspectives for forest inventory application. Croat. J. For. Eng. 2021, 42, 165–183. [Google Scholar] [CrossRef]
- Hycza, T.; Ciesielski, M.; Zasada, M.; Bałazy, R. Application of black-bridge satellite imagery for the spatial distribution of salvage cutting in stands damaged by wind. Croat. J. For. Eng. 2019, 40, 125–138. [Google Scholar]
- Mokroš, M.; Výbošt’ok, J.; Merganič, J.; Hollaus, M.; Barton, I.; Koreň, M.; Tomaštík, J.; Čerňava, J. Early stage forest windthrow estimation based on unmanned aircraft system imagery. Forests 2017, 8, 306. [Google Scholar] [CrossRef]
- Talbot, B.; Astrup, R. A review of sensors, sensor-platforms and methods used in 3D modelling of soil displacement after timber harvesting. Croat. J. For. Eng. 2021, 42, 149–164. [Google Scholar]
- Pradeep, G.S.; Danumah, J.H.; Nikhil, S.; Prasad, M.K.; Patel, N.; Mammen, P.C.; ARajaneesh, V.O.; Ajin, R.S.; Kuriakose, S.L. Forest fire risk zone mapping of Eravikulam National Park in India: A comparison between frequency ratio and analytic hierarchy process methods. Croat. J. For. Eng. 2022, 43, 199–217. [Google Scholar] [CrossRef]
- Liang, X.; Kankare, V.; Hyyppä, J.; Wang, Y.; Kukko, A.; Haggrén, H.; Yu, X.; Kaartinen, H.; Jaakkola, A.; Guan, F.; et al. Terrestrial Laser Scanning in Forest Inventories. ISPRS J. Photogramm. Remote Sens. 2016, 115, 63–77. [Google Scholar] [CrossRef]
- Stancioiu, P.T.; Dutca, I.; Florea, S.C.; Paraschiv, M. Measuring Distances and Areas under Forest Canopy Conditions—A Comparison of Handheld Mobile Laser Scanner and Handheld Global Navigation Satellite System. Forests 2022, 13, 1893. [Google Scholar] [CrossRef]
- Oveland, I.; Hauglin, M.; Gobakken, T.; Næsset, E.; Maalen-Johansen, I. Automatic Estimation of Tree Position and Stem Diameter Using a Moving Terrestrial Laser Scanner. Remote Sens. 2017, 9, 350. [Google Scholar] [CrossRef]
- Abdi, O.; Uusitalo, J.; Pietarinen, J.; Lajunen, A. Evaluation of Forest Features Determining GNSS Positioning Accuracy of a Novel Low-Cost, Mobile RTK System Using LiDAR and TreeNet. Remote Sens. 2022, 14, 2856. [Google Scholar] [CrossRef]
- Næsset, E.; Jonmeister, T. Assessing Point Accuracy of DGPS Under Forest Canopy Before Data Acquisition, in the Field and after Postprocessing. Scand. J. For. Res. 2002, 17, 351–358. [Google Scholar] [CrossRef]
- Deckert, C.; Bolstad, P. V Forest Canopy, Terrain, and Distance Effects on Global Positioning System Point Accuracy. Photogramm. Eng. Remote Sens. 1996, 62, 317–321. [Google Scholar]
- CROPOS—Državna Mreža Referentnih Stanica Republike Hrvatske. Available online: https://www.cropos.hr/o-sustavu/cropos-drzavna-mreza-referentnih-stanica-republike-hrvatske/ (accessed on 13 March 2023).
- Brach, M. Rapid Static Positioning Using a Four System GNSS Receivers in the Forest Environment. Forests 2022, 13, 45. [Google Scholar] [CrossRef]
- Anonymous. Forest Management Program for the Management Unit Risovac-Grabovača; Croatian Forests Ltd.: Gospić, Croatia, 2018. [Google Scholar]
- Stonex Geosustavi. Available online: http://stonex.hr/product/s900a-gnss-artk-prijemnik/ (accessed on 20 February 2023).
- Narayana, S.; Prasad, R.V.; Rao, V.; Mottola, L.; Prabhakar, T.V. Hummingbird: Energy Efficient GPS Receiver for Small Satellites. In Proceedings of the 26th Annual International Conference on Mobile Computing and Networking, London, UK, 21–25 September 2020; ACM: New York, NY, USA, 2020; pp. 1–13. [Google Scholar]
- Kršák, B.; Blišťan, P.; Pauliková, A.; Puškárová, P.; Kovanič, ľ.; Palková, J.; Zelizňaková, V. Use of Low-Cost UAV Photogrammetry to Analyze the Accuracy of a Digital Elevation Model in a Case Study. Measurement 2016, 91, 276–287. [Google Scholar] [CrossRef]
- Tomaštík, J.; Mokroš, M.; Surový, P.; Grznárová, A.; Merganič, J. UAV RTK/PPK method—An optimal solution for mapping inaccessible forested areas? Remote Sens. 2019, 11, 721. [Google Scholar] [CrossRef]
- Holden, N.M.; Martin, A.A.; Owende, P.M.O.; Ward, S.M. A Method for Relating GPS Performance to Forest Canopy. Int. J. For. Eng. 2001, 12, 51–56. [Google Scholar] [CrossRef]
- Danskin, S.D.; Bettinger, P.; Jordan, T.R.; Cieszewski, C. A Comparison of GPS Performance in a Southern Hardwood Forest:Exploring Low-Cost Solutions for Forestry Applications. South. J. Appl. For. 2009, 33, 9–16. [Google Scholar] [CrossRef]
- Bettinger, P.; Merry, K.L. Influence of the Juxtaposition of Trees on Consumer-Grade GPS Position Quality. Math. Comput. For. Nat. Resour. Sci. 2012, 4, 81. [Google Scholar]
- Tomaštík, J.; Chudá, J.; Tunák, D.; Chudý, F.; Kardoš, M. Advances in Smartphone Positioning in Forests: Dual-Frequency Receivers and Raw GNSS Data. For. Int. J. For. Res. 2021, 94, 292–310. [Google Scholar] [CrossRef]
- Miller, Z.M.; Hupy, J.; Chandrasekaran, A.; Shao, G.; Fei, S. Application of postprocessing kinematic methods with UAS remote sensing in forest ecosystems. J. For. 2021, 119, 454–466. [Google Scholar] [CrossRef]
- Harwin, S.; Lucieer, A. Assessing the accuracy of georeferenced point clouds produced via multi-view stereopsis from unmanned aerial vehicle (UAV) imagery. Remote Sens. 2012, 4, 1573–1599. [Google Scholar] [CrossRef]


Disclaimer/Publisher’s Note: The statements, opinions and data contained in all publications are solely those of the individual author(s) and contributor(s) and not of MDPI and/or the editor(s). MDPI and/or the editor(s) disclaim responsibility for any injury to people or property resulting from any ideas, methods, instructions or products referred to in the content. |
© 2023 by the authors. Licensee MDPI, Basel, Switzerland. This article is an open access article distributed under the terms and conditions of the Creative Commons Attribution (CC BY) license (https://creativecommons.org/licenses/by/4.0/).