Article

Influence of Vegetation Types on the C, N, and P Stoichiometric Characteristics of Litter and Soil and Soil Enzyme Activity in Karst Ecosystems

1
College of Forestry, Guizhou University, Guiyang 550025, China
2
Key Laboratory of Karst Georesources and Environment, Ministry of Education, Guizhou University, Guiyang 550025, China
3
Research Center for Soil Erosion & Ecological Restoration, Guizhou University, Guiyang 550025, China
4
Shandong Water Conservancy Survey and Design Institute Co., Ltd. Guizhou Branch, Guiyang 550001, China
*
Author to whom correspondence should be addressed.
Forests 2023, 14(4), 771; https://doi.org/10.3390/f14040771
Submission received: 16 February 2023 / Revised: 29 March 2023 / Accepted: 4 April 2023 / Published: 9 April 2023
(This article belongs to the Section Forest Soil)

Abstract

:
Analyzing the ecological stoichiometric characteristics and soil enzyme activity of litter and soil in different vegetation types within karst areas can help to clarify the nutrient cycles and element abundance in those areas, in addition to providing basic data for vegetation restoration and reconstruction. In this study, the carbon (C), nitrogen (N), and phosphorus (P) contents of litter and soil and the alkaline phosphatase (ALP), sucrase (Suc), urease (Ure), and catalase (CAT) activity of soil were measured in grassland (GR), shrubland (SR), arbor and shrub compound forest (AS), and arbor forest (AR). The correlation between litter and soil stoichiometry and soil enzyme activity was analyzed to reveal the effects of different vegetation types on the C, N, and P stoichiometric characteristics of litter and soil, soil enzyme activity, and their driving mechanisms. The results showed that the C, N, and P contents of litter in the study area were 366.2–404.48 g/kg, 12.37–15.26 g/kg, and 0.76–1.05 g/kg, respectively. The C, N, and P contents of soil in the study area were 27.69–42.4 g/kg, 2.38–4.25 g/kg, and 0.56–0.68 g/kg, respectively. The litter N content and soil C and N contents were highest in the arbor forest (p < 0.05), while those in the grassland were the lowest (p < 0.05). The C:P and N:P ratios of the litter and soil in the arbor forest and arbor and shrub compound forest were higher than those in the other two vegetation types; however, the C:N ratio of the litter and soil in the arbor forest was lower than that in the other three vegetation types. The N element had a strong coupling relationship between litter and soil, while the P element had a weak relationship. The activity of the four soil enzymes in the four vegetation types were ranked as follows: arbor forest > arbor and shrub compound forest > shrubland > grassland. In general, the arbor forest communities were more conducive to nutrient cycling and accumulation. This information could help to guide the restoration and management of vegetation in karst areas.

1. Introduction

Ecological stoichiometry is a discipline that analyzes and explains the changes in and links between plants and their environments [1], by connecting different levels from gene molecules to ecosystems [2]. Carbon (C), nitrogen (N), and phosphorus (P) are essential nutrients for plant growth. C is the structural element in plants, while N and P are the functional limiting elements for plant growth and development [3,4]. These nutrients closely connect plants and soil through migration and circulation within the ecosystem. The C:N:P ratio plays an active role in the element balance, material cycle, and plant habitat adaptation of ecosystems [5]. Soil provides a source of nutrients for plant growth [6]. Soil nutrient stoichiometry can reflect the soil fertility and nutrient limitation types of ecosystems [7]. Litter stores nutrients within an ecosystem [8]. The nutrient stoichiometry of litter reflects the rate of return and quality of nutrients [9]. Therefore, exploring the C, N, and P stoichiometry of litter and soil can help us to understand the nutrient abundance and the overall productivity of the ecosystem and provide ecological strategies for vegetation to adapt to the environment.
Plants have unique physiological, morphological, and phenological characteristics during growth and thus form different plant–soil interaction mechanisms [10,11,12]. In recent years, much progress has been made in the study of the ecological stoichiometry of different vegetation types. Huang et al. [13] studied the soil ecological stoichiometric characteristics of different vegetation types and their comparative analysis found that vegetation could promote nutrient accumulation and that different vegetation types had significantly different stoichiometric characteristics. Joshi and Garkoti [14] also proved that the vegetation type significantly affected the soil nutrient stoichiometric ratios, and that stoichiometric characteristics could be regarded as potential indicators of soil health in different vegetation types. However, the response of nutrient stoichiometry to different vegetation types is quite complex [15]. It mainly depends on the initial nutritional status, climatic characteristics, and altitude of the community [16]. These factors affect soil parent material weathering, plant uptake, litterfall return, biogeochemical transformation, surface/lateral/groundwater transportation, soil erosion and deposition, and soil–atmosphere exchange, hence the different stoichiometric characteristics [17]. As an important ‘catalyst’ for soil nutrient transformation and material circulation [18], soil enzymes are an important link between plants and soil. They participate in litter decomposition and also significantly affect the circulation of soil organic matter. Soil enzyme activity can sensitively reflect the relationship between nutrient supply and demand and the intensity of biochemical processes in different vegetation types [19]. Hitherto, there has been no complete research theory on the relationship between the C, N, and P stoichiometry of litter and soil and soil enzyme activity.
The karst area in southwestern China is one of three contiguous karst landforms in the world [20]. Due to the unique historical and geological background and disruptive human activity, the carbonate rocks in karst areas are strongly developed, the soil formation rates are slow, and the soil layers are shallow and barren. The overall ecological environments are fragile and sensitive and their ability to withstand disaster threshold elasticity is small; so, they are vulnerable to adverse conditions [21]. In recent years, as research on the restoration of fragile ecosystems from the perspective of vegetation species has deepened, the theory and practice of vegetation restoration and reconstruction in karst areas have been enriched and developed, but more comprehensive and systematic research is still needed to improve the existing results. The existing research has mainly focused on the relationships between single or multiple factors, including the C, N, and P contents of plants, litter, and soil, or the relationships between vegetation types and soil enzyme activity in karst areas [16,22,23]. There have been few reports on the relationship between the nutrient stoichiometry of litter and soil and soil enzyme activity in karst areas; so, our knowledge of the relationship between nutrient stoichiometry and soil enzyme activity in different vegetation types remains inconclusive. Therefore, by exploring the stoichiometric characteristics of litter and soil in different vegetation types in karst areas and their relationships with soil enzyme activity, it is helpful to fill the vacancy of this research content. Specifically, this study had the following purposes: (1) to explore the C, N, and P contents and stoichiometric characteristics of litter and soil in different vegetation types; (2) to clarify the coupling relationships between litter and soil nutrients, as well as the nutrient restriction categories of the different vegetation types; and (3) to reveal any differences in soil enzyme activity between the different vegetation types, as well as the internal correlation between litter and soil stoichiometry and soil enzyme activity. We hypothesized the following: (1) the C, N, and P contents and stoichiometric ratios of the litter and soil in the karst area in southwestern China would be significantly different in the various vegetation types and the arbor forest area would be more conducive to the accumulation of nutrients; (2) the nutrient utilization strategies of different vegetation types would be different, and so the nutrient limitation categories of the ecosystems would also be different; (3) soil enzyme activity would be affected by the litter and soil nutrient stoichiometry, but the influence of each index on soil enzyme activity would be inconsistent.

2. Materials and Methods

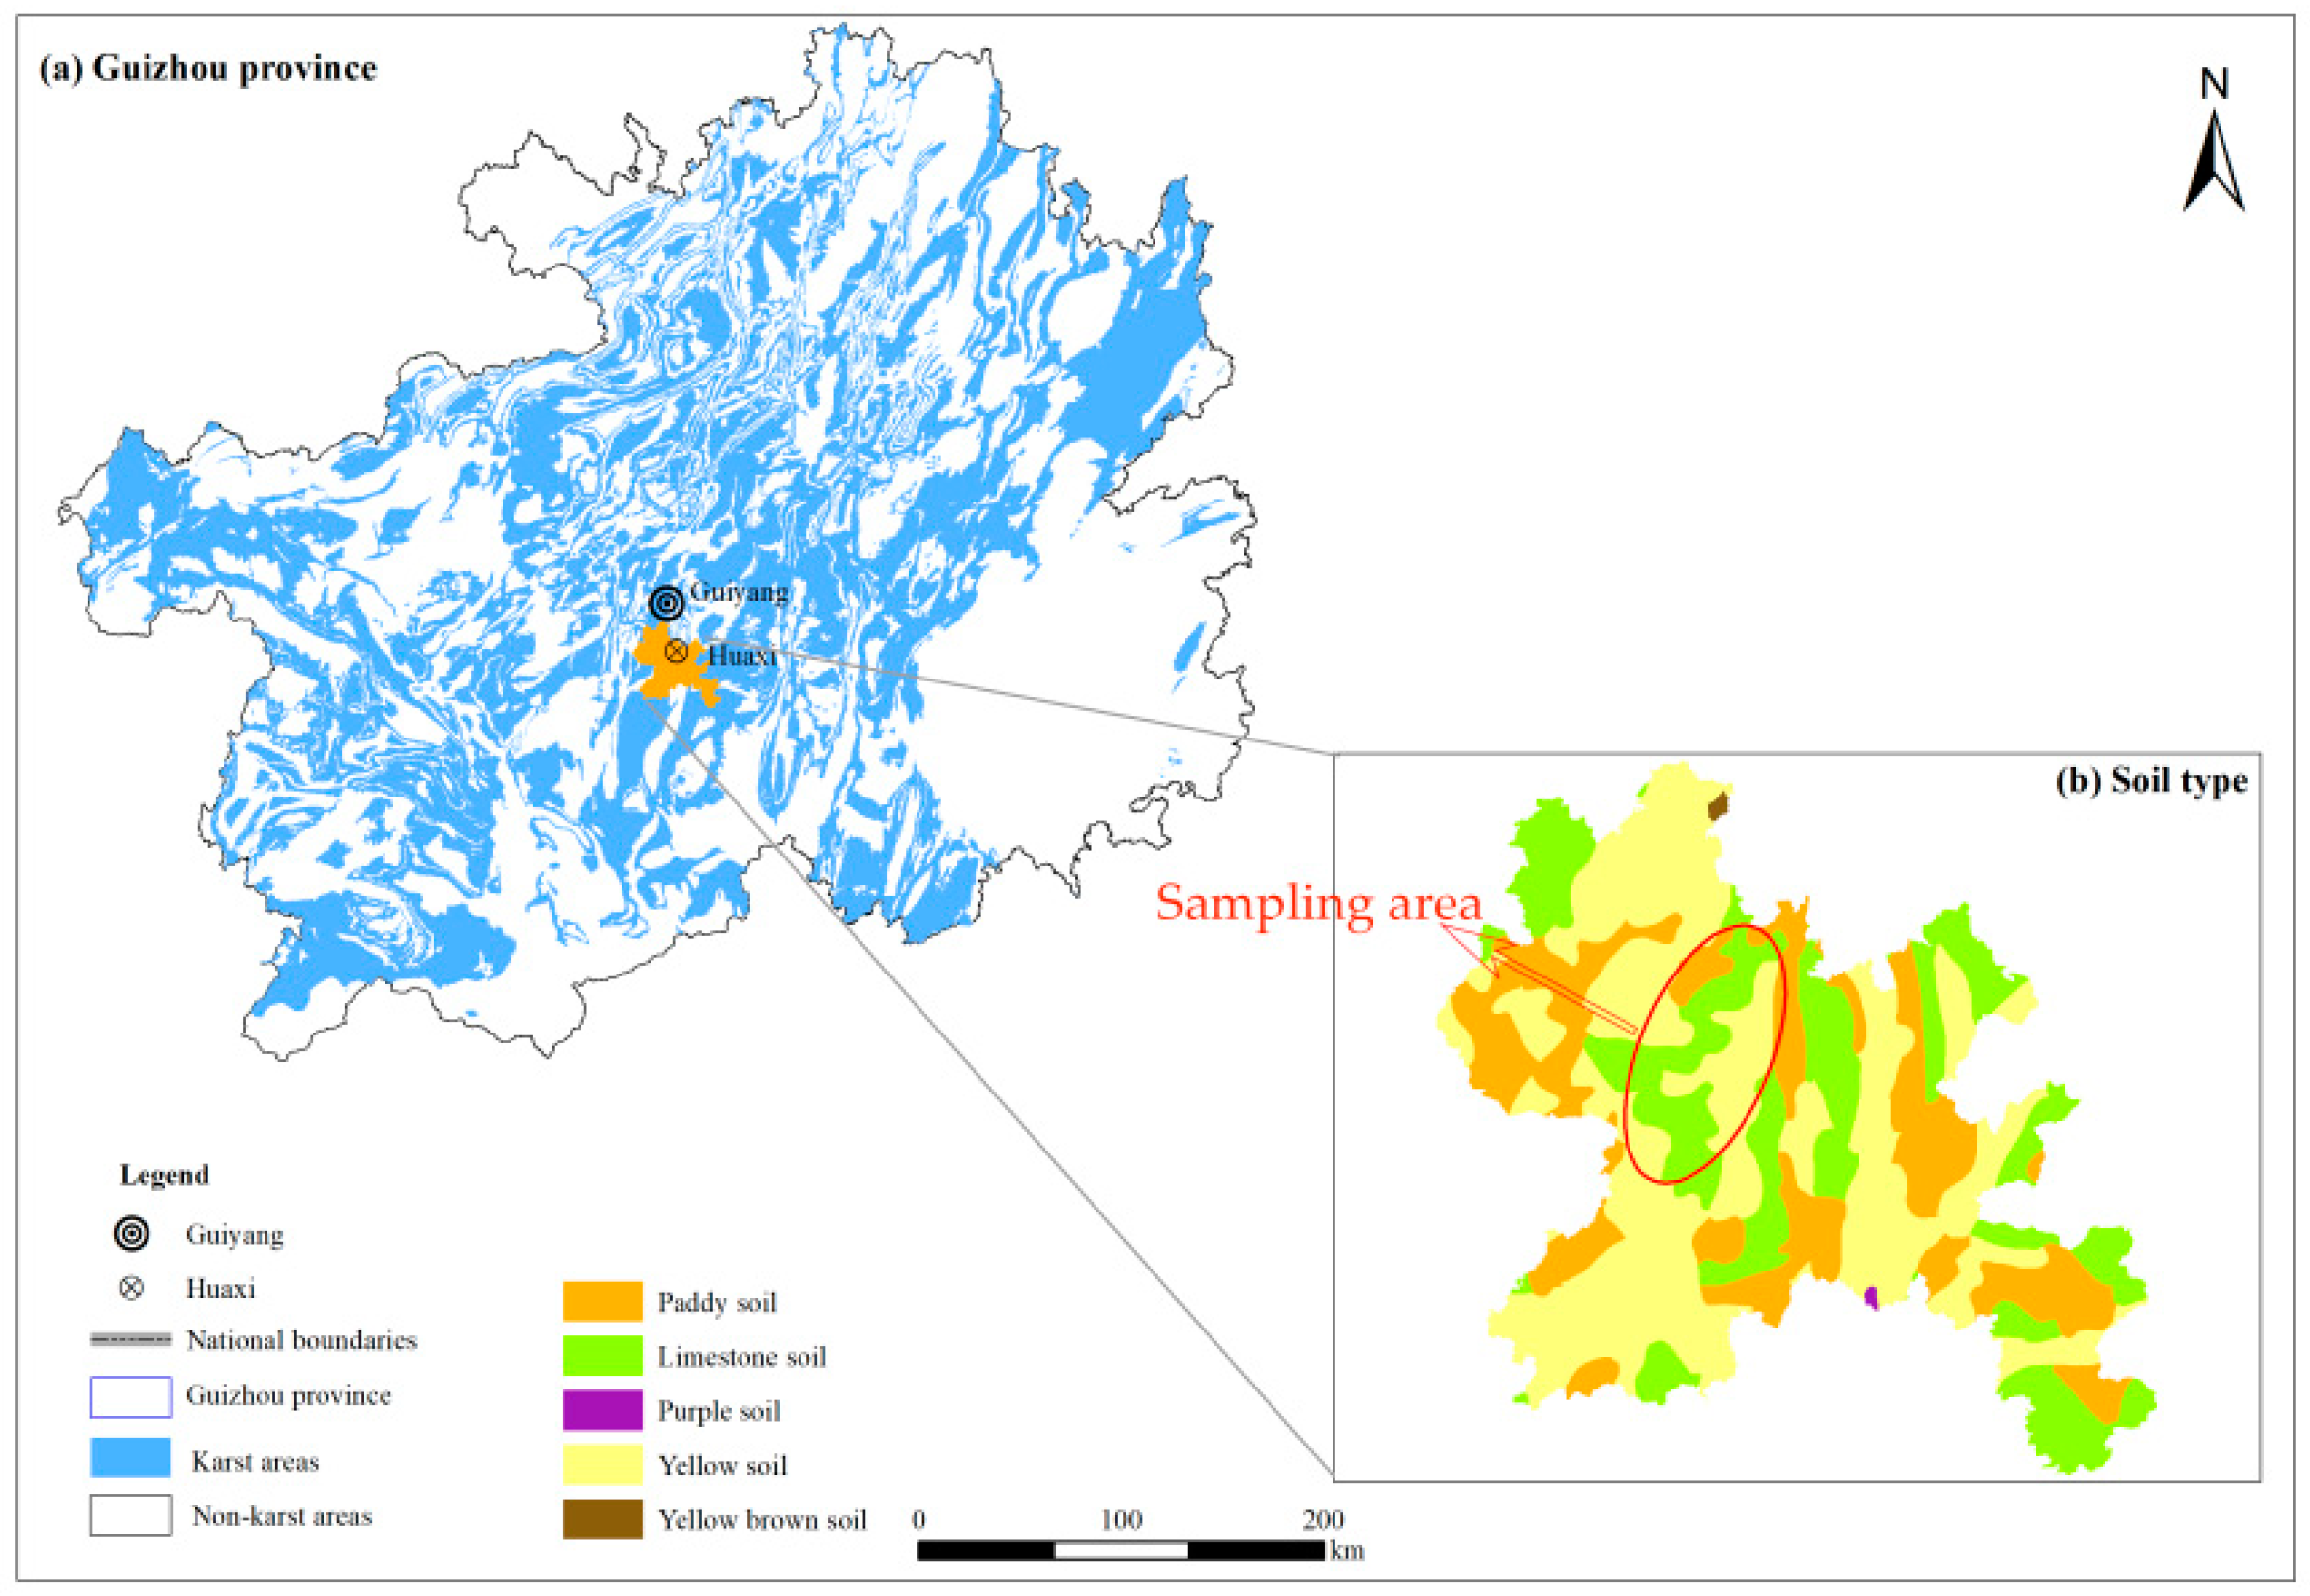
2.1. Overview of the Study Area

The study area was located in a typical karst landform area in Shiban Town, Huaxi District, Guiyang City, Guizhou Province (26°26′25″–26°26′40″ N, 106°34′6″–106°34′23″ E), with an altitude of 1182–1227 m (Figure 1). This area has a subtropical humid monsoon climate, with an average annual temperature of 14–16.4 °C and an average annual precipitation of 1129.5 mm. According to the FAO/UNESCO system, the soil in this area is calcareous lithosols (limestone soil) [24]. The pH value of calcareous soil ranges from 6.98 to 7.87. Since the end of the 1950s and 1980s, pockets of tillage land have been abandoned and have naturally regenerated into grasslands, shrublands, and arbor forests. The landscape of our study area is currently dominated by a mosaic of land types, including grasslands, shrublands, arbor forests, and abandoned cultivated land.

2.2. Sample Collection and Analysis

The grassland, shrubland, arbor and shrub compound forest, and arbor forest in this study were all regenerated from abandoned farmland. By asking landowners or estimating it from the tree rings of the oldest pioneer trees, we learned the land use history of these areas. In particular, we learned that the abandonment of the agricultural land in the grassland area occurred about 10 years ago, while that in the shrubland area occurred about 10–20 years ago, and that in the arbor and shrub compound forest area occurred about 50 years ago, while that in the arbor forest area occurred up to 70 years ago.
Field sampling was conducted from March 2022 to May 2022, and six sampling points were selected for each vegetation type. A sample plot of 50 square meters was established for each sample point, and all of which had similar natural conditions and geological backgrounds (Table 1). In each plot, five quadrats of 1 square meter were set using the five-point sampling method and the vegetation litter in each quadrat was collected and fully mixed in a self-sealing bag. At the same time, 0–20 cm of surface soil was collected from the same quadrat where the litter was collected and was mixed evenly into the valve bag. A total of 240 samples of litter and soil were collected from the four vegetation types.
After the samples were brought back to the laboratory, the litter samples were dried to a constant weight in an oven at 60–70 °C, and then ground through a 0.1 mm sieve to preserve them for the subsequent nutrient determination. Any plant roots and stones were removed from the soil samples and they were then spread into a 2–3 cm layer in a ventilated room to air dry. The quartering method was then used to select the soil samples and pass them through 0.25 mm and 2 mm sieves to determine their nutrient contents and enzyme activity.
The organic carbon content of the soil and litter was determined using the potassium dichromate volumetric method, while the total nitrogen content was determined using the Kjeldahl method and the total phosphorus content was determined using molybdenum-antimony resistance colorimetry [25]. The soil alkaline phosphatase (ALP) activity was determined using p-nitrophenol disodium phosphate substrate colorimetry, while the soil sucrase (Suc) activity was determined using 3,5-dinitrosalicylic acid colorimetry, the soil urease (Ure) activity was determined using sodium phenol-sodium hypochlorite colorimetry, and the soil catalase (CAT) activity was determined using ultraviolet spectrophotometry [26].

2.3. Data Analysis

In this study, all data were scrutinized using an analysis of variance to determine the significance (p < 0.05) of any differences, using XLSTAT. Duncan’s multiple range test (DMRT) was performed on the individual mean values to reveal any significant differences. The DMRT was carried out in SPSS 21.0 (SPSS Inc., Amunk, NY, USA). A Pearson correlation analysis was used to explore the relationship between the litter and soil stoichiometry and soil enzyme activity. The Pearson correlation analysis was carried out in Origin 2021 (Origin Lab., Northampton, MA, USA). All bar charts and heatmaps were drawn using Origin 2021. We applied redundancy analysis (RDA) to explore the associations between the explanation variables (i.e., the C, N, and P contents of the soil and litter and their stoichiometric ratios) and the soil enzyme activity variables. The RDA was carried out in Canoco 5.0 (Centre for Biometry, Wageningen, The Netherlands) to reveal the environmental sources of variance that were driving the differences found in the soil enzyme activity of the different vegetation types.

3. Results

3.1. The C, N, and P Stoichiometric Characteristics and Soil Enzyme Activity of Litter and Soil in Different Vegetation Types

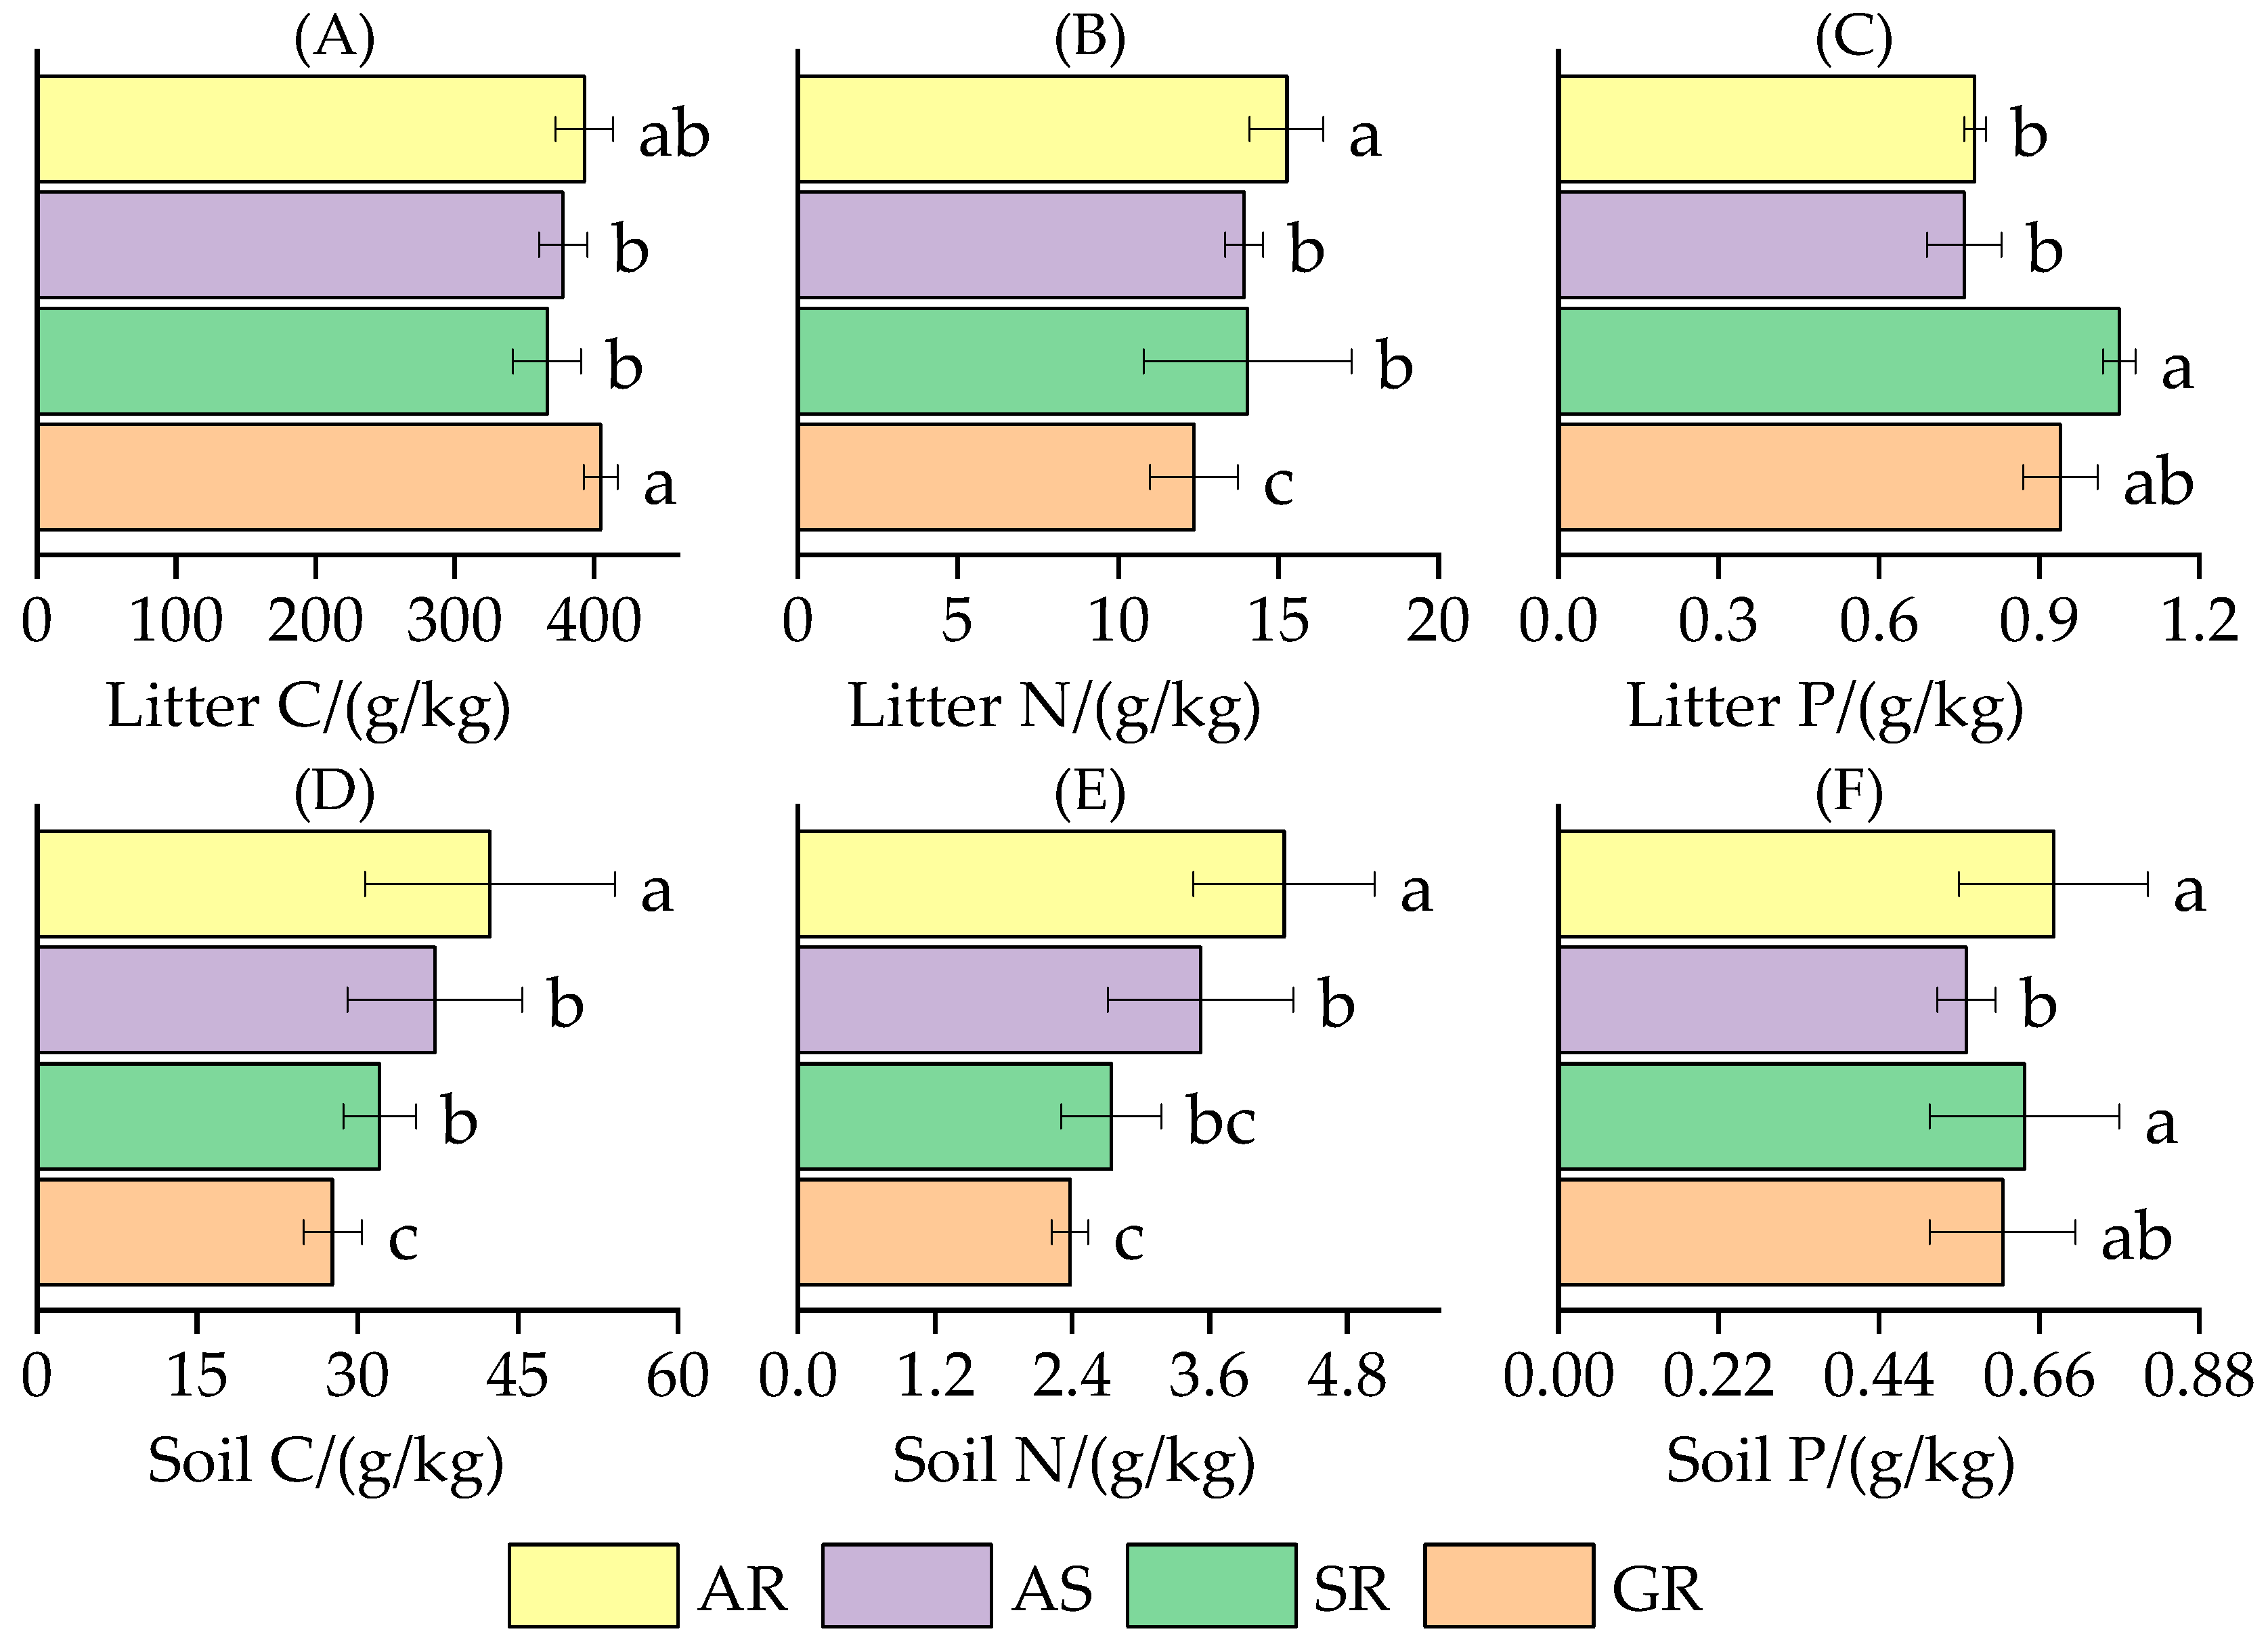
3.1.1. The C, N, and P Content Characteristics of Litter and Soil

The average C content in the litter in this area was 366.2–404.48 g/kg and the contents in the various vegetation types were ranked as follows: grassland > arbor forest > arbor and shrub compound forest > shrubland. The grassland had a significantly higher C content than arbor and shrub compound forest and shrubland (p < 0.05, the same below) (Figure 2A). The average N content in the litter was 12.37–15.26 g/kg, with the highest value observed in the arbor forest and the lowest value observed in the grassland (Figure 2B). The average P content in the litter was 0.76–1.05 g/kg, with the highest value observed in the shrubland (Figure 2C). The average C and N contents in the soil were 27.69–42.4 g/kg and 2.38–4.25 g/kg, respectively. The arbor forest had significantly higher C and N contents than the other three vegetation types, which were ranked as follows: arbor forest > arbor and shrub compound forest > shrubland > grassland (Figure 2D,E). The average P content in the soil was 0.56–0.68 g/kg and the arbor forest and shrubland had significantly greater P content than the arbor and shrub compound forest (Figure 2F). In general, the distributions of litter and soil nutrients varied with the vegetation types, but the two forest areas had certain advantages over the grassland area.

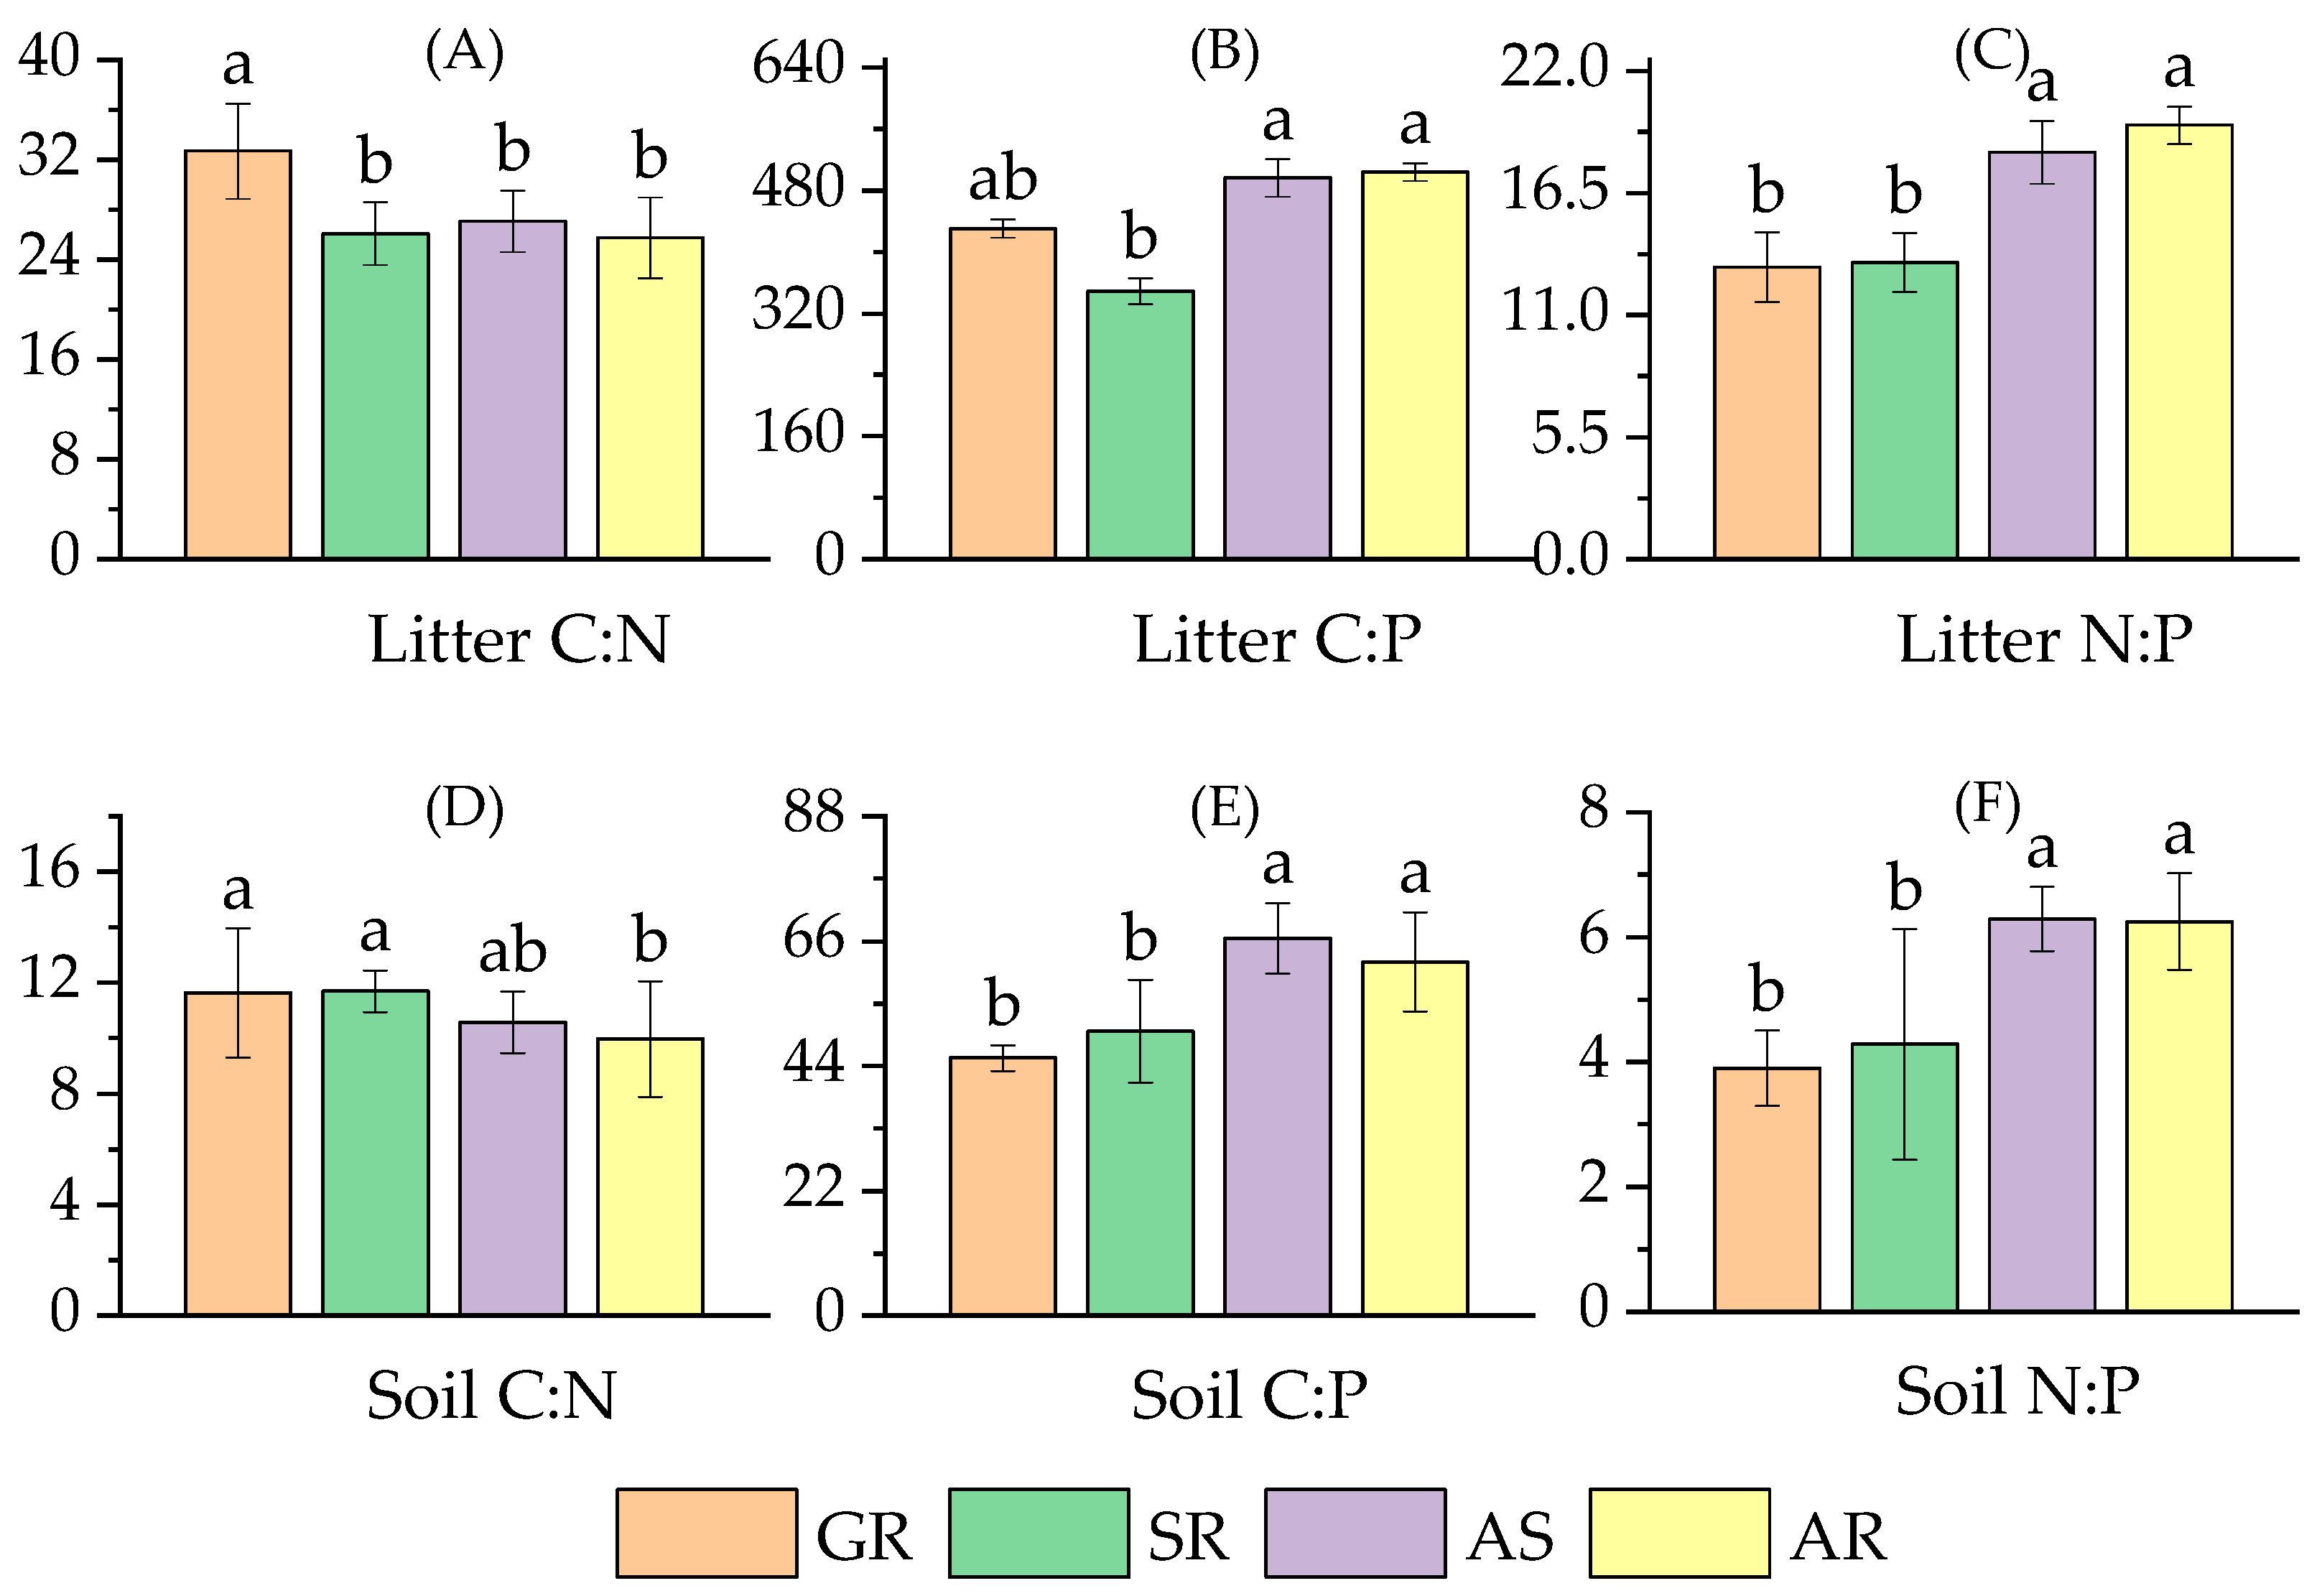
3.1.2. The Stoichiometric Characteristics of Litter and Soil

The litter C:N, C:P, and N:P ratios were 25.76–32.70, 348.76–502.88, and 13.15–19.56, respectively (Figure 3A–C). The litter C:N ratio was the highest in the grassland and the differences in the C:N ratio between the other three vegetation types were not obvious (Figure 3A). The C:P and N:P ratios in the litter were greater in the arbor forest and arbor and shrub compound forest than in the grassland and shrubland (Figure 3B,C). The differences in the C:N, C:P, and N:P ratios in the litter of different vegetation types were similar to those in the C, N, and P content of the litter, indicating that the communities of different vegetation types could adapt to their environments to meet their own growth needs by coordinating the nutrient stoichiometric characteristics. The soil C:N, C:P, and N:P ratios were 9.98–11.71, 45.39–66.52, and 3.9–6.29, respectively (Figure 3D–F). The soil C:N ratio in the arbor forest was significantly lower than that in the shrubland and grassland, but there was no significant difference in C:N ratio between the arbor forest and arbor and shrub compound forest (Figure 3D). The soil C:P and N:P ratios were ranked as follows: arbor and shrub compound forest > arbor forest > shrubland > grassland. The C:P and N:P ratios in the grassland and shrubland were significantly lower than those in the arbor forest and arbor and shrub compound forest (Figure 3E,F). To sum up, the communities in the different vegetation types had different nutrient accumulation, decomposition, and return characteristics.

3.1.3. Characteristics of Soil Enzyme Activity

As shown in Figure 4, the ALP, Suc, Ure, and CAT activity varied as follows: 6.38–17.45, 13.17–26.11, 0.69–1.35, and 10.87–21.81, respectively. All selected enzymes demonstrated the highest activity in the arbor forest, followed by the arbor and shrub compound forest, shrubland, and grassland. The alkaline phosphatase and catalase activity was significantly different among the different vegetation types, except between the arbor and shrub compound forest and shrubland (Figure 4A,D). There were no significant differences in soil sucrase activity between the arbor forest, arbor and shrub compound forest, and shrubland, but the activity in these types was significantly higher than that of grassland soil (Figure 4B). The urease activity in the arbor forest was significantly higher than that in the shrubland and grassland (Figure 4C). In general, out of the different vegetation types, the soil enzyme activity was the strongest in the arbor forest area.

3.2. Correlation Analysis of the C, N, and P Stoichiometric Characteristics of Litter and Soil and Soil Enzyme Activity

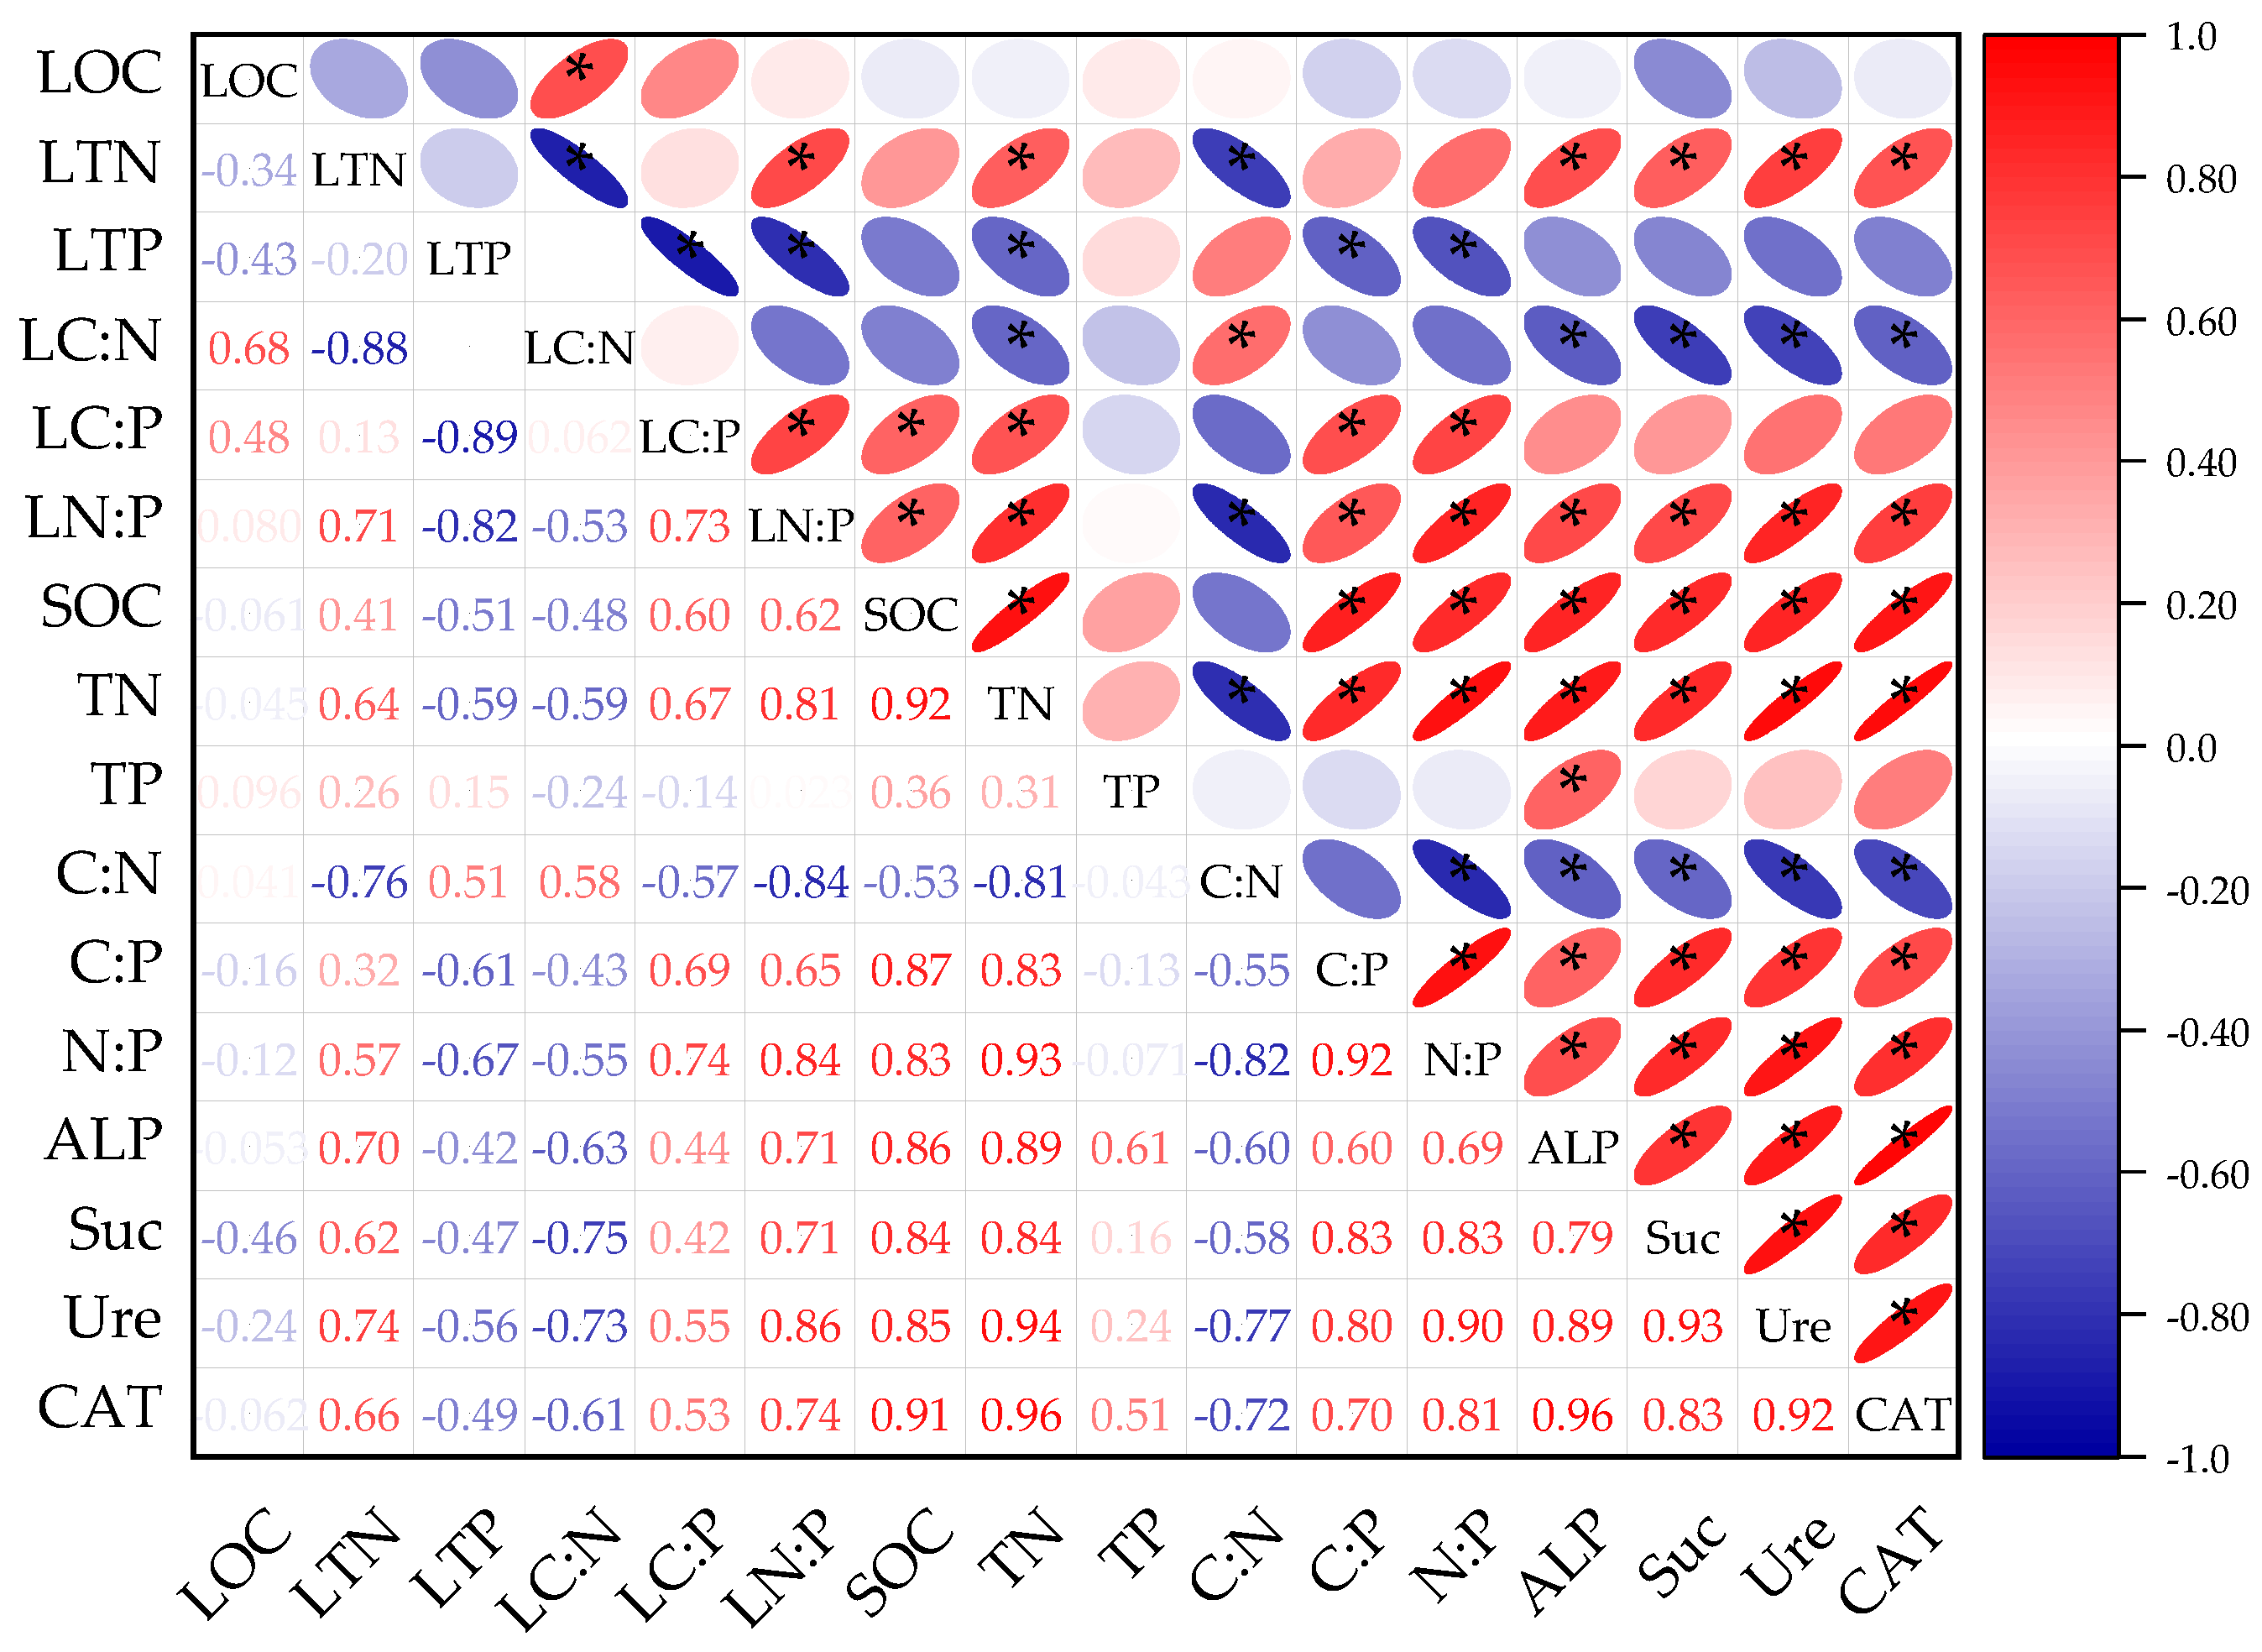
3.2.1. Correlation Analysis of Litter and Soil C, N, and P Stoichiometric Characteristics

As shown in Figure 5, there were significant correlations between the litter C:P and N:P ratios and the soil C:P and N:P ratios. It was also noted that the soil N content had a significant correlation with the litter N and P contents and stoichiometric ratio, indicating that the nutrient stoichiometry of the soil and litter was closely related. However, the correlations between the soil C and P content and C:P and N:P ratios and the litter C and N content and C:N ratio were weak and there were no significant correlations between the soil P content and the litter nutrient contents or stoichiometric ratios, indicating that the nutrients in the litter were not completely absorbed and transformed by the soil.

3.2.2. Correlation Analysis of Litter C, N, and P Stoichiometric Ratio and Soil Enzymes

As shown in Figure 5, the litter N content and C:N and N:P ratios were significantly correlated with the activity of four soil enzymes, while litter C and P content and the C:P ratio were weakly correlated with the activity of the four enzymes. It could be seen that the nitrogen content in the litter was closely related to the activity of the four soil enzymes, indicating that their interactors could maintain the nutrient balance in the ecosystems.

3.2.3. Correlation Analysis of Soil C, N, and P and Soil Enzymes

Unlike those in the litter, the soil nutrients (except for the P element) and their stoichiometric characteristics had strong correlations with the activity of four soil enzymes. Among them, the soil C:N ratio was negatively correlated with the activity of four soil enzymes, while the soil C and N contents and C:P and N:P ratios were positively correlated with the activity of the four soil enzymes (Figure 5).

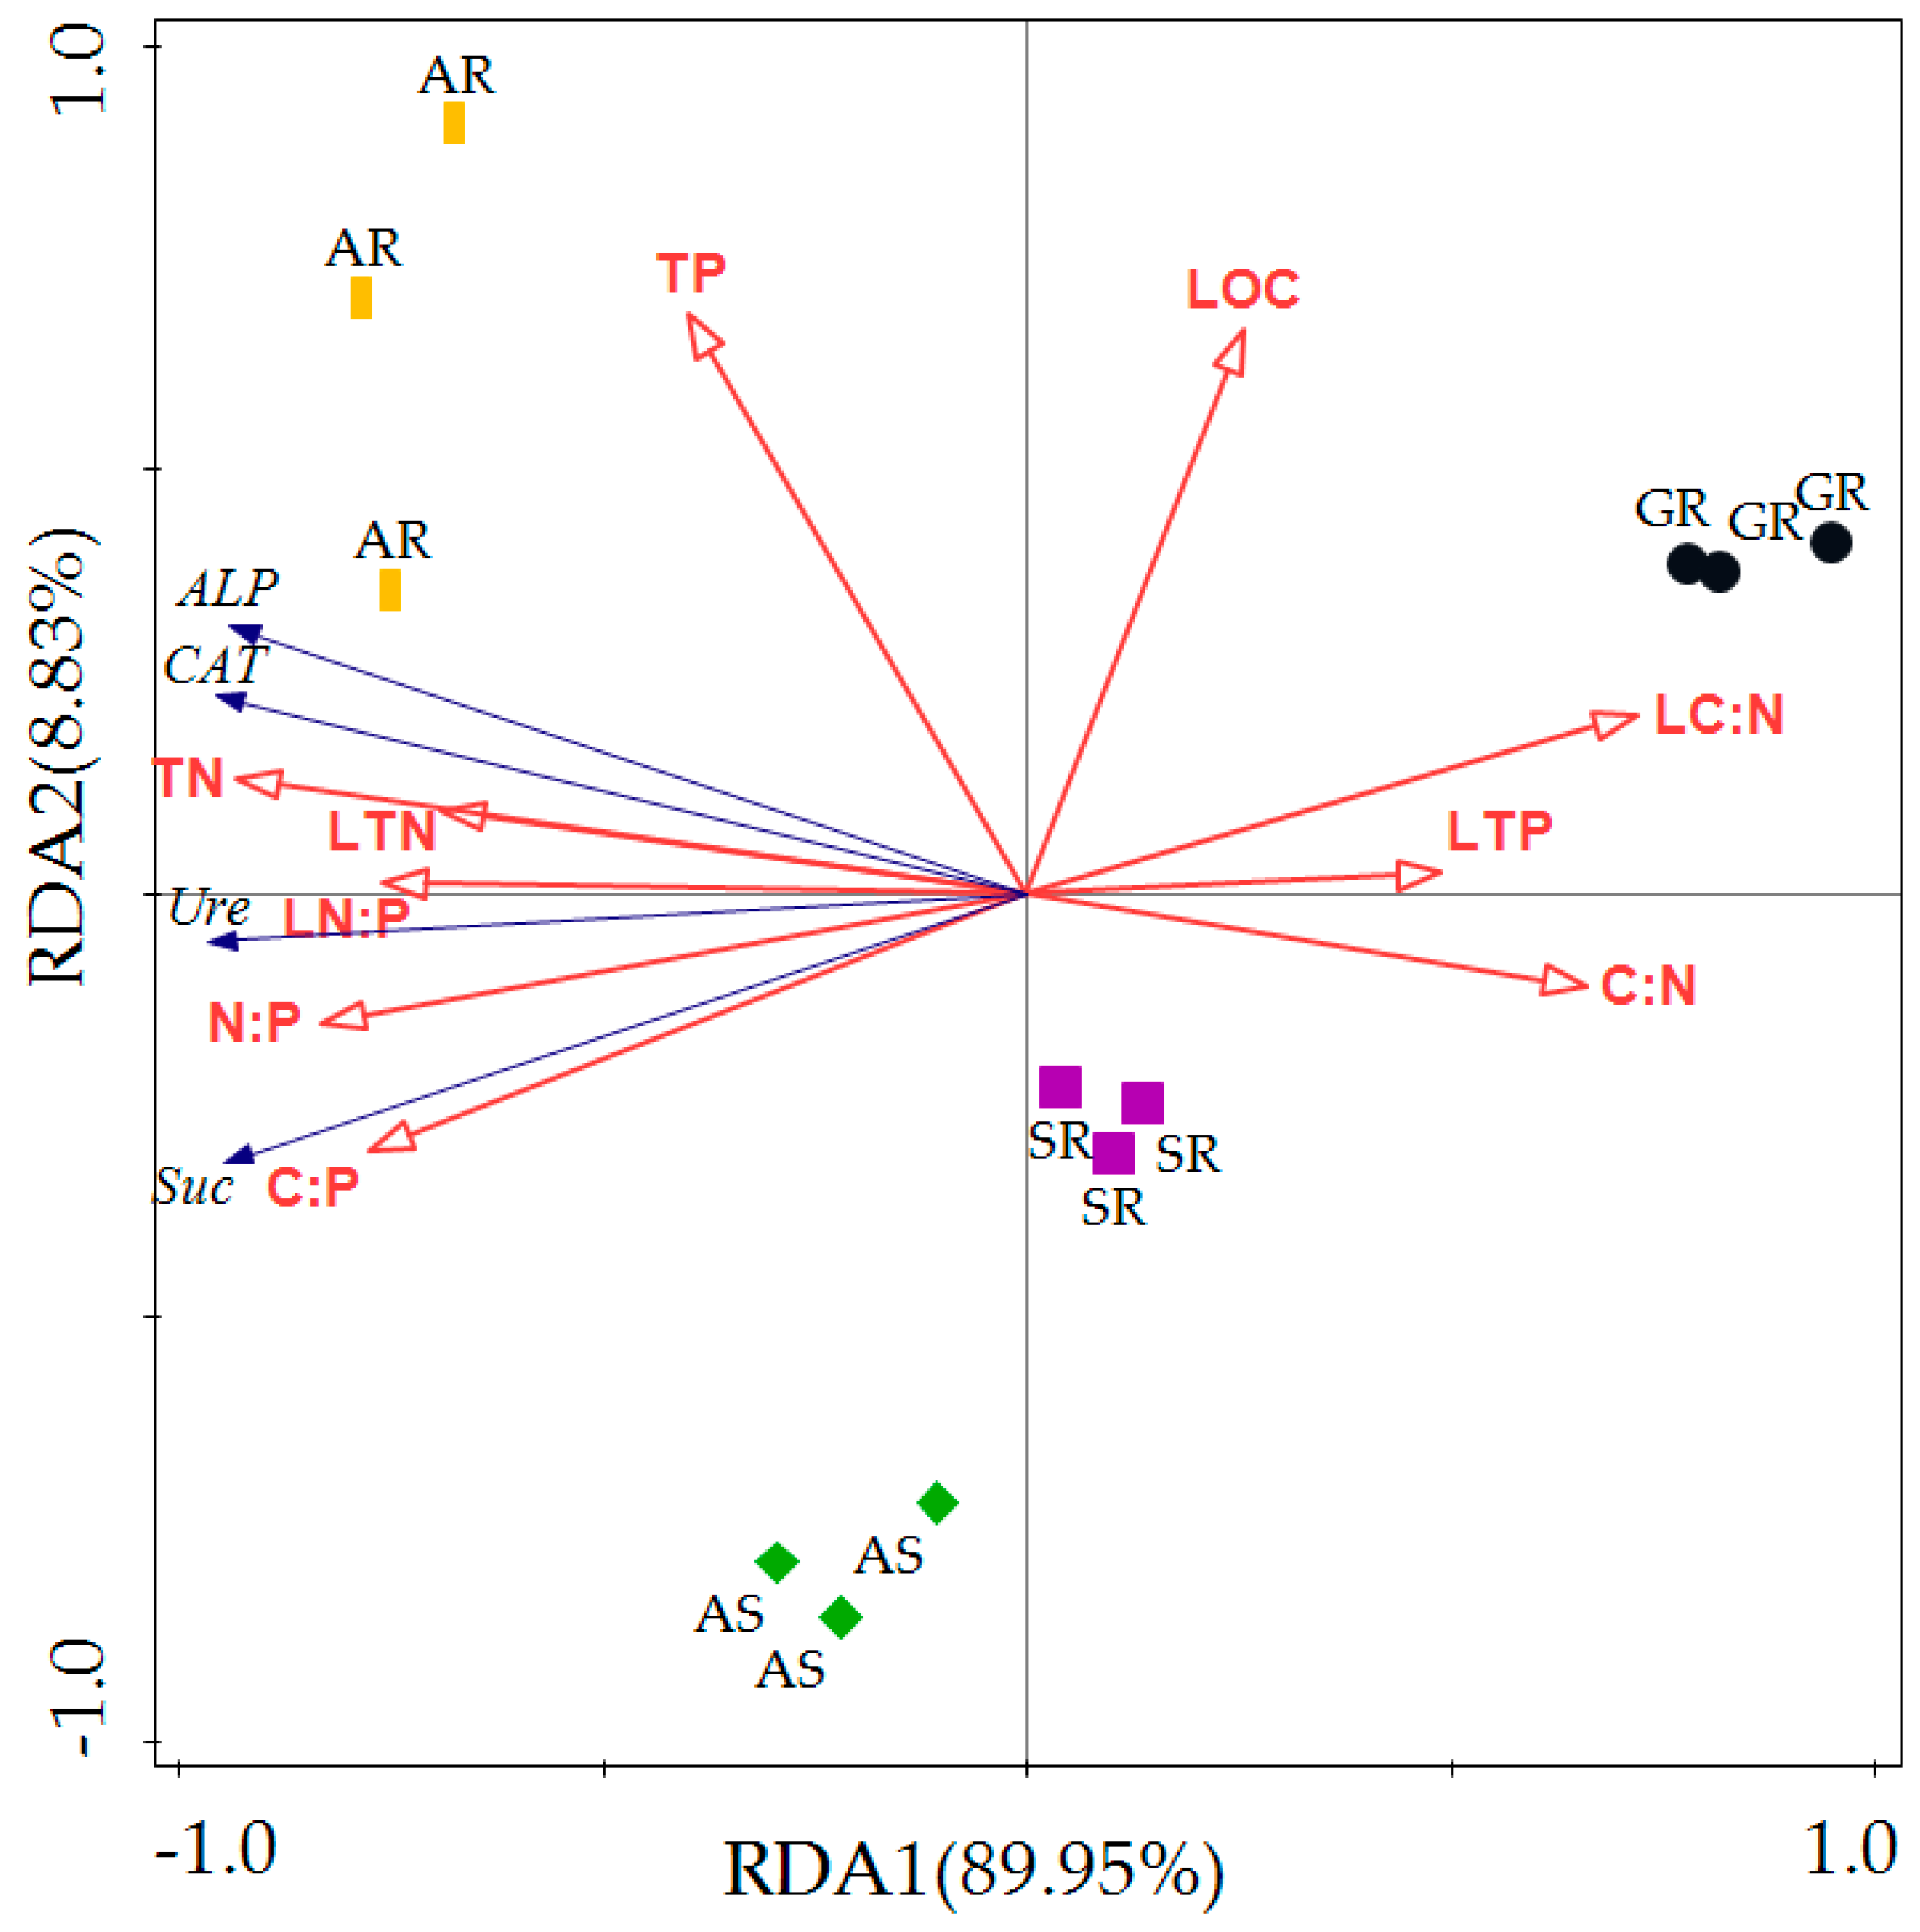
3.3. Analysis of Factors Affecting Soil Enzyme Activity

A total of 12 indicators of litter and soil nutrient content and stoichiometric ratios were identified as being environmental factors that affected soil enzyme activity in our principal component analysis. We kept 10 environmental factors, and of which pseudo-F > 0.1. The RDA results showed that the first and second axes could explain 89.95% and 8.83% of the soil enzyme activity, respectively, and that the two axes could explain 98.78% of the difference information (Table 2). The TN content and N:P and C:P ratios of the soil could explain 78.2% (p < 0.01), 62.5% (p < 0.01), and 54.8% (p < 0.01) of the variation in the soil enzyme activity, respectively, and were the main three environmental factors that affected soil enzyme activity (Table 3).
As shown in Figure 6 (demonstrated by the length of the arrows and the angles between the arrow and the enzyme activity), it could be seen that the TN content and N:P and C:P ratios of the soil were positively correlated with the activity of four soil enzymes, indicating that these three factors could well explain the change in the soil enzyme activity. The angles between the TN content of the soil and the activity of the soil CAT and ALP were the smallest, indicating that the TN content of the soil had significant positive effects on the activity of these two soil enzymes. The angle between the soil Ure activity and the soil N:P ratio arrow line was the smallest, indicating that the stoichiometric characteristics of the TN and TP contents in the soil had a significant impact on Ure activity. The stoichiometric characteristics of the SOC and TP contents significantly affected the soil Suc activity. By observing the positions of the different vegetation types within the quadrants in the figure, it could be seen that the soil enzyme activity in the arbor forest and arbor and shrub compound forest was more significantly affected by the nutrient cycling in the soil and litter than that in the grassland and shrubland.

4. Discussion

4.1. The C, N, and P Stoichiometric Characteristics of Litter and Soil

4.1.1. Stoichiometric Characteristics of Litter Nutrients in Different Vegetation Types

Litter, as a “warehouse” for storing organic matter and nutrients in forest ecosystems, can provide 70%–90% of nutrients for forest ecosystems through microbial decomposition [27]. At the same time, it is also closely related to soil and vegetation nutrients and can affect the flow of nutrients and energy within entire terrestrial ecosystems [28]. The average C, N, and P contents in the litter in the study area were 366.2–404.48 g/kg, 12.37–15.26 g/kg, and 0.76–1.05 g/kg, respectively. Compared to other karst areas, the litter C and P contents in this study area were lower than those in the Baiyun District of Guizhou Province [29] and there were different land use types in southwestern China [30]; however, the N content was higher than that in other regions [29,30]. The nutrient characteristics of the litter were different from those in other karst areas, mainly due to the following two reasons: firstly, the dominant tree species in communities have the greatest impacts on the nutrient contents of the litter and the dominant species in the study area were largely different from those in the other regions; secondly, the latitude, altitude, and aspect of the study area were different from those of the other regions. These factors affected the nutrient absorption and utilization strategies of the vegetation types to a large extent, making the stoichiometric characteristics of the litter different between the various vegetation types. Compared to the non-karst areas, the litter C content in the study area was lower than the national average across China [31]. The low C content in the study area was related to the survival strategy adopted by the vegetation when adapting to the environment. In general, vegetation in subtropical regions survives in harsh environments by reducing its demand for nutrients [32,33], which was why the litter C content in the study area was low. The N content in the study area was higher than the global average [34]. The high nitrogen content of the litter could have been due to the higher levels of rainfall in the study area. Vegetation only absorbs high-mobility nitrogen [9] and the average annual rainfall of 1129.5 mm in the study area could have increased the absorption of nitrogen by the vegetation. The P content in the study area was comparable to the global average [34].
The C:N ratio of litter can be used to indicate the decomposition rate of organic matter [35]; the higher the C:N ratio, the slower the litter decomposition [36]. In this study, the C:N ratio of the grassland litter was significantly higher than that of the other vegetation types, showing that the decomposition rate of the grassland litter was slow, which was not conducive to the reabsorption and utilization of nutrients. This could have been due to the fact that grassland environments are not conducive to decomposition by microorganisms, and so the degree of decomposition was not high. Previous studies have shown that the litter N:P ratio is a main factor affecting litter decomposition and the nutrient return rate [37,38,39]. When the N:P ratio is small, it indicates that the litter decomposition rate is faster and not conducive to nutrient storage. When N:P > 25, it is conducive to nutrient storage [33,40]. When the N:P ratio of the litter in this study was 13.15–19.56, it indicated that the nutrient storage capacity of the litter in the study was generally weak. The N:P ratios in the arbor forest and arbor and shrub compound forest area were significantly higher than those in the shrubland and grassland, indicating that the arbor forest and arbor and shrub compound forest were conducive to nutrient migration and circulation, as well as nutrient storage. Therefore, it is more conducive to improving the adaptability of vegetation to the environment and the ability of ecosystem nutrient regulation by using arbor forest and arbor and shrub compound forest to carry out vegetation restoration in karst areas. These results confirmed our first hypothesis, i.e., different vegetation types have different litter stoichiometric characteristics and arbor forest vegetation is more conducive to nutrient accumulation and circulation.

4.1.2. Stoichiometric Characteristics of Soil Nutrients in Different Vegetation Types

As an important part of forests, soil is the carrier of vegetation growth and its nutrient contents determine the growth of vegetation. The average C, N, and P contents in the soil in the study area were 27.69–42.4 g/kg, 2.38–4.25 g/kg, and 0.56–0.68 g/kg, respectively. Among them, the C and N content were significantly higher than the national averages of 24.56 and 1.88 g/kg, and the P content was slightly lower than the national average of 0.75 g/kg [41]. This was largely due to the fact that the study area was located in a subtropical region, with abundant rain and heat resources and surface soil with strong “self-fertilization” ability of surface soil [42]. However, the C, N, and P contents of the soil were lower than those in other karst areas [30], indicating that it is still necessary to improve the potential and capacity of the soil nutrient supply by means of vegetation restoration. N and P are necessary mineral nutrients in soil and are limiting elements for vegetation growth. The total nitrogen content of the soil in the study area was significantly correlated with the litter N and P contents and stoichiometric ratios (Figure 5), which means that the soil nutrients were significantly affected by the litter. There was a strong coupling relationship between the soil nitrogen content and the litter nutrients. Soil inherits the nutrient characteristics of litter and the N in litter participates in the nutrient cycles of ecosystems by being utilized by soil. There were no significant correlations between the soil P content and the litter nutrients or stoichiometric ratios, mainly because the litter P content had a certain stability [43] and was largely preserved in litter, while the soil P content was mainly produced by rock weathering [44].
The soil C:N ratio is inversely proportional to the decomposition rate and mineralization of organic matter. In this study, the soil C:N ratio in the arbor forest was significantly lower than those in the grassland and shrubland, showing that the decomposition rate of soil organic matter in the arbor forest was faster, which was more conducive to the circulation and utilization of nutrients within the ecosystem. This could have been due to the sufficient C and N contents in the soil of the arbor forest and the soil having a strong ability to utilize nutrients, which reflected that the arbor forest vegetation had stronger ecological adaptability via the coordination of nutrient stoichiometry. The N:P ratio reflects the type of soil nutrient limitation [45,46]. The N:P ratios in the arbor forest and arbor and shrub compound forest in the study area were significantly higher than those in the grassland and shrubland, indicating that the grassland and shrubland were susceptible to N limitation, while the arbor forest and arbor and shrub compound forest were more susceptible to P limitation. This confirmed our second hypothesis, i.e., different types of vegetation have different types of nutrient limitation within ecosystems. The soil N:P ratio in the study area was 3.9–6.29. Compared to other karst areas, the soil N:P ratio in the study area was higher than that in the karst Maolan forest soil [47], but slightly lower than that in the Guizhou dolomite area [29], and close to that in the karst area in southwestern China [30]. However, it was significantly lower than the average soil N:P ratio across China (9.30) [41] and the global forest soil ratio (13.10) [48]. This showed that the N content in the study area was generally at the average level of the karst area, but was lower than the global average, indicating that the karst areas are generally limited by N. This could be because the unique “dual aboveground-underground dual structures” of karst areas cause serious soil erosion and soil fertility loss. It could also have been related to the poor nitrogen fixation ability of vegetation in the study area. The current nutrient limitation patterns could be changed by increasing the input of nitrogen in the study area.

4.2. Characteristics of Soil Enzyme Activity and Its Internal Correlation with the Stoichiometry of Litter and Soil

4.2.1. Characteristics of Soil Enzyme Activity in Different Vegetation Types

Soil alkaline phosphatase, sucrase, urease, and catalase in soil are the catalysts of soil nutrient biochemical cycles. Their activities can indicate soil quality and function [49], and are affected by litter composition, root development, microbial activity, and soil organic matter content [50]. The activity of the four soil enzymes in our study area was the highest in the arbor forest and lowest in the grassland. This could have been because the grassland vegetation species were relatively singular, the litter return rate of the nutrient components was low, the soil humus was weak, the microbial living environments were unstable, and the soil enzyme activity was inhibited. Due to the more developed root systems and abundant litter species, the arbor forest had higher primary productivity. Compared to the grassland area, the root systems in the arbor forest were more developed, the litter species were richer, and the primary productivity was higher. The understory environment was also more conducive to improving microbial activity and forming better nutrient-coupling mechanisms [51]; so, the soil enzyme activity was higher. The higher activity of the soil enzymes in the arbor forest indicated that with the restoration of vegetation in the karst area, the nutrient limitation type changed from nitrogen limitation to phosphorus limitation [52]. It could be seen that in the process of vegetation restoration in the karst areas, on the basis of paying attention to the protection of existing arbor forests, the soil enzyme activity can be effectively improved by rationally allocating the proportion of arbors in the stand, thus optimizing the nutrient cycling mechanism of the ecosystem.

4.2.2. Relationships between the Nutrients, Chemometrics, and Soil Enzyme Activity of Litter and Soil

The correlation results showed that the soil C and N content and N:P and C:P ratios were most closely related to the activity of four soil enzymes. C, N, and P in soil are essential nutrients for plant growth that affect soil microbial metabolism and are closely related to soil enzyme activity [51,53]. The activities of the four enzymes were significantly correlated with the C, N, and P stoichiometric characteristics, which also proved that soil enzymes were the driving factors of soil nutrient transformation and circulation. The activity of the four enzymes was also significantly correlated with C, N, and P stoichiometric characteristics (Figure 5), which also proved that soil enzymes were the driving factors of soil nutrient transformation and circulation. The redundancy analysis showed that N was the nutrient with the highest correlation with soil enzyme activity and could explain 78.1% of the enzyme activity in this study (Table 2 and Table 3), indicating that the transportation of N within the ecosystem and the release of available N significantly affected soil enzyme activity. This confirmed our third hypothesis, i.e., the effects of nutrients and stoichiometric indicators on soil enzyme activity are inconsistent. The arbor forest area had the highest soil enzyme activity due to its higher soil N content, faster organic matter decomposition rate, and higher degrees of organic carbon accumulation and mineralization. The slow decomposition rate of litter in the grassland and shrubland aggravated the N limitation of these vegetation types, and thus soil enzyme activity was inhibited. In summary, the correlations between soil nutrient and stoichiometric characteristics and soil enzyme activity played important roles in regulating the activation, circulation, and accumulation of nutrients in the ecosystems during vegetation restoration processes in the studied karst area.

5. Conclusions

Overall, the different vegetation types had significant effects on litter and soil stoichiometry and soil enzyme activity. Specifically, the litter N content and soil C and N contents were significantly higher in the arbor forest than in the other vegetation types. The activity of alkaline phosphate and catalase was significantly higher in the arbor forest, while sucrase and urease activity was significantly higher in arbor forest and arbor and shrub compound forest than in the other vegetation types. In the process of ecological environment construction in karst areas, we should pay attention to protecting existing arbor and reasonably increasing the proportion of arbor within the ecosystem. The soil N content was significantly correlated with litter nutrients and stoichiometry, while the soil P content was weakly correlated with litter nutrients and stoichiometry, indicating that nutrients were transported and transformed between the litter and soil, but were not completely inherited. Furthermore, by analyzing the ecological stoichiometric characteristics, it could be seen that the four vegetation types were all limited by the N element. In addition, the results of the redundancy analysis showed that the soil N content could best explain the variance in soil enzyme activity. Therefore, in order to promote vegetation restoration in karst areas, the nitrogen content of the ecosystems should be increased by applying nitrogen fertilizers or by planting nitrogen-fixing tree species. Compared to grassland and shrubland, arbor forest and arbor and shrub compound forest were more restricted by the P element. It has been suggested that the input of P into ecosystems needs to be increased in the later stages of vegetation restoration in karst areas. This study could not only help us to understand the effects of vegetation types on litter and soil stoichiometry and soil enzyme activity, but also have important significance for vegetation restoration and management strategies in karst areas.

Author Contributions

Conceptualization, Q.D.; data curation, M.Z.; investigation, L.Z. and P.D.; methodology, P.D. and H.Z.; software, Z.H. and L.Z.; writing—original draft, M.Z.; writing—review and editing, Q.D. All authors have read and agreed to the published version of the manuscript.

Funding

This research was supported by the National Natural Science Foundation of China (42167044) and the foundation of Guizhou University Cultivation ([2019]10).

Data Availability Statement

The data presented in this study are available upon request from the corresponding author.

Conflicts of Interest

The authors declare no conflict of interest.

References

  1. Yu, M.; Tao, Y.; Liu, W.; Xing, W.; Liu, G.; Wang, L.; Ma, L. C, N, and P stoichiometry and their interaction with different plant communities and soils in subtropical riparian wetlands. Environ. Sci. Pollut. Res. 2020, 27, 1024–1034. [Google Scholar] [CrossRef] [PubMed]
  2. Yang, Y.; Liu, B.; An, S. Ecological stoichiometry in leaves, roots, litters and soil among different plant communities in a desertified region of Northern China. Catena 2018, 166, 328–338. [Google Scholar] [CrossRef]
  3. Wang, J.; Chen, G.; Zou, G.; Song, X.; Liu, F. Comparative on plant stoichiometry response to agricultural non-point source pollution in different types of ecological ditches. Environ. Sci. Pollut. Res. 2019, 26, 647–658. [Google Scholar] [CrossRef]
  4. Huang, D.; Wang, D.; Ren, Y. Using leaf nutrient stoichiometry as an indicator of flood tolerance and eutrophication in the riparian zone of the Lijang River. Ecol. Indic. 2019, 98, 821–829. [Google Scholar] [CrossRef]
  5. Wang, Z.; Lv, S.; Song, H.; Wang, M.; Zhao, Q.; Huang, H.; Niklas, K.J. Plant type dominates fine-root C:N:P stoichiometry across China: A meta-analysis. J. Biogeogr. 2020, 47, 1019–1029. [Google Scholar] [CrossRef]
  6. Zhang, J.; Zhao, N.; Liu, C.; Yang, H.; Li, M.; Yu, G.; Wilcox, K.; Yu, Q.; He, N. C:N:P stoichiometry in China’s forests: From organs to ecosystems. Funct. Ecol. 2017, 32, 50–60. [Google Scholar] [CrossRef] [Green Version]
  7. Liu, X.; Ma, J.; Ma, Z.; Li, L. Soil nutrient contents and stoichiometry as affected by land-use in an agro-pastoral region of northwest China. Catena 2017, 150, 146–153. [Google Scholar] [CrossRef]
  8. Xiao, C.; Janssens, I.A.; Zhou, Y.; Su, J.; Liang, Y.; Guenet, B. Strong stoichiometric resilience after litter manipulation experiments; a case study in a Chinese grassland. Biogeosciences 2015, 12, 757–767. [Google Scholar] [CrossRef] [Green Version]
  9. Bai, X.; Wang, B.; An, S.; Zeng, Q.; Zhang, H. Response of forest species to C:N:P in the plant-litter-soil system and stoichiometric homeostasis of plant tissues during afforestation on the Loess Plateau, China. Catena 2019, 183, 104186. [Google Scholar] [CrossRef]
  10. Seitz, S.; Goebes, P.; Zumstein, P.; Assmann, T.; Kühn, P.; Niklaus, P.A.; Schuldt, A.; Scholten, T. The influence of leaf litter diversity and soil fauna on initial soil erosion in subtropical forests. Earth Surf. Proc. Land. 2015, 40, 1439–1447. [Google Scholar] [CrossRef]
  11. Horodecki, P.; Jagodziński, A.M. Tree species effects on litter decomposition in pure stands on afforested post-mining sites. Forest Ecol. Manag. 2017, 406, 1–11. [Google Scholar] [CrossRef]
  12. Bahnmann, B.; Mašínová, T.; Halvorsen, R.; Davey, M.L.; Sedlák, P.; Tomšovský, M.; Baldrian, P. Effects of oak, beech and spruce on the distribution and community structure of fungi in litter and soils across a temperate forest. Soil Biol. Biochem. 2018, 119, 162–173. [Google Scholar] [CrossRef]
  13. Huang, L.; Hu, H.; Bao, W.; Hu, B.; Liu, J.; Li, F. Shifting soil nutrient stoichiometry with soil of variable rock fragment contents and different vegetation types. Catena 2023, 220, 106717. [Google Scholar] [CrossRef]
  14. Joshi, R.K.; Garkoti, S.C. Influence of vegetation types on soil physical and chemical properties, microbial biomass and stoichiometry in the central Himalaya. Catena 2023, 222, 106835. [Google Scholar] [CrossRef]
  15. Zhou, Y.; Boutton, T.W.; Wu, X.B. Soil C:N:P stoichiometry responds to vegetation change from grassland to woodland. Biogeochemistry 2018, 140, 341–357. [Google Scholar] [CrossRef]
  16. Song, M.; Peng, W.; Du, H.; Xu, Q. Responses of Soil and Microbial C:N:P Stoichiometry to Vegetation Succession in a Karst Region of Southwest China. Forests 2019, 10, 755. [Google Scholar] [CrossRef] [Green Version]
  17. Li, Y.; Wu, J.; Liu, S.; Shen, J.; Huang, D.; Su, Y.; Wei, W.; Syers, J.K. Is the C:N:P stoichiometry in soil and soil microbial biomass related to the landscape and land use in southern subtropical China? Global Biogeochem. Cycles 2012, 26, 4. [Google Scholar] [CrossRef]
  18. Zeng, Q.; Chen, Z.; Tan, W. Plant litter quality regulates soil eco-enzymatic stoichiometry and microbial nutrient limitation in a citrus orchard. Plant Soil 2021, 466, 179–191. [Google Scholar] [CrossRef]
  19. Burns, R.G.; DeForest, J.L.; Marxsen, J.; Sinsabaugh, R.L.; Stromberger, M.E.; Wallenstein, M.D.; Weintraub, M.N.; Zoppini, A. Soil enzymes in a changing environment: Current knowledge and future directions. Soil Biol. Biochem. 2013, 58, 216–234. [Google Scholar] [CrossRef]
  20. Lan, G.; Liu, C.; Wang, H.; Tang, W.; Wu, X.; Yang, H.; Tu, L.; Hu, B.X.; Cao, J.; Li, Q. The effect of land use change and soil redistribution on soil organic carbon dynamics in karst graben basin of China. J. Soils Sediments 2021, 21, 2511–2524. [Google Scholar] [CrossRef]
  21. Pardo-Igúzquiza, E.; Dowd, P.A.; Ruiz-Constán, A.; Martos-Rosillo, S.; Luque-Espinar, J.A.; Rodríguez-Galiano, V.; Pedrera, A. Epikarst mapping by remote sensing. Catena 2018, 165, 1–11. [Google Scholar] [CrossRef]
  22. Xue, F.; Long, C.; Liao, Q.; Xiong, L. An analysis of litter, soil, stoichiometry, and soil enzymes in karst forest. J. For. Environ. 2020, 40, 449–458. [Google Scholar] [CrossRef]
  23. Gong, J.; Hou, W.; Liu, J.; Malik, K.; Kong, X.; Wang, L.; Chen, X.; Tang, M.; Zhu, R.; Cheng, C.; et al. Effects of Different Land Use Types and Soil Depths on Soil Mineral Elements, Soil Enzyme Activity, and Fungal Community in Karst Area of Southwest China. Int. J. Environ. Res. Public Health 2022, 19, 3120. [Google Scholar] [CrossRef]
  24. WRB. World Reference Base for Soil Resources; FAO, ISRIC, ISSS: Rome, Italy, 2006. [Google Scholar]
  25. Bao, S. Soil and Agricultural Chemistry Analysis; China Agricultural Press: Beijing, China, 2000; pp. 178–200. [Google Scholar]
  26. Guan, S. Study Way of Soil Enzymes; China Agricultural Press: Beijing, China, 1986; p. 376. [Google Scholar]
  27. Yanghua, Y.; Xinping, Z.; Hong, L. Ecological stoichiometry of Zanthoxylum planispinum var. dintanensis plantation at different altitudes in rocky desertification area of central Guizhou. Acta Ecol. Sin. 2019, 39, 5536–5545. [Google Scholar] [CrossRef]
  28. Zhang, Z.; Song, X.; Lu, X.; Xue, Z. Ecological stoichiometry of carbon, nitrogen, and phosphorus in estuarine wetland soils: Influences of vegetation coverage, plant communities, geomorphology, and seawalls. J. Soils Sediments 2013, 13, 1043–1051. [Google Scholar] [CrossRef]
  29. Yu, Y.; Li, Y.; Wang, J.; Song, Y. Leaf-litter-soil stoichiometry and carbon and nitrogen isotopes of plant communities in dolomite district in Guizhou Province. Acta Ecol. Sin. 2022, 42, 3356–3365. [Google Scholar] [CrossRef]
  30. Tian, J.; Sheng, M.; Wang, P.; Wen, P. Influence of Land Use Change on Litter and Soil C, N, P Stoichiometric Characteristics and Soil Enzyme Activity in Karst Ecosystem, Southwest China. Environ. Sci. 2019, 40, 4278–4286. [Google Scholar] [CrossRef]
  31. Wang, J.; Wang, S.; Li, R.; Yan, J.; Sha, L.; Han, S. C:N:P stoichiometric characteristics of four forest types’ dominant tree species in China. Chin. J. Plant Ecol. 2011, 35, 587–595. [Google Scholar]
  32. Sardans, J.; Janssens, I.A.; Alonso, R.; Veresoglou, S.D.; Rillig, M.C.; Sanders, T.G.; Carnicer, J.; Filella, I.; Farré-Armengol, G.; Peñuelas, J. Foliar elemental composition of European forest tree species associated with evolutionary traits and present environmental and competitive conditions. Glob. Ecol. Biogeogr. 2015, 24, 240–255. [Google Scholar] [CrossRef] [Green Version]
  33. Zhang, J.; Li, M.; Xu, L.; Zhu, J.; Dai, G.; He, N. C:N:P stoichiometry in terrestrial ecosystems in China. Sci. Total. Environ. 2021, 795, 148849. [Google Scholar] [CrossRef]
  34. Kang, H.; Xin, Z.; Berg, B.; Burgess, P.J.; Liu, Q.; Liu, Z.; Li, Z.; Liu, C. Global pattern of leaf litter nitrogen and phosphorus in woody plants. Ann. For. Sci. 2010, 67, 811. [Google Scholar] [CrossRef]
  35. Sariyildiz, T. Interactions between litter quality, decomposition and soil fertility: A laboratory study. Soil Biol. Biochem. 2003, 35, 391–399. [Google Scholar] [CrossRef]
  36. Sun, J.; Gao, P.; Li, C.; Wang, R.; Niu, X.; Wang, B. Ecological stoichiometry characteristics of the leaf–litter–soil continuum of Quercus acutissima Carr. and Pinus densiflora Sieb. in Northern China. Environ. Earth Sci. 2019, 78, 20. [Google Scholar] [CrossRef]
  37. Ma, L.; Huang, W.; Guo, C.; Wang, R.; Xiao, C. Soil Microbial Properties and Plant Growth Responses to Carbon and Water Addition in a Temperate Steppe: The Importance of Nutrient Availability. PLoS ONE 2012, 7, e35165. [Google Scholar] [CrossRef] [PubMed]
  38. Xiao, C.; Guenet, B.; Zhou, Y.; Su, J.; Janssens, I.A. Priming of soil organic matter decomposition scales linearly with microbial biomass response to litter input in steppe vegetation. Oikos 2015, 124, 649–657. [Google Scholar] [CrossRef] [Green Version]
  39. Zhang, X.; Wang, Y.; Zhao, Y.; Xu, X.; Lei, J.; Hill, R.L. Litter decomposition and nutrient dynamics of three woody halophytes in the Taklimakan Desert Highway Shelterbelt. Arid. Land Res. Manag. 2017, 31, 335–351. [Google Scholar] [CrossRef]
  40. Pan, F.; Zhang, W.; Wang, K.; He, X.; Liang, S.; Wei, G. Litter C:N:P ecological stoichiometry character of plant communities in typical Karst Peak Cluster Depression. Acta Ecol. Sin. 2011, 31, 335–343. [Google Scholar]
  41. Tian, H.; Chen, G.; Zhang, C.; Melillo, J.M.; Hall, C.A.S. Pattern and variation of C:N:P ratios in China’s soils: A synthesis of observational data. Biogeochemistry 2010, 98, 139–151. [Google Scholar] [CrossRef]
  42. Zeng, Z.; Wang, K.; Liu, X.; Zeng, F.; Song, T.; Peng, W.; Zhang, H.; Du, H. Stoichiometric characteristics of plants, litter and soils in karst plant communities of North west Guangxi. Chin. J. Plant Ecol. 2015, 39, 682–693. [Google Scholar] [CrossRef]
  43. Robbins, C.J.; Matthaeus, W.J.; Cook, S.C.; Housley, L.M.; Robison, S.E.; Garbarino, M.A.; LeBrun, E.S.; Raut, S.; Tseng, C.Y.; King, R.S. Leaf litter identity alters the timing of lotic nutrient dynamics. Freshw. Biol. 2019, 64, 2247–2259. [Google Scholar] [CrossRef]
  44. Liu, R.; Wang, D. C:N:P stoichiometric characteristics and seasonal dynamics of leaf-root-litter-soil in plantations on the loess plateau. Ecol. Indic. 2021, 127, 107772. [Google Scholar] [CrossRef]
  45. Wang, H.; Wu, J.; Li, G.; Yan, L. Changes in soil carbon fractions and enzyme activities under different vegetation types of the northern Loess Plateau. Ecol. Evol. 2020, 10, 12211–12223. [Google Scholar] [CrossRef]
  46. Hättenschwiler, S.; Jørgensen, H.B. Carbon quality rather than stoichiometry controls litter decomposition in a tropical rain forest. J. Ecol. 2010, 98, 754–763. [Google Scholar] [CrossRef]
  47. Zheng, L.; Long, C. Eco-stoichiometric characteristics of soil in different topographical sites of Maolan karst forest. J. Southen Agric. 2020, 51, 545–551. [Google Scholar] [CrossRef]
  48. Cleveland, C.C.; Liptzin, D. C:N:P stoichiometry in soil: Is there a “Redfield ratio” for the microbial biomass? Biogeochemistry 2007, 85, 235–252. [Google Scholar] [CrossRef]
  49. Ananbeh, H.; Stojanović, M.; Pompeiano, A.; Voběrková, S.; Trasar-Cepeda, C. Use of soil enzyme activities to assess the recovery of soil functions in abandoned coppice forest systems. Sci. Total. Environ. 2019, 694, 133692. [Google Scholar] [CrossRef]
  50. Song, X.; Yang, J.; Hussain, Q.; Liu, X.; Zhang, J.; Cui, D. Stable isotopes reveal the formation diversity of humic substances derived from different cotton straw-based materials. Sci. Total. Environ. 2020, 740, 140202. [Google Scholar] [CrossRef]
  51. Margalef, O.; Sardans, J.; Maspons, J.; Molowny Horas, R.; Fernández Martínez, M.; Janssens, I.A.; Richter, A.; Ciais, P.; Obersteiner, M.; Peñuelas, J. The effect of global change on soil phosphatase activity. Glob. Chang. Biol. 2021, 27, 5989–6003. [Google Scholar] [CrossRef]
  52. Yao, L.; Rashti, M.R.; Brough, D.M.; Burford, M.A.; Liu, W.; Liu, G.; Chen, C. Stoichiometric control on riparian wetland carbon and nutrient dynamics under different land uses. Sci. Total. Environ. 2019, 697, 134127. [Google Scholar] [CrossRef]
  53. Xu, Z.; Wang, Y.; Sun, D.; Li, H.; Dong, Y.; Wang, Z.; Wang, S. Soil nutrients and nutrient ratios influence the ratios of soil microbial biomass and metabolic nutrient limitations in mountain peatlands. Catena 2022, 218, 106528. [Google Scholar] [CrossRef]
Figure 1. The location and soil types of the study area.
Forests 14 00771 g001
Figure 2. The carbo, nitrogen, and phosphorus content of litter and soil in different vegetation types. Note: Subfigure (A) = litter carbon content in different vegetation types, subfigure (B) = litter nitrogen content in different vegetation types, subfigure (C) = litter phosphorus content in different vegetation types, subfigure (D) = soil organic carbon content in different vegetation types, subfigure (E) = soil nitrogen content in different vegetation types, and subfigure (F) = soil phosphorus content in different vegetation types. GR = grassland, SR = shrubland, AS = arbor and shrub compound forest, and AR = arbor forest. The error bar shows the standard deviation of the average. Different lowercase letters indicate significant differences at the 0.05 level (p < 0.05) between different vegetation types.
Forests 14 00771 g002
Figure 3. The ecological stoichiometric characteristics of litter and soil in different vegetation types. Note: Subfigure (A) = litter C:N ratio in different vegetation types, subfigure (B) = litter C:P ratio in different vegetation types, subfigure (C) = litter N:P ratio in different vegetation types, subfigure (D) = soil C:N ratio in different vegetation types, subfigure (E) = soil C:P ratio in different vegetation types, and subfigure (F) = soil N:P ratio in different vegetation types. GR = grassland, SR = shrubland, AS = arbor and shrub compound forest, and AR = arbor forest. The error bar shows the standard deviation of the average. Different lowercase letters indicate significant differences at the 0.05 level (p < 0.05) between different vegetation types.
Forests 14 00771 g003
Figure 4. The characteristics of soil enzyme activity in different vegetation types. Note: Subfigure (A) = soil ALP activity in different vegetation types, subfigure (B) = soil Suc activity in different vegetation types, subfigure (C) = soil Ure activity in different vegetation types, and subfigure (D) = soil CAT activity in different vegetation types. GR = grassland, SR = shrubland, AS = arbor and shrub compound forest, and AR = arbor forest. The error bar shows the standard deviation of the average. Different lowercase letters indicate significant differences at the 0.05 level (p < 0.05) between different vegetation types.
Forests 14 00771 g004
Figure 5. The correlation analysis of the nutrient and stoichiometric ratios and soil enzyme activity of litter−soil. Note: SOC, soil organic carbon content (g/kg); TN, soil total nitrogen content (g/kg); TP, soil total phosphorus content (g/kg); LOC, litter carbon content (g/kg); LTN, litter total nitrogen content (g/kg); LTP, litter total phosphorus content (g/kg); C:N, soil C:N ratio; C:P, soil C:P ratio; N:P, soil N:P ratio; LC:N, litter C:N ratio; LC:P, litter C:P ratio; LN:P, litter N:P ratio. * indicates that the correlation was significant at p < 0.05.
Forests 14 00771 g005
Figure 6. The redundancy analysis of soil enzyme activity and nutrient and ecological stoichiometry. Note: GR = grassland, SR = shrubland, AS = arbor and shrub compound forest, and AR = arbor forest. TN, soil total nitrogen content (g/kg); TP, soil total phosphorus content (g/kg); LOC, litter carbon content (g/kg); LTN, litter total nitrogen content (g/kg); LTP, litter total phosphorus content (g/kg); C:N, soil C:N ratio; C:P, soil C:P ratio; N:P, soil N:P ratio; LC:N, litter C:N ratio; LN:P, litter N:P ratio.
Forests 14 00771 g006
Table 1. A basic overview of the sample plots of the various vegetation types.
Vegetation TypeSlope (°)Altitude (m)AspectCommunity Characteristics Dominant Species
Grassland30–401206NWThe community level was singular, consisting of herbs and no or few shrubs that were about 1 m high, with a coverage of more than 90%, accompanied by a small number of thorny shrubs; the litter was about 3–5 cm thick.Imperata cylindrica, Conyza canadensis, Rubus parvifolius
Shrubland30–401184NWThe vertical structure of the community was simple, mainly dominated by a shrub layer, with or without a small number of trees; the shrub layer coverage rate was more than 70%, and the shrub layer height was 1.5–2 m, with a few rattan thorns; the litter was about 1–3 cm thick.Rubus parvifolius, Coriaria nepalensis, Viburnum rhytidophyllum, Rubus coreanus
Arbor and Shrub Compound Forest30–401214NWThe community hierarchy was differentiated, with a height of about 3~12 m; the coverage of woody plants was more than 80%, while the coverage of herbaceous plants under the forest was low, with a small number of Masson’s pines; and the litter was about 3~7 cm thick.Toricellia angulata, Paulownia, Quercus glauca
Arbor Forest40–501222NWThe forest level differentiation was obvious and the tree layer and shrub layers were relatively developed; the tree layer was 10–20 m high, with a coverage rate of up to 80%, and the shrub layer accounted for about 10–20%; there was a small amount of exposed bedrock exposed in the community, with epiphytic lichens; and the litter was about 2–5 cm thick.Cinnamomum camphora, Populus, Quercus glauca, Celtis sinensis
Table 2. The RDA sequencing analysis of soil enzyme activity eigenvalues and interpretations.
StatisticAxis 1Axis 2Axis 3Axis 4
Eigenvalues0.89950.08830.00870.0001
Explained Variation (Cumulative)89.9598.7899.6499.65
Pseudo-Canonical Correlation0.99860.9960.98140.9814
Explained Fitted Variation (Cumulative)90.2699.1399.99100.00
Total Canonical Eigenvalues0.981
Total Eigenvalues1.000
Table 3. The importance ranking and significance test results of the nutrient and ecological stoichiometric interpretation.
NameExplains%Pseudo-Fp
TN78.235.90.002
N:P62.516.70.004
C:P54.812.10.002
LN:P51.810.70.006
LC:N47.18.90.008
LTN437.50.004
C:N39.56.50.014
LTP21.62.80.106
TP18.52.30.146
LOC9.81.10.322
Note: TN, soil total nitrogen content (g/kg); TP, soil total phosphorus content (g/kg); LOC, litter carbon content (g/kg); LTN, litter total nitrogen content (g/kg); LTP, litter total phosphorus content (g/kg); C:N, soil C:N ratio; C:P, soil C:P ratio; N:P, soil N:P ratio; LC:N, litter C:N ratio; LN:P, litter N:P ratio.
Disclaimer/Publisher’s Note: The statements, opinions and data contained in all publications are solely those of the individual author(s) and contributor(s) and not of MDPI and/or the editor(s). MDPI and/or the editor(s) disclaim responsibility for any injury to people or property resulting from any ideas, methods, instructions or products referred to in the content.

