Article

Photosynthetic and Antioxidant Responses of Gymnocarpos przewalskii to Simulated Rainfall Changes

College of Forestry, Gansu Agricultural University, Lanzhou 730070, China
*
Author to whom correspondence should be addressed.
Forests 2023, 14(4), 789; https://doi.org/10.3390/f14040789
Submission received: 15 February 2023 / Revised: 15 March 2023 / Accepted: 4 April 2023 / Published: 12 April 2023
(This article belongs to the Special Issue Advances in Tree Physiology and Ecology under Drought Stress)

Abstract

:
Gymnocarpos przewalskii is a rare Tertiary relict species, mainly distributed in desert areas of northwestern China. Changes in rainfall have a significant impact on the physiological characteristics of desert plants. In the present study, the effects of five simulated rainfall levels on the gas exchange parameters, chlorophyll fluorescence characteristics, and antioxidant system of G. przewalskii were studied. The results show that with increased rainfall the net photosynthetic rate (Pn) and transpiration rate increase significantly. The reduction in Pn is caused by stomatal and non-stomatal limitations under decreased rainfall. Decreased rainfall markedly improves the instantaneous water-use efficiency of leaves. With increased rainfall, the maximum photosynthetic rate, apparent quantum efficiency, and light utilization range significantly increase. Under reduced rainfall, the chlorophyll content, maximum photochemical efficiency of PSII, and steady-state optical quantum efficiency decrease and photoinhibition is caused in the PSII system. A rainfall reduction of 30% leads to massive production of superoxide anions and hydrogen peroxide, causing obvious peroxidation damage. Meanwhile, superoxide dismutase, peroxidase, and catalase in the leaves are significantly enhanced to remove excess reactive oxygen species and alleviate the injury to photosynthetic apparatus. Our study reveals the effect of rainfall changes on the photosynthetic characteristics and antioxidant system of G. przewalskii, and can improve understanding of the adaptive strategies of desert plants under future precipitation changes in northwestern China.

1. Introduction

Climate change has a significant effect on the water cycle process at regional and global scales, causing increases or decreases in precipitation [1]. Northwestern China is one of the most arid areas of East Asia. Because of its complex terrain, precipitation shows a distinctly different changing trend. The western region, i.e., Xinjiang, Qilian mountainous areas, and parts of Qinghai, experienced a change from dry to wet during the second half of the 20th century [2,3,4]. In the eastern part of northwest China, including east Qinghai, Ningxia, and Shaanxi, annual precipitation has shown a downward trend [3]. Ecosystems located in areas with low annual precipitation are predicted to be the most susceptible to precipitation changes [5]. Compared to other ecosystems, desert ecosystems are more sensitive to precipitation changes [6], and plants inhabiting desert ecosystems have evolved specific physiological mechanisms to adapt to rainfall changes [7]. In recent years, the effects of precipitation patterns on plant physiological characteristics have become an important research topic [8,9,10]. The ability of leaves to obtain carbon by photosynthesis and regulate water loss by transpiration is very sensitive to precipitation [11]. In the southwestern United States, both an increase in precipitation by 30% and a decrease in precipitation by 45% had significant effects on the gas conductance (Gs) and net photosynthetic rate (Pn) of Pinus edulis and Juniperus monosperma; the Pn and Gs of P. edulis were more responsive to increased precipitation, whereas the Pn and Gs of J. monosperma were more sensitive to sheltering precipitation [12]. By fitting photosynthesis–light response curves, it is possible to obtain important photosynthetic parameters [13] such as apparent quantum efficiency (AQY), dark respiratory rate (Rd), light saturation point (Lsp), light compensation point (Lcp), and maximum net photosynthetic rate (Pnmax). These parameters can be used to determine whether the photosynthesis apparatus operates normally and to determine a plant’s photosynthetic adaptability [14,15]. Compared to gas exchange parameters, chlorophyll fluorescence parameters can better reflect the internal mechanism of photosynthesis [16,17]; therefore, the comprehensive analysis of gas exchange, light–response curves, and chlorophyll fluorescence parameters are a better choice for verifying the photosynthetic characteristics of plants under changing precipitation conditions.
Water stress often causes partial stomatal closure to conserve water [10] while simultaneously limiting CO2 entry, reducing carboxylation efficiency of RuBisCO, and changing how the electrons in the electron transport chain are accepted by O2, accordingly enhancing oxygenation and photorespiration and increasing ROS production [18]. In addition, excess light energy in the PSII system causes changes in the photochemistry of leaves subjected to drought stress, leading to excess accumulation of ROS [19]. Enhancement of antioxidant enzyme activity plays a vital role in scavenging excessive ROS, inhibiting membrane lipid peroxidation, and maintaining normal operation of the photosynthetic system [20]. It has been shown that peroxidase (POD) and catalase (CAT) activities in the leaves of Caragana microphylla and Salsola collina improve diurnal Pn and photosynthesis recovery [21].
Gymnocarpos przewalskii originates from the Mediterranean region, and is a rare plant in the desert areas of Central Asia. Its distribution is mainly restricted to the desert areas of northwestern China, including the Xinjiang Uygur Autonomous Region, Inner Mongolia Autonomous Region, Gansu Province, and Qinghai Province, which are characterized by low precipitation and high evaporation [22]. It has high tolerance to drought, saline-alkaline conditions, wind erosion, and sand burial, and plays an important ecological role in combating desertification and maintaining ecological balance in desert areas [23,24]. Its survival and evolution can provide good evidence for researching the evolution of plants in the arid regions of northwestern China. However, over the past few decades, increasing human activity in its natural habitat has resulted in a serious loss of individuals and habitat fragmentation [25]. At present, research related to the water adaptability of G. przewalskii mainly involves population structure [23], potential geographical distribution [26], phylogeography [22], osmoregulation, antioxidant protection, and biomass accumulation [24,27]. Research has shown that precipitation has the greatest effect on the distribution of G. przewalskii, with mean annual precipitation being the most important factor [26]. However, the response of its physiological characteristics to changing precipitation in arid desert area has not been elucidated. The main objective of this study is to explore the effect of increased and decreased rainfall on the photosynthetic characteristics and antioxidant system of G. przewalskii and to provide a scientific basis for evaluating the adaptability of desert plants to future precipitation patterns in northwestern China. The hypotheses of our study are as follows: (1) photosynthetic capacity is inhibited by decreased rainfall and improved by increased rainfall; (2) decreased rainfall enhances water-use efficiency; (3) photoinhibition in the PSII system occurs under rainfall reduction; and (4) regulation of antioxidant enzyme activity plays an important role in stabilizing the photosynthetic apparatus.

2. Materials and Methods

2.1. Study Area

The experimental site was located in Minqin County (38°57′25″ N, 103°40′48″ E) in the lower reaches of the Shiyang River, Gansu Province, northwest China, which is surrounded by the Badain Jaran Desert in the west and north and the Tengger Desert in the east (Figure 1).The average altitude of the area is 1320 m. The area has a typical arid continental climate with an average temperature of 7.8 °C. The mean annual precipitation is 113.2 mm, and the potential annual evaporation is 2624 mm. The annual sunshine hours are 3028 h, with a frost-free period lasting approximately 163 d. The soil type is sandy soil, average soil bulk density is 1.3 g cm−3, average field capacity is 25.0%, and average soil organic matter content is 0.80 g kg−1.

2.2. Plant Material and Test Design

The test materials consisted of two-year-old G. przewalskii seedlings. The test area was 15 m2, including 90 seedlings, and the plants were fully irrigated at the beginning of April. According to rainfall records over the last 60 years in Minqin County, the mean annual rainfall was 116.4 mm and rainfall from May to August accounts for approximately 84% of the total. The maximum and minimum rainfall over the same years were 154.2 mm and 81.5 mm, respectively, and the change amplitude was approximately 30%. In this study, five rainfall gradients were simulated as follows: mean monthly rainfall from May to August over the past 60 years (R0), R0 increased by 30% (R+30), R0 increased by 15% (R+15), R0 decreased by 30% (R−30), and R0 decreased by 15% (R−15). Each treatment included three test plots with an area of 1 m × 1 m, six seedlings per plot were included, and a 40 cm deep trench was dug between the two adjacent plots to prevent lateral water infiltration. The awning was opened on cloudy and rainy days to prevent the impact of natural rainfall. Irrigation was conducted every 5 d. Irrigation volume was determined by multiplying monthly rainfall by the plot area. The average monthly rainfall and irrigation volume for each treatment are presented in Table 1.

2.3. Measurement of Gas Exchange Parameters

A portable photosynthesis system (LCpro-SD, ADC BioScientific Ltd., Hoddesdon, UK) was used to measure light response and gas exchange parameters. Eleven photosynthetic active radiation (PAR) gradients (2000, 1800, 1500, 1200, 1000, 800, 500, 300, 100, 50, and 0 µmol m−2 s−1) were set, and were supplied by red and blue light sources. During the measurements, the air temperature was 28 ± 1.5 °C, the concentration of CO2 in the leaf chamber was 380 ± 5 µmol mol−1, and the airflow velocity in the leaf chamber was 280 ± 5 µmol mol−1. Each PAR setting was measured for 120 s and repeated three times. The portable photosynthesis system automatically recorded the PAR, Pn, transpiration rate (Tr), Gs, intercellular CO2 concentration (Ci), and air CO2 concentration (Ca). Instantaneous water-use efficiency (WUE) and stomatal limitation value (Ls) were calculated according to the equations WUE = Pn/Tr [28] and Ls = 1 − Ci/Ca [29,30], respectively. Light-response parameters, including AQY, Rd, Pnmax, Lsp, and Lcp, were estimated according to the mechanism model proposed by Ye et al. [13].

2.4. Measurement of Chlorophyll Fluorescence Parameters and Chlorophyll Content

Chlorophyll fluorescence parameters were measured using the FluorCam fluorescence imaging system (Beijing Yiketai EcoTech Co., Ltd., Beijing, China), which recorded initial fluorescence (Fo), maximum fluorescence (Fm), steady-state photochemical quenching coefficient (qL_Lss), steady-state non-photochemical quenching coefficient (NPQ_Lss), steady-state optical quantum efficiency (QY_Lss), and steady-state fluorescence decay rate (Rfd_Lss). The maximal photochemical quantum efficiency (Fv/Fm) and potential activity of PSII (Fv/Fo) were calculated according to the following equations: Fv/Fm= (Fm − Fo)/Fm and Fv/Fo= (Fm − Fo)/Fo. The chlorophyll fluorescence parameters were calculated according to the methods reported by Baker [31] and Roháček [32]. All measurements were taken on the leaves at the same position of the test plants, and the plants were dark-adapted for 20 min using clips before measurements. Chlorophyll content was determined according to the method described by Aron [33].

2.5. Measurement of O2, H2O2 MDA Content, and Antioxidant Enzyme Activities

The content of O2 and H2O2 was determined according to Jiao et al. [34], and MDA content was determined according to Farooq et al. [35]. For the enzyme assays, the crude extract was prepared as follows: frozen leaves (0.3 g) were crushed into a fine powder under liquid nitrogen using a mortar and pestle, then the leaf powder was homogenized in a 50 mM potassium phosphate (K2HPO4) buffer (pH 7.0) containing 1 mM EDTA-Na2 and 1% polyvinylpyrrolidone (PVP). The homogenate was centrifuged at 12,000× g for 20 min at 4 °C and the supernatant was used for subsequent enzyme assays. SOD activity was assayed by measuring its ability to inhibit the photochemical reduction of nitroblue tetrazolium (NBT) according to the method reported by Hwang et al. [36]. One unit of SOD activity was defined as the amount of enzyme that caused 50% inhibition of NBT reduction at 560 nm [37]. CAT activity was determined as the decline in absorbance for 120 s at 240 nm [38]. POD activity was determined according to the method described by Ekmekca and Terzioglu [39], and the change in absorbance was recorded at 470 nm for 120 s.

2.6. Statistical Analysis

SPSS 24.0 software (Microsoft Inc., Redmond, WA, USA) was used for one-way analysis of variance (ANOVA), and significant differences between the treatments were determined by Duncan’s test at a significance level of 0.05. Pearson correlation analysis was used to analyze the correlation between photosynthetic parameters. All graphs were drawn using SigmaPlot 12.5 (Systat Software Inc., Chicago, IL, USA).

3. Results

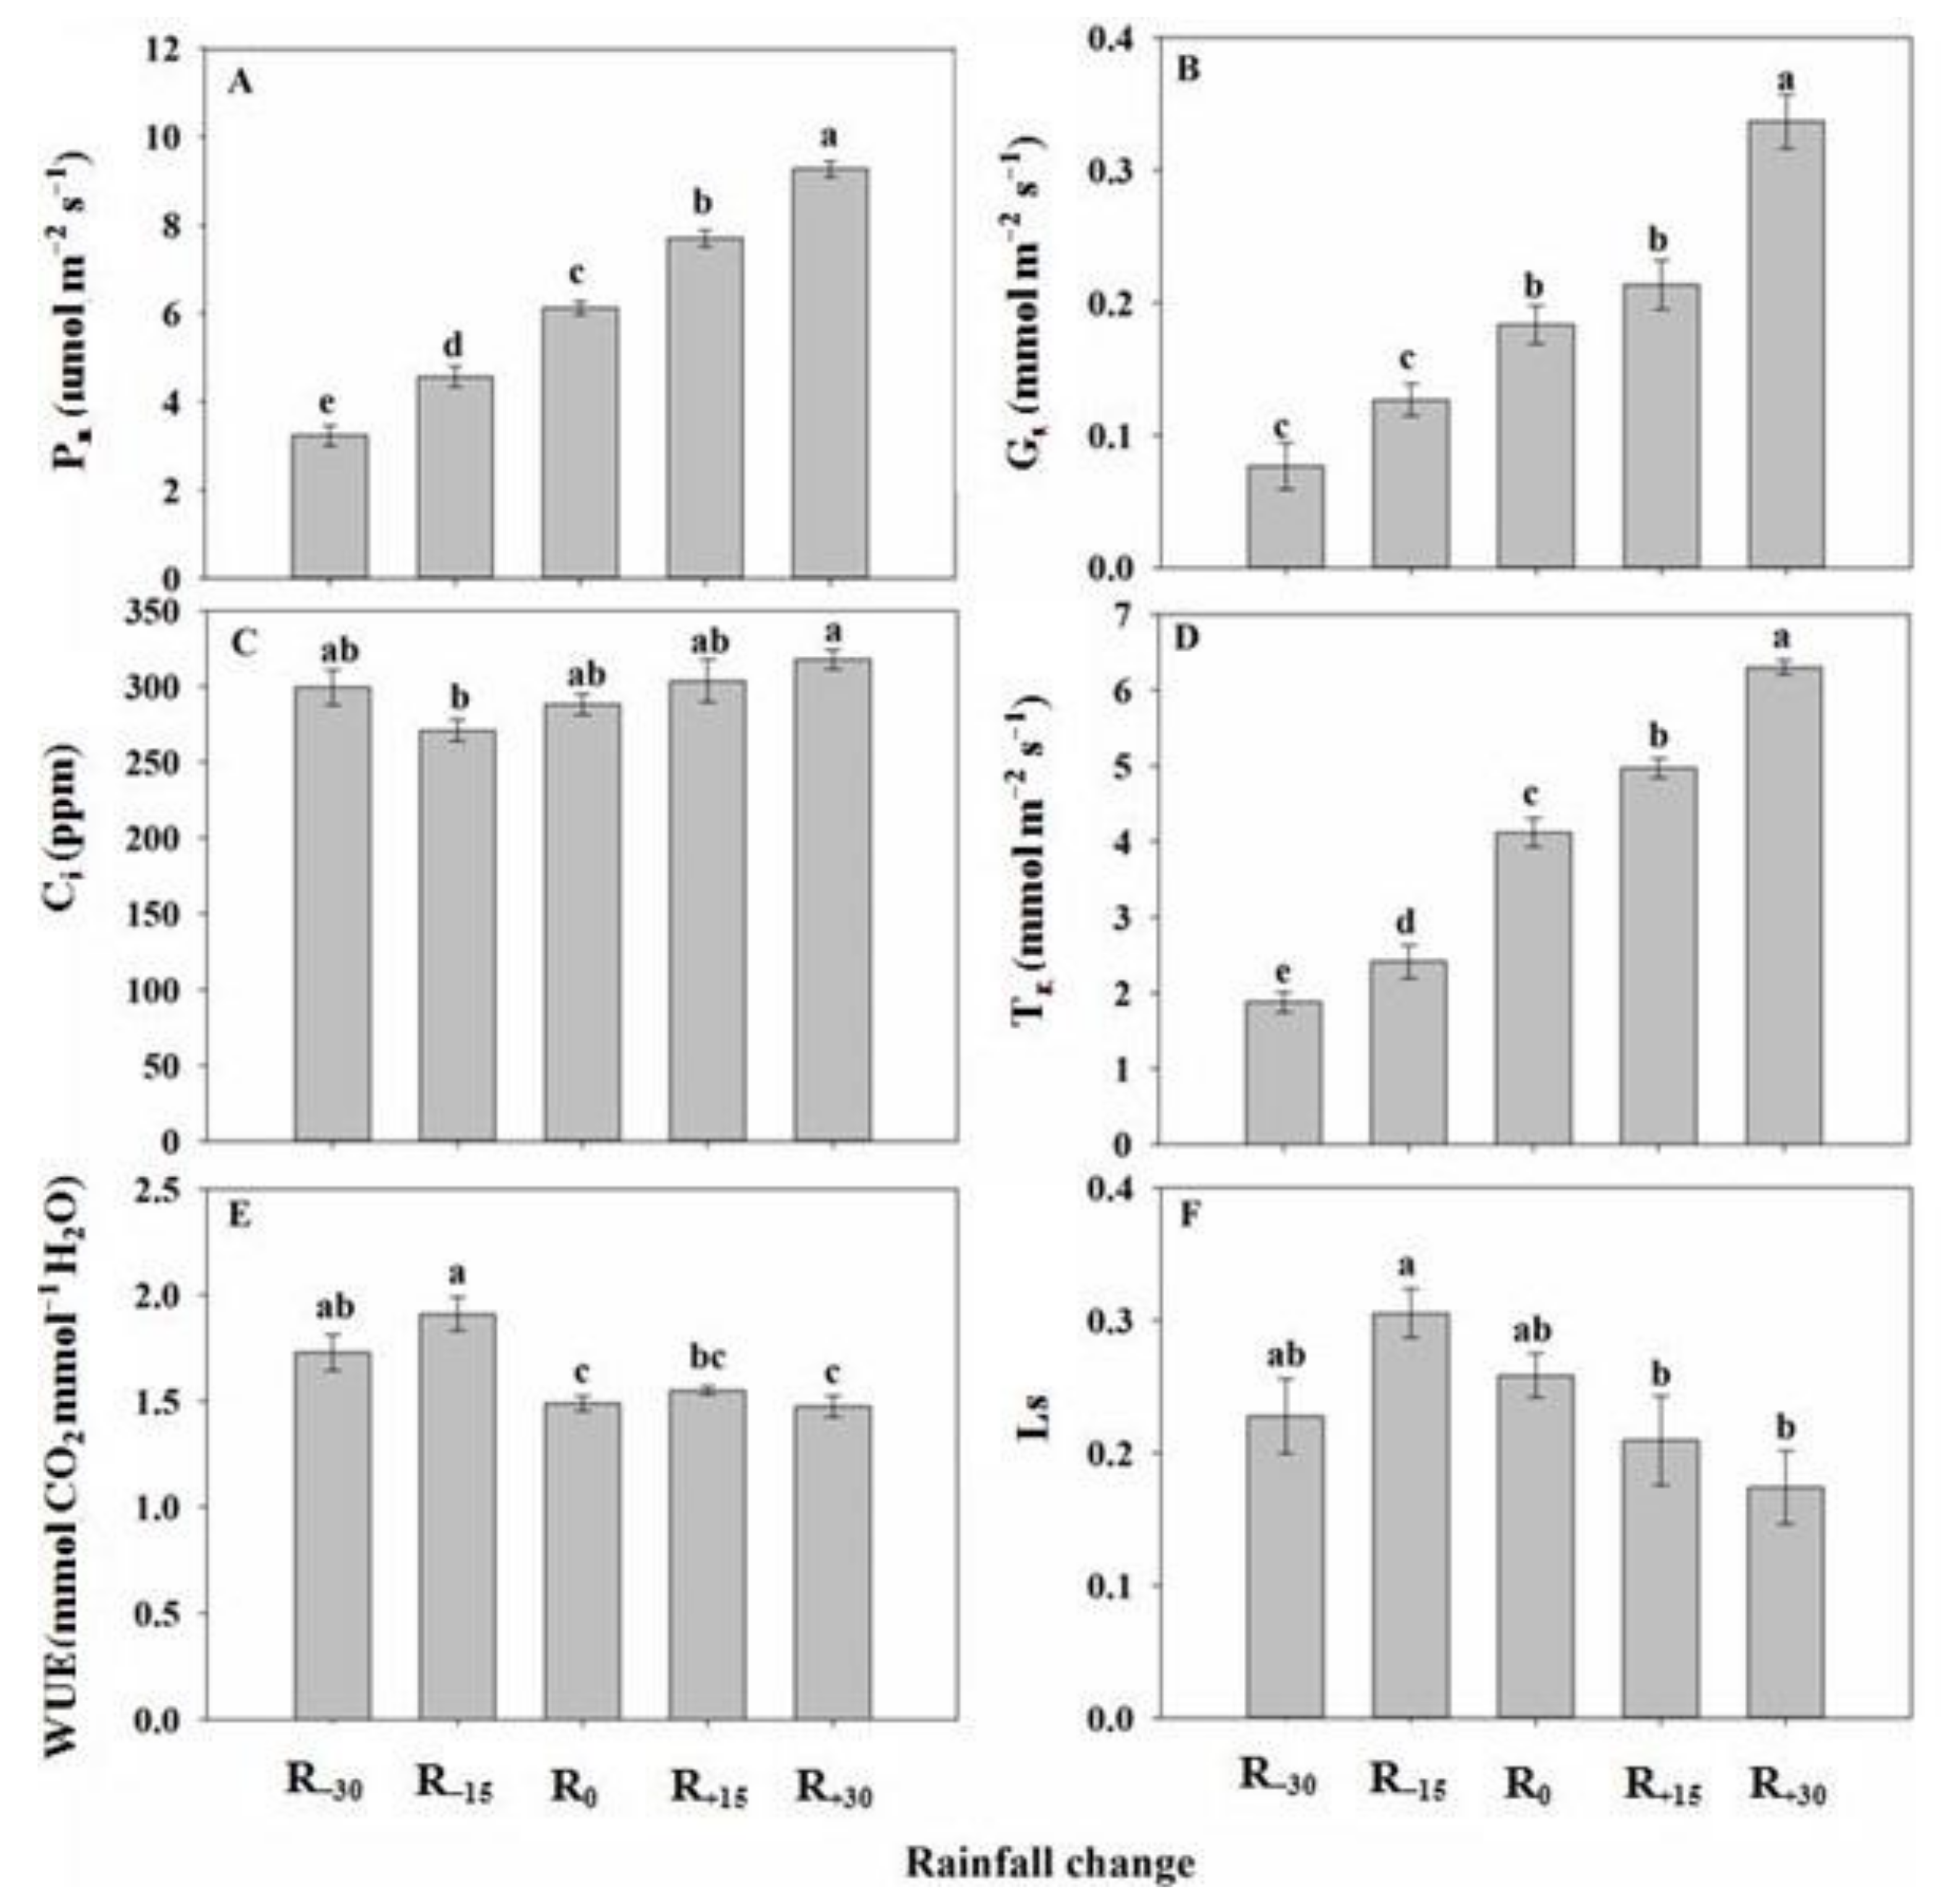
3.1. Effect of Rainfall Change on Photosynthetic Parameters

Pn and Tr increased with the increase in rainfall, and the differences among the treatments were significant (p < 0.05; Figure 2A,D). Under rainfall reduction (R−15 and R−30), the decrease in Tr was more obvious than that in Pn, resulting in an increase in WUE by 16.0% and 28.3%, respectively. When the rainfall was increased, the change in WUE was not significant compared to that under R0 (p > 0.05; Figure 2E). The change in Gs (Figure 2B) was consistent with the changes in Pn and Tr; when the rainfall was reduced (R−15 and R−30), Gs decreased significantly by 30.9% and 58.1%, respectively, whereas it increased significantly by 83.6% under R+30 (p < 0.05). Compared with R0, Ci and Ls (Figure 2C,F) did not change significantly (p > 0.05) when the rainfall increased or decreased.

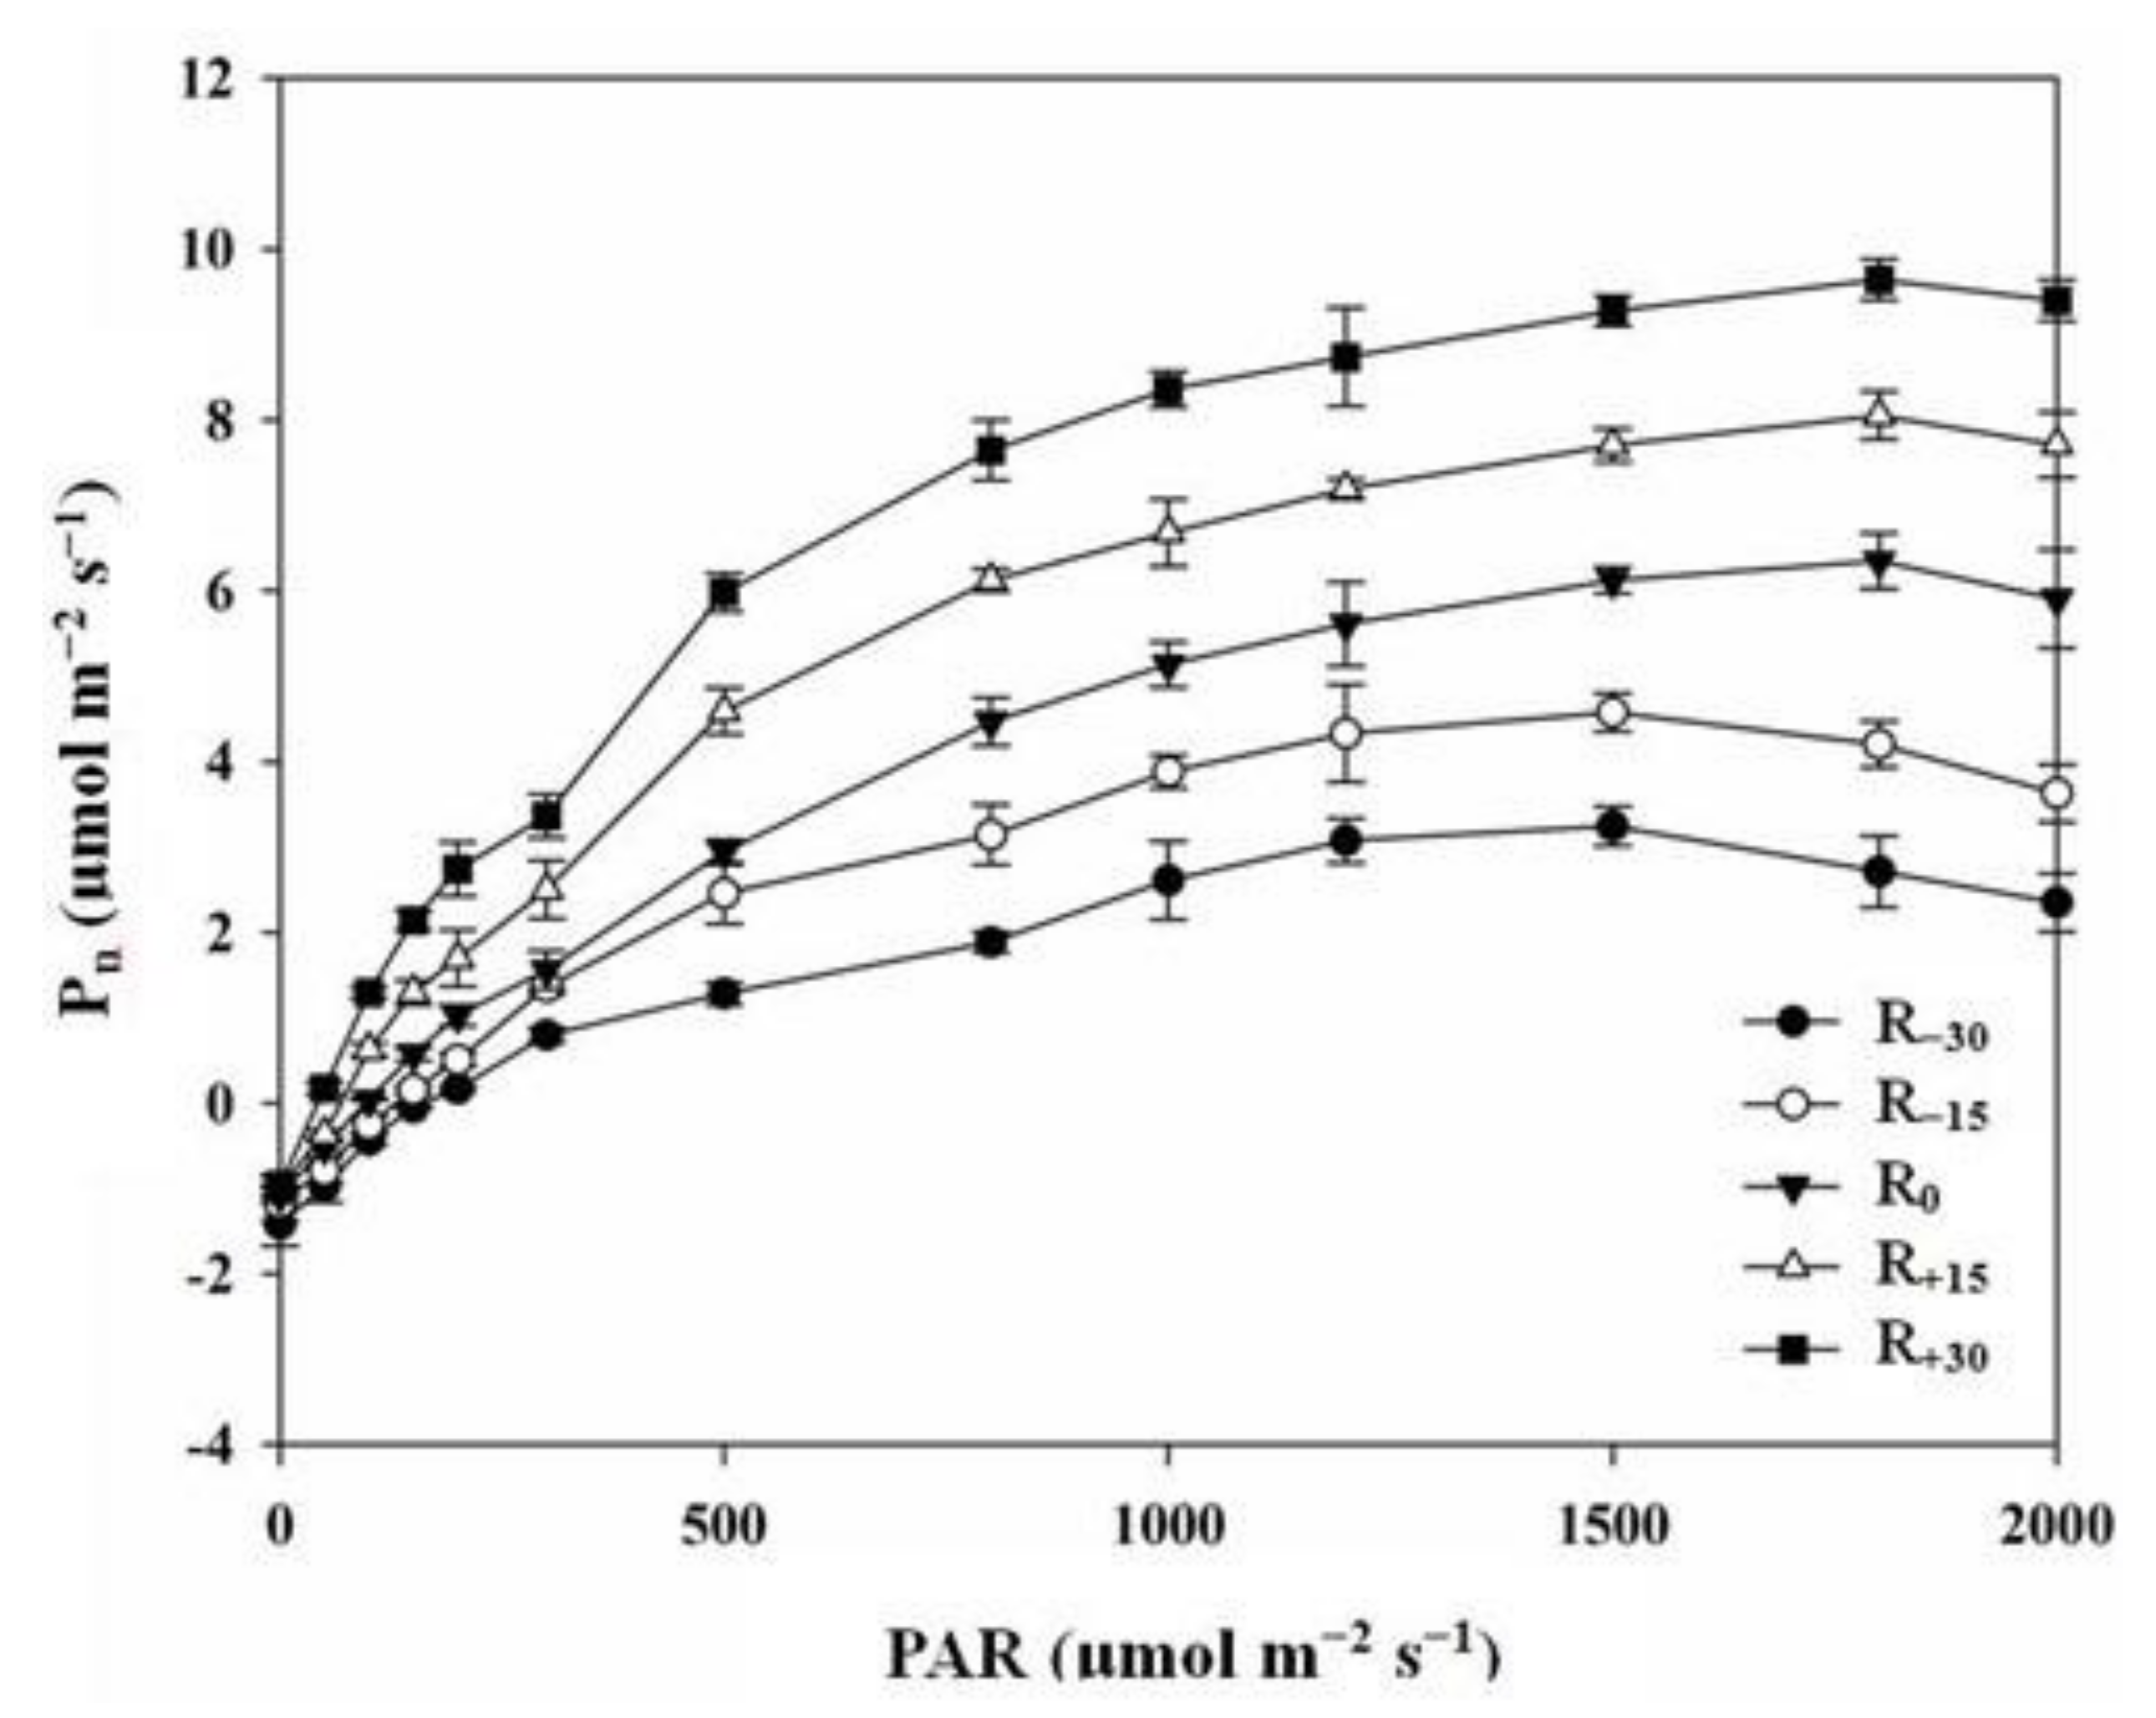
3.2. Effect of Rainfall Change on Light Response Parameters

The light-response curves exhibited a consistent trend under the tested rainfall conditions (Figure 3). With increasing PAR, Pn increased at first, was saturated for a certain period, and finally decreased slightly. When PAR was above 500 µmol m−2 s−1, the difference in Pn among the treatments increased. The Pn was nearly saturated at the PAR of approximately 1400 µmol m−2 s−1 under R−30 and R−15, and decreased when PAR was higher than 1500 µmol m−2 s−1. The Pn of the other three treatments decreased when PAR was higher than 1800 µmol m−2 s−1.
The AQY, Pnmax, and Lsp increased with the increase in rainfall, whereas Rd and Lcp showed the opposite trend. The AQY and Pnmax under R−30 and R+30 were significantly different from those under R0 (p < 0.05, Table 2). Compared to R0, the Lsp under R−15 and R−30 decreased significantly (p < 0.05). The difference in Rd among the treatments was not significant (p > 0.05). Lcp was sensitive to rainfall changes; compared with R0, it decreased by 96.0% under R−30 and increased by 59.7% under R+30.

3.3. Effect of Rainfall Change on Chlorophyll Content

With the increase in rainfall, the content of Chla, Chlb, total Chl, and Chl a/b showed an increasing trend (Table 3). Compared with R0, the content of Chla and total Chl decreased significantly under R−15 and R−30, and increased significantly under R+15 and R+30 (p < 0.05). The Chlb content under decreased rainfall was significantly lower than that under increased rainfall (p < 0.05). Furthermore, under reduced rainfall (R−30 and R−15), the Chl a/b was decreased significantly, to 76.4% and 66.7% of that under R0, whereas it rose remarkably under increased rainfall, to 1.2 times that under R0 (p < 0.05).

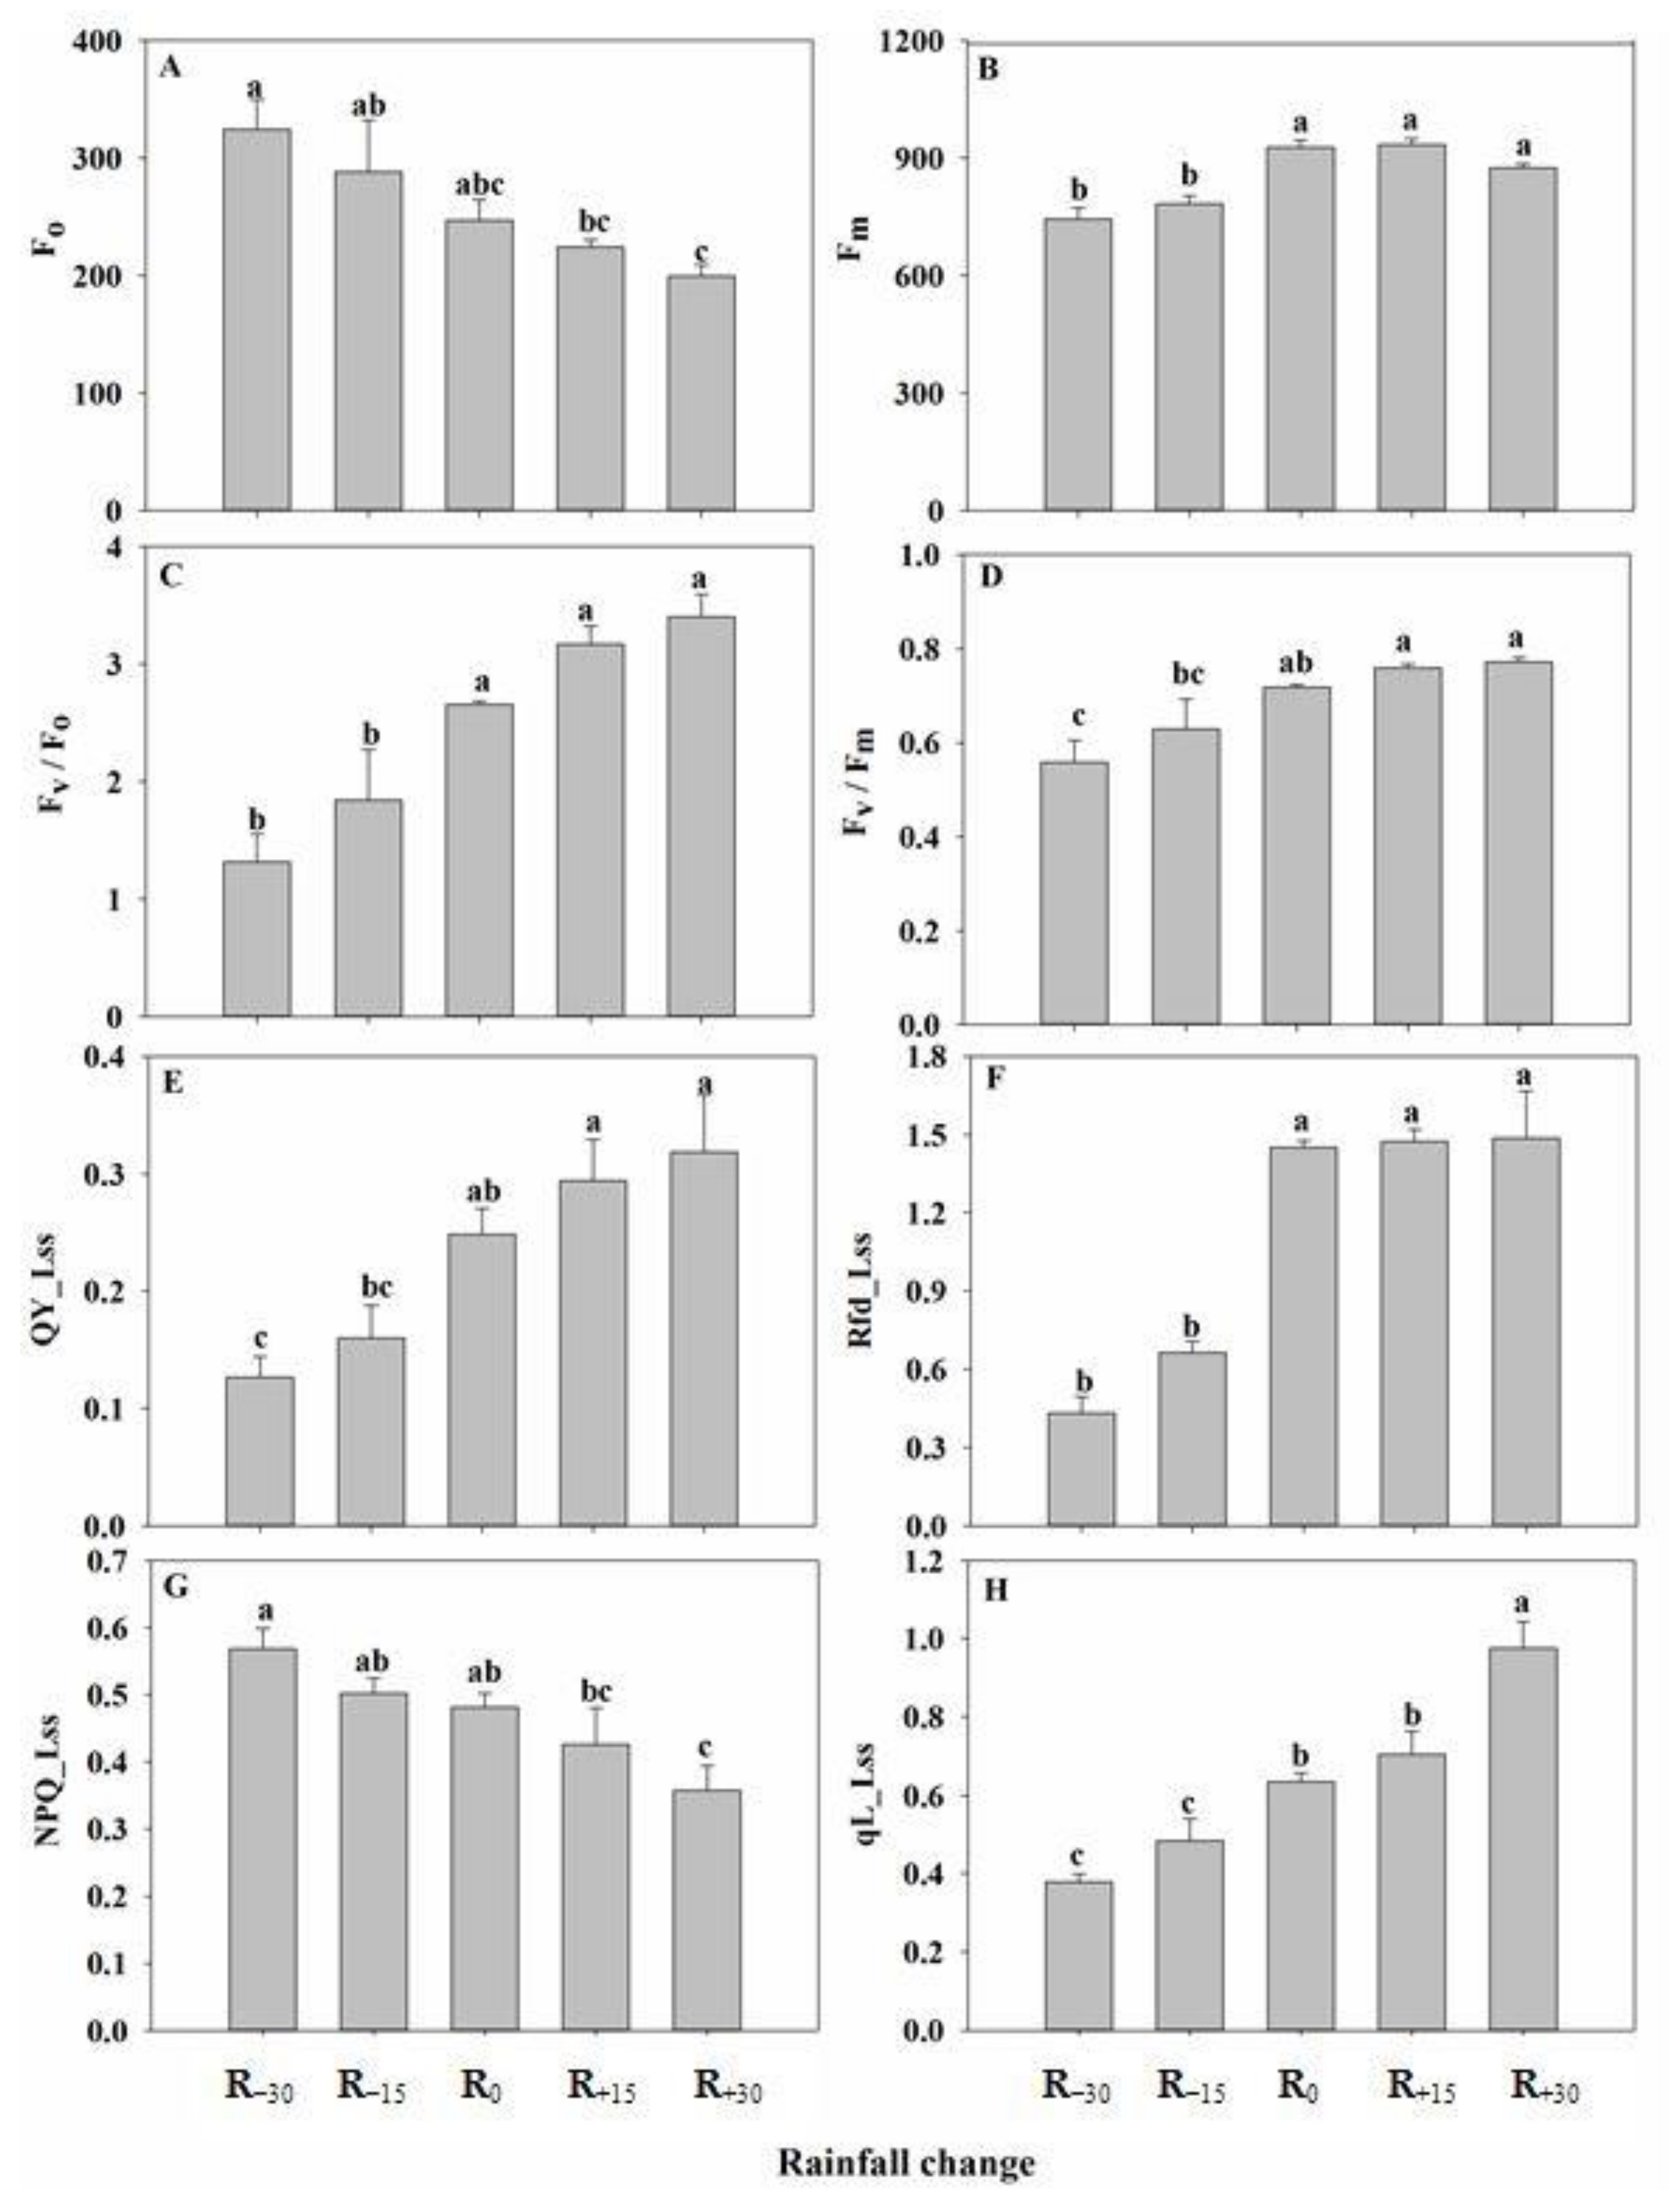
3.4. Effect of Rainfall Change on Chlorophyll Fluorescence Parameters

In general, changes in the chlorophyll fluorescence parameters were more obvious under decreased rainfall than under increased rainfall (Figure 4). With increased rainfall, the Fo and NPQ_Lss decreased, whereas the Fv/Fo, Fv/Fm, QY_Lss, Rfd_Lss, and qL_Lss increased. Compared to R0, the Fm decreased under reduced rainfall and changed slightly under increased rainfall (Figure 4B). The difference in Fo under rainfall change was not significant compared to that under R0 (p > 0.05; Figure 4A). The Fm, Fv/Fo, Rfd_Lss, and qL_Lss under decreased rainfall were significantly lower than those under R0 (Figure 4B,C,F,H). The Fv/Fm, and QY_Lss decreased significantly under R−30, equaling only 77.8% and 51.1% of those under R0, respectively (Figure 4D,E). Compared to R0, the NPQ_Lss did not change significantly with rainfall change, except for that under R+30 (p > 0.05; Figure 4G).

3.5. Correlation between Fluorescence and Light Response Parameters
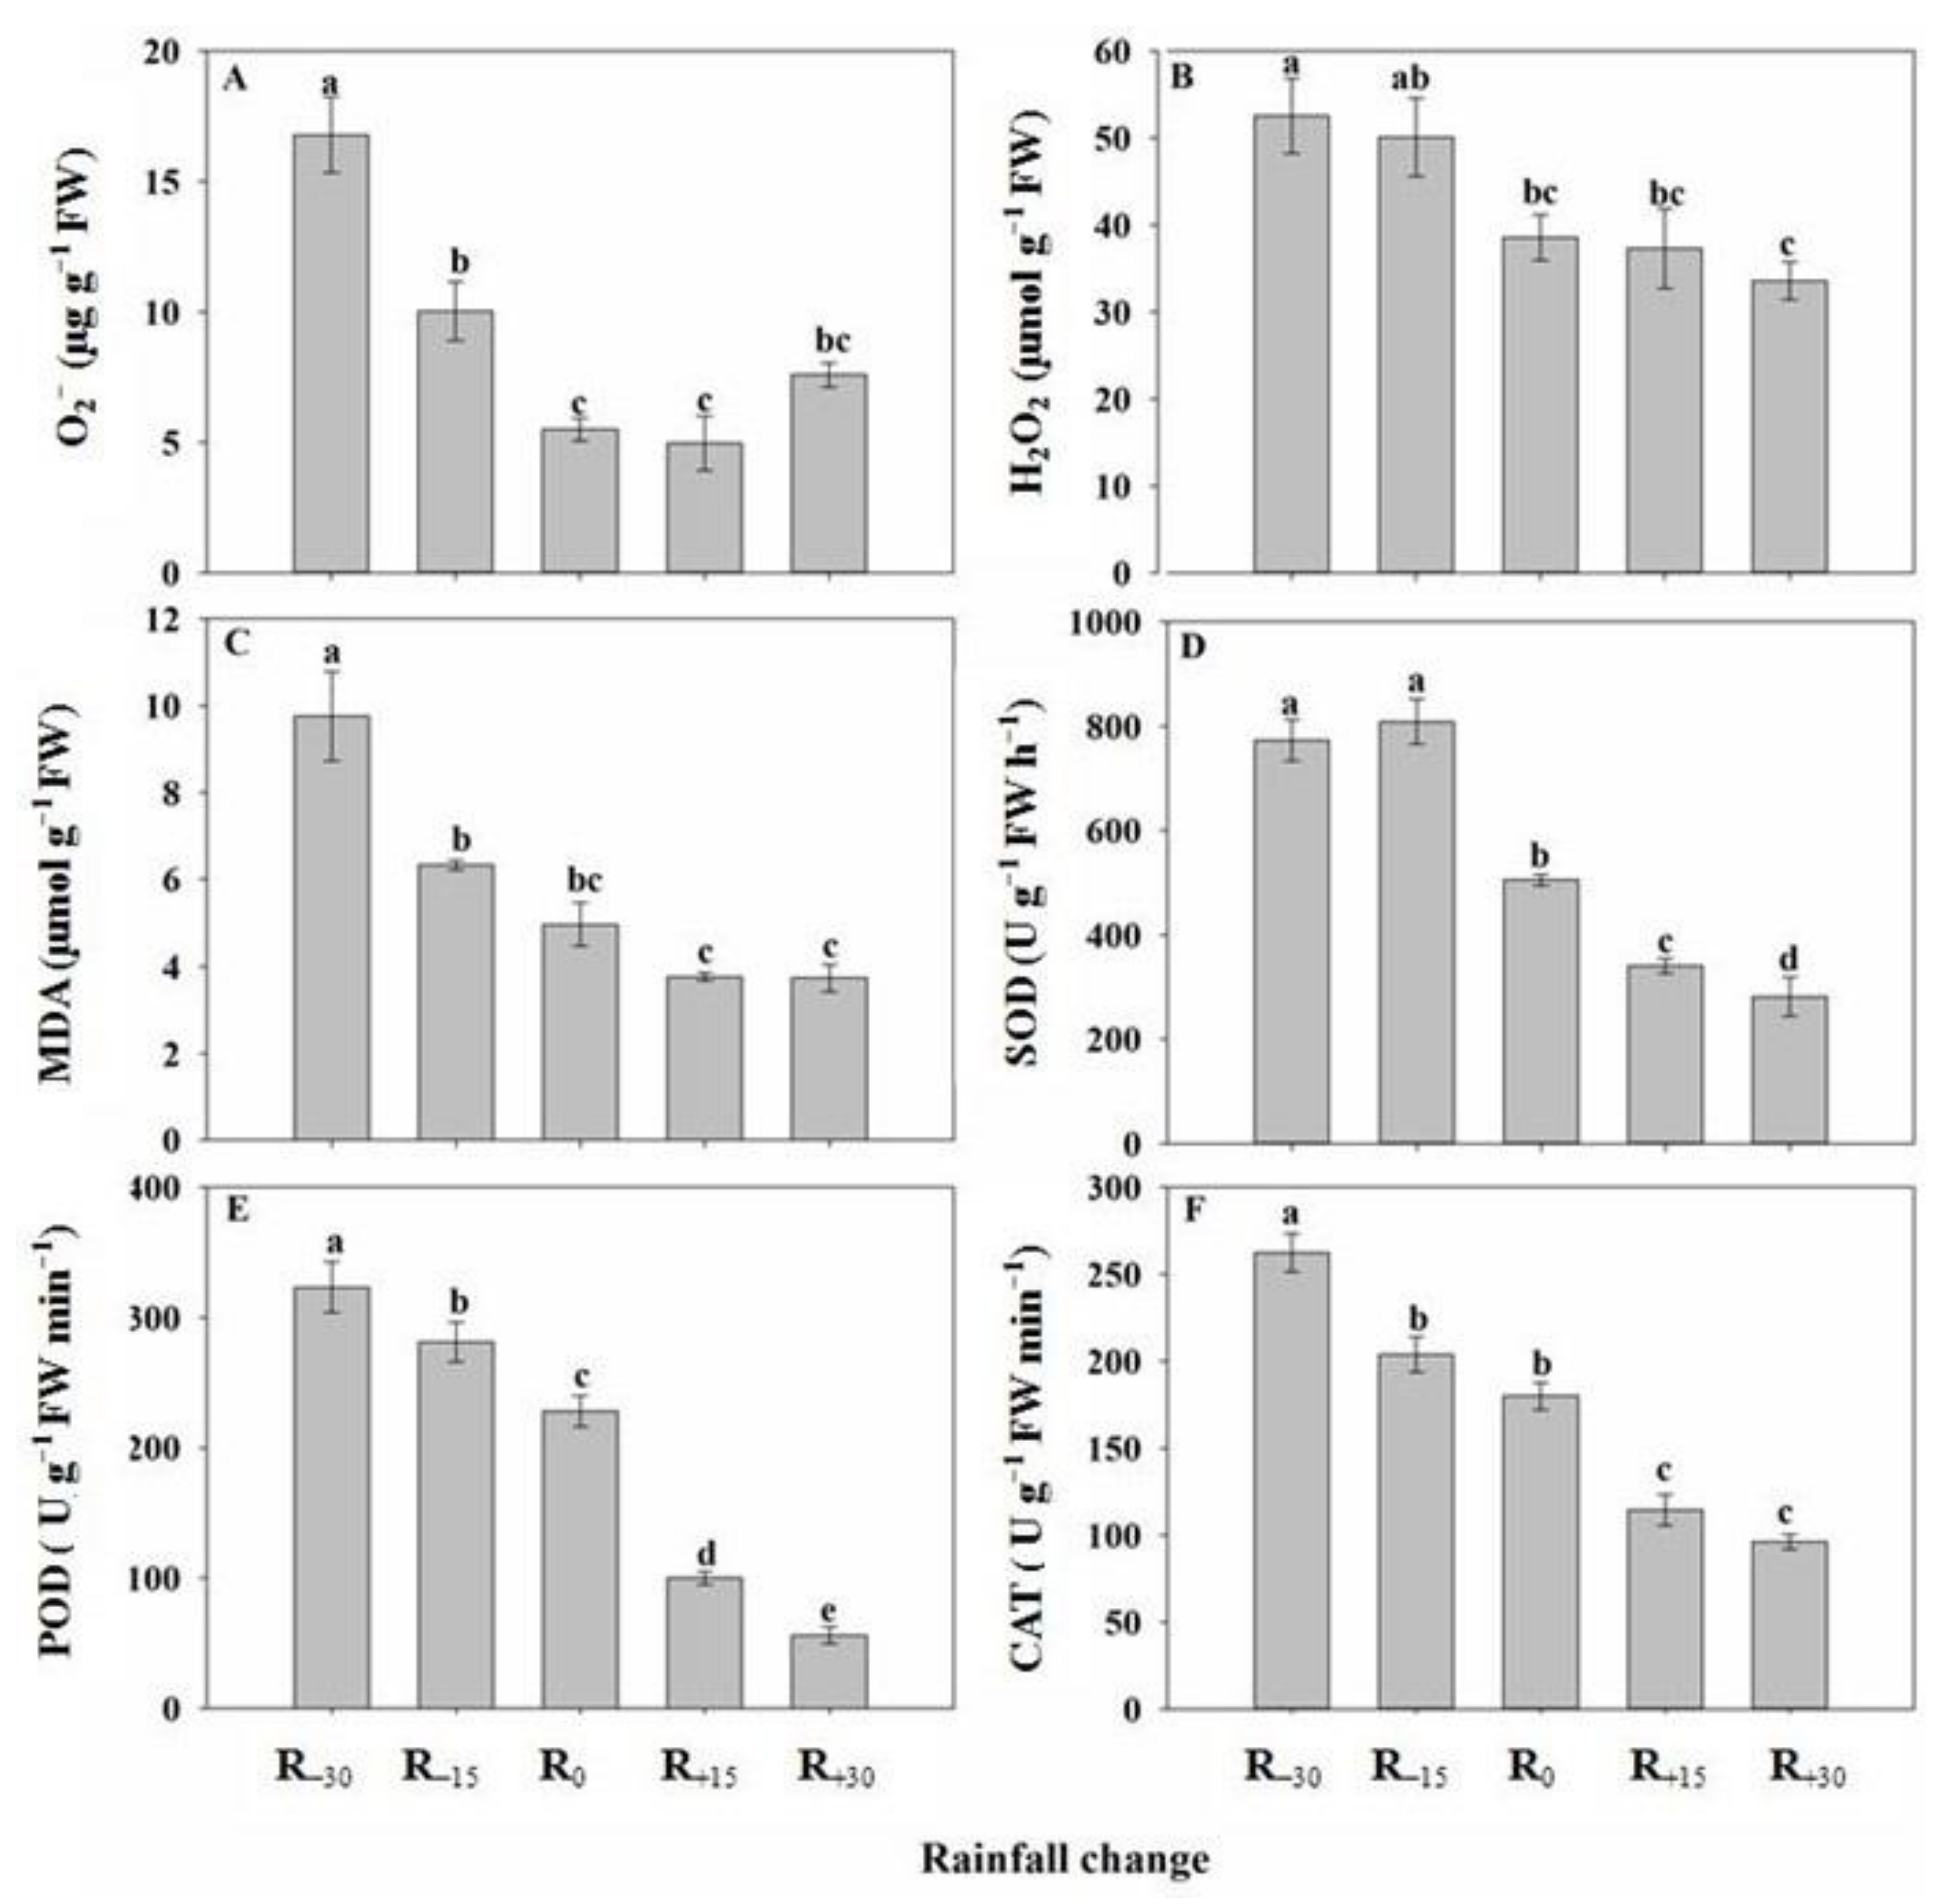
As shown in Table 4, Fv/Fo and Fv/Fm were significantly positively correlated with AQY (p < 0.05), Pnmax, and Lsp (p < 0.01), and significantly negatively correlated with Lcp (p < 0.01). The QY_Lss and qL_Lss showed significant positive correlations with AQY, Pnmax, and Lsp (p < 0.01) and a significant negative correlation with Lcp (p < 0.01). Moreover, significant negative correlations of the NPQ_Lss with AQY (p < 0.05), Pnmax, and Lsp were observed (p < 0.01), as well as a significant positive correlation between the NPQ_Lss and Lcp (p < 0.01).

3.6. Effect of Rainfall Change on O2, H2O2, and MDA Content

With increased rainfall, the content of O2, H2O2, and MDA generally decreased (Figure 5A–C). O2 significantly accumulated under R−15 and R−30 (p< 0.05), being 1.8 and 3.1 times that under R0 (Figure 5A). Compared to R0, R−30 significantly increased H2O2 and MDA levels, by 36.2% and 96.4%, respectively (p < 0.05). When rainfall increased (R+15, R+30), the MDA content decreased markedly compared with that under decreased rainfall treatments (R−15 and R−30, p < 0.05). Compared with R0, increased rainfall had no significant effect on the accumulation of O2, H2O2, or MDA (p > 0.05).

3.7. Effect of Rainfall Change on Antioxidant Enzyme Activity

With increased rainfall, the SOD, POD, and CAT activities all decreased (Figure 5D–F). Compared with R0, both decreased and increased rainfall caused significant changes in SOD and POD activities (p < 0.05). The SOD activity was the highest under R−15, being 1.6, 2.4, and 2.9 times that under R0, R+15, and R+30, respectively. The SOD activity under increased rainfall (R+15 and R+30) markedly decreased by 48.4% and 79.5%, respectively, compared with that under R0 (p < 0.05). The POD activity was sensitive to rainfall changes, and the differences in POD activity among all treatments were significant (Figure 5E, p < 0.05). The CAT activity showed a changing trend similar to that of POD activity (Figure 5F), reaching its maximum under R−30, where it was significantly higher (46.0%) than under R0 (p < 0.05). Compared with R0, CAT activity under increased rainfall (R+15 and R+30) decreased significantly, by 36.3% and 46.5%, respectively (p < 0.05).

4. Discussion

Precipitation is the main source of soil moisture in arid desert regions. With changes in global climate, precipitation varies greatly, precipitation interval lengthens, and extreme weather occurs more often [10]. This leads to prolonged dry periods, affects water utilization by plants, and further induces plant physiological change [40]. Studies have indicated that additional precipitation can improve plant photosynthesis, whereas water deficit has the opposite effect [41,42]. With increasing precipitation, the carbon assimilation rate of Artemisia tridentata increased significantly more than that of Purshia tridentata [43]. The daily mean Pn of Nitraria tangutorum markedly increased when increasing rainfall by 75% and 100% [9]. The Pn of Reaumuria soongorica increased significantly under 15% and 30% increased precipitation, and was reduced under 15% and 30% decreased rainfall [42]. In the present study, the Pn response of G. przewalskii seedlings to rainfall variation was similar to that of R. soongorica; however, it showed higher responsiveness. The reduction in Pn was possibly because the seedlings suffered from drought stress under decreased rainfall, inhibiting the carbon assimilation process [43].
Factors of water stress that impact plant photosynthesis are divided into stomatal and non-stomatal factors [29,44]. The change trends of Pn, Ci, and Ls can be used to judge whether the decrease in Pn is attributed to stomatal or non-stomatal factors [15]. In this study, we observed that the decrease in Pn under R−15 was accompanied by a decrease in Gs and Ci and an increase in Ls, suggesting that stomatal limitation was responsible for the Pn decrease in G. przewalskii. However, the decrease in Pn under R−30 was accompanied by a decrease in Ls and an increase in Ci, indicating that non-stomatal limitation was the dominant factor. The turning point from stomatal to non-stomatal limitation in photosynthesis varies depending on the plant species, drought stress period, and stress intensity [45,46,47]. For photosynthesis of G. przewalskii, the turning point was within the range of 15% and 30% rainfall reduction; when the water conditions are below the critical point over the long term, biochemical and photochemical metabolic pathways may be significantly damaged [47,48]. Plant WUE is the result of a trade-off between carbon assimilation and transpiration loss, and the literature has reported that WUE is improved by water stress [45,49,50]. In our study, decreased rainfall enhanced the WUE of G. przewalskii by decreasing transpiration more than photosynthesis, indicating that for G. przewalskii improving WUE is a way of adapting to drought. WUE was not improved continuously under water stress, showing a threshold effect [51]. The maximum WUE of G. przewalskii may occur between rainfall decreased by 15% and 30%, which needs to be studied further.
The photosynthetic physiological processes of plants are highly sensitive to water variation [52]. Light response parameters can reflect plant photosynthetic potential [53,54], and Pnmax represents the maximal photosynthetic capacity of plants [55]. In the present study, the Pnmax of G. przewalskii increased with increased rainfall, indicating that the increase in rainfall improved its photosynthetic ability. On the other hand, it declined significantly under R−30, suggesting that the seedlings were subjected to severe drought and their photosynthetic potential was limited. Decreased rainfall caused a decrease in Lcp and AQY, indicating that water deficit reduced light-use efficiency to weak light. In this study, the AQY was between 0.006 and 0.022, which is far below that of certain plants grown under drought conditions [15,56], indicating that the capability of G. przewalskii to use low light was weak. With increased rainfall, the AQY and Lsp increased and the utilization range of light intensity was enlarged. Under R+30, the ability to use weak light was significantly improved, possibly because the pigment–protein complex increased, further enhancing the light conversion efficiency [49]. In our study, the Rd of G. przewalskii gradually increased with decreased rainfall, though the effect of rainfall change was not significant. The Rd of Phragmites australis was found to increase under water stress [47]. In this study, the Rd of G. przewalskii varied in the range of 0.83–1.16 µmol m−2 s−1, whereas that of Periploca sepium was previously found to be in the range of 1.37–2.08 µmol m−2 s−1 [56], showing great differences in utilization of weak light. This may be because G. przewalskii grows in desert areas characterized by high light intensity and drought, and adapts to this habitat by maintaining a lower consumption of photosynthetic products.
Chlorophyll content is an important indicator reflecting plant drought resistance [57]. Water stress usually causes a reduction in chlorophyll content [10,16], which is probably related to the inhibition of chlorophyll biosynthesis [58] or oxidative damage of ROS to chlorophyllase [59]. Our findings show that the contents of Chla, Chlb, and total Chl decreased with declining rainfall and that total Chl content was significantly negatively correlated with O2, H2O2, and MDA content (r = −0.698, r = −0.655, and r = −0.853, respectively; p < 0.01), indicating that the decline in chlorophyll content was related to the damage of ROS.
Gas exchange parameters cannot completely represent the effects of drought stress on the photochemical processes [60]. Variations in chlorophyll fluorescence can be used to explore the effect of water stress on PSII structure and function [61], and chlorophyll fluorescence parameters are intrinsically compared with the gas exchange parameters [31]. Fo and Fm can be used to detect damage to PSII [47]. An increase in Fo coupled with a decrease in Fm is a possible sign of PSII center inactivation [16]. Our study found a similar law under decreased rainfall treatments, indicating that initial photochemical reaction process was inhibited, electron transport efficiency was reduced, and inactivation in PSII reaction center occurred. Fv/Fm reflects the maximum photochemical efficiency [62]; it is relatively constant under normal conditions and usually decreases under drought stress [16], and as such can be used to detect possible photoinhibition. In the present study, decreased rainfall caused a decline in Fv/Fm and the decrease was significant under R−30, indicating that the original light energy conversion efficiency was significantly reduced and the potential active center was damaged [63]. QY_Lss is positively correlated with PSII activity, and can be used to evaluate the electron transfer efficiency of PSII [64,65]. Our results show that QY_Lss decreased significantly under R−30 compared with R0, indicating that this rainfall condition caused evident photoinhibition. qL_Lss represents the openness of the PSII reaction center [66], and is positively related to electron transfer activity. Our results show that rainfall reduction caused a significant decline in qL_Lss, implying that electron transfer activity was inhibited in the PSII reaction center [67]. On the other hand, increased rainfall improved the qL_Lss of G. przewalskii, suggesting that these rainfall conditions increased the openness of the PSII centers, providing sufficient energy and reduction capacity for photosynthetic carbon assimilation. Under drought stress, energy dissipation mechanisms such as heat dissipation or photorespiration are enhanced in order to prevent or reduce photoinhibition [68]. NPQ_Lss represents the capacity for heat dissipation [69]. The reduction in rainfall caused an increase in NPQ_Lss, indicating that thermal dissipation was induced in G. przewalskii seedlings, which played a role in alleviating damage caused by excess excitation energy in the photosynthetic apparatus [65].
Under water stress, availability for photosynthesis is limited and excess light energy in PSII results in production of highly reactive ROS [70], including O2, H2O2, OH, 1O2, etc. This can cause peroxidation damage to the photosynthetic apparatus [71,72]; the degree of injury can be measured by the change in MDA content [10]. Drought stress has been found to increase O2 and H2O2 production in leaves of Kentucky bluegrass [73] and the roots of G. przewalskii [24]. In the present study, the O2, H2O2, and MDA contents were significantly increased under R−30 compared with R0, indicating that changes in the rainfall level caused obvious oxidative damage to the cell membrane of G. przewalskii. In addition, the contents of O2 and H2O2 were negatively correlated with Pn (r = −0.648, r = −0.703, p < 0.01) and Fv/Fm (r = −0.662, R = −0.840, p < 0.01), indicating that ROS action was closely related to a decrease in photosynthesis. To scavenge excessive ROS in adverse environments, plants have evolved a highly efficient antioxidant defense system that includes both enzymatic and non-enzymatic constituents, such as SOD, POD, CAT, ascorbate peroxidase (APX), ascorbate, reduced glutathione, and carotenoids [74,75]. SOD constitutes the first line of defense against ROS, as it catalyzes O2 into H2O2 [76], while CAT and POD are mainly responsible for eliminating H2O2 [13,77]. The SOD and CAT activities of Manihot esculenta became enhanced to maintain the balance of ROS when drought intensity was increased [78]. For Iris lactea var. chinensis, POD activity was significantly reduced under both moderate and severe drought stress, whereas SOD activity was reduced under moderate stress and increased under severe stress [79]. In G. przewalskii, SOD activity significantly increased under R−15 and decreased under R−30 compared with R0, indicating that rainfall reduction induced SOD to remove excess O2; however, its scavenging capacity was limited under severe drought, showing a similar response pattern to that of Potentilla fruticosa [80]. Our results show that the POD activity continuously increased with decreasing rainfall, showed significant differences among rainfall levels (p < 0.05), and had an extremely significant positive correlation with H2O2 content (r = 0.625, p < 0.01). This indicates that POD is the key enzyme in removing H2O2 under drought conditions. The changes in CAT activity were generally consistent with POD and were significantly positively related to H2O2 content (r = 0.650, p < 0.01), suggesting that CAT plays an important role in reducing H2O2. In accordance with our findings, the POD and CAT activities of Cleome spinosa were found to be significantly enhanced under drought stress [81]. Under increased rainfall, the SOD, POD, and CAT activities were markedly lower than under R0 (p < 0.05), and the MDA and H2O2 contents were lower than under R0, indicating that water status was improved and ROS metabolism tended to be balanced [82]. This indicates that antioxidant protection is one of the main mechanisms by which G. przewalskii responds to water changes.
Seedlings face greater water stress versus adult individuals, possibly due to their smaller root system [83] and reduced photosynthetic physiological activity relative to older and larger individuals [84]. With the increase in drought conditions, SOD and APX activity increased first and then decreased in adult individuals of G. przewalskii at different ages (about 15 a and 53 a); under severe drought, CAT and POD activity significantly increased, and older individuals had stronger drought resistance [27]. These results indicate that there are both connections and differences between seedlings and adult individuals of G. przewalskii under different water conditions. Thus, it is necessary to explore the response of both G. przewalskii seedlings and adult individuals to rainfall changes. This would be helpful for a full understanding of the water adaptation mechanism.
Extreme precipitation has been determined as a potential threat to the global ecosystem [85], with wet areas expected to be wetter and dry areas predicted to become drier [86]. In more extreme climatic conditions, what will happen to the physiological characteristics of G. przewalskii? Based on the changes in indicators more associated with biomass production and resource utilization under simulated rainfall, it can be inferred that photosynthesis (Pn, Pnmax) will be more sensitive to extremely increased rainfall than that to extremely decreased rainfall, being significantly enhanced with increased rainfall, while the photochemical efficiency of PSII (Fv/Fm, QY_Lss) will be more responsive to extremely decreased rainfall and significantly reduced with declining rainfall. Improvements in WUE will be reduced under extremely decreased rainfall, and the range of light energy utilization (Lsp, Lcp) will be narrowed significantly. The atmospheric CO2 concentration and soil moisture always interact with each other, affecting the growth, development, productivity of plants and ultimately affecting the function of terrestrial ecosystems [42,87]. To better understand the adaptation of desert plants to future climate changes, it is necessary to further research the interactive effects of elevated CO2 and precipitation changes on the biomass and physiological characteristics of G. przewalskii by designing extreme precipitation gradients.

5. Conclusions

In the present study, we conducted a controlled experiment to explore the physiological responses of G. przewalskii to changes in rainfall. Our conclusions are as follows. (1) With increasing rainfall, the Pn and Tr of G. przewalskii seedlings were significantly increased. The decline in Pn was caused by stomatal and non-stomatal limitations when rainfall decreased by 15% and 30%, respectively. Rainfall reduction significantly improved the WUE. A decrease in rainfall by 30% significantly reduced the maximum photosynthetic capacity of G. przewalskii as well as the ability to use low light. (2) Decreased rainfall caused an obvious decline in Chla and total Chl content, while a 30% decrease in rainfall caused significant photoinhibition and reduced the photochemical activity. (3) A reduction in rainfall of 30% caused significant peroxide damage to the photosynthetic apparatus, while SOD, POD, and CAT synergistically mitigated peroxidation.

Author Contributions

Conceptualization, H.H., Y.L. and P.C.; methodology, H.H., P.C. and G.L.; software, L.J. and X.W.; validation, G.L., L.J. and X.W.; formal analysis, P.C. and H.H.; investigation, P.C. and G.L.; writing—original draft preparation, H.H. and P.C.; writing—review and editing, X.W., Y.L. and L.J.; funding acquisition, Y.L. All authors have read and agreed to the published version of the manuscript.

Funding

This research was funded by the National Natural Science Foundation of China (Grant No. 32160409).

Institutional Review Board Statement

Not applicable.

Informed Consent Statement

Not applicable.

Data Availability Statement

All of the data supporting the findings of this study are included in this article.

Conflicts of Interest

The authors declare no conflict of interest.

References

  1. Wallace, J.S. Increasing agricultural water use efficiency to meet future food production. Agric. Ecosyst. Environ. 2000, 82, 105–119. [Google Scholar] [CrossRef]
  2. Wang, H.J.; Chen, Y.N.; Chen, Z.S. Spatial distribution and temporal trends of mean precipitation and extremes in the arid region, northwest of China, during 1960–2010. Hydrol. Process. 2012, 27, 1807–1818. [Google Scholar] [CrossRef]
  3. Han, X.Q.; Xue, H.W.; Zhao, C.S.; Lu, D.R. The roles of convective and stratiform precipitation in the observed precipitation trends in Northwest China during 1961–2000. Atmos. Res. 2016, 169, 139–146. [Google Scholar] [CrossRef]
  4. Wang, Y.J.; Zhou, B.T.; Qin, D.H.; Wu, J.; Gao, R.; Song, L.C. Changes in mean and extreme temperature and precipitation over the arid region of northwestern China: Observation and projection. Adv. Atmos. Sci. 2017, 3, 9–25. [Google Scholar] [CrossRef]
  5. Dios, V.R.D.; Fischer, C.; Collinas, C. Climate change effects on Mediterranean forests and preventive measures. New For. 2007, 33, 29–40. [Google Scholar] [CrossRef]
  6. Weltzin, J.F.; Loik, M.E.; Schwinning, S.; Williams, D.G.; Zak, J.C. Assessing the response of terrestrial ecosystems to potential changes in precipitation. Bioscience 2003, 53, 941–952. [Google Scholar] [CrossRef]
  7. Patrick, L.D.; Ogle, K.; Bell, C.W.; Zak, J.; Tissue, D. Physiological responses of two contrasting desert plant species to precipitation variability are differentially regulated by soil moisture and nitrogen dynamics. Glob. Change Biol. 2009, 15, 1214–1229. [Google Scholar] [CrossRef]
  8. Oliveira, R.S.; Christoffersen, B.O.; Barros, F.D.V.; Teodoro, G.S.; Bittencourt, P.; Brum, M.M., Jr.; Viani, R.A.G. Changing precipitation regimes and the water and carbon economies of trees. Theor. Exp. Plant Physiol. 2014, 26, 65–82. [Google Scholar] [CrossRef]
  9. He, J.; Wu, B.; Bao, F.; Li, J.Z.; Yao, B.; Gao, J.L.; Liu, M.H. Photosynthetic response mechanism of a desert plant species Nitraria tangutorum to rain addition. Sci. Silvae. Sin. 2015, 51, 27–35, (In Chinese with English Summary). [Google Scholar] [CrossRef]
  10. Song, X.L.; Wang, Y.H.; Lv, X.M. Responses of plant biomass, photosynthesis and lipid peroxidation to warming and precipitation change in two dominant species (Stipa grandis and Leymus chinensis) from north China grasslands. Ecol. Evol. 2016, 6, 1871–1882. [Google Scholar] [CrossRef] [PubMed]
  11. Berry, J.; Bjorkman, O. Photosynthetic response and adaptation to temperature in higher plants. Ann. Rev. Plant Physiol. 1980, 31, 491–543. [Google Scholar] [CrossRef]
  12. Limousin, J.M.; Misson, L.; Lavoir, A.V.; Martin, N.K.; Rambal, S. Do photosynthetic limitations of evergreen Quercus ilex leaves change with long-term increased drought severity? Plant Cell Environ. 2010, 33, 863–875. [Google Scholar] [CrossRef]
  13. Ye, Z.P.; Suggett, J.D.; Robakowski, P.; Kang, H.J. A mechanistic model for the photosynthesis-light response based on the photosynthetic electron transport of PSII in C3 and C4 species. New Phytol. 2013, 152, 1251–1262. [Google Scholar] [CrossRef]
  14. Xu, W.Z.; Deng, X.P.; Xu, B.C. Effects of water stress and fertilization on leaf gas exchange and photosynthetic light-response curves of Bothriochloa ischaemum L. Photosynthetica 2013, 51, 603–612. [Google Scholar] [CrossRef]
  15. Liang, G.T.; Liu, J.H.; Zhang, J.M. Effects of drought stress on photosynthetic and physiological parameters of tomato. J. Am. Soc. Hortic. Sci. 2020, 145, 12–17. [Google Scholar] [CrossRef] [Green Version]
  16. Guo, Y.Y.; Yu, H.Y.; Kong, D.S.; Yan, F.; Zhang, Y.J. Effects of drought stress on growth and chlorophyll fluorescence of Lycium ruthenicum Murr. seedlings. Photosynthetica 2016, 54, 524–531. [Google Scholar] [CrossRef]
  17. Siddiqui, S.A.; Khatri, K.; Patel, D.; Rathore, M.S. Photosynthetic gas exchange and chlorophyll a fluorescence in Salicornia brachiata (Roxb.) under osmotic stress. J. Plant Growth Regul. 2021, 41, 429–444. [Google Scholar] [CrossRef]
  18. Noctor, G.; Veljovic-Jovanovic, S.; Driscoll, S.; Novitskaya, L.; Foyer, C.H. Drought and oxidative load in the leaves of C3 plants: A predominant role for photorespiration? Ann. Bot. 2002, 89, 841–850. [Google Scholar] [CrossRef] [PubMed]
  19. Peltzer, D.; Dreyer, E.; Polle, A. Differential temperature dependencies of antioxidative enzymes in two contrasting species: Fagus sylvatica and Coleus blumei. Plant Physiol. Biochem. 2002, 40, 141–150. [Google Scholar] [CrossRef]
  20. Mittler, R. Oxidative stress, antioxidants and stress tolerance. Trends Plant Sci. 2002, 7, 405–410. [Google Scholar] [CrossRef] [PubMed]
  21. Yang, S.Q.; Zhou, R.L.; Liang, H.M.; Zhao, H.L.; Zhao, X.Y. Relationship of antioxidant enzyme and osmoregulation substance to photosynthesis in several desert plants. J. Desert Res. 2015, 35, 1557–1564, (In Chinese with English Summary). [Google Scholar] [CrossRef]
  22. Ma, S.M.; Zhang, M.L.; Sanderson, S.C. Phylogeography of the rare Gymnocarpos przewalskii (Caryophyllaceae): Indications of multiple glacial refugia in north-western China. Aust. J. Bot. 2012, 60, 20–31. [Google Scholar] [CrossRef]
  23. Wang, L.; Huang, H.X.; Shan, L.S.; Gao, T.P.; Zhang, X.H. Population structure and spatial distribution pattern of Gymnocarpos przewalskii in Anxi extra-arid desert national nature reserve. J. Lanzhou Univ. (Nat. Sci.) 2015, 51, 690–698, (In Chinese with English Summary). [Google Scholar] [CrossRef]
  24. Huang, H.X.; Yang, Q.Q.; Cui, P.; Lu, G.; Han, G.J. Changes in morphological and physiological characteristics of Gymnocarpos przewalskii roots in response to water stress. Acta Prataculturae Sin. 2021, 30, 197–207, (In Chinese with English Summary). [Google Scholar] [CrossRef]
  25. Ma, S.; Zhang, M. Phylogeography and conservation genetics of the relic Gymnocarpos przewalskii (Caryophyllaceae) restricted to northwestern China. Conserv. Genet. 2012, 13, 1531–1541. [Google Scholar] [CrossRef]
  26. Zhang, J.Q.; Xu, Z.P.; Wan, T.; Cai, P.; Yi, W.D. Study on potential distribution areas of Gymnocarpos przewalskii in China under future climatic conditions. J. Plant Resour. Environ. 2019, 28, 51–57, (In Chinese with English Summary). [Google Scholar] [CrossRef]
  27. Huang, H.X.; Lian, Z.H.; Wang, L.; Yang, Q.Q.; Wei, Z.Y.; Ma, Y.J.; Zhang, J.X. Response of osmotic regulation substances and antioxidant enzyme activity in leaves of Gymnocarpos przewalskii to drought. Arid Zone Res. 2020, 37, 227–235, (In Chinese with English Summary). [Google Scholar] [CrossRef]
  28. Wang, R.Z.; Gao, Q. Photosynthesis, transpiration and water use efficiency in two divergent Leymus chinensis populations from northeast China. Photosynthetica 2001, 39, 123–126. [Google Scholar] [CrossRef]
  29. Berry, J.A.; Downton, W.J.S. Environmental regulation of photosynthesis. In Photosynthesis; Academic Press: New York, NY, USA, 1982; ISBN 0-12-294302-3. [Google Scholar]
  30. Yin, C.Y.; Berninger, F.; Li, C.Y. Photosynthetic responses of Populus przewalski subjected to drought stress. Photosynthetica 2006, 44, 62–68. [Google Scholar] [CrossRef]
  31. Baker, N.R. Chlorophyll fluorescence: A probe of photosynthesis in vivo. Annu. Rev. Plant Biol. 2008, 59, 89–113. [Google Scholar] [CrossRef] [Green Version]
  32. Roháček, K. Chlorophyll fluorescence parameters: The definitions, photosynthetic meaning, and mutual relationships. Photosynthetica 2002, 40, 13–29. [Google Scholar] [CrossRef]
  33. Arnon, D.I. Copper enzymes in isolated chloroplasts: Polyphenoloxidase in Beta vulgaris. Plant Physiol. 1949, 24, 1. [Google Scholar] [CrossRef] [Green Version]
  34. Jiao, C.J.; Jiang, J.L.; Li, C.; Ke, L.M.; Cheng, W.; Li, F.M.; Li, Z.X.; Wang, C.Y. β-ODAP accumulation could be related to low levels of superoxide anion and hydrogen peroxide in Lathyrus sativus L. Food Chem. Toxicol. 2011, 49, 556–562. [Google Scholar] [CrossRef]
  35. Farooq, M.; Basra, S.M.A.; Wahid, A.; Ahmad, N.; Saleem, B.A. Improving the drought tolerance in rice (Oryza sativa L.) by exogenous application of salicylic acid. J. Agron. Crop Sci. 2009, 195, 237–246. [Google Scholar] [CrossRef]
  36. Hwang, S.Y.; Lin, H.W.; Chern, R.H.; Lo, H.F.; Li, L. Reduced susceptibility to water logging together with high-light stress is related to increases in superoxide dismutase and catalase activities in sweet potato. Plant Growth Regul. 1999, 27, 167–172. [Google Scholar] [CrossRef]
  37. Subin, M.P.; Francis, S. Phytotoxic effects of cadmium on seed germination, early seedling growth and antioxidant enzyme activities in Cucurbita maxima Duchesne. Int. Res. J. Biol. Sci. 2013, 2, 40–47. [Google Scholar]
  38. Pereira, G.J.G.; Molina, S.M.G.; Lea, P.J.; Azevedo, R.A. Activity of antioxidant enzymes in response to cadmium in Crotalaria juncea. Plant Soil 2022, 239, 123–132. [Google Scholar] [CrossRef]
  39. Ekmekci, Y.; Terzioglu, S. Effects of oxidative stress induced by paraquat on wild and cultivated wheats. Pestic. Biochem. Physiol. 2005, 83, 69–81. [Google Scholar] [CrossRef]
  40. Meehl, G.A.; Arblaster, J.M.; Tebaldi, C. Understanding future patterns of increased precipitation intensity in climate model simulations. Geophys. Res. Lett. 2005, 32, 109–127. [Google Scholar] [CrossRef] [Green Version]
  41. Wu, Z.T.; Dijkstra, P.; Koch, G.W.; Penuelas, J.; Hungate, B.A. Responses of terrestrial ecosystem to temperature and precipitation change: A meta-analysis of experimental manipulation. Global Change Biol. 2011, 17, 927–942. [Google Scholar] [CrossRef] [Green Version]
  42. Chong, P.F.; Ji, J.L.; Li, Y.; Shan, L.S.; Su, S.P. Photosynthetic physiology responses to elevated CO2 concentration and changing precipitation in desert plant Reaumuria soongorica. J. Desert Res. 2017, 37, 714–723, (In Chinese with English Summary). [Google Scholar] [CrossRef]
  43. Loik, M.E. Sensitivity of water relations and photosynthesis to summer precipitation pulses for Artemisia tridentata and Purshia tridentate. Plant Ecol. 2007, 191, 95–108. [Google Scholar] [CrossRef]
  44. Ghotbi-Ravandi, A.A.; Shahbazi, M.; Shariati, M.; Mulo, P. Effects of mild and severe drought stress on photosynthetic efficiency in tolerant and susceptible barley (Hordeum vulgare L.) genotypes. J. Agron. Crop Sci. 2014, 200, 403–415. [Google Scholar] [CrossRef]
  45. Zhang, S.Y.; Zhang, G.C.; Gu, S.Y.; Xia, J.B.; Zhao, J.K. Critical responses of photosynthetic efficiency of goldspur apple tree to soil water variation in semiarid loess hilly area. Photosynthetica 2010, 48, 589–595. [Google Scholar] [CrossRef]
  46. Pilon, C.; Snider, J.L.; Sobolev, V.; Chastain, D.R.; Sorensen, R.B.; Meeks, C.D.; Massa, A.N.; Walk, T.; Singh, B.; Earl, H.J. Assessing stomatal and non-stomatal limitations to carbon assimilation under progressive drought in peanut (Arachis hypogaea L.). J. Plant Physiol. 2018, 231, 124–134. [Google Scholar] [CrossRef] [PubMed]
  47. Zhang, Y.J.; Gao, H.; Li, Y.H.; Kong, D.S.; Guo, Y.Y.; Yan, F.; Wang, Y.W.; Lu, K.; Tian, J.W.; Lu, Y.L. Effect of water stress on photosynthesis, chlorophyll fluorescence parameters and water use efficiency of common reed in the Hexi Corridor. Russ. J. Plant Physiol. 2019, 66, 556–563. [Google Scholar] [CrossRef]
  48. Liu, B.; Zhao, W.Z.; Wen, Z.J. Photosynthetic response of two shrubs to rainfall pulses in desert regions of northwestern China. Photosynthetica 2012, 50, 109–119. [Google Scholar] [CrossRef]
  49. Yin, C.Y.; Wang, X.; Duan, B.L.; Luo, J.X.; Li, C.Y. Early growth, dry matter allocation and water use efficiency of two sympatric Populus species as affected by water stress. Environ. Exp. Bot. 2005, 53, 315–322. [Google Scholar] [CrossRef]
  50. Gao, S.; Su, P.X.; Yan, Q.D.; Ding, S.S. Canopy and leaf gas exchange of Haloxylon ammodendron under different soil moisture regimes. Sci. China Life Sci. 2010, 53, 718–728. [Google Scholar] [CrossRef]
  51. Guo, W.H.; Li, B.; Zhang, X.S.; Wang, R.Q. Effects of water stress on water use efficiency and water balance components of Hippophae rhamnoides and Caragana intermedia in the soil-plant-atmosphere continuum. Agrofor. Syst. 2010, 80, 423–435. [Google Scholar] [CrossRef]
  52. Cai, F.; Zhang, Y.; Mi, N.; Ming, H.Q.; Zhang, S.J.; Zhang, H.; Zhao, X.L. Maize (Zea mays L.) physiological responses to drought and rewatering, and the associations with water stress degree. Agric. Water Manag. 2020, 241, 106379. [Google Scholar] [CrossRef]
  53. Ye, Z.P. A new model for relationship between irradiance and the rate of photosynthesis in Oryza sativa. Phtosynthetica 2007, 45, 637–640. [Google Scholar] [CrossRef]
  54. Ma, C.; Wang, Z.Q.; Zhang, L.T.; Sun, M.M.; Lin, T.B. Photosynthetic responses of wheat (Triticum aestivum L.) to combined effects of drought and exogenous methyl jasmonate. Photosynthetica 2014, 52, 377–385. [Google Scholar] [CrossRef]
  55. Iryna, I.T.; Michael, M.B. Effect of delayed fruit harvest on photosynthesis, transpiration and nutrient remobilization of apple leaves. New Phytol. 2004, 164, 441–450. [Google Scholar] [CrossRef]
  56. Wang, R.R.; Xia, J.B.; Yang, J.H.; Zhao, Y.Y.; Liu, J.T.; Sun, J.K. Comparison of light response models of photosynthesis in leaves of Periploca sepium under drought stress in sand habitat formed from seashells. Chin. J. Plant Ecol. 2013, 37, 111–121, (In Chinese with English Summary). [Google Scholar] [CrossRef]
  57. Datt, B. A new reflectance index for remote sensing of chlorophyll content in higher plants: Tests using eucalyptus leaves. J. Plant Physiol. 1999, 154, 30–36. [Google Scholar] [CrossRef]
  58. Santos, C.V. Regulation of chlorophyll biosynthesis and degradation by salt stress in sunflower leaves. Sci. Hortic. 2004, 103, 93–99. [Google Scholar] [CrossRef]
  59. Fang, Z.; Bouwkamp, J.; Solomos, T. Chlorophyllase activities and chlorophyll degradation during leaf senescence in non-yellowing mutant and wild type of Phaseolus vulgaris L. J. Exp. Bot. 1998, 49, 503–510. [Google Scholar] [CrossRef] [Green Version]
  60. Wu, F.Z.; Bao, W.K.; Li, F.L.; Wu, N. Effects of water stress and nitrogen supply on leaf gas exchange and fluorescence parameters of Sophora davidii seedlings. Photosynthetica 2008, 46, 40–48. [Google Scholar] [CrossRef]
  61. Kalaji, H.M.; Jajoo, A.; Oukarroum, A.; Brestic, M.; Zivcak, M.; Samborska, I.A.; Cetner, M.D.; Lukasik, I.; Goltsev, V.; Ladle, R.J. Chlorophyll a fluorescence as a tool to monitor physiological status of plants under abiotic stress conditions. Acta Physiol. Plant. 2016, 38, 102–112. [Google Scholar] [CrossRef] [Green Version]
  62. Sharma, D.K.; Andersen, S.B.; Ottosen, C.O.; Rosenquist, E. Wheat cultivars selected for high Fv/Fm under heat stress maintain high photosynthesis, total chlorophyll, stomatal conductance, transpiration and dry matter. Physiol. Plant. 2015, 153, 284–298. [Google Scholar] [CrossRef] [PubMed]
  63. Rahbarian, R.; Khavari-Nejad, R.; Ganjeali, A.; Bagheri, A.; Najafi, F. Drought stress effects on photosynthesis, chlorophyll fluorescence and water relations in tolerant and susceptible chickpea (Cicer arietinum L.) genotypes. Acta. Biol. Cracov. Ser. Bot. 2011, 53, 47–56. [Google Scholar] [CrossRef]
  64. Krall, J.P.; Edward, G.E. Relationship between photosystem II activity and CO2 fixation in leaves. Physiol. Plant. 1992, 86, 180–187. [Google Scholar] [CrossRef]
  65. Martínez, C.R.; Sánchez, R.J.; Pérez, P. Changes in chlorophyll fluorescence during the course of photoperiod and in response to drought in Casuarina equisetifolia Forst. and Forst. Photosynthetica 2002, 40, 363–368. [Google Scholar] [CrossRef]
  66. Pellegrini, E.; Francini, A.; Lorenzini, G.; Nali, C. PSII photochemistry and carboxylation efficiency in Liriodendron tulipifera under ozone exposure. Environ. Exp. Bot. 2011, 70, 217–226. [Google Scholar] [CrossRef]
  67. Piñol, R.; Simón, E. Effect of 24-Epibrassinolide on chlorophyll fluorescence and photosynthetic CO2 assimilation in Vicia faba plants treated with the photosynthesis-inhibiting herbicide terbutryn. J. Plant Growth Regul. 2009, 28, 97–105. [Google Scholar] [CrossRef]
  68. Flexas, J.; Medrano, H. Energy dissipation in C3 plants under drought. Funct. Plant Biol. 2002, 29, 1209–1215. [Google Scholar] [CrossRef]
  69. Stefanov, D.; Terashima, I. Non-photochemical loss in PSII in high-and low-light-grown leaves of Vicia faba quantified by several fluorescence parameters including LNP, F0/F’m, a novel parameter. Physiol. Plant. 2008, 133, 327–338. [Google Scholar] [CrossRef]
  70. Chaves, M.M.; Maroco, J.P.; Pereira, J.S. Understanding plant responses to drought—From genes to the whole plant. Funct. Plant Biol. 2003, 30, 239–264. [Google Scholar] [CrossRef]
  71. Carvalho, M. Drought stress and reactive oxygen species: Production, scavenging and signaling. Plant Signal. Behav. 2008, 3, 156–165. [Google Scholar] [CrossRef] [Green Version]
  72. Foyer, C.H.; Shigeoka, S. Understanding oxidative stress and antioxidant functions to enhance photosynthesis. Plant Physiol. 2011, 155, 93–100. [Google Scholar] [CrossRef] [PubMed] [Green Version]
  73. Bian, S.; Jiang, Y. Reactive oxygen species, antioxidant enzyme activities and gene expression patterns in leaves and roots of Kentucky bluegrass in response to drought stress and recovery. Sci. Hortic. 2009, 120, 264–270. [Google Scholar] [CrossRef]
  74. Jiang, J.L.; Su, M.; Chen, Y.R.; Gao, N.; Jiao, C.J.; Sun, Z.X.; Li, F.M.; Wang, C.Y. Correlation of drought resistance in grass pea (Lathyrus sativus) with reactive oxygen species scavenging and osmotic adjustment. Biologia 2013, 68, 231–240. [Google Scholar] [CrossRef]
  75. Akyol, T.Y.; Ylmaz, O.; Uzilday, B.; Ozgur, R.; Turkan, I. Plant response to salinity: An analysis of ROS formation, signaling, and antioxidant defense. Turk. J. Bot. 2020, 44, 1–13. [Google Scholar] [CrossRef]
  76. Alscher, R.G.; Erturk, N.; Heath, L.S. Role of superoxide dismutases (SODs) in controlling oxidative stress in plants. J. Exp. Bot. 2002, 53, 1331–1341. [Google Scholar] [CrossRef]
  77. Asada, K. Production and scavenging of reactive oxygen species in chloroplasts and their functions. Plant Physiol. 2006, 141, 391–396. [Google Scholar] [CrossRef] [Green Version]
  78. Shan, Z.Y.; Luo, X.L.; Wei, M.G.; Huang, T.W.; Khan, A.; Zhu, Y.M. Physiological and proteomic analysis on long-term drought resistance of cassava (Manihot esculenta Crantz). Sci. Rep. 2018, 8, 17982. [Google Scholar] [CrossRef] [Green Version]
  79. Zhang, P.Q.; Bai, J.D.; Liu, Y.J.; Meng, Y.P.; Yang, Z.; Liu, T. Drought resistance of ten ground cover seedling species during roof greening. PLoS ONE 2020, 15, e0220598. [Google Scholar] [CrossRef]
  80. Ding, L.; Zhao, H.M.; Zeng, W.J.; Li, J.; Wang, Y.; Wang, S.Q. Physiological responses of five plants in northwest China arid area under drought stress. Chin. J. Appl. Ecol. 2017, 8, 1455–1463, (In Chinese with English Summary). [Google Scholar] [CrossRef]
  81. Uzilday, B.; Turkan, I.; Sekmen, A.H.; Ozgur, R.; Karakaya, H.C. Comparison of ROS formation and antioxidant enzymes in Cleome gynandra (C4) and Cleome spinosa (C3) under drought stress. Plant Sci. 2020, 182, 59–70. [Google Scholar] [CrossRef] [Green Version]
  82. Wang, Y.; Duan, X.L.; Xu, S.; Wang, R.; Ouyang, Z.Z.; Shen, W.B. Linking hydrogen-mediated boron toxicity tolerance with improvement of root elongation, water status and reactive oxygen species balance: A case study for rice. Ann. Bot. 2016, 118, 1279–1291. [Google Scholar] [CrossRef] [PubMed]
  83. Bragg, W.K.; Knapp, A.K.; Briggs, J.M. Comparative water relations of seedling and adult Quercus species during gallery forest expansion in tallgrass prairie. For. Ecol. Manag. 1993, 56, 29–41. [Google Scholar] [CrossRef]
  84. Cui, M.; Smith, W.K. Photosynthesis, water relations and mortality in Abies lasiocarpa seedlings during natural establishment. Tree Physiol. 1991, 8, 37–46. [Google Scholar] [CrossRef] [PubMed]
  85. Webster, C.L.; Kilminster, K.L.; Sánchez Alarcón, M.; Bennett, K.; Strydom, S.; McNamara, S.; Lavery, P.S.; McMahon, K.M. Population-specific resilience of Halophila ovalis seagrass habitat to unseasonal rainfall, an extreme climate event in estuaries. J. Ecol. 2021, 109, 3260–3279. [Google Scholar] [CrossRef]
  86. Trenberth, K.E. Changes in precipitation with climate change. Clim. Res. 2011, 47, 123–138. [Google Scholar] [CrossRef] [Green Version]
  87. Guehl, J.M.; Picon, C.; Aussenac, G.; Gross, P. Interactive effects of elevated CO2 and soil drought on growth and transpiration efficiency and its determinants in two European forest tree species. Tree Physiol. 1994, 14, 707–724. [Google Scholar] [CrossRef]
Figure 1. Location of the study area.
Forests 14 00789 g001
Figure 2. Changes in the photosynthetic characteristic parameters of Gymnocarpos przewalskii leaves under rainfall change. (A): Pn; (B): Gs; (C): Ci; (D): Tr; (E): WUE; (F): Ls; Pn, net photosynthetic rate; Gs, stomatal conductance; Tr, transpiration rate; Ci, intercellular CO2 concentration; WUE, water-use efficiency; Ls, stomatal limitation; R0, mean monthly rainfall from May to August during the period from 1961 to 2018; R−30, R0 decreased by 30%; R−15, R0 decreased by 15%; R+15, R0 increased by 15%; R+30, R0 increased by 30%. The vertical bars represent the means ± SE (n = 3), and different lowercase letters above the bars indicate significant differences among the treatments (p < 0.05).
Forests 14 00789 g002
Figure 3. Pn–PAR curves under rainfall change. Pn, net photosynthetic rate; PAR, photosynthetic active radiation; R0, mean monthly rainfall from May to August during the period from 1961 to 2018; R−30, R0 decreased by 30%; R−15, R0 decreased by 15%; R+15, R0 increased by 15%; R+30, R0 increased by 30%.Values are shown as means ± SE (n = 3).
Forests 14 00789 g003
Figure 4. Changes in chlorophyll fluorescence parameters in Gymnocarpos przewalskii leaves under rainfall change. (A): Fo; (B): Fm; (C): Fv/Fo; (D): Fv/Fm; (E): QY_Lss; (F): Rfd_Lss; (G): NPQ_Lss; (H): qL_Lss; Fo, initial fluorescence; Fm, maximum fluorescence; Fv/Fo, potential activity of PSII; Fv/Fm, maximum quantum yield of PSII; QY_Lss, steady state optical quantum efficiency; Rfd_Lss, steady state fluorescence decay rate; NPQ_Lss, steady state non-photochemical quenching coefficient; qL_Lss, steady state photochemical quenching coefficient; R0, mean monthly rainfall from May to August during the period from 1961 to 2018; R−30, R0 decreased by 30%; R−15, R0 decreased by 15%; R+15, R0 increased by 15%; R+30, R0 increased by 30%. Vertical bars represent the means ± SE (n = 3), and different lowercase letters above the bars indicate significant differences among the treatments (p < 0.05).
Forests 14 00789 g004
Figure 5. Changes in the antioxidant enzyme activities in Gymnocarpos przewalskii leaves under rainfall change. (A): O2; (B): H2O2; (C): MDA; (D): SOD; (E): POD; (F): CAT; O2, superoxide anion; H2O2, hydrogen peroxide; MDA, malondialdehyde; SOD, superoxide dismutase; POD, peroxidase; CAT, catalase; R0, mean monthly rainfall from May to August during the period from 1961 to 2018; R−30, R0 decreased by 30%; R−15, R0 decreased by 15%; R+15, R0 increased by 15%; R+30, R0 increased by 30%. Vertical bars represent the means ± SE (n = 3), and different lowercase letters above the bars indicate significant differences among the treatments (p < 0.05).
Forests 14 00789 g005
Table 1. Average monthly rainfall from May to August during the period of 1961 to 2018 and irrigation volume in the present study.
MonthRainfall (mm)Irrigation Volume (mL)
R−30R−15R0R+15R+30
May11.71366.41659.21952.02244.72537.5
June14.51686.42047.72409.12770.43131.8
July23.82776.13370.93965.84560.75155.5
August28.73347.54064.84782.15499.46216.7
R0 = monthly rainfall from May to August during the period from 1961 to 2018; R+30, R+15 = R0 increased by 30% and 15%, respectively; R−30, R−15 = R0 decreased by 30% and 15%, respectively.
Table 2. Light response parameters of Gymnocarpos przewalskii leaves under different rainfall treatments.
TreatmentAQYRd/
(µmol m−2 s−1)
Pnmax/
(µmol m−2 s−1)
Lsp/
(µmol m−2 s−1)
Lcp/
(µmol m−2 s−1)
R−300.006 ± 0.001 c1.16 ± 0.24 a3.01 ± 0.47 d1408.96 ± 45.11 b195.88 ± 9.86 a
R−150.009 ± 0.002 bc1.12 ± 0.11 a4.39 ± 0.38 cd1423.50 ± 27.93 b134.28 ± 2.31 b
R00.010 ± 0.003 bc0.96 ± 0.25 a6.17 ± 0.45 bc1719.98 ± 46.44 a99.94 ± 4.64 c
R+150.016 ± 0.004 ab0.99 ± 0.23 a7.86 ± 0.53 ab1860.54 ± 30.13 a65.03 ± 3.00 d
R+300.022 ± 0.003 a0.84 ± 0.36 a9.50 ± 0.46 a1938.27 ± 56.28 a40.25 ± 5.11 e
AQY, apparent quantum efficiency; Rd, dark respiratory rate; Pnmax, maximum net photosynthetic rate; Lsp, light saturation point; Lcp, light compensation point; R0, mean monthly rainfall from May to August during the period from 1961 to 2018; R−30, R0 decreased by 30%; R−15, R0 decreased by 15%; R+15, R0 increased by 15%; R+30, R0 increased by 30%. Values are shown as mean ± SE (n = 3). Different lower-case letters in the same column indicate significant differences among the treatments at p < 0.05.
Table 3. Changes in the chlorophyll content of Gymnocarpos przewalskii leaves under different rainfall treatments.
TreatmentChla
(mg g−1 FW)
Chlb
(mg g−1 FW)
Chl
(mg g−1 FW)
Chla/b
R−300.74 ± 0.12 e1.55 ± 0.22 d2.29 ± 0.03 e0.48 ± 0.01 c
R−150.91 ± 0.08 d1.69 ± 0.15 c2.60 ± 0.98 d0.55 ± 0.92 c
R01.25 ± 0.06 c1.76 ± 0.07 bc3.01 ± 0.37 c0.71 ± 0.06 b
R+151.55 ± 0.98 b1.86 ± 0.87 b3.41 ± 0.87 b0.83 ± 0.07 a
R+301.67 ± 0.04 a2.00 ± 0.17 a3.67 ± 0.67 a0.84 ± 0.05 a
Chla, chlorophyll a; Chlb, chlorophyll b, Chl, total chlorophyll; Chla/b, ratio of chlorophyll a to chlorophyll b; R0, mean monthly rainfall from May to August during the period from 1961 to 2018; R−30, R0 decreased by 30%; R−15, R0 decreased by 15%; R+15, R0 increased by 15%; R+30, R0 increased by 30%. Values are shown as mean ± SE (n = 3). Different lowercase letters in the same column indicate significant differences among the treatments at p < 0.05.
Table 4. Correlation between the characteristic parameters of the light response curves and fluorescence parameters.
ParametersFv/FoFv/FmQY_LssNPQ_LssqL_LssAQYRdPnmaxLspLcp
Fv/Fo1
Fv/Fm0.973 **1
QY_Lss0.826 **0.763 **1
NPQ_Lss−0.752 **−0.662 **−0.698 **1
qL_Lss0.835 **0.766 **0.891 **−0.770 **1
AQY0.635 *0.548 *0.676 **−0.558 *−0.792 **1
Rd−0.234−0.128−0.1330.062 −0.177−0.3581
Pnmax0.815 **0.716 **0.828 **−0.797 **0.892 **0.812 **−0.229 1
Lsp0.932 **0.878 **0.905 **−0.684 **0.863 **0.684 **−0.140 0.817 **1
Lcp−0.909 **−0.848 **−0.836 **0.813 **−0.872 **−0.761 **0.319 −0.888 **−0.854 **1
Fv/Fo, potential activity of PSII; Fv/Fm, maximum quantum yield of PSII; QY_Lss, steady-state optical quantum efficiency; NPQ_Lss, steady-state non-photochemical quenching coefficient; qL_Lss, steady-state photochemical quenching coefficient; AQY, apparent quantum efficiency; Rd, dark respiratory rate; Pnmax, maximum net photosynthetic rate; Lsp, light saturation point; Lcp, light compensation point; * p < 0.05; ** p < 0.01.
Disclaimer/Publisher’s Note: The statements, opinions and data contained in all publications are solely those of the individual author(s) and contributor(s) and not of MDPI and/or the editor(s). MDPI and/or the editor(s) disclaim responsibility for any injury to people or property resulting from any ideas, methods, instructions or products referred to in the content.

