Article

The Importance of Initial Seedling Characteristics in Controlling Allocation to Growth and Reserves under Different Soil Moisture Conditions

by
Simon M. Landhäusser
1,*,†,
Erin T. Wiley
2,†,
Kevin A. Solarik
3,
Shaun P. Kulbaba
1 and
Alexander E. Goeppel
1
1
Department of Renewable Resources, University of Alberta, Edmonton, AB T6G 2H1, Canada
2
Department of Biology, University of Central Arkansas, Conway, AR 72035, USA
3
National Council for Air and Stream Improvement, Inc. (NCASI), 2000 McGill College Avenue, Montreal, QC H3A 3H3, Canada
*
Author to whom correspondence should be addressed.
These authors contributed equally to this work.
Forests 2023, 14(4), 796; https://doi.org/10.3390/f14040796
Submission received: 2 March 2023 / Revised: 6 April 2023 / Accepted: 9 April 2023 / Published: 13 April 2023
(This article belongs to the Special Issue Production in Forest Nurseries and Field Performance of Seedlings)

Abstract

:
After disturbance, forest regeneration and resiliency depend on the ability of seedlings to respond, survive, and grow under a variety of stress conditions, including drought. Despite recent efforts to improve our fundamental knowledge surrounding plant response mechanisms to stress and their application in seedling quality research, initial seedling characteristics are often ignored when exploring seedling responses to stress in field plantings or ecophysiological studies. Here, we explore how initial differences in size, biomass allocation, and non-structural carbohydrate (NSC) storage affect the subsequent partitioning of new biomass, growth potential, and drought response in seedlings of a deciduous broad-leaved (Populus tremuloides) and an evergreen coniferous species (Pinus banksiana). We exposed seedlings of both species to different growing conditions in their first growing season in order to manipulate the aforementioned seedling characteristics. In a second growing season, we exposed these different seedling types to a subsequent drought stress. While drought reduced both structural growth and NSC storage in all seedling types, the expected shift in allocation favoring roots was only observed in seedling types with initially low root:shoot or root:stem ratios. Overall, we also found that the traits associated with greater growth were quite different between pine and aspen. While larger seedlings led to greater growth in pine, it was the smallest seedling type in aspen with the largest root:stem ratio that produced the most new growth. In aspen, this smaller seedling type was the only one that did not undergo a shift in biomass relative to its initial allometry, suggesting that adjustments in biomass allocation made by other, larger seedling types must have come at the cost of lower growth. In contrast, adjustments in allocation did not appear to negatively impact pine, possibly because reduced root:shoot ratios of larger seedlings did not reduce NSC storage, as it did in aspen. Our results highlight (1) the complexity of how differences in biomass allocation and changes in seedling size may alter storage and the response of species to drought, and (2) the importance of accounting for initial seedling characteristics (both morphological and physiological) when predicting seedling growth and the impacts of environmental stressors.

1. Introduction

Because of forests’ ability to capture and sequester significant quantities of carbon, there are increasing efforts to protect and even expand the amount of forest cover worldwide. However, this goal is challenged by the increasing threat of natural and human-caused disturbances and large-scale forest die-off events, exasperated by climate change [1,2,3,4,5,6,7]. In the short-term, forest cover is impacted by the ability of large canopy trees to resist disturbance and cope with post-disturbance conditions [8]. However, the maintenance of forests in perpetuity is ultimately determined by their ability to regenerate successfully [9], which on severely disturbed sites, occurs naturally via recruitment through seed dispersal or via human intervention through artificial planting [10]. Additionally, because the tree seedling stage can be extremely sensitive to environmental changes and prone to much higher mortality rates than mature trees [11,12,13,14], forest regeneration may largely depend on the ability of seedlings to survive and grow under a variety of different conditions.
Though seedlings are generally very sensitive to stress, their responses may depend on the seedlings’ initial physiological conditions and morphological characteristics—such as growth form, biomass allocation, and carbohydrate or nutrient reserve status—prior to a stress event or at the time of planting [15,16]. This concept has been widely applied in seedling quality research by manipulating the growing conditions in attempts to alter seedling traits that will improve their performance (Reviewed by [17]). For example, seedlings preconditioned with mild stress during their production have shown improved stress tolerance and survival after outplanting (e.g., [8,18,19,20]). An increasing challenge for forest regeneration efforts is to ensure that establishing seedlings will be able to cope with stressors such as drought. Despite recent efforts to improve our knowledge of how seedling physiology is impacted by drought [21,22] and how species’ responses may vary [19,23,24], it is still unclear how dependent a given species’ drought response is on the initial physiological and morphological condition of the seedling (but see [25,26]). Thus, better knowledge of how seedling characteristics are influenced by different initial growing conditions—and how these different characteristics may affect subsequent growth and survival—could help us (1) produce seedlings better adapted for different environments or different uses (i.e., target seedling concept [27,28,29] and (2) better understand and interpret stress responses when executing seedling based studies.
One way that plants commonly cope with stressors such as drought is to alter biomass or resource allocation among organs [30]. According to optimal partitioning theory, plants should favor the partitioning of resources towards organs responsible for capturing the resource that limits growth and survival [31]. For example, many plants growing in light-limiting conditions will allocate proportionally more mass towards the leaves and shoots necessary for the acquisition of light [32,33], while plants growing under water-limiting conditions have consistently shown an increased root mass fraction by either allocating relatively more biomass towards the root system [34,35,36] or by the shedding of leaves and branches [37,38,39,40]. For example, shade-grown seedlings allocated more biomass belowground when exposed to a subsequent drought than seedlings that had been growing in high light conditions [41,42,43], suggesting that the allocation response to drought depends on the pre-drought conditions the seedling was exposed to. Thus, while allocation changes with environmental conditions are well described, it is still unclear whether initial differences in biomass allocation or other physiological traits—caused by differences in genetics and/or previous environmental conditions—can alter how seedlings allocate resources in response to subsequent stressors, making these allocation shifts less universal than previously thought. Additionally, if initial biomass allocation differences do impact subsequent allocation, it is not known if these different responses lead to differences in seedling performance.
Alterations to biomass allocation may also indirectly affect plant performance and stress responses by affecting the storage of non-structural carbohydrates (NSC). NSC storage provides a source of C that can be remobilized under stress or following disturbances [44,45,46], with higher concentrations associated with greater growth and survival [26,47,48,49]. During drought, NSCs can also play an active role in plant hydraulic integrity, as they influence water uptake and turgor maintenance through their role in osmotic adjustment [12,50,51,52]. Therefore, while increased root biomass allocation in response to drought can be the result of changes in structural root growth, it may also simply reflect increases in organic solutes and NSC reserves [37,50,51,53]. Finally, because species differ in terms of storage patterns between organs [54,55,56], changes in biomass allocation may have different impacts on storage in different species, which in turn may affect how new biomass is subsequently allocated [24]. Therefore, initial differences and subsequent changes in NSC storage should be considered when evaluating biomass allocation as well considering traits that may improve seedling growth and survival.
In this study, we explore how initial differences in seedling size, biomass allocation, and NSC storage affect the subsequent partitioning of new biomass, growth, and drought response in two common boreal tree species, aspen (Populus tremuloides Michx.) and jack pine (Pinus banksiana Lamb). Specifically, we ask (1) how do differences in initial characteristics affect growth and storage under well-watered and water-stressed conditions? (2) do the traits associated with higher growth differ between species and growing conditions? and (3) Do allocation shifts in response to drought depend on initial seedling conditions?

2. Materials and Methods

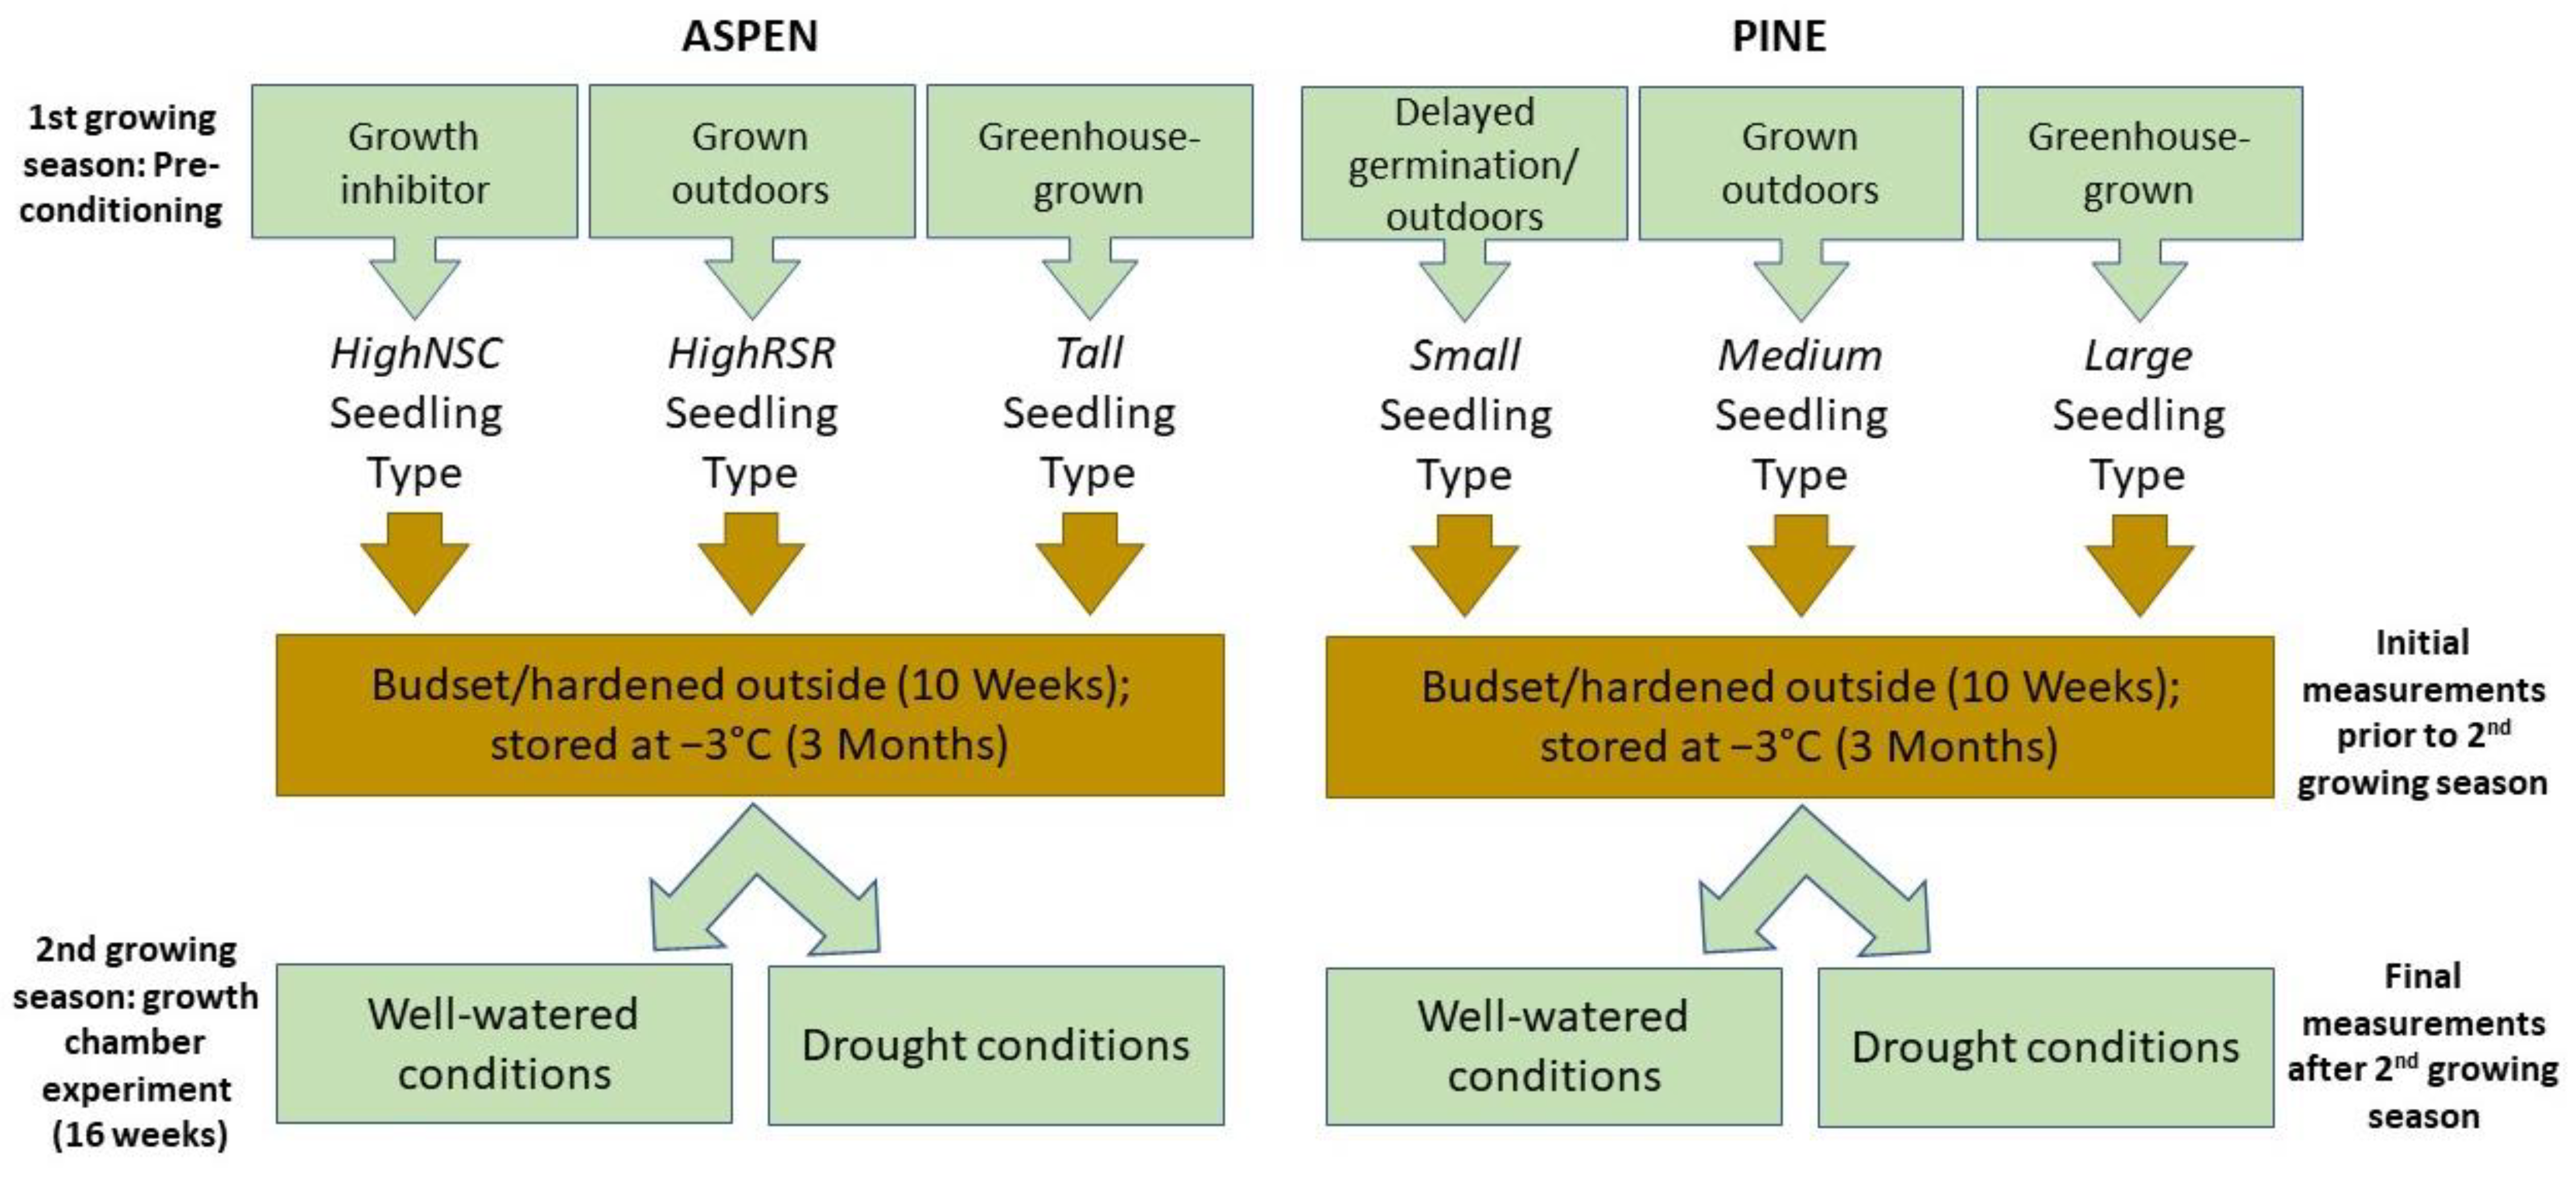
Both aspen and jack pine seeds were obtained from our industry partners and represent a range of populations of open-pollinated seed sources near Fort McMurray, Alberta, Canada (56°73′50″ N; 111°38′01″ W). Approximately 300 seedlings were grown for each species at the Crop Diversification Centre North Facility (Alberta Agriculture and Forestry, Government of Alberta) located in Edmonton, Alberta, Canada (53°64′28″ N; 113°36′13″ W). Aspen was grown in 615A styro-blocks (cavity size: 6 cm diameter 15 cm deep; 340 mL volume), and jack pine was grown in 412A (4 cm diameter and 12 cm deep; 125 mL) (Beaver Plastics Ltd., Acheson, AB, Canada). Cavities were uniformly filled with a commercial growth medium, which was composed of 90% sphagnum peat moss, 10% perlite, and dolomitic limestone (Sun Gro Horticulture Canada Ltd., Seba Beach, AB, Canada). After filling the styro-blocks at a nursery using mechanized equipment which ensured uniformity of the medium mixture, its fill and compaction in each cavity, the growth medium was watered to field capacity (~0.6 g g−1 gravimetric soil water content) and seeded. After germination, germinates were treated with a single fertilization of 2 g L−1 of a commercial fertilizer (Plants Products Co., Ltd., Leamington, ON, Canada 5-15-5 (N-P-K) containing chelated micronutrients). After three weeks of growth, a second single fertilization of 1 g L−1 10-52-10 was applied to stimulate root growth. Following the seedling establishment phase (first four weeks), seedlings were fertigated twice weekly for 16 weeks (watered and fertilized with a blend of 91 ppm N 77 ppm P and 161 ppm K with chelated micronutrients a blend used by commercial nurseries). The commercial fertilization regime allowed all seedlings to be fertilized in excess throughout the growth period. Figure A1 provides a simplified flow-chart that depicts the different steps used in the execution of this study. Detailed information of each step is provided in the text below.
Once aspen seedlings reached an average height of approximately 20 cm, seedlings were randomly separated into three groups with the intention of creating seedlings with different morphological and physiological characteristics. Based on earlier studies [48,57,58], aspen seedlings were grown in conditions to achieve: (A) high tissue NSC concentrations by artificially restricting seedling height growth using a growth inhibitor during the growing season; (B) a high root-to-stem ratio (RSR) by moving seedlings to outside conditions, and (C) tall seedlings with low RSR and NSC by continually growing seedlings under optimal greenhouse conditions (see also below).
To create three different seedling types with different characteristics in pine, we grew seedlings under three different growing conditions: (A) seedlings were established and grown for 5 months under greenhouse conditions (April to September), (B) seedlings were established at the same time in April as (A), but were moved outdoors between June and September, and (C) seedlings were established from seed in May and grown outside between June and September, representing more natural establishment period.
During the greenhouse phase, seedlings were exposed to average day and night temperatures of 20/16 °C, 50% relative humidity, and 16-17 h of light. After 20 weeks, the greenhouse-grown seedlings were transferred to the outside conditions for bud set and hardening during the fall (10 weeks, between September and November) prior to frozen storage in late November. After all seedlings had hardened outside, they were lifted, placed in plastic bags, and then in waxed cardboard boxes where they were stored frozen at −3 °C for three months. One week prior to the start of the experiment, all seedlings were removed from frozen storage and allowed to slowly thaw in a refrigerator (4 °C). To ensure a comparative distribution of initial seedling sizes within seedling types for the study, 50 seedlings representative of each seedling type and species were selected based on the median height and root collar diameter (RCD) for each seedling type and species. Based on six seedling types (three for each species), a total of about 300 seedlings were selected, 150 for each species. Further, to avoid any potential bias in seedlings selection for the treatment assignment, seedlings of similar size distributions within each seedling type were assigned to the initial pre-treatment measurements and to each subsequent treatment.

2.1. Initial Seedling Measurements

To determine initial seedling characteristics for each seedling type prior to the drought study, a random sample of 10 dormant seedlings was taken from the 50 seedlings in each seedling type. The following variables were measured: seedling height (stem length), RCD, and the dry mass of stems, needles (only in pine), and roots after samples were oven-dried at 100 °C for 1 h and then dried to constant weight at 70 °C (72 h). Additionally, to quantify organ-specific (needle, stem, and root) NSC concentrations all dry samples were first ground using a Wiley Mini-Mill (Thomas Scientific, Swedesboro, NJ, USA) to pass 40 mesh (0.4 mm). Starch and sugar concentrations (% dry mass) for each organ were quantified after water soluble sugars were extracted using 80% ethanol at 90 °C. Soluble sugar concentrations were determined colorimetrically with phenol-sulfuric acid, while the starch in the remaining pellet was digested to glucose using α-amylase and amyloglucosidase (σ) and glucose concentration was colorimetrically quantified using peroxidase-glucose oxidase/o-dianisidine [59,60]. NSC concentrations are presented in this study as the sum of soluble sugars and starch concentrations for each organ.
NSC content (NSC mass) of each organ was calculated based on the total biomass (biomassTotal) for each organ and its NSC concentration. Whole seedling NSC mass was calculated as the sum of NSC mass of all organs, and whole seedling NSC concentration was calculated as the whole seedling NSC mass divided by total whole seedling biomass (sum of biomassTotal of all organs). To distinguish changes in NSC content from structural tissue growth at the organ and whole seedling level, structural biomass (biomassStructural) was calculated by subtracting the NSC mass from the biomassTotal.

2.2. Characterizing and Separating Initial Seedling Conditions

To identify objectively initial differences in seedling conditions, seedling characteristics were analyzed in two ways. First, species-specific multivariate regression tree analyses (MRT) were performed to separate individual seedlings based on their initial seedling characteristics. In short, MRT analyses create dichotomies in a hierarchical manner where seedlings possessing similar characteristics are clustered together, and those that differ are split apart. A Euclidian distance measure was used to determine dissimilarities in our analysis. Final tree selection was determined following 1000 cross-validations, verified using the 1-SE (standard error) rule [14,61]. MRT analyses were conducted using the mvpart package 1.6-2 library within the R version 3.3.1 [62]. Second, we also conducted one-way ANOVAs followed by Tukey’s Honestly Significant Difference tests in R to test for differences in all measured variables among seedling types within a species.
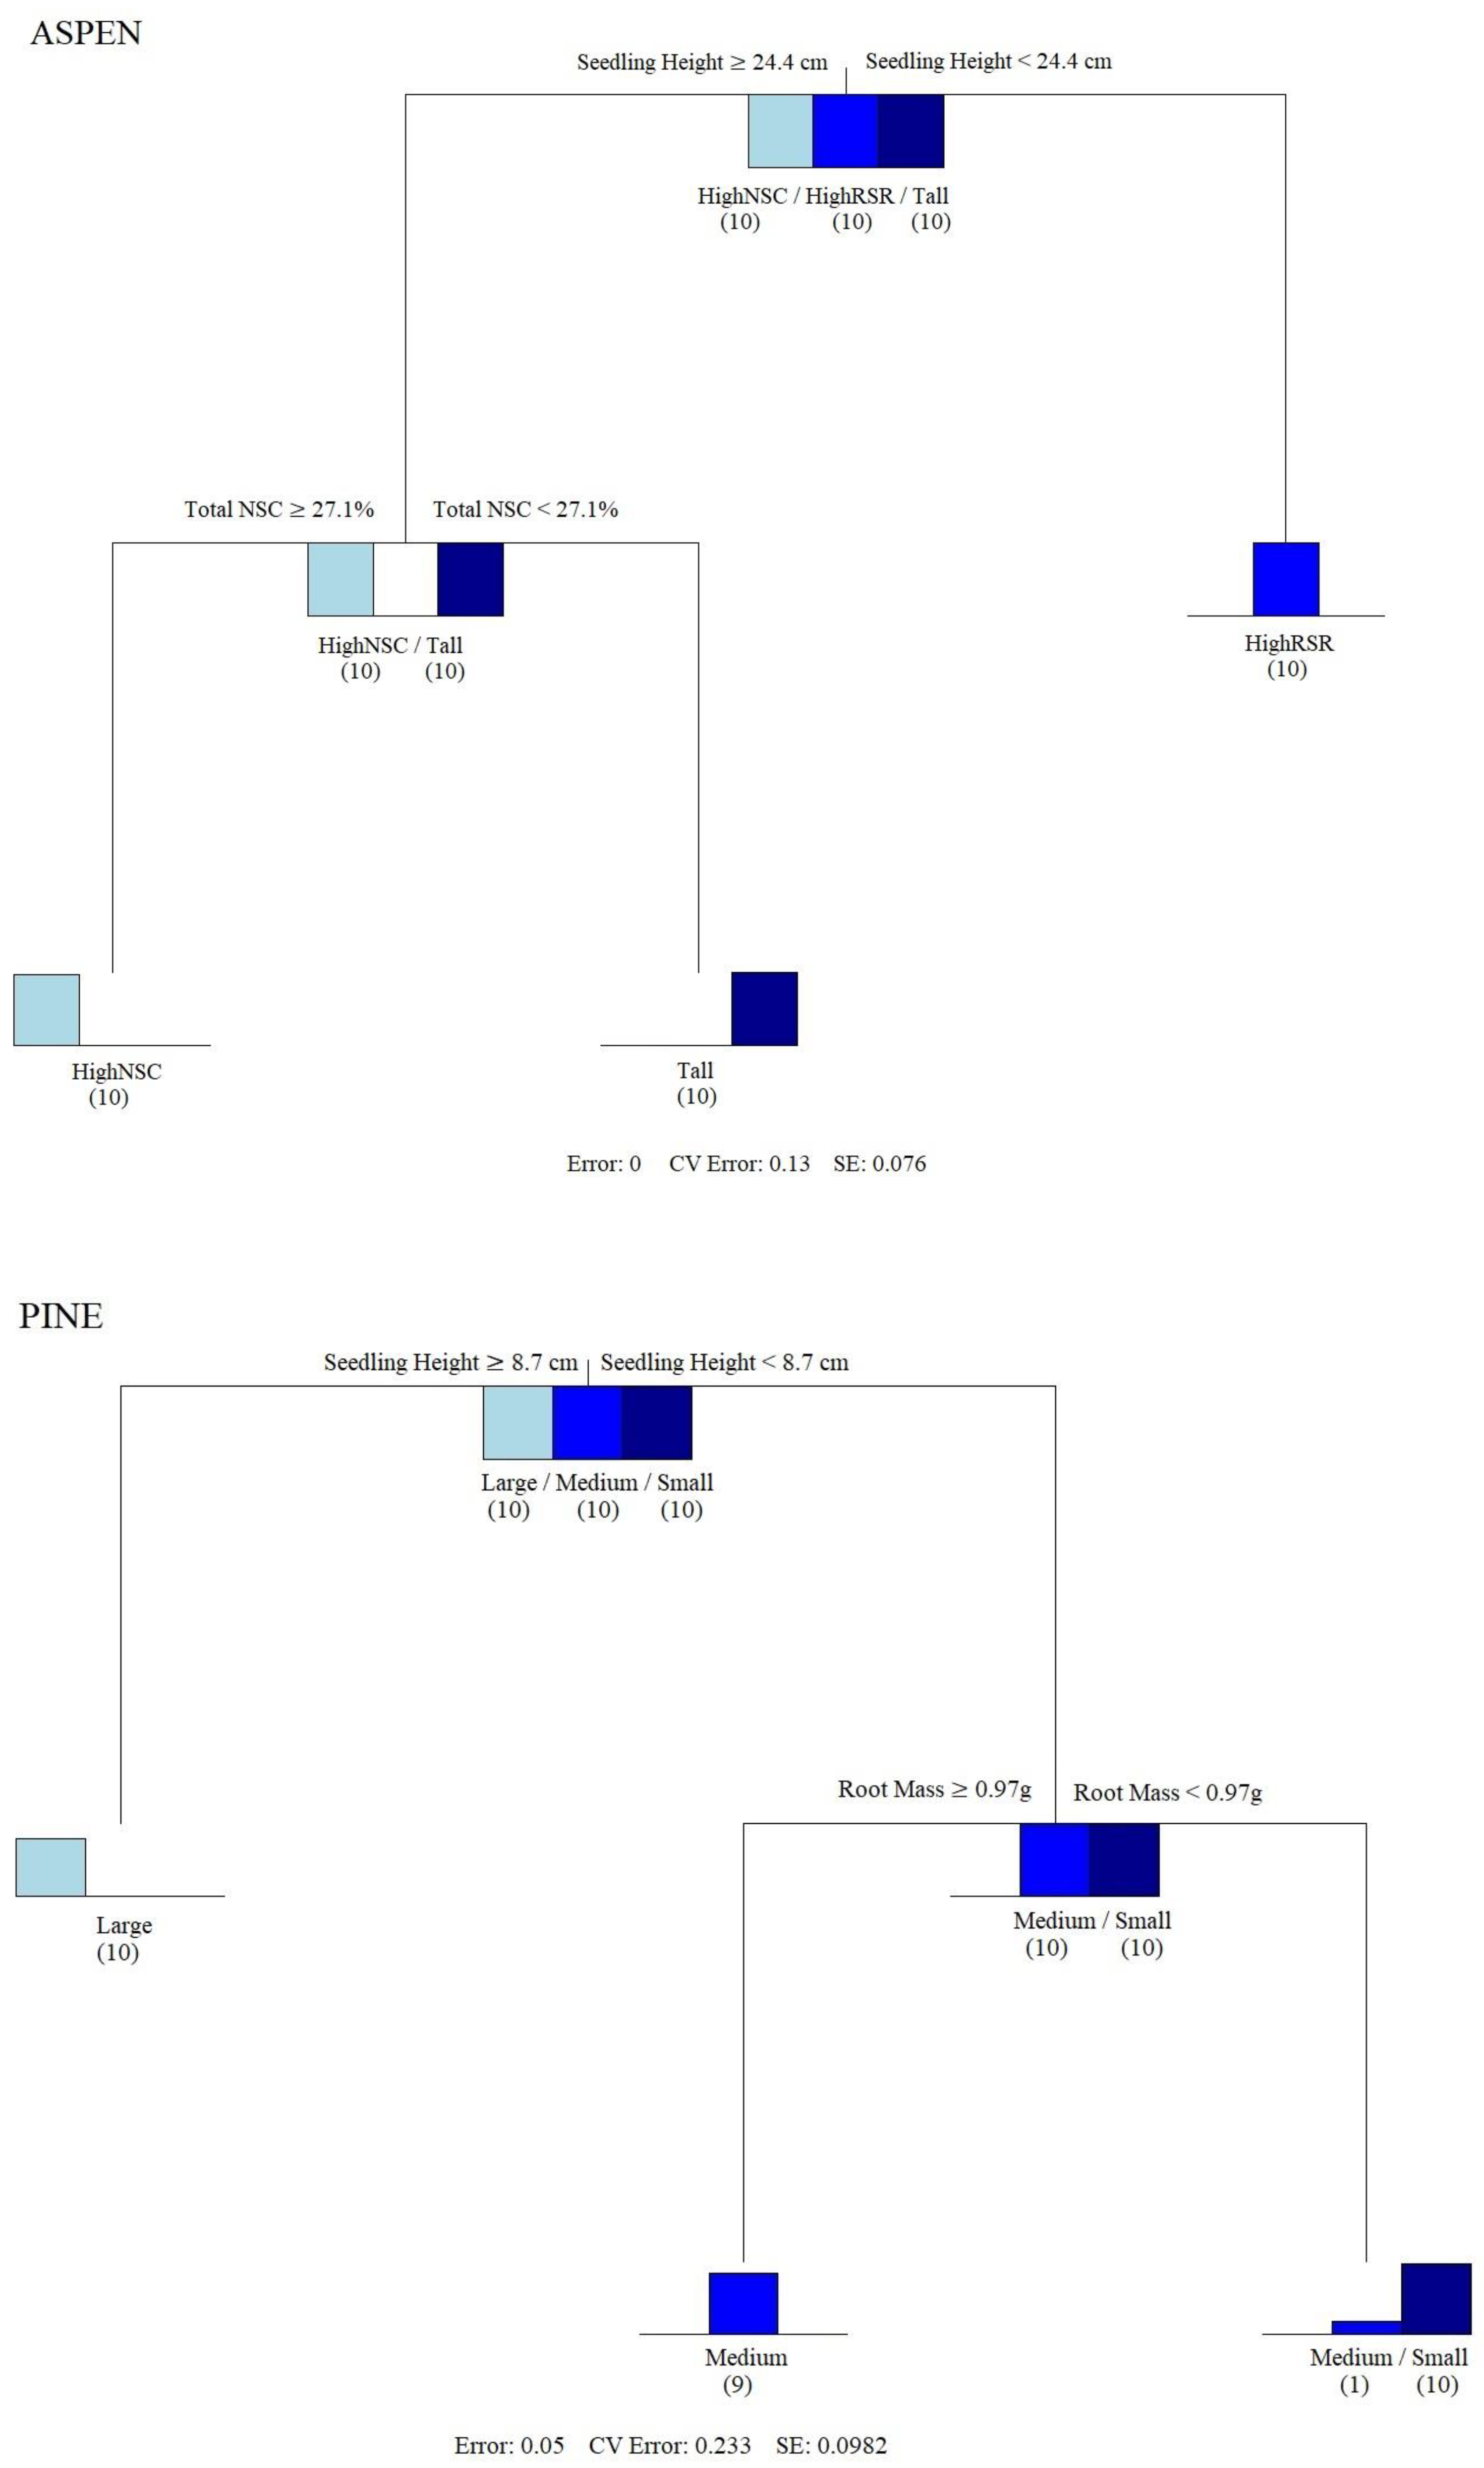
Within each species, seedling types varied significantly in most variables (See Appendix A Table A1). For aspen, MRT analysis explained 100% of the variation and clearly separated the seedlings by growing conditions. The first split was determined by seedling height, separating the shortest seedlings with the highest RSR (termed HighRSR seedling type) were split from the taller seedlings (Figure A2). The second and final split occurred within the taller seedlings (≥24.4 cm, n = 20) and was in response to the NSC concentration, where the seedlings with more than 27.1% total NSC (termed HighNSC seedling type) (n = 10) were split from those with less (termed Tall seedling type) (Figure A2).
For pine, the MRT analysis also separated seedlings by conditioning treatment relatively well. MRT analysis explained 95% of the total variance (Figure A2). The three seedling types in pine separated mostly by their size rather than NSC or RSR (Table A2). Seedling height provided the primary split, where the tallest seedlings (≥8.7 cm, n = 10), which also had the highest root and shoot biomass (termed Large seedling type), were split from shorter seedlings (<8.70 cm, n = 20) (Figure A2). The second split occurred in the shorter seedling group, where a stouter seedling type with higher RCD and root mass (≥0.97 g, n = 9) (termed Medium seedling type) was separated from a seedling type that had a smaller RCD and less root mass (<0.97 g, n = 11) (termed Small seedling type). Only one seedling was misclassified in this last split (Figure A2).

2.3. Experimental Growing Conditions

Twenty seedlings of each seedling type and species were planted in 2 L square pots (13.7 cm × 13.7 cm × 15.6 cm depth). To achieve similar medium bulk densities among pots and to more accurately assess the water status in each individual pot for all seedlings and drought treatments, each pot was filled with the same amount of medium (1000 g ± 11.9 SD), which was compacted to the same volume in each pot. The planting medium consisted of a 2:1:1 mixture by volume of peat moss (Pro-Moss, Premier Tech Horticulture, Delson, QC, Canada), vermiculite (Grace Specialty Vermiculite, Grace Construction Products, Vancouver, BC, Canada), and clay (MVP, Profile Products LLC, Buffalo Grove, IL, USA). To minimize nutrient limitations during the duration of the experiment, the water had been blended with 2g L−1 of 10-52-10 fertilizer containing chelated micronutrients (Plant Products Co., Ltd., Leamington, ON, Canada). The procedure is described in more detail in Galvez et al. [51].
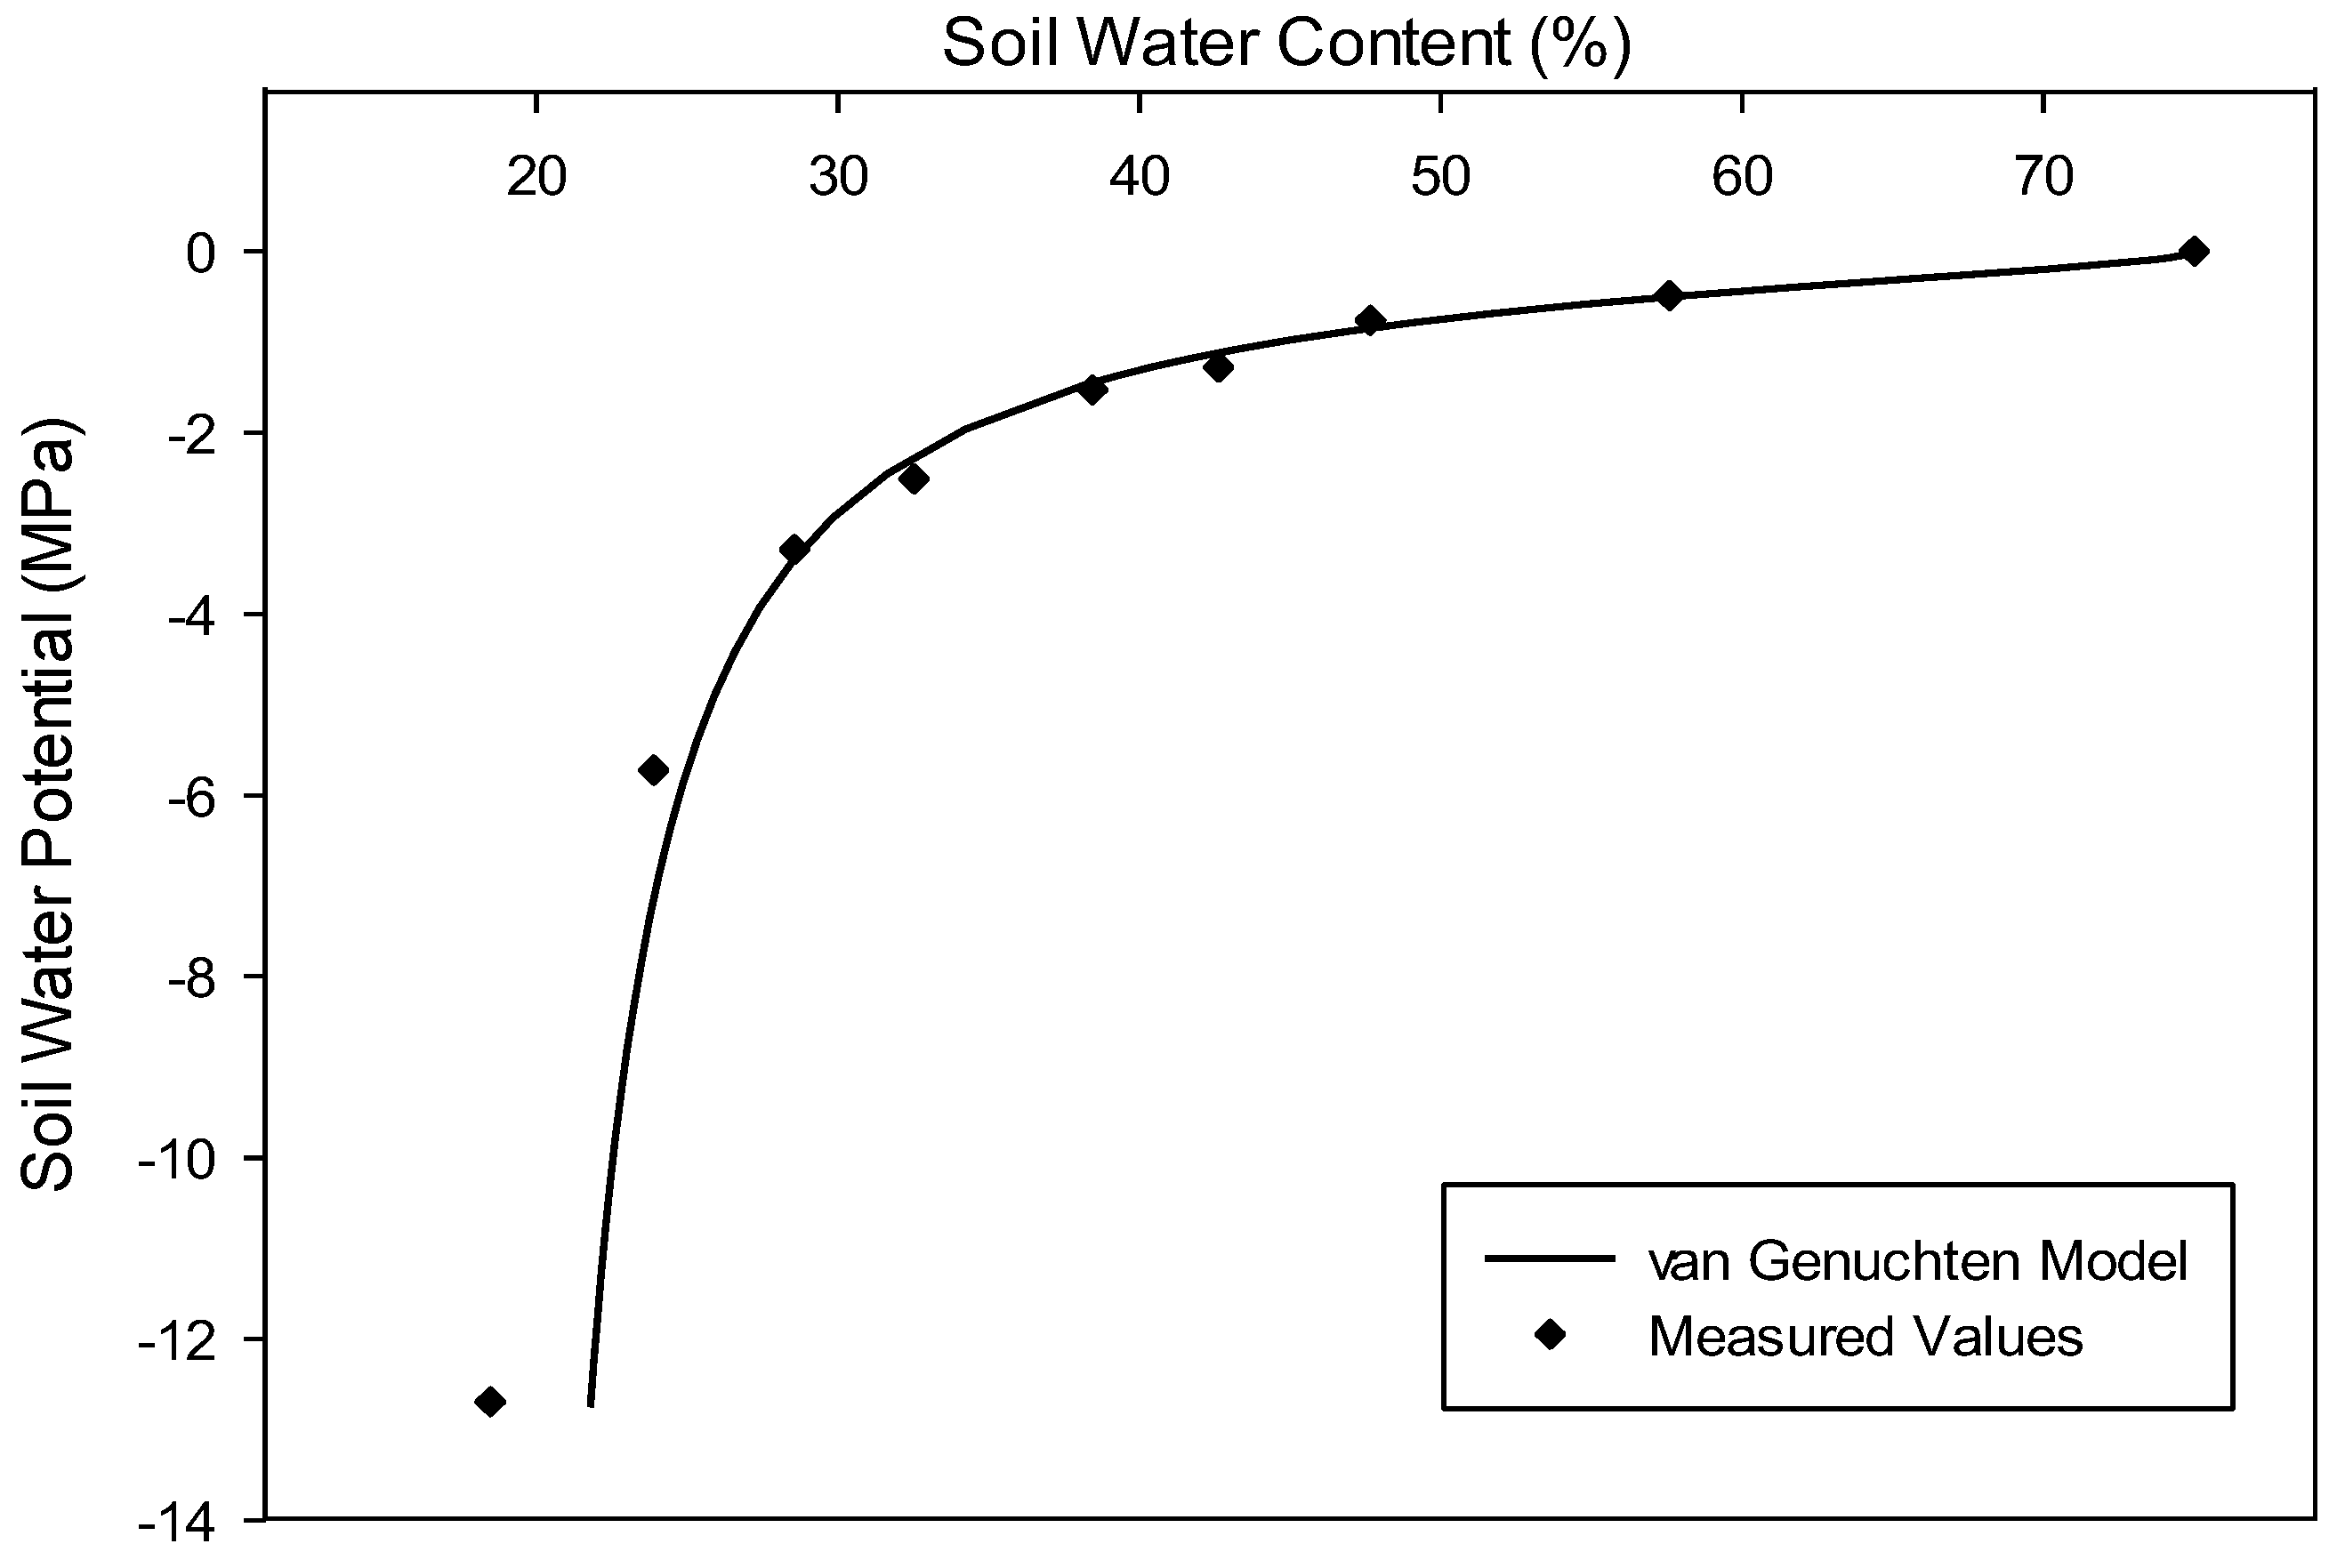
Soil moisture retention curves were developed for this planting medium prior to the experiment to assess soil moisture conditions more accurately during the study. First, bulk samples of the planting medium were oven dried for 48 h at 60 °C to remove most of the water without affecting the properties of the medium. Samples of the medium were then separated into individual bags, where a measured water quantity was added to obtain a predetermined gravimetric water content. The bags were then sealed and stored at 4 °C for 24 h to allow samples to equilibrate. Two subsamples were then taken from each bag and placed on temperature equilibrium plates (maintained at 19 °C; comparable to the temperature in the growth chamber conditions) to have their soil moisture recorded using a WP4C water potential meter (Decagon Devices, Pullman, WA, USA). A soil moisture retention curve was derived by plotting soil water potentials against the corresponding gravimetric water content, and the data were used to fit a retention curve (Figure A3, [63]). The model was then used to generate the corresponding gravimetric water content for the desired soil water potential targets for the respective drought conditions used in this study.
After filling the pots and planting the seedlings, pots were watered to field capacity (gravimetric soil water content of 70%). All seedlings were grown in a controlled growth chamber, where conditions were held constant for day/night time temperatures at 20.5 °C (±1.6 °C)/18 °C (±1.4 °C), an average relative humidity of 47.1% (±7.6%), and 18 h of fluorescent light (PAR 325 µmol m−2 s−1 at pot level). The experimental design was fully randomized with the individual pots being the experimental unit. Seedlings were widely spaced to avoid neighbor effects, and all seedlings were re-randomized every four weeks to minimize any potential spatial differences in the growth chamber.

2.4. Drought Treatment

Seedlings from each species and seedling type (n = 10) were assigned to one of two soil moisture treatments; a well-watered (control) and dry (drought). Target moisture conditions were chosen based on xylem vulnerability curves that had been developed for both aspen [64] and jack pine [65]. Target water potentials for the drought treatments was chosen for both species at 50% loss of stem hydraulic conductivity (P50). Since catastrophic embolisms (run-away cavitation) can occur past the P50, care was taken to ensure that seedlings did not exceed a shoot water potential of −2.4 MPa for aspen and −1.4 MPa for pine. Gravimetric soil water content was 41.6%, with a corresponding soil water potential of −1.37 MPa.
To replicate more natural soil drying conditions, a gradual dry-down of the pots was implemented by watering the pots with half of the amount of water lost during a 24 h period until target soil moisture conditions were reached [50]. Target mass for gravimetric soil water content was reached after about 20 days in both aspen and pine. Once the target weights were reached, a constant soil water content was maintained. To do so, pots were weighed daily to determine daily water loss and re-watered to the target weight. Control treatments were watered to field capacity twice weekly and weighed daily to verify target weights for the duration of the study.

2.5. Post-Drought Seedling Measurements

After 16 weeks (all seedlings had terminated shoot expansion), seedlings were destructively sampled, and the same variables were measured as described for the initial seedlings (Table A1 and Table A2) to determine the final total and structural biomass and the mass and concentration of NSC (Table A3 and Table A4). Prior to harvest, the average midday shoot water potentials were measured in all seedlings. Aspen control seedlings had an average shoot water potential of −0.71 MPa compared to drought with −1.43 MPa, while pine seedlings had a shoot water potential of −0.65 MPa and −1.4 MPa for control and drought seedlings, respectively. For the final measurement, aspen leaf mass was added, as it was not available at the initial harvest when aspen seedlings were dormant. Organ-level change in structural biomass (i.e., structural growth) was estimated for each seedling by subtracting the estimated initial structural biomass from the structural biomass measured at the final harvest. For aspen, initial structural biomass estimates were obtained in the following way. To estimate initial structural biomass, linear regressions models for each seedling type were fit first using the initial harvest seedlings, with structural biomass as the dependent variable and either height, RCD, or both as the independent variables. Second, the regression model with the highest R2 for each seedling type was then used to estimate the initial structural mass of the experimental aspen seedlings, using their initial height and/or RCD measurements. Stem structural mass for aspen was best predicted by a combination of root collar diameter and height, whereas root structural mass of HighNSC seedlings was best predicted by RCD alone. Root structural biomass of HighRSR and Tall seedlings was not significantly predicted by either variable, so the average root structural biomass of the initially harvested seedlings was used as the estimate for the experimental seedlings. For pine, only the average structural biomass from the initial harvest for each seedling type was used as an estimate of initial biomass for each experimental seedling. Whole seedling growth estimates were obtained by summing organ-level estimates. Changes in reserve storage were also estimated by subtracting the seedling-type specific average initial NSC concentration from each experimental seedling’s final NSC concentration. Negative values indicate a net remobilization.
Finally, we assessed the relative allocation of new growth (i.e., new structural biomass) between roots, stems or leaves/needles for the different seedling types in response to drought and well-watered conditions by dividing the organ-level growth by the whole plant growth (i.e., total increase in structural biomass) over the experimental period. Seedlings with negative values of organ-level growth or whole seedling growth were excluded from these analyses.

2.6. Data Analysis

Data were analyzed by separate ANOVAs for each species and followed a 3 × 2 full-factorial design with three seedling types and two drought treatment levels: control and drought. Data that did not meet the assumptions of homogeneity of variance were ln- or square-root transformed. In some cases, transformations did not fix heteroscedasticity, but removal of a single outlier did. To analyze allocation of new growth in pine, however, there was much higher variance in the drought relative to the control treatments. We therefore analyzed the effect of seedling-type separately for the control and drought treatments, and we tested the main effect of drought across seedling types using Welch’s t-test, which does not assume equal variance.
Finally, because biomass allocation can vary with changes in plant size, we tested for shifts in biomass allocation during the experiment relative to initial allocation patterns by comparing the allometric relationships between root and stem or root and shoot biomass [30]. Differences in biomass allocation between initial harvest seedlings, drought, and control seedlings at the final harvest would be manifested either as a difference in the slopes or in the intercepts of the allometric relationships. For each seedling type, we first ran an ANOVA with ln-transformed root biomass as the dependent variable, ln-transformed stem or shoot biomass as the covariate, a treatment effect (initial harvest, drought or control seedlings), and the interaction between covariate and treatment. When the interaction term was not significant (p > 0.10), we removed it from the model and used an ANCOVA to test for a treatment effect (i.e., differences in intercept). For one seedling type, the interaction between covariate and treatment was significant (i.e., differences in slopes), and so we tested for differences in slopes between treatments using 95% confidence intervals for the estimated slope parameters for each treatment. Data were analyzed using R (version 4.1.2), and post hoc comparisons were made using Tukey’s HSD test (α = 0.10).

3. Results

3.1. Aspen

Overall, the HighRSR seedling-type tended to grow more in total and aboveground structural biomass than the other seedling types, particularly under well-watered conditions (Figure 1). HighNSC seedlings had significantly less leaf and stem growth than both other seedling types under control conditions, but differences became smaller under drought when HighRSR seedlings grew more leaves and stem tissue that the other two seedling types (both seedling type × drought effects: p < 0.001). However, root growth did not differ between seedling types under well-watered or drought conditions (p > 0.40 for both seedling types; seedling type × drought effects). For all seedling types, growth at the seedling and organ levels was reduced by drought (all p < 0.001; Table 1, Figure 1).
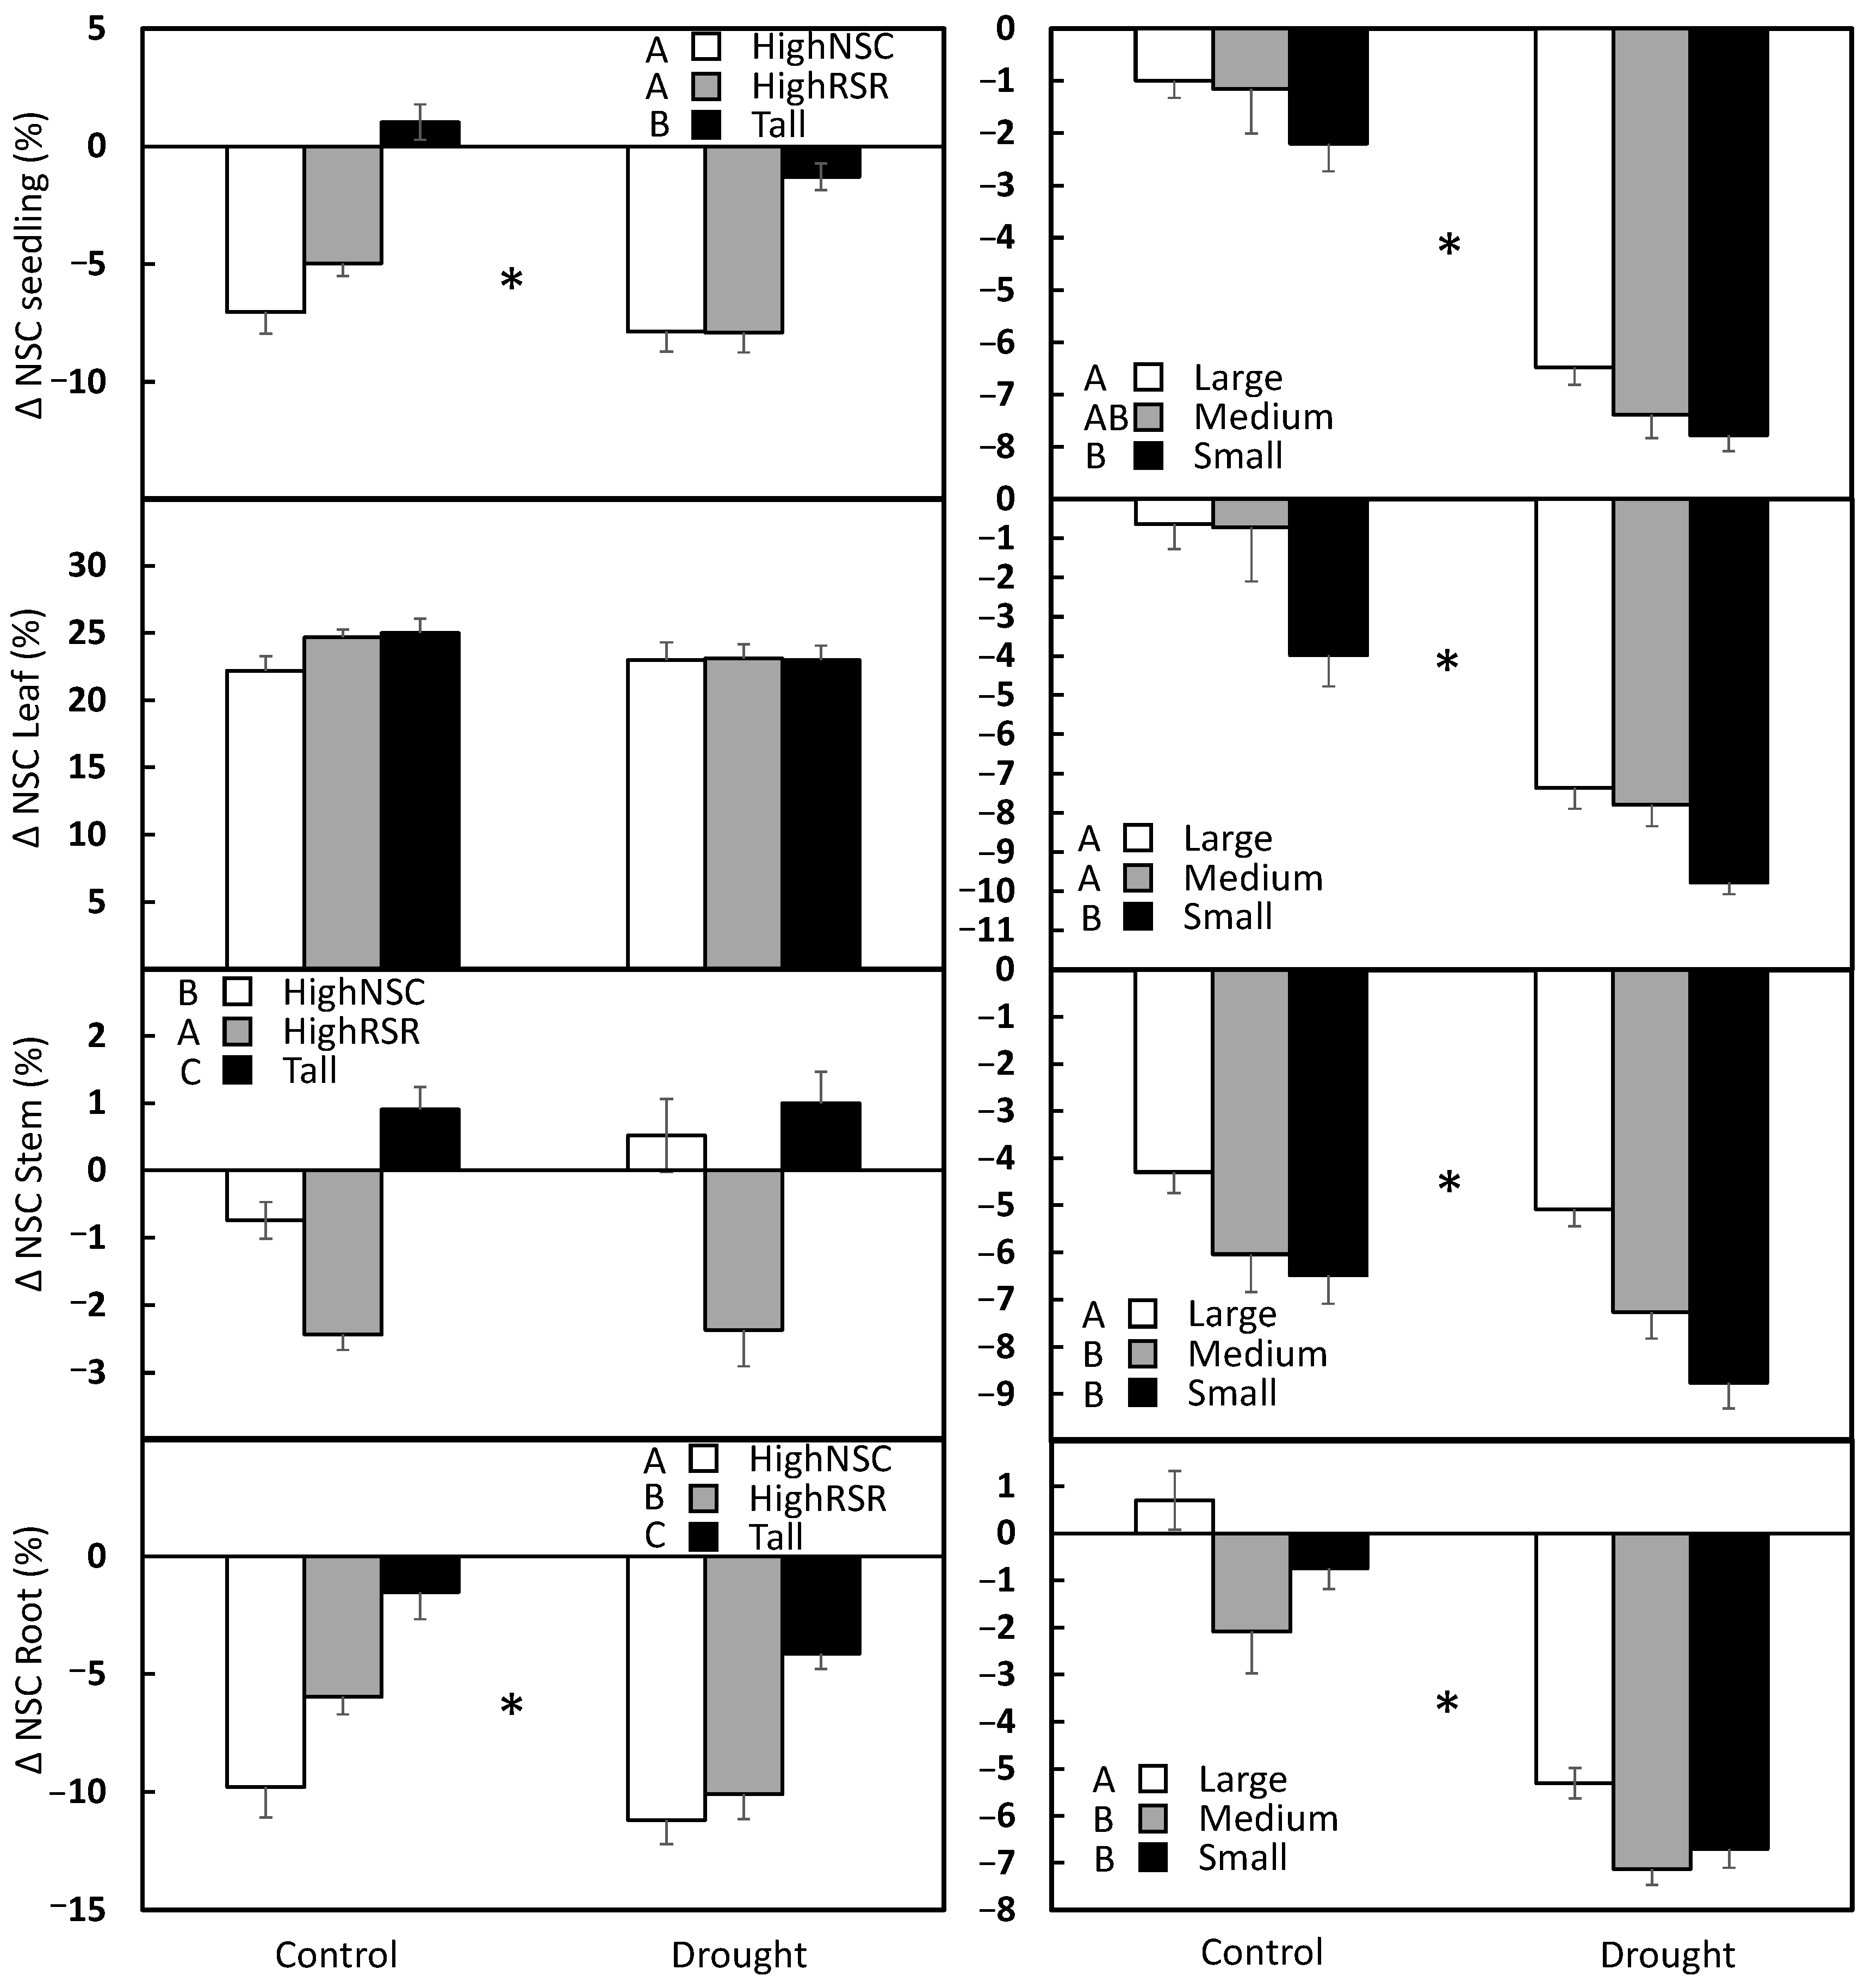
With a few exceptions, NSC concentrations declined in all aspen seedling types at the whole seedling and organ level over the experimental period (Table 1; Figure 2). The reduction in whole seedling NSC concentrations was significantly greater in seedlings experiencing drought and driven by a significant NSC reduction in the root system rather the stem (Table 1). HighNSC and HighRSR seedlings, which initially had the highest NSC concentrations (29.6 and 26.9%, respectively), had an approximately four times greater reduction in NSC concentrations than Tall seedlings, which had initially much lower NSC concentration (19.7%; Table A1). Leaf concentration did not indicate any treatment or seedling type effects. HighNSC and Tall seedlings had small positive or negative changes in stem NSC concentrations, while HighRSR seedling generally showed the largest reduction in stem NSC concentration (Figure 2).
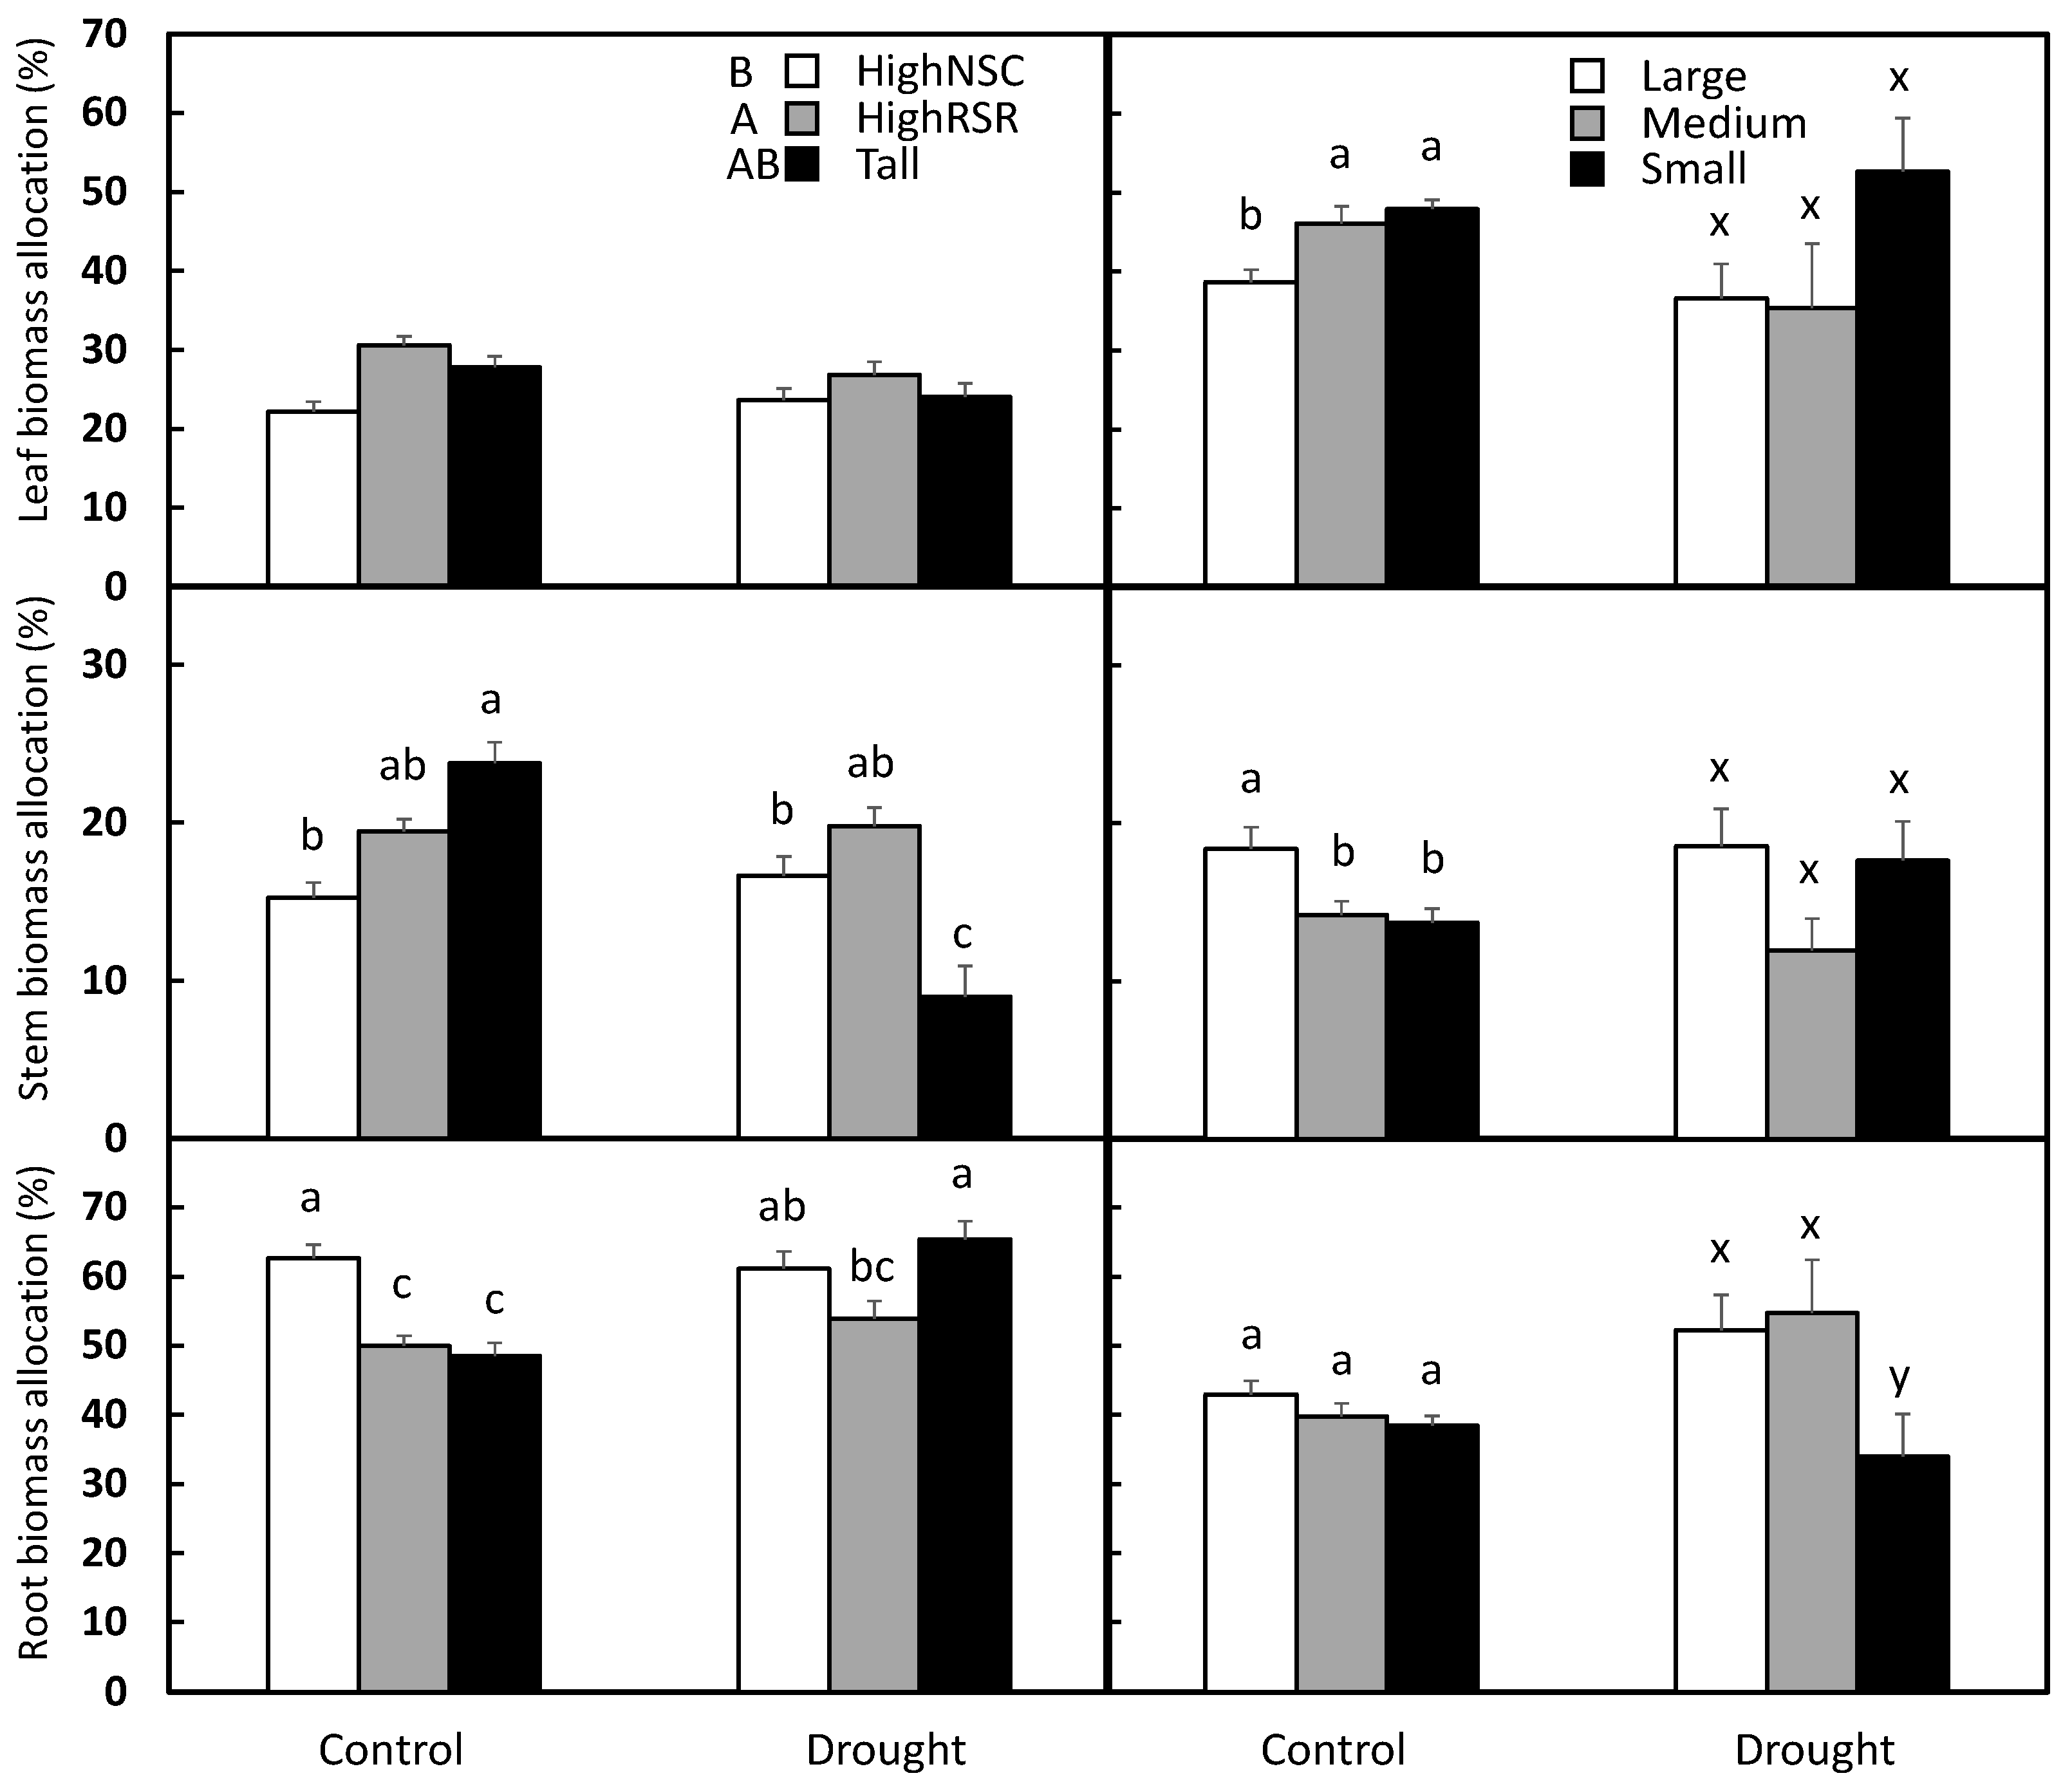
The three aspen seedling types allocated new structural biomass differently among organs (Figure 3, p < 0.05 for seedling type effect), and only the Tall seedlings showed the expected increase in relative allocation toward root growth in response to drought (Table 2; drought × seedling effects: p < 0.001). Under drought, Tall seedlings significantly decreased allocation of new structural biomass to stems and increased allocation to roots, but neither HighRSR nor HighNSC seedlings significantly altered their allocation to roots or stems when compared with seedlings in well-watered conditions (Figure 3). Allocation to leaf mass was not affected by drought; however, HighRSR seedlings allocated overall more new structural biomass to leaves than HighNSC seedlings (Figure 3). Under well-watered conditions, HighNSC seedlings allocated significantly more to roots and less to leaves compared to the other two seedling types, though under drought, both Tall seedlings allocated more to roots and less to stems compared to HighRSR seedlings.
Allometric analysis of root versus shoot final biomassTotal indicates that Tall and HighNSC seedlings’ final biomass allocation was significantly altered (adjusted) from the initial conditions, displaying an increase in root mass for a given stem biomass (Figure 4; treatment effect: p < 0.001). These shifts were generally greater under control conditions than under drought, perhaps in part due to the smaller amount of new biomass that seedlings added under drought, as the final biomass allocation reflects the combination of initial differences in biomass allocation and differences in how new biomass (including NSC) was partitioned. In contrast, HighRSR seedlings did not differ in final biomass allocation regardless of soil moisture conditions (treatment effect: p = 0.24).

3.2. Pine

For pine, Large seedlings had significantly greater structural growth than Medium and Small seedlings for both control and drought conditions (Figure 1, Table 1). These patterns were largely mirrored at the organ level, as well. Large seedlings had significantly greater root and needle growth than Small and Medium seedlings (with the exception of needle growth under drought in Small seedlings). Large seedlings also had greater stem growth under control conditions, but this difference was not significant under drought (Figure 1). As seen for aspen, drought significantly reduced biomass growth of all organs in all pine seedling types (Figure 1, drought effects: p < 0.001).
Overall, NSC concentrations declined at the whole seedling and organ level from the initial concentrations (Figure 2, Table 1). These NSC declines were significantly larger under drought for all seedling types in the roots and needles, but were not significant in the stem for any seedling type individually (Figure 2). Generally, Large seedlings, which had the lowest initial whole seedling NSC concentrations (Table A2), had smaller organ-level decreases in NSC concentrations compared to the Medium and Small seedlings. Medium and Small seedlings had similar declines, except that under control conditions Medium seedlings had a significantly greater decline in the roots while Small seedlings had a greater decline in the needles (Figure 2).
In contrast to aspen, there were fewer differences in the relative allocation of new structural biomass to different organs in pine (Figure 3, Table 3). Under control conditions, Large seedlings allocated relatively more new biomass to stems and less to needles compared to Medium and Small seedlings (Figure 3). The drought had limited impacts on the partitioning of new biomass with only a marginally significant increase in root biomass allocation across seedling types (Table 3, drought effect: p = 0.094). Under drought, the different seedling types did not strongly differ, except that Small seedlings allocated marginally less new biomass to roots than Large and Medium seedlings (Figure 3, Table 3).
Finally, the allometric relationships indicate that Large and Small pine seedling types varied in their final biomass allocation from their initial allocation (Figure 4). Large seedlings had an altered relationship between shoot and root biomass compared to the initial seedlings, regardless of soil moisture conditions, with a smaller increase in root biomass for a given increase in stem biomass (i.e., covariate × treatment effect: p = 0.060). Small seedling allometry also differed between initial and final treatments (treatment effect: p = 0.071), with droughted seedlings having slightly lower root biomass for a given shoot biomass (Figure 4). Medium seedlings, however, did not show any difference in allometry between drought and controls or between initial and final harvests (treatment effect: p = 0.93).

4. Discussion

In both species, the different conditioning treatments produced seedling types that differed in size and in morphological and physiological characteristics. Initial biomass allocation and NSC concentrations were particularly different for aspen, which subsequently influenced how new biomass was allocated between organs in the following growing season, and ultimately affected their amount of new growth. For aspen, the HighRSR seedlings—the smallest seedling type—were the most productive in terms of whole seedling growth across well-watered and drought conditions (Figure 1), demonstrating that larger seedlings are not always better. This greater growth likely stems from their initially higher root:stem biomass ratio. During the experiment, both HighNSC and Tall seedlings significantly altered their root-stem allometric trajectory from their initial trajectory, increasing root mass for a given stem mass (Figure 4). In contrast, HighRSR seedlings remained on the same allometric trajectory during the experimental period, even under drought conditions, suggesting that this pre-conditioning treatment produced aspen seedlings with a more optimal organ balance. With an already greater root allocation, HighRSR seedlings could partition relatively more to the new growth of leaves (Figure 3), which would increase C gain, supporting the current and future growth of other organs as well. Thus, while growing conditions can produce taller or larger seedlings, if these conditions also alter aspen allometry, it may require seedlings to make allocation adjustments later that will incur a cost and reduce overall growth potential and potentially establishment success.
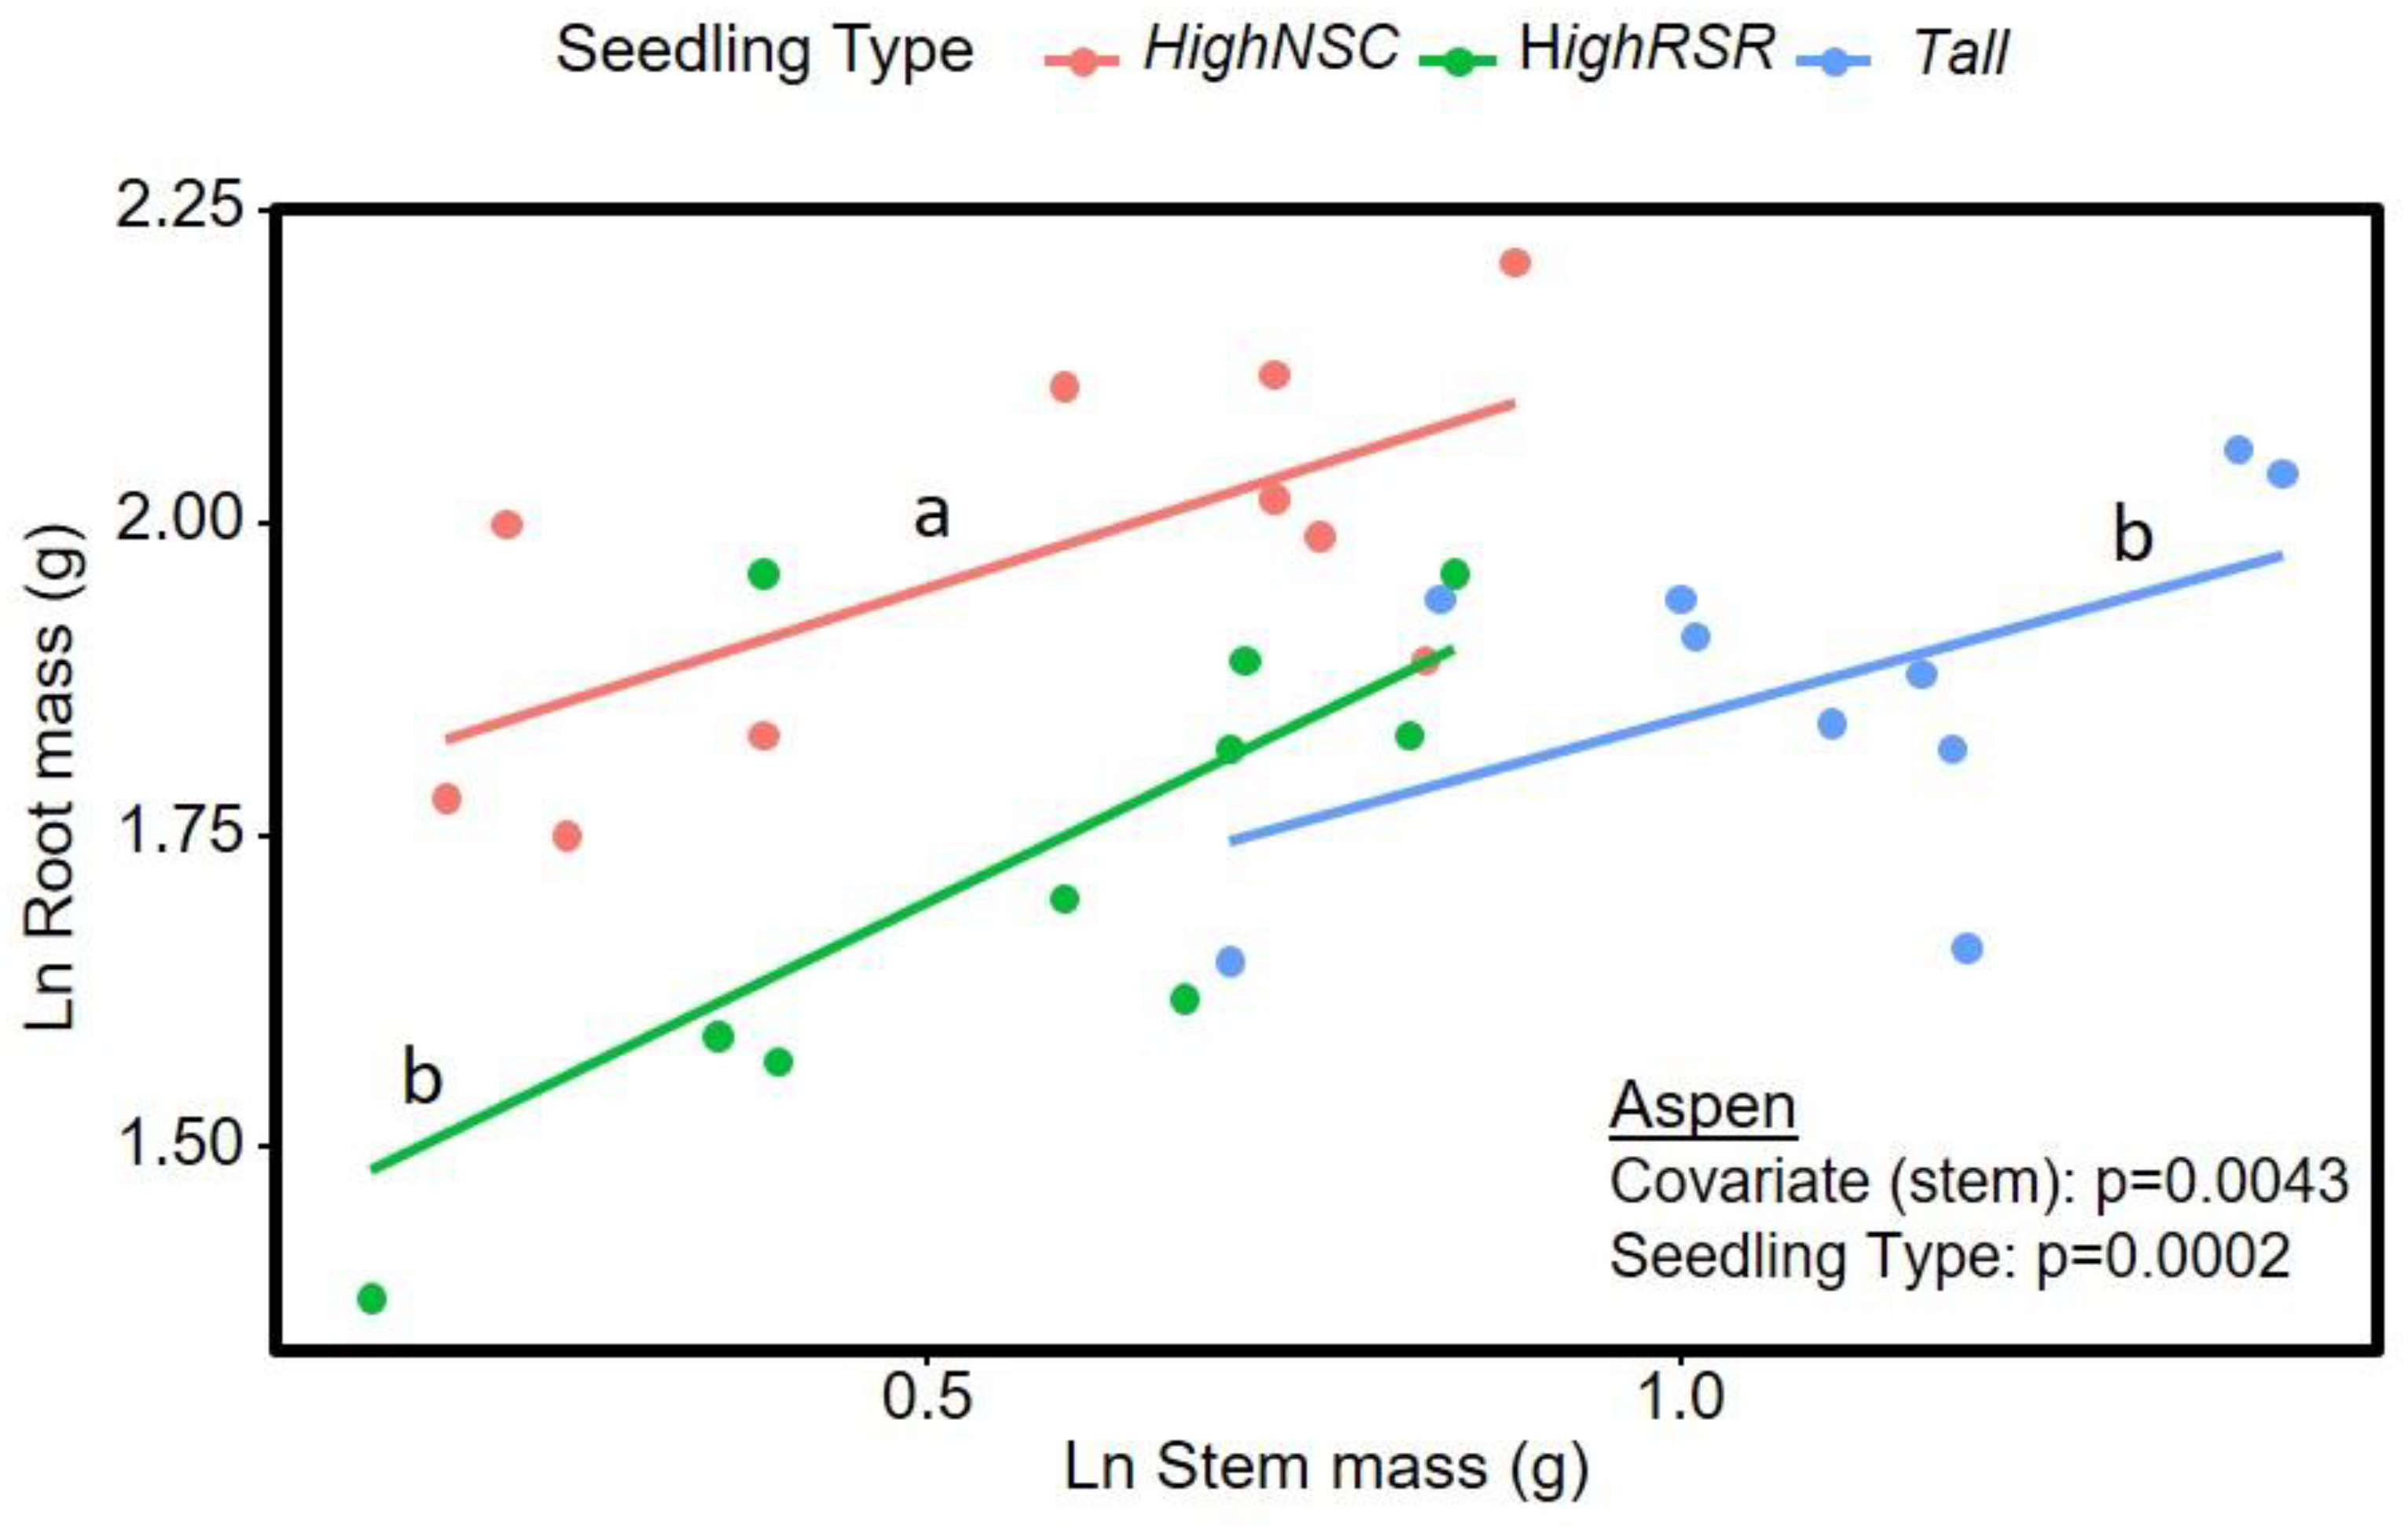
While both Tall and HighNSC aspen seedling types generally altered their allometry during the experiment by increasing root biomass allocation (Figure 4), the drivers underlying these adjustments likely differ. Tall seedings had the lowest initial NSC concentrations and exhibited relatively small NSC reductions, suggesting their root growth likely relied more on current photosynthates. In addition, in response to the higher water demand, the allocation to roots increased further with drought, potentially requiring greater demand from current photosynthates. In contrast, HighNSC seedlings—with the highest initial root NSC concentrations—had the greatest reduction in root reserve concentrations during the experimental period (Figure 2); it therefore seems likely that a large portion of this remobilized NSC was utilized to support new root growth. Thus, we suggest that the allometric shift favoring root biomass in this seedling type was driven by their greater resource supply for root growth. This is supported by the fact that HighNSC seedlings with a higher root:stem ratio still partitioned significantly more biomass to root growth than Tall seedlings under well-watered conditions, despite having less water demand because of lower leaf area. Root NSC storage may be largely constrained for use in the root system, explaining these seedlings’ lower aboveground growth despite the large remaining reserve pool belowground. The potential for root reserves to be largely restricted from remobilization to other organs has been suggested in other studies [66,67] (Hart et al. in prep.), supporting the idea that NSC pools in different organs are regulated independently [45] (Fermaniuk et al. in prep.). Alternatively, because HighNSC seedlings were conditioned by the application of a growth inhibitor, it is also possible that there were residual hormonal effects of this application which might have continued to restrict aboveground growth, leading to greater C supply belowground (and/or restricted use of root reserves aboveground). Such a constraint could also explain why HighNSC seedlings ended up with a higher root mass for a given stem mass than both other seedling types under well-watered conditions (Figure A4). A longer-lasting aboveground sink limitation effect could make this form of seedling conditioning problematic, particularly in sites with strong competition; however, residual effects of this treatment have not been observed in earlier outplanting studies [48,58,68].
Optimal partitioning theory predicts that under well-watered conditions, plants should preferentially allocate resources to aboveground organs responsible for carbon capture [69], but under drought, allocation should shift to favor root biomass to increase water extraction [70]. While increased root allocation in response to drought has been commonly reported in many plants [30,37,70], we found that only the response of Tall seedlings—which had the lowest initial root-to-stem ratio—was consistent with the optimal partitioning theory. In Tall seedlings, the increased allocation to root growth came at the expense of stem growth, consistent with the results of a meta-analysis for severe drought impacts on biomass allocation [30]. In contrast, HighRSR and HighNSC seedling types did not significantly alter their biomass partitioning in response to water stress (Figure 3). This lack of response is likely due to their ‘preconditioning’, which initially increased their root:stem ratios, perhaps allowing them to maintain higher water potentials and avoid or reduce the severity of the physiological impacts of soil drought. This would also be consistent with the findings of Poorter et al. [30], who found root biomass allocation to increase only under severe but not mild drought. Though we did not test the effect of drought on biomass allocation directly in pine, we did see similar trends: allocation of new growth to roots increased in all seedling types except the Small pine seedlings, which initially had the highest root: shoot ratios (Figure 3). Therefore, initial seedlings characteristics, particularly in plastic species, must be considered carefully when evaluating seedling responses to growing conditions in the field or experimental studies, as these initial seedling conditions can affect how individuals respond to stressors, or if they respond at all.
Unlike aspen, the largest pine seedling type generally had the greatest growth in the next growing season, although this advantage disappeared under drought conditions. The Large pine seedling type grew more than smaller seedling types under well-watered conditions, consistent with many studies that indicate taller or larger seedlings have higher outplanting survival and growth under non-adverse conditions [47,58,71,72,73]. The greater growth of Large seedlings may be the combined result of initially higher leaf area driving photosynthetic gain as well as initially higher NSC mass, suggesting that differences in pool size of available reserves rather than tissue NSC concentrations can be more important determinants of growth potential or survival [41,66,72,74,75]. However, when faced with drought, all pine seedling types showed a large decline in new growth, and the differences in growth among the three seedling types became much smaller. This is consistent with findings that the potential advantages of large size (e.g., taller seedlings) are significantly reduced or even reversed when water becomes limiting, particularly in pine species [71,76,77,78].
In further contrast to aspen, we found that alterations to organ biomass allometry in pine did not incur a cost for new growth, likely because the main organ where reserves are stored differs between species. As in aspen, we observed significant shifts in the allometry of some pine seedling types (Large and Small; Figure 4). However, unlike aspen, the Medium pine seedlings that did not exhibit an allometric shift, but instead tended to grow less, not more (Figure 1). Thus, shifting allometry was not associated with reduced growth in pine seedling types as in aspen. This difference between pine and aspen may derive from the difference in where the long-term reserves are stored in deciduous and evergreen species [23,24,67]. For both species, an initially larger size came at the expense of a higher root:stem or root:shoot ratio. In aspen, because the roots are a major location of stored reserves (i.e., higher concentrations; Table A1), the increase in initial size during conditioning came at the expense of their NSC storage. In contrast, needles of evergreen conifer seedlings tend to be the major NSC storage site, often containing more than half of the total NSC pool (e.g., [79,80]). Here, 50%–60% of NSC reserves in pine were located in needles, and both stem and needles maintained higher NSC concentrations than roots. Thus, producing a larger, taller pine seedling did not cause a reduction in storage. On the contrary, Large seedlings had about double the NSC mass of Small seedlings with higher root:shoot ratios (Table A2). Ultimately, this suggests that the cost of reducing root allocation is likely lower in pine than in aspen, though this cost likely increases under drought. Therefore, because species differ in terms of how storage pools are distributed among organs, the type of initial seedling characteristics (and biomass allocation) that affect subsequent growth and survival should be expected to vary between species and functional types [23,72].
Changes in seedling allometry that impact storage pools may be particularly important during stressful periods, when seedlings may have to increase their reliance on reserves. During drought, both aspen and pine seedlings had significantly lower NSC, with reduced concentrations in the roots of aspen and declines in all organs of pine. As photosynthesis likely declined under drought [50,81], these larger NSC declines may have resulted from an increased reliance of growth, respiration, and/or constitutive defenses on stored NSC [32,80,82,83,84]. Alternatively, the drought may have reduced the allocation of assimilates to refilling of reserves (primary growth had ceased) relative to well-watered conditions. Whatever the cause, the larger reductions in reserves may limit the ability of these seedlings to recover from a successive stress or impact their ability to survive the winter [51,85]. Therefore, seedling types such as HighNSC aspen that maintained higher NSC concentrations at the end of the experiment may still have an advantage in the longer-term, despite their lower aboveground growth in the short-term. In addition, the different location of storage between pine and aspen may also lead to differences in their ability to utilize reserves under drought. If phloem malfunction limits carbohydrate redistribution belowground [86,87,88], then the reliance of pine on needle NSC storage might make pine roots particularly sensitive to severe water limitation, whereas root function in aspen may be preserved longer because of their preferential storage belowground.
Finally, our study suggests that while both species can be manipulated to alter initial characteristics, aspen may exhibit greater phenotypic plasticity and thus a greater range of responses to pre-conditioning treatments than jack pine, as the allometric adjustments between seedling types—though not statistically compared between species—appeared much larger for aspen. Additionally, while initial differences in seedling characteristics had profound effects on size and biomass allocation (i.e., root-shoot balance) in both species, these changes were associated with much greater plasticity in physiological attributes (here NSC concentrations) in aspen than in pine. The larger seedling-type differences in aspen are consistent with other studies that suggest physiological attributes, including photosynthetic and leaf hydraulic traits of deciduous angiosperms, display more phenotypic plasticity than evergreen conifers [32,89,90,91]. Plasticity in physiological traits associated with changes in size and allometry should therefore be considered, as conditioning for larger seedling size may be associated with maladaptive physiological changes such as reduced storage in some species. Recognizing these types of taxonomic differences in response to initial growing conditions is essential when assessing seedling survival and growth after outplanting, and when using seedlings for ecophysiological studies and research.

5. Conclusions

We found that initial differences in seedling characteristics can substantially alter carbon allocation. The expected allocation shift with drought favoring roots was only observed when root:shoot or root:stem ratios were initially low. Additionally, we found that the traits associated with greater growth were quite different between pine and aspen. While larger seedlings had greater growth in pine, the smallest seedling type with the highest root:stem ratio grew most in aspen. In aspen, this smaller seedling type was the only one that did not undergo a shift in biomass relative to its initial allometry, suggesting that adjustments in biomass allocation made by other, larger seedling types may have come at the cost of reduced growth. In contrast, adjustments in allocation did not appear to negatively impact pine, possibly because reduced root:shoot ratios did not reduce NSC storage, as it did in aspen. We conclude that differences in biomass allocation and size can alter storage and seedling drought response; initial seedling characteristics should therefore be considered when predicting the effects of environmental stressors.

Author Contributions

Authors significantly contributed to the conception, design of the work and/or the acquisition, analysis, and interpretation of data. Conceptualization, S.M.L.; Methodology and data collection S.M.L., S.P.K., A.E.G.; Formal Analysis, E.T.W., K.A.S.; Investigation, K.A.S., A.E.G.; Resources, S.M.L.; Writing—Original Draft Preparation, E.T.W., S.M.L., K.A.S., S.P.K. and A.E.G.; Writing—Review and Editing, E.T.W. and S.M.L.; Visualization, E.T.W., S.M.L., K.A.S., S.P.K. and A.E.G.; Supervision, S.M.L.; Project Administration, S.M.L.; Funding Acquisition, S.M.L. All authors have read and agreed to the published version of the manuscript.

Funding

We thank the Natural Sciences and Engineering Research Council of Canada (NSERC), Syncrude Canada Ltd., Suncor Energy, Capital Power Corporation, and Shell Canada (IRCPJ 378901-13) for funding the research.

Data Availability Statement

The data presented in this study are available on request from the corresponding author.

Acknowledgments

We owe gratitude to Pak Chow for the non-structural carbohydrate analyses. Thank you also to Fran Leishman, Eckehart Marenholtz, and David Galvez for their enormous help with the set up and maintenance of the study.

Conflicts of Interest

The authors declare no conflict of interest.

Appendix A

Figure A1. Flow-chart showing a simplified summary and timeline for the whole study; more details on the different steps are provided in the Section 2. The top row depicts the different seedling preconditioning treatments for aspen (left) and pine (right) creating three different seedling types for each species. The naming of each of the seedling types is based on the dominant seedling characteristic separating the seedling types from each other (see also Figure A2). All seedlings were hardened, dormant and stored frozen prior to exposing them to drought and well-watered conditions over a second growing season. Seedling characteristics were measured for all seedling types before and after the second growing season.
Forests 14 00796 g0a1
Figure A2. Multiple Regression Tree (MRT) analysis based on the initial aspen seedling characteristics (top) to determine the contribution of variables determining each seedling type. This tree explained 100% of the total variance, and the vertical depth of each split is proportional to the variation explained. The numbers below each of the splits correspond to the number of seedlings by corresponding seedling type. MRT analysis (bottom) of initial pine seedling characteristics that determine the contributing factors in determining seedling type. This tree correctly explained 95% of the total variance, where the vertical depth of each split is proportional to the variation explained.
Forests 14 00796 g0a2
Figure A3. Soil moisture retention curve for the growing medium. Measured values were obtained using a WP4C dewpoint potentiometer, and the van Genuchten model was used for curve fitting. This allowed for the estimation of the required soil water content required to achieve the drought-like conditions.
Forests 14 00796 g0a3
Figure A4. Allometric relationships between final root and stem BiomassTotal for aspen seedling types under well-watered conditions (control). Lines represent individual linear regressions for each treatment and seedling type combination. Differences between seedling types were tested using ANCOVA, after testing for homogeneity of slopes. Different letters represent significant differences in intercepts between seedling types according to Tukey’s HSD (all p < 0.005).
Forests 14 00796 g0a4
Table A1. Summary of initial measurement means (±SE) for aspen by seedling type. Different letters indicate significant differences among seedling types using Tukey-HSD post hoc tests (p ≤ 0.10, n = 15).
MeasurementSeedling Type
HighNSCHighRSRTall
Height (cm) *32.35 (0.79) b15.90 (0.61) c51.78 (1.26) a
Root Collar Diameter (mm) *3.91 (0.08) b3.03 (0.07) c4.76 (0.11) a
Root Mass (g)3.04 (0.13) a1.64 (0.17) b2.72 (0.12) a
Stem Mass (g) *1.05 (0.08) b0.35 (0.03) c1.89 (0.14) a
Whole Seedling Mass (g)4.09 (0.16) a1.99 (0.19) b4.61 (0.19) a
Root Stem Ratio (g g−1) *3.04 (0.25) b4.83 (0.31) a1.51 (0.13) c
NSC concentration
(%)
Root Sugar24.17 (0.92) a21.92 (0.60) a18.24 (0.74) b
Root Starch9.79 (0.46) a7.49 (0.87) b5.78 (0.77) b
Root NSC 33.96 (0.99) a29.41 (1.36) b24.01 (1.34) c
Stem Sugar *16.52 (0.43) a15.27 (0.51) a12.72 (0.29) b
Stem Starch0.21 (0.03) a0.22 (0.03) a0.26 (0.02) a
Stem NSC *16.73 (0.43) a15.48 (0.49) a12.98 (0.29) b
Whole Seedling NSC29.55 (0.76) a26.94 (1.19) a19.67 (1.08) b
NSC mass
(g)
Root NSC1.03 (0.05) a0.48 (0.06) b0.66 (0.06) c
Stem NSC *0.18 (0.01) b0.05 (0.006) c0.24 (0.02) a
Whole Seedling 1.20 (0.05) a0.53 (0.06) c0.90 (0.05) b
Structural biomass
(g)
Root2.01 (0.10) a1.16 (0.11) b2.06 (0.08) a
Stem *0.87 (0.06) b0.29 (0.03) c1.65 (0.12) a
Whole Seedling2.88 (0.12) b1.45 (0.13) c3.71 (0.18) a
* Data were ln-transformed prior to analysis.
Table A2. Summary of initial measurement means (±SE) for pine by seedling type. Different letters indicate significant differences among seedling types using Tukey’s HSD post hoc tests (p ≤ 0.10, n = 15).
MeasurementSeedling Type
LargeMediumSmall
Height (cm) *14.35 (0.62) a 5.45 (0.28) b5.52 (0.34) b
Root Collar Diameter (mm)2.73 (0.07) a2.49 (0.13) b1.98 (0.06) c
Root Mass (g) *1.20 (0.10) a1.17 (0.06) a0.73 (0.05) b
Stem Mass (g) *0.48 (0.03) a0.26 (0.02) b0.13 (0.01) c
Needle Mass (g)1.56 (0.08) a0.86 (0.06) b0.51 (0.06) c
Whole Seedling Mass (g) *3.24 (0.19) a2.29 (0.13) b1.36 (0.10) c
Root:Shoot Ratio0.59 (0.04) c1.07 (0.03) b1.20 (0.08) a
NSC concentration
(%)
Root Sugar *4.21 (0.10) a4.57 (0.22) a4.43 (0.17) a
Root Starch6.12 (0.54) b7.57 (0.34) a7.56 (0.36) a
Root NSC10.33 (0.57) b12.14 (0.46) a12.00 (0.39) a
Stem Sugar13.87 (0.55) b15.77 (0.53) a16.47 (0.42) a
Stem Starch0.38 (0.07) b1.15 (0.10) a1.13 (0.11) a
Stem NSC14.26 (0.58) b16.92 (0.59) a17.60 (0.44) a
Needle Sugar16.65 (0.31) b16.74 (0.30) b18.23 (0.38) a
Needle Starch0.15 (0.01) a0.11 (0.01) b0.11 (0.01) a b
Needle NSC16.63 (0.41) b16.63 (0.29) b18.16 (0.52) a
Whole Seedling NSC14.03 (0.33) b14.47 (0.27) a14.85 (0.21) a
NSC mass
(g)
Root NSC0.123 (0.012) a0.141 (0.007) a0.088 (0.007) b
Stem NSC *0.070 (0.007) a0.043 (0.004) b0.023 (0.002) c
Needle NSC *0.263 (0.017) a0.146 (0.011) b0.092 (0.011) c
Whole Seedling NSC *0.457 (0.032) a0.330 (0.018) b0.203 (0.016) c
Structural biomass
(g)
Root *1.08 (0.09) a1.03 (0.06) a0.64 (0.04) b
Stem *0.41 (0.03) a0.22 (0.02) b0.11 (0.01) c
Needle 1.29 (0.06) a0.71 (0.05) b0.41 (0.05) c
Whole Seedling *2.78 (0.16) a1.96 (0.11) b1.16 (0.08) c
* Data were ln-transformed prior to analysis.
Table A3. Summary of final measurement means (±SE) for aspen seedlings by seedling type and drought interaction. BiomassTotal is the sum of structural and NSC mass. Different letters within a row indicate significant differences according to Tukey’s HSD (p ≤ 0.10).
OrganVariableControlDrought
HighNSCHighRSRTallHighNSCHighRSRTall
Whole
Seedling
BiomassTotal *10.6 (0.56) a10.3 (0.55) a11.9 (0.51) a6.3 (0.22) b4.61 (0.25) c6.81 (0.34) b
BiomassStructural *8.2 (0.38) ab8.0 (0.31) b9.4 (0.29) a4.9 (0.16) c3.72 (0.18) d5.56 (0.25) c
NSCMass *2.4 (0.15) a2.3 (0.14) a2.5 (0.18) a1.4 (0.07) b0.89 (0.07) c1.26 (0.08) b
NSCConcentration22.5 (0.9) a22.0 (0.5) ab20.7 (0.8) abc21.7 (0.9) ab19.0 (0.8) bc18.4 (0.6) c
LeavesBiomassTotal *1.57 (0.13) b2.7 (0.15) a2.28 (0.13) a0.66 (0.05) d0.91 (0.05) c0.57 (0.04) d
BiomassStructural *1.21 (0.09) b2.1 (0.12) a1.70 (0.09) a0.51 (0.03) d0.70 (0.03) c0.44 (0.02) d
NSCMass *0.4 (0.05) b0.68 (0.04) a0.58 (0.05) a0.15 (0.02) cd0.21 (0.02) c0.13 (0.02) d
NSCConcentration22.2 (1.1) a24.7 (0.6) a25.0 (1.1) a23.1 (1.5) a23.1 (1.1) a23.0 (1.1) a
StemBiomassTotal *1.80 (0.15) b1.80 (0.13) b3.06 (0.20) a1.26 (0.09) c0.83 (0.04) d2.06 (0.10) b
BiomassStructural *1.51 (.12) b1.56 (0.11) b2.63 (0.17) a1.04 (0.07) c0.72 (0.03) d1.77 (0.09) b
NSCMass * 0.3 (0.02) b0.23 (0.02) b0.42 (0.03) a0.22 (0.02) b0.11 (0.01) c0.29 (0.02) b
NSCConcentration15.9 (0.3) a13.1 (0.2) b13.9 (0.3) b17.3 (0.5) a13.1 (0.5) b14.0 (0.5) b
RootBiomassTotal *7.3 (0.35) a5.75 (0.34) b6.57 (0.28) ab4.35 (0.15) c2.87 (0.22) d4.19 (0.25) c
BiomassStructural *5.5 (0.32) a4.39 (0.25) a5.09 (0.22) a3.36 (0.13) b2.30 (0.16) c3.35 (0.20) b
NSCMass *1.7 (0.10) a1.36 (0.10) ab1.48 (0.11) a0.99 (0.05) bc0.57 (0.06) d0.84 (0.06) c
NSCConcentration24.3 (1.3) a23.4 (0.7) ab22.5 (1.2) ab22.8 (1.0) ab19.3 (1.1) b19.9 (0.6) b
* Data were ln-transformed prior to analysis.
Table A4. Summary of final measurement means (±SE) seedling for pine seedlings by seedling type and drought interaction. BiomassTotal is the sum of structural and NSC mass. Different letters within a row indicate significant differences according to Tukey’s HSD (p < 0.10).
OrganSource of VariationControlDrought
LargeMediumSmallLargeMediumSmall
Whole
Seedling
BiomassTotal *11.2 (0.56) a6.59 (0.40) b4.92 (0.44) bc4.40 (0.22) c2.55 (0.25) d1.75 (0.18) e
BiomassStructural *9.78 (0.49) a5.76 (0.35) b4.30 (0.39) b4.07 (0.20) b2.37 (0.23) c1.63 (0.17) d
MassNSC *†1.46 (0.08) a0.87 (0.10) b0.62 (0.06) b0.33 (0.02) c0.18 (0.02) d0.12 (0.01) e
NSCConcentration13.0 (0.3) a13.3 (0.9) a12.6 (0.5) a7.6 (0.3) b7.1 (0.5) b7.1 (0.3) b
NeedlesBiomassTotal *4.75 (0.25) a2.91 (0.20) b2.22 (0.25) bc1.91 (0.11) c0.93 (0.11) d0.72 (0.10) d
BiomassStructural *3.97 (0.19) a2.44 (0.17) b1.90 (0.21) b1.73 (0.10) b0.84 (0.10) c0.66 (0.09) c
NSCMass *0.78 (0.07) a0.47 (0.06) b0.32 (0.05) b0.18 (0.02) c0.09 (0.01) d0.06 (0.01) d
NSCConcentration *16.2 (0.6) a16.1 (1.4) a14.4 (0.8) a9.4 (0.5) b9.1 (0.6) b8.6 (0.3) b
StemBiomassTotal *1.94 (0.19) a0.85 (0.07) b0.61 (0.07) c0.68 (0.06) b0.31 (0.04) c0.23 (0.03) c
BiomassStructural *1.75 (0.18) a0.76 (0.06) b0.55 (0.06) b0.61 (0.06) b0.28 (0.03) c0.21 (0.03) c
NSCMass *0.19 (0.01) a0.09 (0.01) b0.07 (0.01) b0.06 (0.01) b0.03 (0.01) c0.02 (0.01) d
NSCConcentration10.0 (0.4) a10.9 (0.8) a11.1 (0.6) a9.2 (0.4) a9.7 (0.6) a8.8 (0.6) a
RootsBiomassTotal *4.55 (0.23) a2.82 (0.20) b2.09 (0.15) bc1.81 (0.08) c1.31 (0.13) d0.81 (0.08) e
BiomassStructural *4.06 (0.22) a2.56 (0.18) b1.85 (0.13) bc1.72 (0.08) d1.24 (0.13) d0.76 (0.08) e
NSCMass †*0.50 (0.03) a0.28 (0.03) b0.23 (0.02) b0.09 (0.01) c0.06 (0.01) cd0.04 (0.004) d
NSCConcentration11.0 (0.6) a10.1 (0.9) a11.3 (0.4) a5.0 (0.3) b5.0 (0.3) b5.3 (0.4) b
* Data were ln-transformed prior to analysis. † One Medium seedling from control treatment excluded for analysis.

References

  1. Adams, H.D.; Guardiola-Claramonte, M.; Barron-Gafford, G.A.; Villegas, J.C.; Breshears, D.D.; Zou, C.B.; Troch, P.A.; Huxman, T.E. Temperature Sensitivity of Drought-Induced Tree Mortality Portends Increased Regional Die-off under Global-Change-Type Drought. Proc. Natl. Acad. Sci. USA 2009, 106, 7063–7066. [Google Scholar] [CrossRef] [PubMed] [Green Version]
  2. Allen, C.D.; Macalady, A.K.; Chenchouni, H.; Bachelet, D.; McDowell, N.; Vennetier, M.; Kitzberger, T.; Rigling, A.; Breshears, D.D.; Hogg, E.H.; et al. A Global Overview of Drought and Heat-Induced Tree Mortality Reveals Emerging Climate Change Risks for Forests. For. Ecol. Manag. 2010, 259, 660–684. [Google Scholar] [CrossRef] [Green Version]
  3. Anderegg, W.R.L.; Trugman, A.T.; Badgley, G.; Anderson, C.M.; Bartuska, A.; Ciais, P.; Cullenward, D.; Field, C.B.; Freeman, J.; Goetz, S.J.; et al. Climate-Driven Risks to the Climate Mitigation Potential of Forests. Science 2020, 368, eaaz7005. [Google Scholar] [CrossRef]
  4. Beier, C.; Beierkuhnlein, C.; Wohlgemuth, T.; Penuelas, J.; Emmett, B.; Körner, C.; de Boeck, H.; Christensen, J.H.; Leuzinger, S.; Janssens, I.A.; et al. Precipitation Manipulation Experiments—Challenges and Recommendations for the Future. Ecol. Lett. 2012, 15, 899–911. [Google Scholar] [CrossRef] [PubMed]
  5. Clark, J.S.; Iverson, L.; Woodall, C.W.; Allen, C.D.; Bell, D.M.; Bragg, D.C.; D’Amato, A.W.; Davis, F.W.; Hersh, M.H.; Ibanez, I.; et al. The Impacts of Increasing Drought on Forest Dynamics, Structure, and Biodiversity in the United States. Glob. Chang. Biol. 2016, 22, 2329–2352. [Google Scholar] [CrossRef] [Green Version]
  6. Cobb, R.C.; Ruthrof, K.X.; Breshears, D.D.; Lloret, F.; Aakala, T.; Adams, H.D.; Anderegg, W.R.L.; Ewers, B.E.; Galiano, L.; Grünzweig, J.M.; et al. Ecosystem Dynamics and Management after Forest Die-off: A Global Synthesis with Conceptual State-and-Transition Models. Ecosphere 2017, 8, e02034. [Google Scholar] [CrossRef]
  7. Royer, P.D.; Cobb, N.S.; Clifford, M.J.; Huang, C.-Y.; Breshears, D.D.; Adams, H.D.; Villegas, J.C. Extreme Climatic Event-Triggered Overstorey Vegetation Loss Increases Understorey Solar Input Regionally: Primary and Secondary Ecological Implications. J. Ecol. 2011, 99, 714–723. [Google Scholar] [CrossRef]
  8. Hodgson, D.; McDonald, J.L.; Hosken, D.J. What Do You Mean, ‘Resilient’? Trends Ecol. Evol. 2015, 30, 503–506. [Google Scholar] [CrossRef]
  9. Grubb, P.J. Control of Forest Growth and Distribution on Wet Tropical Mountains: With Special Reference to Mineral Nutrition. Annu. Rev. Ecol. Syst. 1977, 8, 83–107. [Google Scholar] [CrossRef]
  10. Macdonald, S.E.; Landhäusser, S.M.; Skousen, J.; Franklin, J.; Frouz, J.; Hall, S.; Jacobs, D.F.; Quideau, S. Forest Restoration Following Surface Mining Disturbance: Challenges and Solutions. New For. 2015, 46, 703–732. [Google Scholar] [CrossRef] [Green Version]
  11. Hanson, P.J.; Todd, D.E.; Amthor, J.S. A Six-Year Study of Sapling and Large-Tree Growth and Mortality Responses to Natural and Induced Variability in Precipitation and Throughfall. Tree Physiol. 2001, 21, 345–358. [Google Scholar] [CrossRef] [PubMed] [Green Version]
  12. Lloret, F.; Peñuelas, J.; Ogaya, R. Establishment of Co-Existing Mediterranean Tree Species under a Varying Soil Moisture Regime. J. Veg. Sci. 2004, 15, 237–244. [Google Scholar] [CrossRef]
  13. Poorter, L.; Hayashida-Oliver, Y. Effects of Seasonal Drought on Gap and Understory Seedlings in a Bolivian Moist Forest. J. Trop. Ecol. 2000, 16, 481–498. [Google Scholar] [CrossRef] [Green Version]
  14. Solarik, K.A.; Messier, C.; Ouimet, R.; Bergeron, Y.; Gravel, D. Local Adaptation of Trees at the Range Margins Impacts Range Shifts in the Face of Climate Change. Glob. Ecol. Biogeogr. 2018, 27, 1507–1519. [Google Scholar] [CrossRef]
  15. Kozlowski, T.T.; Pallardy, S.G. Acclimation and Adaptive Responses of Woody Plants to Environmental Stresses. Bot. Rev. 2002, 68, 270–334. [Google Scholar] [CrossRef]
  16. Niinemets, Ü. Responses of Forest Trees to Single and Multiple Environmental Stresses from Seedlings to Mature Plants: Past Stress History, Stress Interactions, Tolerance and Acclimation. For. Ecol. Manag. 2010, 260, 1623–1639. [Google Scholar] [CrossRef]
  17. Grossnickle, S.C.; MacDonald, J.E. Why Seedlings Grow: Influence of Plant Attributes. New For. 2018, 49, 1–34. [Google Scholar] [CrossRef]
  18. Moler, E.R.V.; Nelson, A.S. Perspectives on Drought Preconditioning Treatments With a Case Study Using Western Larch. Front. Plant Sci. 2021, 12, 741027. [Google Scholar] [CrossRef] [PubMed]
  19. Sloan, J.L.; Burney, O.T.; Pinto, J.R. Drought-Conditioning of Quaking Aspen (Populus Tremuloides Michx.) Seedlings During Nursery Production Modifies Seedling Anatomy and Physiology. Front. Plant Sci. 2020, 11, 557894. [Google Scholar] [CrossRef] [PubMed]
  20. Villar-Salvador, P.; Ocaña, L.; Peñuelas, J.; Carrasco, I. Effect of Water Stress Conditioning on the Water Relations, Root Growth Capacity, and the Nitrogen and Non-Structural Carbohydrate Concentration of Pinus Halepensis Mill. (Aleppo Pine) Seedlings. Ann. For. Sci. 1999, 56, 459–465. [Google Scholar] [CrossRef] [Green Version]
  21. Dietze, M.C.; Sala, A.; Carbone, M.S.; Czimczik, C.I.; Mantooth, J.A.; Richardson, A.D.; Vargas, R. Nonstructural Carbon in Woody Plants. Annu. Rev. Plant Biol. 2014, 65, 667–687. [Google Scholar] [CrossRef] [PubMed] [Green Version]
  22. Hoch, G. Carbon Reserves as Indicators for Carbon Limitation in Trees. In Progress in Botany: Vol. 76; Lüttge, U., Beyschlag, W., Eds.; Progress in Botany; Springer International Publishing: Cham, Switzerland, 2015; pp. 321–346. ISBN 978-3-319-08807-5. [Google Scholar]
  23. Piper, F.I.; Fajardo, A. Foliar Habit, Tolerance to Defoliation and Their Link to Carbon and Nitrogen Storage. J. Ecol. 2014, 102, 1101–1111. [Google Scholar] [CrossRef]
  24. Tomlinson, K.W.; van Langevelde, F.; Ward, D.; Bongers, F.; da Silva, D.A.; Prins, H.H.T.; de Bie, S.; Sterck, F.J. Deciduous and Evergreen Trees Differ in Juvenile Biomass Allometries Because of Differences in Allocation to Root Storage. Ann. Bot. 2013, 112, 575–587. [Google Scholar] [CrossRef] [PubMed] [Green Version]
  25. O’Brien, M.J.; Burslem, D.F.R.P.; Caduff, A.; Tay, J.; Hector, A. Contrasting Nonstructural Carbohydrate Dynamics of Tropical Tree Seedlings under Water Deficit and Variability. New Phytol. 2015, 205, 1083–1094. [Google Scholar] [CrossRef] [Green Version]
  26. O’Brien, M.J.; Leuzinger, S.; Philipson, C.D.; Tay, J.; Hector, A. Drought Survival of Tropical Tree Seedlings Enhanced by Non-Structural Carbohydrate Levels. Nat. Clim. Chang. 2014, 4, 710–714. [Google Scholar] [CrossRef]
  27. Dumroese, K.; Landis, T.D.; Pinto, J.; Haase, D.L.; Wilkinson, K.W.; Davis, A.S. Meeting Forest Restoration Challenges: Using the Target Plant Concept. Reforesta 2016, 1, 37–52. [Google Scholar] [CrossRef] [Green Version]
  28. Landis, T.D. The Target Plant Concept-a History and Brief Overview. In National Proceedings: Forest and Conservation Nursery Associations—2010; Proc. RMRS-P-65; Riley, L.E., Haase, D.L., Pinto, J.R., Eds.; USDA Forest Service, Rocky Mountain Research Station: Fort Collins, CO, USA, 2011; Volume 65, pp. 61–66. [Google Scholar]
  29. Rose, R.; Campbell, S.J.; Landis, T.D. Target Seedling Symposium: Proceedings, Combined Meeting of the Western Forest Nursery Associations; Gen. Tech. Rep. RM-GTR-200; U.S. Department of Agriculture, Forest Service, Rocky Mountain Forest and Range Experiment Station: Fort Collins, CO, USA, 1990; Volume 200. [CrossRef] [Green Version]
  30. Poorter, H.; Niklas, K.J.; Reich, P.B.; Oleksyn, J.; Poot, P.; Mommer, L. Biomass Allocation to Leaves, Stems and Roots: Meta-Analyses of Interspecific Variation and Environmental Control. New Phytol. 2012, 193, 30–50. [Google Scholar] [CrossRef]
  31. Bloom, A.J.; Chapin, F.S.; Mooney, H.A. Resource Limitation in Plants-An Economic Analogy. Annu. Rev. Ecol. Syst. 1985, 16, 363–392. [Google Scholar] [CrossRef]
  32. Landhäusser, S.M.; Lieffers, V.J. Photosynthesis and Carbon Allocation of Six Boreal Tree Species Grown in Understory and Open Conditions. Tree Physiol. 2001, 21, 243–250. [Google Scholar] [CrossRef] [Green Version]
  33. Niinemets, Ü. Photosynthesis and Resource Distribution through Plant Canopies. Plant Cell Environ. 2007, 30, 1052–1071. [Google Scholar] [CrossRef]
  34. Buckley, T.N.; John, G.P.; Scoffoni, C.; Sack, L. The Sites of Evaporation within Leaves. Plant Physiol 2017, 173, 1763–1782. [Google Scholar] [CrossRef] [Green Version]
  35. Claeys, H.; Inzé, D. The Agony of Choice: How Plants Balance Growth and Survival under Water-Limiting Conditions. Plant Physiol. 2013, 162, 1768–1779. [Google Scholar] [CrossRef] [Green Version]
  36. Valladares, F.; Gianoli, E.; Gómez, J.M. Ecological Limits to Plant Phenotypic Plasticity. New Phytol. 2007, 176, 749–763. [Google Scholar] [CrossRef] [PubMed]
  37. Hart, A.T.; Merlin, M.; Wiley, E.; Landhäusser, S.M. Splitting the Difference: Heterogeneous Soil Moisture Availability Affects Aboveground and Belowground Reserve and Mass Allocation in Trembling Aspen. Front. Plant Sci. 2021, 12, 654159. [Google Scholar] [CrossRef]
  38. Martínez-Vilalta, J.; Cochard, H.; Mencuccini, M.; Sterck, F.; Herrero, A.; Korhonen, J.F.J.; Llorens, P.; Nikinmaa, E.; Nolè, A.; Poyatos, R.; et al. Hydraulic Adjustment of Scots Pine across Europe. New Phytol. 2009, 184, 353–364. [Google Scholar] [CrossRef] [PubMed]
  39. Rood, S.B.; Patiño, S.; Coombs, K.; Tyree, M.T. Branch Sacrifice: Cavitation-Associated Drought Adaptation of Riparian Cottonwoods. Trees 2000, 14, 248–257. [Google Scholar] [CrossRef]
  40. Sterck, F.J.; Martínez-Vilalta, J.; Mencuccini, M.; Cochard, H.; Gerrits, P.; Zweifel, R.; Herrero, A.; Korhonen, J.F.J.; Llorens, P.; Nikinmaa, E.; et al. Understanding Trait Interactions and Their Impacts on Growth in Scots Pine Branches across Europe. Funct. Ecol. 2012, 26, 541–549. [Google Scholar] [CrossRef] [Green Version]
  41. Canham, C.D.; Kobe, R.K.; Latty, E.F.; Chazdon, R.L. Interspecific and Intraspecific Variation in Tree Seedling Survival: Effects of Allocation to Roots versus Carbohydrate Reserves. Oecologia 1999, 121, 1–11. [Google Scholar] [CrossRef] [PubMed]
  42. Galiano, L.; Martínez-Vilalta, J.; Eugenio, M.; Granzow-de la Cerda, Í.; Lloret, F. Seedling Emergence and Growth of Quercus Spp. Following Severe Drought Effects on a Pinus Sylvestris Canopy. J. Veg. Sci. 2013, 24, 580–588. [Google Scholar] [CrossRef]
  43. Suarez, M.L.; Kitzberger, T. Recruitment Patterns Following a Severe Drought: Long-Term Compositional Shifts in Patagonian Forests. Can. J. For. Res. 2008, 38, 3002–3010. [Google Scholar] [CrossRef]
  44. Chapin, F.S.; Schulze, E.; Mooney, H.A. The Ecology and Economics of Storage in Plants. Annu. Rev. Ecol. Syst. 1990, 21, 423–447. [Google Scholar] [CrossRef]
  45. Hartmann, H.; Adams, H.D.; Hammond, W.M.; Hoch, G.; Landhäusser, S.M.; Wiley, E.; Zaehle, S. Identifying Differences in Carbohydrate Dynamics of Seedlings and Mature Trees to Improve Carbon Allocation in Models for Trees and Forests. Environ. Exp. Bot. 2018, 152, 7–18. [Google Scholar] [CrossRef]
  46. Maguire, A.J.; Kobe, R.K. Drought and Shade Deplete Nonstructural Carbohydrate Reserves in Seedlings of Five Temperate Tree Species. Ecol. Evol. 2015, 5, 5711–5721. [Google Scholar] [CrossRef] [PubMed]
  47. Landhäusser, S.M.; Pinno, B.D.; Lieffers, V.J.; Chow, P.S. Partitioning of Carbon Allocation to Reserves or Growth Determines Future Performance of Aspen Seedlings. For. Ecol. Manag. 2012, 275, 43–51. [Google Scholar] [CrossRef]
  48. Landhäusser, S.M.; Rodriguez-Alvarez, J.; Marenholtz, E.H.; Lieffers, V.J. Effect of Stock Type Characteristics and Time of Planting on Field Performance of Aspen (Populus Tremuloides Michx.) Seedlings on Boreal Reclamation Sites. New For. 2012, 43, 679–693. [Google Scholar] [CrossRef]
  49. Signori-Müller, C.; Oliveira, R.S.; de Barros, F.V.; Tavares, J.V.; Gilpin, M.; Diniz, F.C.; Zevallos, M.J.M.; Yupayccana, C.A.S.; Acosta, M.; Bacca, J.; et al. Non-Structural Carbohydrates Mediate Seasonal Water Stress across Amazon Forests. Nat. Commun. 2021, 12, 2310. [Google Scholar] [CrossRef]
  50. Galvez, D.A.; Landhäusser, S.M.; Tyree, M.T. Root Carbon Reserve Dynamics in Aspen Seedlings: Does Simulated Drought Induce Reserve Limitation? Tree Physiol. 2011, 31, 250–257. [Google Scholar] [CrossRef]
  51. Galvez, D.A.; Landhäusser, S.M.; Tyree, M.T. Low Root Reserve Accumulation during Drought May Lead to Winter Mortality in Poplar Seedlings. New Phytol. 2013, 198, 139–148. [Google Scholar] [CrossRef]
  52. Rennenberg, H.; Loreto, F.; Polle, A.; Brilli, F.; Fares, S.; Beniwal, R.S.; Gessler, A. Physiological Responses of Forest Trees to Heat and Drought. Plant Biol. 2006, 8, 556–571. [Google Scholar] [CrossRef]
  53. Kobe, R.K.; Iyer, M.; Walters, M.B. Optimal Partitioning Theory Revisited: Nonstructural Carbohydrates Dominate Root Mass Responses to Nitrogen. Ecology 2010, 91, 166–179. [Google Scholar] [CrossRef]
  54. Barbaroux, C.; Breda, N. Contrasting Distribution and Seasonal Dynamics of Carbohydrate Reserves in Stem Wood of Adult Ring-Porous Sessile Oak and Diffuse-Porous Beech Trees. Tree Physiol. 2002, 22, 1201–1210. [Google Scholar] [CrossRef] [PubMed]
  55. Hoch, G.; Richter, A.; Körner, C. Non-Structural Carbon Compounds in Temperate Forest Trees. Plant Cell Environ. 2003, 26, 1067–1081. [Google Scholar] [CrossRef]
  56. Uscola, M.; Villar-Salvador, P.; Gross, P.; Maillard, P. Fast Growth Involves High Dependence on Stored Resources in Seedlings of Mediterranean Evergreen Trees. Ann. Bot. 2015, 115, 1001–1013. [Google Scholar] [CrossRef] [Green Version]
  57. Kelly, J.W.G.; Landhäusser, S.M.; Chow, P.S. The Impact of Light Quality and Quantity on Root-to-Shoot Ratio and Root Carbon Reserves in Aspen Seedling Stock. New For. 2015, 46, 527–545. [Google Scholar] [CrossRef]
  58. Le, K.D.; Schreiber, S.G.; Landhäusser, S.M.; Schoonmaker, A.L. Manipulating Aspen (Populus Tremuloides) Seedling Size Characteristics to Improve Initial Establishment and Growth on Competitive Sites. Scand. J. For. Res. 2020, 35, 29–45. [Google Scholar] [CrossRef]
  59. Chow, P.S.; Landhäusser, S.M. A Method for Routine Measurements of Total Sugar and Starch Content in Woody Plant Tissues. Tree Physiol. 2004, 24, 1129–1136. [Google Scholar] [CrossRef]
  60. Landhäusser, S.M.; Chow, P.S.; Dickman, L.T.; Furze, M.E.; Kuhlman, I.; Schmid, S.; Wiesenbauer, J.; Wild, B.; Gleixner, G.; Hartmann, H.; et al. Standardized Protocols and Procedures Can Precisely and Accurately Quantify Non-Structural Carbohydrates. Tree Physiol. 2018, 38, 1764–1778. [Google Scholar] [CrossRef]
  61. De’ath, G. Multivariate Regression Trees: A New Technique for Modeling Species–Environment Relationships. Ecology 2002, 83, 1105–1117. [Google Scholar] [CrossRef]
  62. R Development Core Team. R: A Language and Environment for Statistical Computing; R Foundation for Statistical Computing: Vienna, Austria, 2017. [Google Scholar]
  63. van Genuchten, M.T. A Closed-Form Equation for Predicting the Hydraulic Conductivity of Unsaturated Soils. Soil Sci. Soc. Am. J. 1980, 44, 892–898. [Google Scholar] [CrossRef] [Green Version]
  64. Cai, J.; Tyree, M.T. The Impact of Vessel Size on Vulnerability Curves: Data and Models for within-Species Variability in Saplings of Aspen, Populus Tremuloides Michx. Plant Cell Env. 2010, 33, 1059–1069. [Google Scholar] [CrossRef]
  65. Schoonmaker, A.L.; Hacke, U.G.; Landhäusser, S.M.; Lieffers, V.J.; Tyree, M.T. Hydraulic Acclimation to Shading in Boreal Conifers of Varying Shade Tolerance. Plant Cell Env. 2010, 33, 382–393. [Google Scholar] [CrossRef] [PubMed]
  66. Wiley, E.; King, C.M.; Landhäusser, S.M. Identifying the Relevant Carbohydrate Storage Pools Available for Remobilization in Aspen Roots. Tree Physiol. 2019, 39, 1109–1120. [Google Scholar] [CrossRef] [PubMed]
  67. Wyka, T.P.; Karolewski, P.; Żytkowiak, R.; Chmielarz, P.; Oleksyn, J. Whole-Plant Allocation to Storage and Defense in Juveniles of Related Evergreen and Deciduous Shrub Species. Tree Physiol. 2016, 36, 536–547. [Google Scholar] [CrossRef] [PubMed] [Green Version]
  68. Schott, K.M.; Pinno, B.D.; Landhäusser, S.M. Premature Shoot Growth Termination Allows Nutrient Loading of Seedlings with an Indeterminate Growth Strategy. New For. 2013, 44, 635–647. [Google Scholar] [CrossRef]
  69. Jordan, M.-O.; Habib, R. Mobilizable Carbon Reserves in Young Peach Trees as Evidenced by Trunk Girdling Experiments. J. Exp. Bot. 1996, 47, 79–87. [Google Scholar] [CrossRef] [Green Version]
  70. Oberhuber, W.; Gruber, A.; Lethaus, G.; Winkler, A.; Wieser, G. Stem Girdling Indicates Prioritized Carbon Allocation to the Root System at the Expense of Radial Stem Growth in Norway Spruce under Drought Conditions. Environ. Exp. Bot. 2017, 138, 109–118. [Google Scholar] [CrossRef]
  71. Tuttle, C.L.; South, D.B.; Golden, M.S.; Meldahl, R.S. Relationship between Initial Seedling Height and Survival and Growth of Loblolly Pine Seedlings Planted during a Droughty Year. South. J. Appl. For. 1987, 11, 139–143. [Google Scholar] [CrossRef]
  72. Villar-Salvador, P.; Puértolas, J.; Cuesta, B.; Peñuelas, J.L.; Uscola, M.; Heredia-Guerrero, N.; Rey Benayas, J.M. Increase in Size and Nitrogen Concentration Enhances Seedling Survival in Mediterranean Plantations. Insights from an Ecophysiological Conceptual Model of Plant Survival. New For. 2012, 43, 755–770. [Google Scholar] [CrossRef]
  73. Navarro, R.M.; Retamosa, M.J.; Lopez, J.; del Campo, A.; Ceaceros, C.; Salmoral, L. Nursery Practices and Field Performance for the Endangered Mediterranean Species Abies Pinsapo Boiss. Ecol. Eng. 2006, 27, 93–99. [Google Scholar] [CrossRef]
  74. Myers, J.A.; Kitajima, K. Carbohydrate Storage Enhances Seedling Shade and Stress Tolerance in a Neotropical Forest. J. Ecol. 2007, 95, 383–395. [Google Scholar] [CrossRef]
  75. Wiley, E.; Hoch, G.; Landhäusser, S.M. Dying Piece by Piece: Carbohydrate Dynamics in Aspen (Populus Tremuloides) Seedlings under Severe Carbon Stress. J. Exp. Bot. 2017, 68, 5221–5232. [Google Scholar] [CrossRef] [PubMed] [Green Version]
  76. Tuttle, C.L.; South, D.B.; Golden, M.S.; Meldahl, R.S. Initial Pinustaeda Seedling Height Relationships with Early Survival and Growth. Can. J. For. Res. 1988, 18, 867–871. [Google Scholar] [CrossRef]
  77. Tan, W.; Hogan, G.D. Physiological and Morphological Responses to Nitrogen Limitation in Jack Pine Seedlings: Potential Implications for Drought Tolerance. New For. 1997, 14, 19–31. [Google Scholar] [CrossRef]
  78. Trubat, R.; Cortina, J.; Vilagrosa, A. Nutrient Deprivation Improves Field Performance of Woody Seedlings in a Degraded Semi-Arid Shrubland. Ecol. Eng. 2011, 37, 1164–1173. [Google Scholar] [CrossRef]
  79. Furze, M.E.; Huggett, B.A.; Aubrecht, D.M.; Stolz, C.D.; Carbone, M.S.; Richardson, A.D. Whole-Tree Nonstructural Carbohydrate Storage and Seasonal Dynamics in Five Temperate Species. New Phytol. 2019, 221, 1466–1477. [Google Scholar] [CrossRef]
  80. Schoonmaker, A.L.; Hillabrand, R.M.; Lieffers, V.J.; Chow, P.S.; Landhäusser, S.M. Seasonal Dynamics of Non-Structural Carbon Pools and Their Relationship to Growth in Two Boreal Conifer Tree Species. Tree Physiol. 2021, 41, 1563–1582. [Google Scholar] [CrossRef]
  81. Pinto, J.R.; Marshall, J.D.; Dumroese, R.K.; Davis, A.S.; Cobos, D.R. Photosynthetic Response, Carbon Isotopic Composition, Survival, and Growth of Three Stock Types under Water Stress Enhanced by Vegetative Competition. Can. J. For. Res. 2012, 42, 333–344. [Google Scholar] [CrossRef]
  82. Hillabrand, R.M.; Gordon, H.; Hynes, B.; Constabel, C.P.; Landhäusser, S.M. Populus Root Salicinoid Phenolic Glycosides Are Not Mobilized to Support Metabolism and Regrowth under Carbon Limited Conditions. Tree Physiol. 2023, tpad020. [Google Scholar] [CrossRef] [PubMed]
  83. Najar, A.; Landhäusser, S.M.; Whitehill, J.G.A.; Bonello, P.; Erbilgin, N. Reserves Accumulated in Non-Photosynthetic Organs during the Previous Growing Season Drive Plant Defenses and Growth in Aspen in the Subsequent Growing Season. J. Chem. Ecol. 2014, 40, 21–30. [Google Scholar] [CrossRef]
  84. Wiley, E.; Rogers, B.J.; Hodgkinson, R.; Landhäusser, S.M. Nonstructural Carbohydrate Dynamics of Lodgepole Pine Dying from Mountain Pine Beetle Attack. New Phytol. 2016, 209, 550–562. [Google Scholar] [CrossRef] [Green Version]
  85. Bréda, N.; Huc, R.; Granier, A.; Dreyer, E. Temperate Forest Trees and Stands under Severe Drought: A Review of Ecophysiological Responses, Adaptation Processes and Long-Term Consequences. Ann. For. Sci. 2006, 63, 625–644. [Google Scholar] [CrossRef] [Green Version]
  86. Hartmann, H.; Ziegler, W.; Trumbore, S. Lethal Drought Leads to Reduction in Nonstructural Carbohydrates in Norway Spruce Tree Roots but Not in the Canopy. Funct. Ecol. 2013, 27, 413–427. [Google Scholar] [CrossRef]
  87. Sala, A.; Piper, F.; Hoch, G. Physiological Mechanisms of Drought-Induced Tree Mortality Are Far from Being Resolved: Letters. New Phytol. 2010, 186, 274–281. [Google Scholar] [CrossRef] [PubMed]
  88. Sevanto, S.; Mcdowell, N.G.; Dickman, L.T.; Pangle, R.; Pockman, W.T. How Do Trees Die? A Test of the Hydraulic Failure and Carbon Starvation Hypotheses. Plant Cell Env. 2014, 37, 153–161. [Google Scholar] [CrossRef]
  89. Brodribb, T.J.; Holbrook, N.M.; Hill, R.S.; Brodribb, T.J.; Holbrook, N.M.; Hill, R.S. Seedling Growth in Conifers and Angiosperms: Impacts of Contrasting Xylem Structure. Aust. J. Bot. 2005, 53, 749–755. [Google Scholar] [CrossRef] [Green Version]
  90. Carnicer, J.; Barbeta, A.; Sperlich, D.; Coll, M.; Penuelas, J. Contrasting Trait Syndromes in Angiosperms and Conifers Are Associated with Different Responses of Tree Growth to Temperature on a Large Scale. Front. Plant Sci. 2013, 4, 409. [Google Scholar] [CrossRef] [Green Version]
  91. Givnish, T.J. Adaptive Significance of Evergreen vs. Deciduous Leaves: Solving the Triple Paradox. Silva Fenn. 2002, 36, 703–743. [Google Scholar] [CrossRef]
Figure 1. Average (±SE) changes in structural biomass (i.e., growth (∆Biomass)) at the whole seedling and organ level for three aspen (LEFT column) and three pine (RIGHT column) seedling types under well-watered (control) and dry (drought) conditions. Species and organs were analyzed separately. An * and/or different letters on legend labels indicate significant differences among means of main effects (drought, seedling type), while different letters above bars indicate significant differences among all treatment combination means (Table 1; Tukey’s HSD, p ≤ 0.10).
Forests 14 00796 g001
Figure 2. Average (±SE) changes in NSCconcentration (∆NSCconcentration) at the organ and whole seedling level for aspen (LEFT column) and pine (RIGHT column) seedling types under drought and control conditions. Species and organs were analyzed separately. An * and/or different letters on legend labels indicate significant differences among means of main effects (drought, seedling type), while different letters above bars indicate significant differences among all treatment combination means (Table 1; Tukey’s HSD, p ≤ 0.10).
Forests 14 00796 g002
Figure 3. Average (SE) partitioning of new structural biomass (i.e., growth) to leaves, stems and roots in three aspen (LEFT column) and three pine (RIGHT column) seedling types under well-watered (control) and dry (drought) conditions. Species and organs were analyzed separately. Different letters on legend labels indicate significant differences among means of main effects (seedling type), while different letters above bars indicate significant differences among all treatment combination means for aspen (Table 2) and differences in seedling types in the control and drought separately for pine (Table 3) (Tukey’s HSD, p ≤ 0.10).
Forests 14 00796 g003
Figure 4. Allometric relationships between root and stem (excl. leaves) BiomassTotal (aspen, LEFT column) and root and shoot (incl. needles) BiomassTotal (pine, RIGHT column) for three different seedling types at the initial harvest, after well-watered (control) and dry (drought) conditions. Relationships between root and stem biomass in aspen are shown, as seedlings at the initial harvest were leafless. Lines represent individual linear regressions for each treatment and seedling type combination. Significant treatment or covariate × treatment effects indicate differences in biomass allocation between drought, control and initial seedlings. Different letters represent significant differences in intercepts according to Tukey’s HSD (p < 0.10). For Large pine, there was a significant covariate × treatment interaction; different numbers therefore represent significant differences in slope according to 95% confidence intervals.
Forests 14 00796 g004
Table 1. Summary of analysis of variance for change in structural biomass (i.e., structural growth (∆Biomass) and change in NSC concentrations (∆NSCconcentration) of aspen and pine seedlings by seedling type and drought. Significant effects (p ≤ 0.10) are indicated in bold, n = 10 per seedling type/drought treatment combination, except where noted.
SpeciesOrganResponse VariableSeedling TypeDroughtSeedling Type × DroughtError
DF21254 or 53
AspenSeedling∆Biomass *0.0379<0.00010.21
∆NSCconcentration<0.00010.00180.36
Leaves∆ Biomass *<0.0001<0.00010.0007
∆NSCconcentration0.340.280.37
Stem∆ Biomass *0.0006<0.0001<0.0001
∆NSCconcentration *<0.00010.170.27
Roots∆Biomass *0.61<0.00010.92
∆NSCconcentration<0.00010.00170.40
PineSeedling∆Biomass **<0.0001<0.00010.0174
∆NSCconcentration0.0423<0.00010.72
Needles∆Biomass **<0.0001<0.00010.0271
∆NSCconcentration *<0.0001<0.00010.20
Stem∆Biomass *<0.0001<0.00010.0027
∆NSCconcentration<0.00010.00320.41
Roots∆Biomass **<0.0001<0.00010.0135
∆NSCconcentration0.0001<0.00010.59
* Indicates that data were ln transformed. ** Indicates data were square-root transformed. † One Medium pine outlier from control treatment removed from analysis.
Table 2. Two-way ANOVA summary for effects of seedling type and drought on relative allocation of new structural biomass (%) for aspen. Significant effects (p ≤ 0.10) are indicated in bold.
SpeciesOrganSeedling TypeDroughtSeedling Type × DroughtError
DF212
AspenLeaves *0.00080.1020.12253
Stem **0.01160.0001<0.000152
Roots *0.00020.00070.000353
* one outlier from HighRSR, drought treatment removed. ** one outlier from Tall, drought treatment and one from High NSC, drought removed.
Table 3. ANOVA summaries for effects of seedling type on relative allocation of new structural biomass (%) for pine. Due to unequal variance between drought and control treatments, the effect of seedling type was tested using oneway ANOVAs for control and drought treatments separately. The main effect of drought was tested using Welch’s t-test across all seedling types. Significant effects (p ≤ 0.10) are indicated in bold.
SpeciesOrganSeedling Type (for Control)nSeedling Type (for Drought)nMain Drought Effectn
DF2 2 1
PineNeedles0.0016100.129,6,80.5630,23
Stem0.0075100.208,5,80.4630,21
Roots0.19100.063310,6,70.094030,23
Disclaimer/Publisher’s Note: The statements, opinions and data contained in all publications are solely those of the individual author(s) and contributor(s) and not of MDPI and/or the editor(s). MDPI and/or the editor(s) disclaim responsibility for any injury to people or property resulting from any ideas, methods, instructions or products referred to in the content.